本讲义涵盖主题 9,统计学(Statistics)。标记 (Extended) 的部分只在拓展卷上考查;其他一切对两个层次都适用。
统计
IGCSE 数学 · 第 9 主题
 8:09
8:09
Statistics
Every day the world collects numbers about you: how far you travel, how long you sleep, what you score in a test. A long list of numbers tells you almost…
英文讲解 · 内嵌中英文字幕
9.1 9.2
统计数据的分类

大纲
| Subject content | Notes and examples |
|---|---|
| Classify and tabulate statistical data. | e.g. tally tables, two-way tables. |
| Subject content | Notes and examples |
|---|---|
| 1 Read, interpret and draw inferences from tables and statistical diagrams. | |
| 2 Compare sets of data using tables, graphs and statistical measures. | e.g. compare averages and ranges between two data sets. |
| 3 Appreciate restrictions on drawing conclusions from given data. |
| Subject content | Notes and examples |
|---|---|
| 1 Read, interpret and draw inferences from tables and statistical diagrams. | |
| 2 Compare sets of data using tables, graphs and statistical measures. | e.g. compare averages and measures of spread between two data sets. |
| 3 Appreciate restrictions on drawing conclusions from given data. |
来源:剑桥国际大纲
要组织统计(statistical)数据(data),用:
- 一张计数表(tally table)——为每个值做一个记号,然后数。
- 一张双向表(two-way table)——一次按两个特征把数据分类(例如,男孩/女孩对步行/公交)。
当你读一个图时,只得出数据真正支持的结论。
探索
Data handling cycle
Follow a statistical question from collection to display.
词汇表
训练
| 英文 | 中文 | 拼音 |
|---|---|---|
| statistical/stəˈtɪstɪkl/ | 统计 | tǒng jì |
| data/ˈdeɪtə/ | 数据 | shù jù |
| tally table/ˈtælɪ ˈteɪbl/ | 计数表 | jì shù biǎo |
| two-way table/tuː weɪ ˈteɪbl/ | 双向表 | shuāng xiàng biǎo |
9.3
平均数与极差

大纲
| Subject content | Notes and examples |
|---|---|
| Calculate the mean, median, mode and range for individual data and distinguish between the purposes for which these are used. | Data may be in a list or frequency table, but will not be grouped. |
| Subject content | Notes and examples |
|---|---|
| 1 Calculate the mean, median, mode, quartiles, range and interquartile range for individual data and distinguish between the purposes for which these are used. | |
| 2 Calculate an estimate of the mean for grouped discrete or grouped continuous data. | |
| 3 Identify the modal class from a grouped frequency distribution. |
来源:剑桥国际大纲
三个平均描述数据的一个典型值,而极差显示它有多分散。每一个用于一个不同的目的:
- 平均数(mean)$= \dfrac{\text{sum of all values}}{\text{how many values}}$。
- 中位数(median)$=$ 数据按顺序排列时中间的值。
- 众数(mode)$=$ 出现最频繁的值。
- 极差(range)$=$ 最大值 $-$ 最小值(它显示数据有多分散)。
Worked example. 求 $4, 7, 7, 2, 5$ 的平均数、中位数、众数和极差。
把数据排序:$2, 4, 5, 7, 7$。
$$\text{mean} = \frac{4 + 7 + 7 + 2 + 5}{5} = \frac{25}{5} = 5, \quad \text{median} = 5, \quad \text{mode} = 7, \quad \text{range} = 7 - 2 = 5.$$
探索
Average choice lab
Choose the average that fits the data situation.
词汇表
训练
| 英文 | 中文 | 拼音 |
|---|---|---|
| mean/miːn/ | 平均数 | píng jūn shù |
| median/ˈmiːdiːən/ | 中位数 | zhōng wèi shù |
| mode/məʊd/ | 众数 | zhòng shù |
| range/reɪndʒ/ | 极差 | jí chà |
9.3
平均数与极差
大纲
| Subject content | Notes and examples |
|---|---|
| Calculate the mean, median, mode and range for individual data and distinguish between the purposes for which these are used. | Data may be in a list or frequency table, but will not be grouped. |
| Subject content | Notes and examples |
|---|---|
| 1 Calculate the mean, median, mode, quartiles, range and interquartile range for individual data and distinguish between the purposes for which these are used. | |
| 2 Calculate an estimate of the mean for grouped discrete or grouped continuous data. | |
| 3 Identify the modal class from a grouped frequency distribution. |
来源:剑桥国际大纲
当数据带它的频数(frequency)(每个值出现多少次)列出时,平均数是
$$\text{mean} = \frac{\sum (\text{value} \times \text{frequency})}{\sum \text{frequency}}.$$
Worked example. 值 $1, 2, 3$ 以频数 $4, 5, 1$ 出现。求平均数。
$$\text{mean} = \frac{1(4) + 2(5) + 3(1)}{4 + 5 + 1} = \frac{17}{10} = 1.7.$$
Grouped data (Extended)
对于分组数据(grouped data),你不能求出精确的平均数,所以用每组的中点作为值来估计它。众数组(modal class)就是频数最高的组。
词汇表
训练
| 英文 | 中文 | 拼音 |
|---|---|---|
| frequency/ˈfriːkwənsi/ | 频数 | pín shuò |
| grouped data/ɡruːpt ˈdeɪtə/ | 分组数据 | fēn zǔ shù jù |
| modal class/ˈməʊdl klæs/ | 众数组 | zhòng shù zǔ |
9.3
平均数与离散程度的度量
大纲
| Subject content | Notes and examples |
|---|---|
| 1 Calculate the mean, median, mode, quartiles, range and interquartile range for individual data and distinguish between the purposes for which these are used. | |
| 2 Calculate an estimate of the mean for grouped discrete or grouped continuous data. | |
| 3 Identify the modal class from a grouped frequency distribution. |
来源:剑桥国际大纲
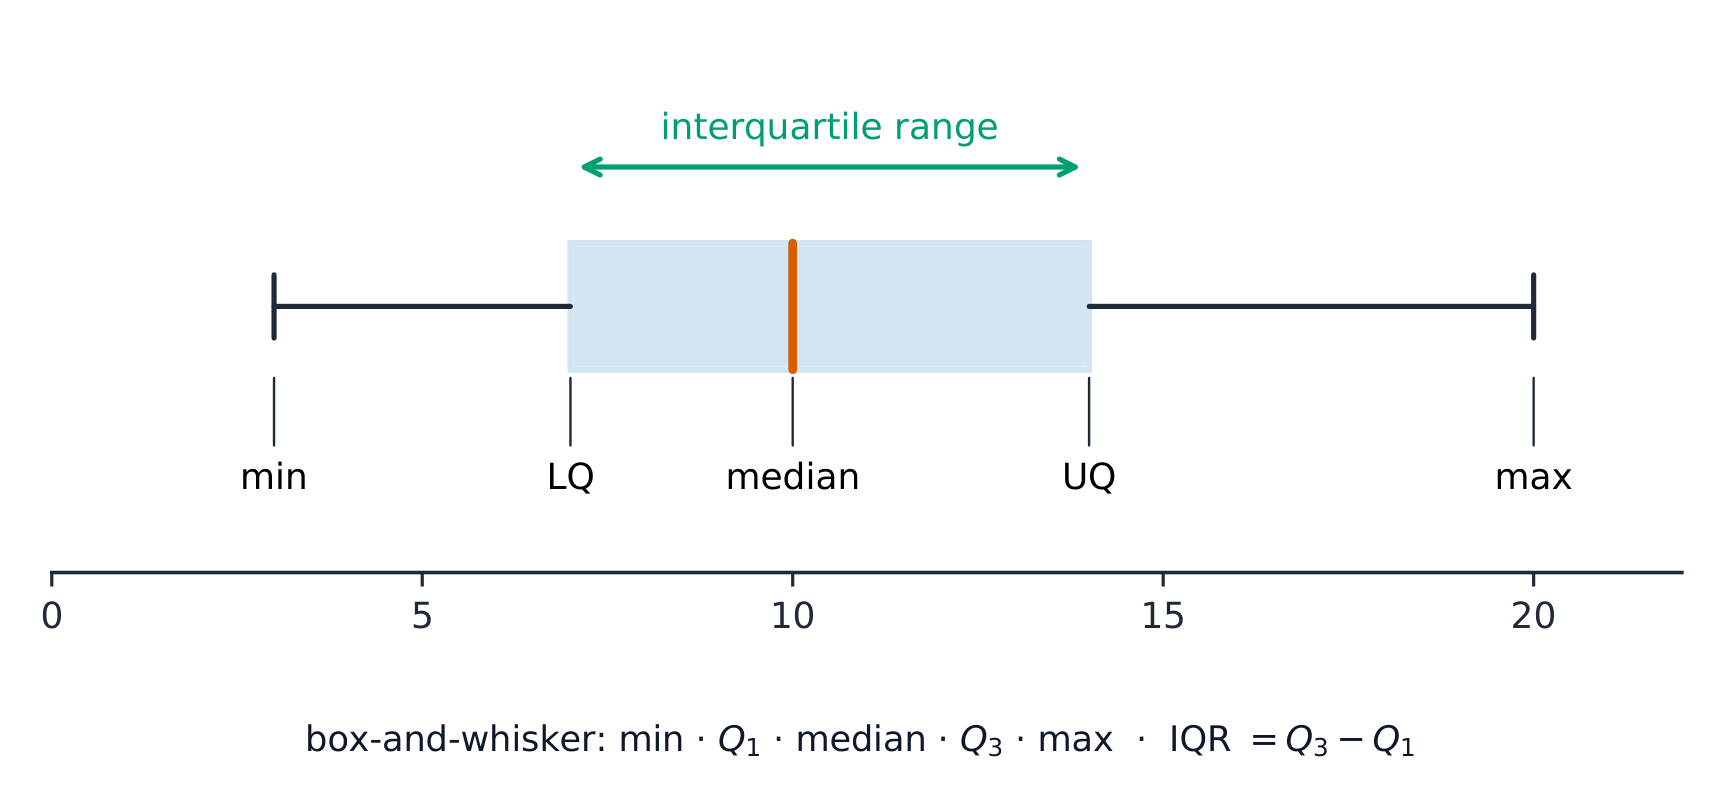
当数据按顺序排列时,四分位数(quartiles)把它切成四个相等的部分。下四分位数(LQ)在四分之一处;上四分位数(UQ)在四分之三处。四分位距(interquartile range)衡量中间一半的分散:
$$\text{interquartile range} = \text{UQ} - \text{LQ}.$$
四分位距有用,因为与极差不同,它忽略极端值。
探索
Box-and-whisker plot
Build a box plot from the five-number summary: the box is the middle 50% (the interquartile range) and the median's position shows the skew.
词汇表
训练
| 英文 | 中文 | 拼音 |
|---|---|---|
| quartile/ˈkwɔːtaɪl/ | 四分位数 | sì fēn wèi shù |
| interquartile range/ˌɪntəˈkwɔːtaɪl reɪndʒ/ | 四分位距 | sì fēn wèi jù |
9.4
统计图表

大纲
| Subject content | Notes and examples |
|---|---|
| Draw and interpret: (a) bar charts (b) pie charts (c) pictograms (d) stem-and-leaf diagrams (e) simple frequency distributions. | Includes composite (stacked) and dual (side-by-side) bar charts. Stem-and-leaf diagrams should have ordered data with a key. |
来源:剑桥国际大纲


| 图 | 它显示什么 |
|---|---|
| 条形图(bar chart) | 每个类别一根条;高度是频数 |
| 饼图(pie chart) | 一个圆被分成片,每片是 $360^{\circ}$ 的一个分数 |
| 象形图(pictogram) | 用一个符号代表若干物品 |
| 茎叶图(stem-and-leaf diagram) | 保留有序数据的数字,带一个图例 |
| 频数分布(frequency distribution) | 一张值和它们频数的表 |
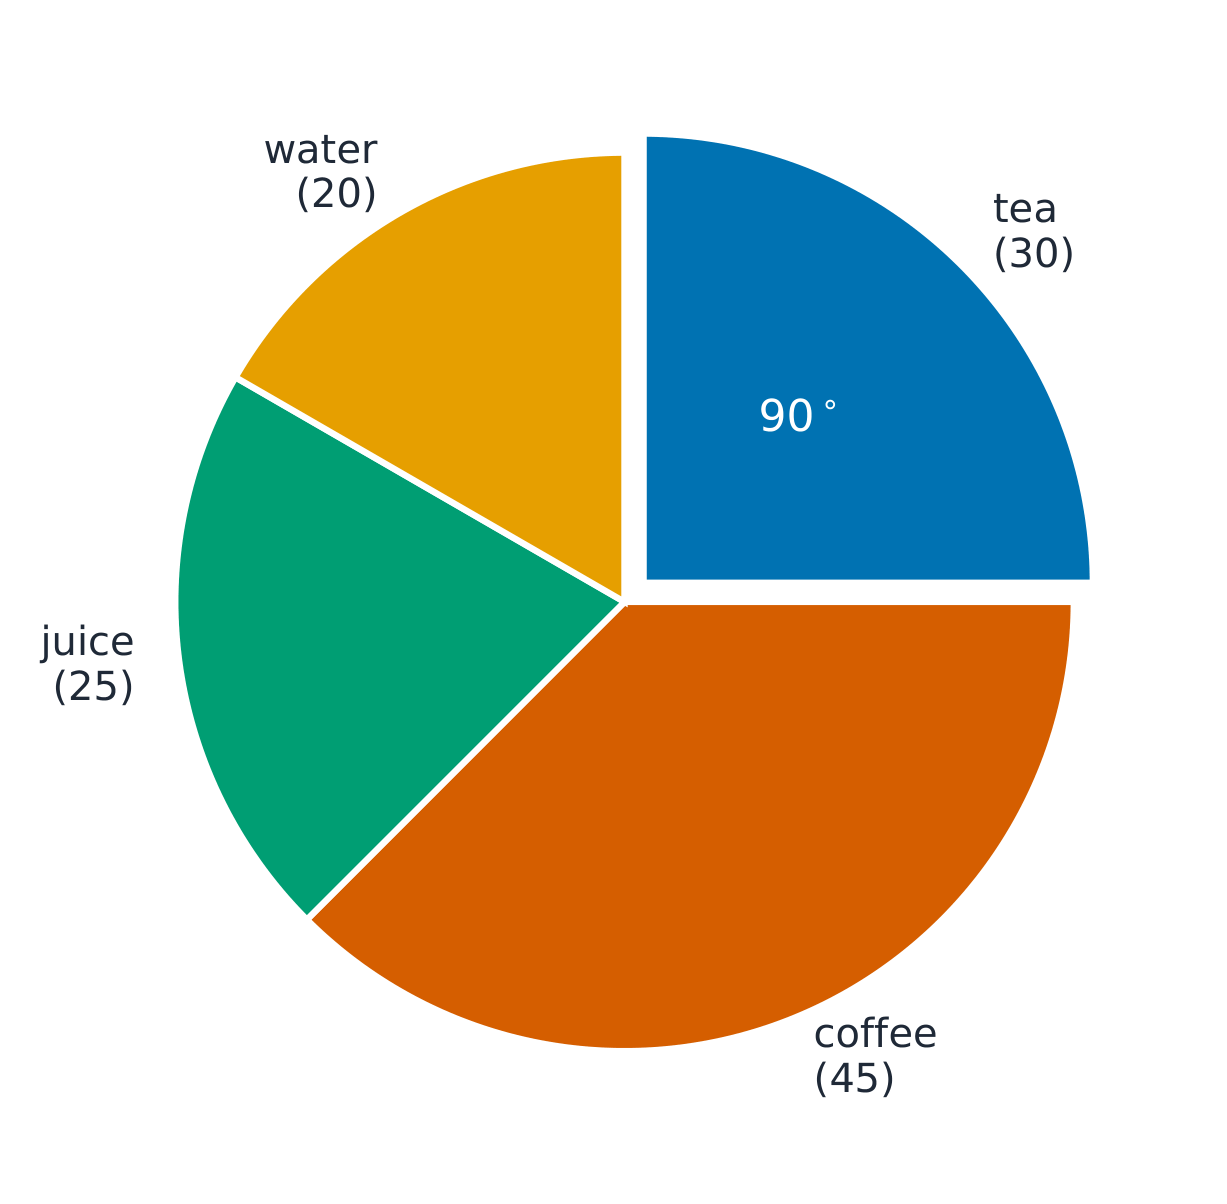
Worked example (pie chart). $120$ 人中,$30$ 人选择茶。求茶片的角度。
$$\frac{30}{120} \times 360^{\circ} = 90^{\circ}.$$
探索
Pie-chart angles
Each slice's angle is its share of the whole turned into degrees — frequency ÷ total × 360 — and the slices always add to 360°.
探索
Chart choice lab
Choose the chart that fits the kind of data.
词汇表
训练
| 英文 | 中文 | 拼音 |
|---|---|---|
| bar chart/bɑː tʃɑːt/ | 条形图 | tiáo xíng tú |
| pie chart/paɪ tʃɑːt/ | 饼图 | bǐng tú |
| pictogram/ˈpɪktəɡræm/ | 象形图 | xiàng xíng tú |
| stem-and-leaf diagram/stem ænd liːf ˈdaɪəɡræm/ | 茎叶图 | jīng yè tú |
| frequency distribution/ˈfriːkwənsi ˌdɪstrɪˈbjuːʃn/ | 频数分布 | pín shuò fēn bù |
9.5
散点图

大纲
| Subject content | Notes and examples |
|---|---|
| 1 Draw and interpret scatter diagrams. | Plotted points should be clearly marked, for example as small crosses (×). |
| 2 Understand what is meant by positive, negative and zero correlation. | |
| 3 Draw by eye, interpret and use a straight line of best fit. | A line of best fit: • should be a single ruled line drawn by inspection • should extend across the full data set • does not need to coincide exactly with any of the points but there should be a roughly even distribution of points either side of the line over its entire length. |
| Subject content | Notes and examples |
|---|---|
| 1 Draw and interpret scatter diagrams. | Plotted points should be clearly marked, for example as small crosses (x). |
| 2 Understand what is meant by positive, negative and zero correlation. | |
| 3 Draw by eye, interpret and use a straight line of best fit. | A line of best fit: • should be a single ruled line drawn by inspection • should extend across the full data set • does not need to coincide exactly with any of the points but there should be a roughly even distribution of points either side of the line over its entire length. |
来源:剑桥国际大纲
一个散点图(scatter diagram)把成对的值描成点以显示两样东西是否有联系。这个联系是相关性(correlation):
- 正相关(positive correlation)——一个上升时,另一个上升。
- 负相关(negative correlation)——一个上升时,另一个下降。
- 零相关(zero correlation)——没有清晰的联系。
若有相关性,画一条最佳拟合线(line of best fit):穿过点的中间的一条直的画线,每一侧大约相同数量的点。用它来预测值。

探索
Scatter and correlation
Change the strength of the relationship and add a line of best fit to spot the trend.
词汇表
训练
| 英文 | 中文 | 拼音 |
|---|---|---|
| scatter diagram/ˈskætə ˈdaɪəɡræm/ | 散点图 | sàn diǎn tú |
| correlation/ˌkɒrɪˈleɪʃn/ | 相关性 | xiāng guān xìng |
| positive correlation/ˈpɒzɪtɪv ˌkɒrɪˈleɪʃn/ | 正相关 | zhèng xiāng guān |
| negative correlation/ˈneɡətɪv ˌkɒrɪˈleɪʃn/ | 负相关 | fù xiāng guān |
| zero correlation/ˈzɪərəʊ ˌkɒrɪˈleɪʃn/ | 零相关 | líng xiāng guān |
| line of best fit/laɪn ɒv best fɪt/ | 最佳拟合线 | zuì jiā nǐ hé xiàn |
9.6
累积频数图
大纲
| Subject content | Notes and examples |
|---|---|
| 1 Draw and interpret cumulative frequency tables and diagrams. | Plotted points on a cumulative frequency diagram should be clearly marked, for example as small crosses (x), and be joined with a smooth curve. |
| 2 Estimate and interpret the median, percentiles, quartiles and interquartile range from cumulative frequency diagrams. |
来源:剑桥国际大纲
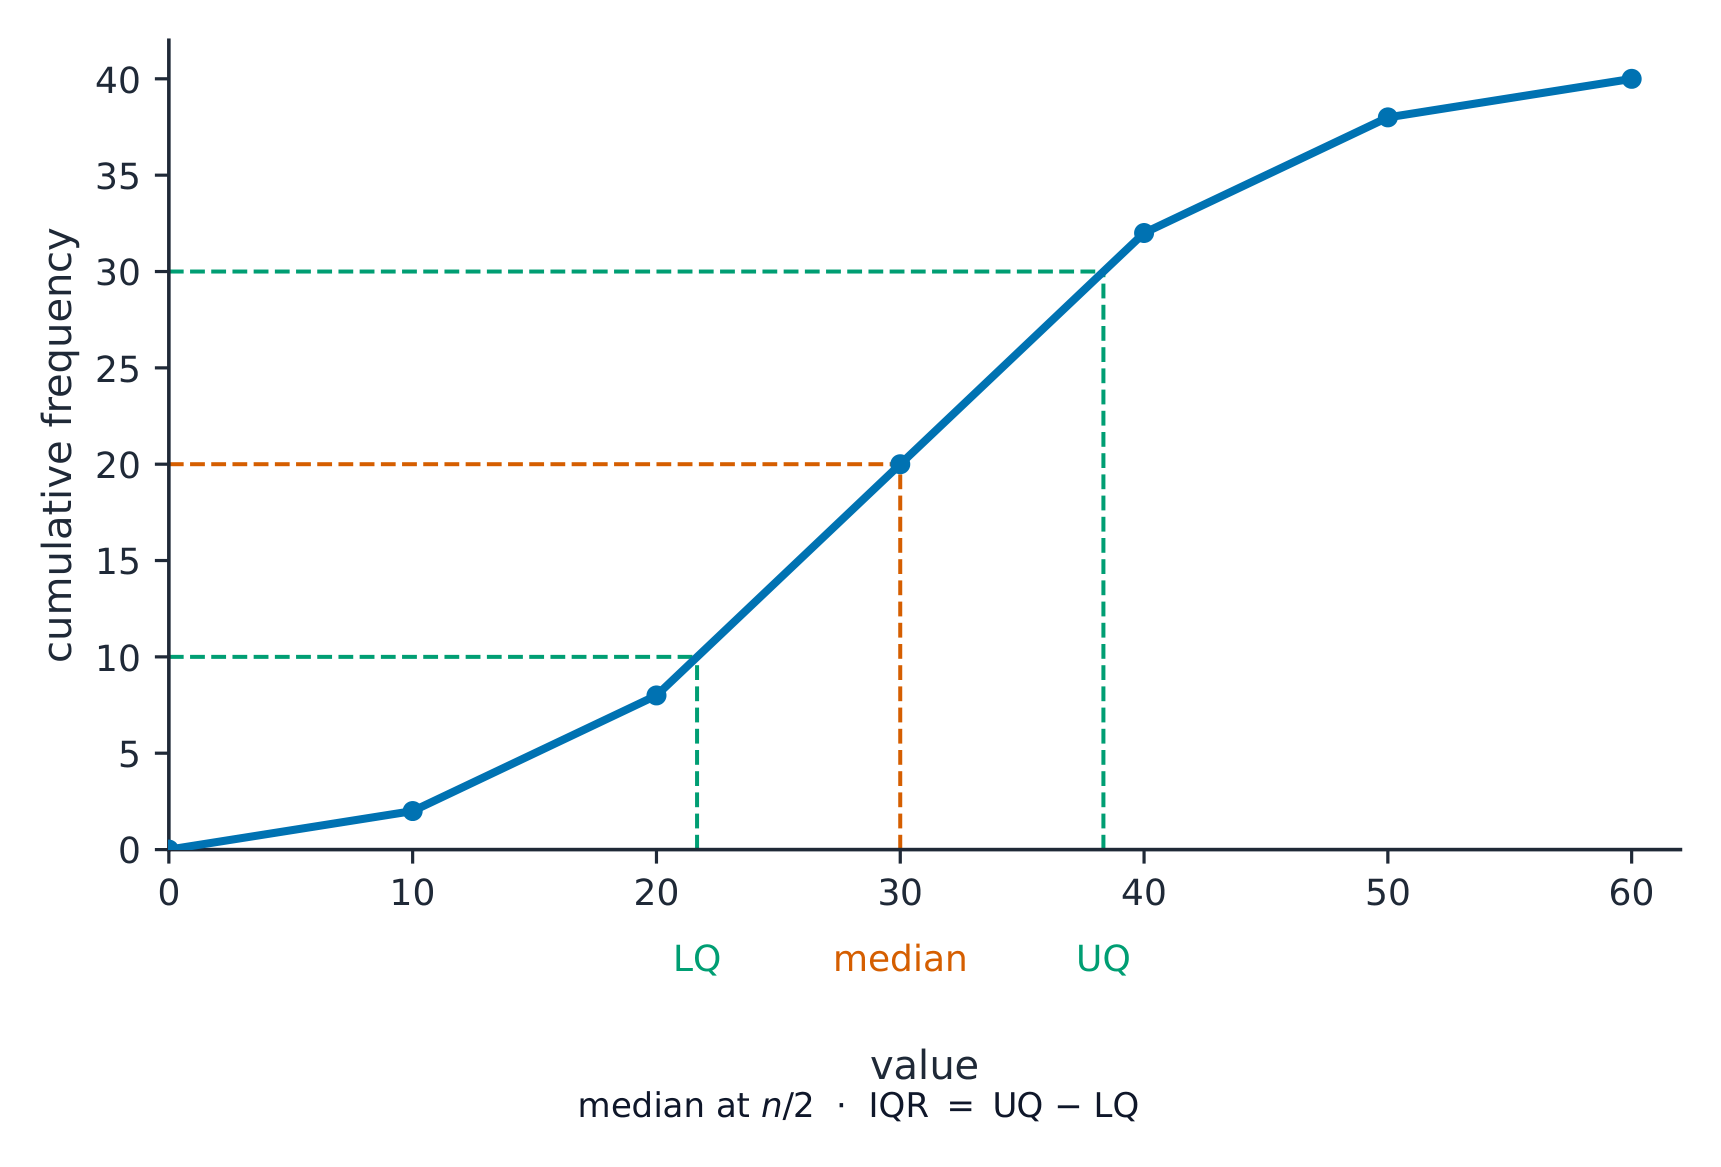
累积频数(cumulative frequency)是频数的一个连续总计。把它相对于每组的上端描出并用一条光滑曲线连接这些点。
从曲线你能读出中位数(在总数的一半处)、四分位数(在四分之一和四分之三处),以及任何百分位数(percentile)(例如,第 $90$ 百分位数在总数的 $90\%$ 处)。
探索
Cumulative frequency route
Follow raw data into a cumulative frequency curve and percentile reading.
词汇表
训练
| 英文 | 中文 | 拼音 |
|---|---|---|
| cumulative frequency/ˈkjuːmjʊlətɪv ˈfriːkwənsi/ | 累积频数 | lěi jī pín shuò |
| percentile/pəˈsentaɪl/ | 百分位数 | bǎi fēn wèi shù |
9.7
直方图
大纲
| Subject content | Notes and examples |
|---|---|
| 1 Draw and interpret histograms. | On histograms, the vertical axis is labelled 'Frequency density'. |
| 2 Calculate with frequency density. | Frequency density is defined as $\text{frequency density} = \text{frequency} \div \text{class width}$. |
来源:剑桥国际大纲
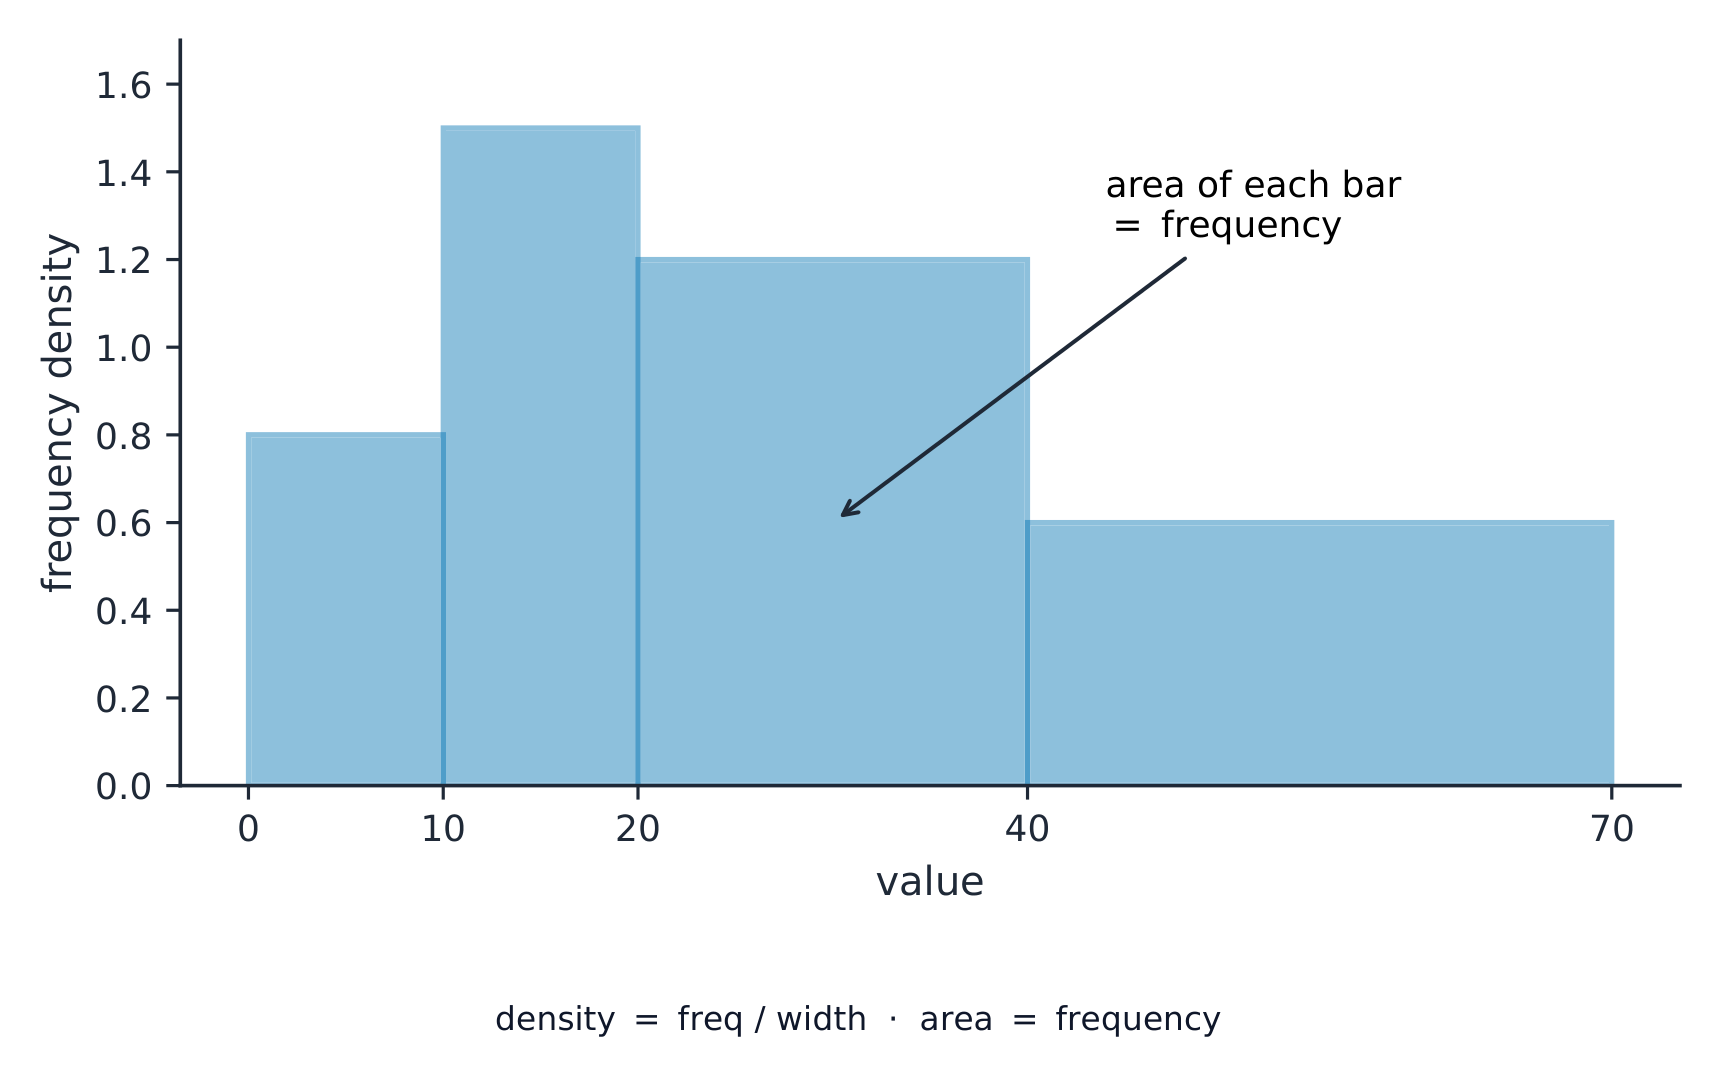
一个直方图(histogram)看起来像一个条形图,但这些条能有不同的宽度,而每根条的面积(不是它的高度)显示频数。竖轴是频数密度(frequency density):
$$\text{frequency density} = \frac{\text{frequency}}{\text{class width}}.$$
Worked example. 一个组有组距(class width)$10$ 和频数 $25$。求频数密度。
$$\text{frequency density} = \frac{25}{10} = 2.5.$$
探索
Frequency-density histogram
With unequal class widths the bar height is frequency density, so the area (not the height) represents the frequency.
词汇表
训练
| 英文 | 中文 | 拼音 |
|---|---|---|
| histogram/ˈhɪstəɡræm/ | 直方图 | zhí fāng tú |
| frequency density/ˈfriːkwənsi ˈdensɪti/ | 频数密度 | pín shuò mì dù |
| class width/klæs wɪtθ/ | 组距 | zǔ jù |
9.7
考试技巧
- 知道三个平均:平均数(加起来 ÷ 有多少个)、中位数(按顺序时中间的值)、众数(最常见的)。极差是最高 − 最低。
- 从一张频数表,平均数是 $\frac{\sum fx}{\sum f}$ ——除以总频数,不是行数。
- 在一个散点图上,把相关性描述为正、负或没有,并穿过平均点画最佳拟合线。
- 对于一个组宽不相等的直方图,高度是频数密度(频数 ÷ 组距),不是频数。
本主题的互动课程
逐步学习,并即时检测练习。