Histograms · 直方图
| English | 中文 | Pinyin · 拼音 |
|---|---|---|
| histogram/ˈhɪstəɡræm/ | 直方图 | zhí fāng tú |
| frequency density/ˈfriːkwənsi ˈdensɪti/ | 频数密度 | pín shuò mì dù |
| class width/klæs wɪtθ/ | 组距 | zǔ jù |
When bar widths matter
- A bar chart always has equal-width bars. But what if your data classes have different widths?
- A histogram 直方图 solves this: the area (not the height) of each bar represents the frequency.
Frequency-density histogram · 频率密度直方图
With unequal class widths the bar height is frequency density, so the area (not the height) represents the frequency. · 当组距不等时,条形高度为频率密度,此时面积(而非高度)代表频数。
Frequency density 频数密度
- When class widths 组距 vary, the vertical axis shows frequency density:
Frequency $25$, class width $10$: density $= \dfrac{25}{10} = 2.5$.
Height $\neq$ frequency. In a histogram with unequal widths, a tall narrow bar might represent fewer data points than a short wide bar. It's the area ($= \text{density} \times \text{width} = \text{frequency}$) that counts.

A pictogram uses a symbol to stand for a number of items
A class has frequency 25 and class width 10. Find the frequency density. · 某组频数为 25,组距为 10。求频率密度。
25 ÷ 10 = 2.5.
On a histogram, the frequency is shown by each bar's: · 在直方图中,频数由每个条形的:
With unequal widths, area (not height) represents frequency. · 当组距不等时,面积(而非高度)代表频数。
A class has frequency 30 and class width 5. Find the frequency density. · 某组频数为 30,组距为 5。求频率密度。
30 ÷ 5 = 6.
In a histogram with unequal class widths, the tallest bar always has the highest frequency. · 在组距不等的直方图中,最高的条形总是具有最高的频数。
A tall narrow bar might have a smaller area (and thus lower frequency) than a short wide bar. · 一个高而窄的条形可能具有较小的面积(因而频数较低),不如矮而宽的条形。
Worked examples
- Frequency $25$, width $10$ → density $= 2.5$.
- Frequency $30$, width $5$ → density $= 6$.
- Frequency $40$, width $20$ → density $= 2$.
A histogram bar has frequency density 4 and class width 8. What is the frequency? · 直方图条形的频率密度为 4,组距为 8。求频数。
Frequency = density × width = 4 × 8 = 32. · 频数 = 密度 × 宽度 = 4 × 8 = 32。
Reading a histogram
- To find the frequency of a class: $\text{density} \times \text{width} = \text{frequency}$.
- To compare classes: look at the area of each bar, not the height.
When all classes have the same width, a histogram looks like a normal ______ chart. · 当所有组距相等时,直方图看起来像普通的______图。
With equal widths, frequency density is proportional to frequency, so it resembles a bar chart. · 当组距相等时,频率密度与频数成正比,因此外观类似条形图。
Why histograms look like bar charts
- When all classes have the same width, the density is proportional to the frequency — so the histogram looks like a normal bar chart.
- Use a labelled frequency-density axis consistently, including when all class widths are equal.
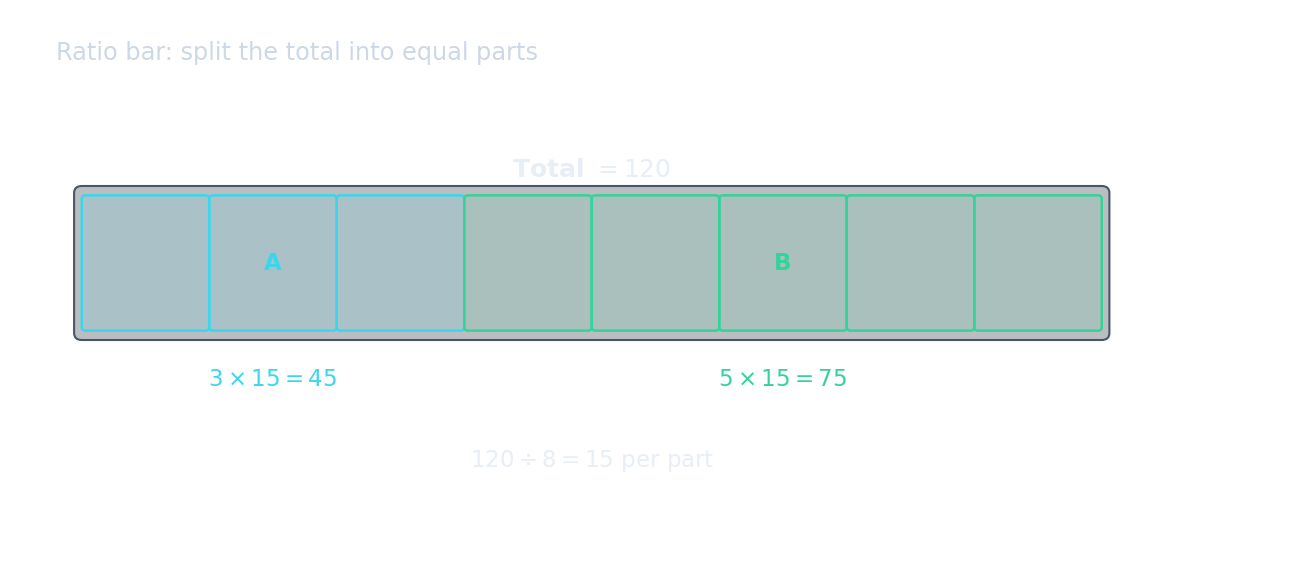
Histogram bars are like proportional blocks: the area (width × height) gives the frequency, not just the height.
Reconstruct a whole histogram
- Classes $0\le x<5,5\le x<15,15\le x<35$ have frequencies 10,30,20. Widths 5,10,20 give heights $D=f/w=2,3,1$; draw touching bars over their actual intervals.
- Reverse the method for a missing frequency: width 8 and density 2.5 give $f=Dw=2.5(8)=20$. The tallest bar need not hold the most observations if widths differ.
A histogram bar has width 8 and density 2.5. Find its frequency. · 一个直方图条形的宽度为 8,密度为 2.5。求其频数。
Frequency = density × width = 2.5 × 8 = 20. · 频率 = 密度 × 宽度 = 2.5 × 8 = 20。
You've got it
- in a histogram, the area of a bar $=$ frequency (widths can differ)
- vertical axis $=$ frequency density $= \dfrac{\text{frequency}}{\text{class width}}$
- frequency $25$, width $10$ → density $2.5$