Collecting and showing data · 数据的收集与展示
| English | 中文 | Pinyin · 拼音 |
|---|---|---|
| tally table/ˈtælɪ ˈteɪbl/ | 计数表 | jì shù biǎo |
| two-way table/tuː weɪ ˈteɪbl/ | 双向表 | shuāng xiàng biǎo |
| correlation/ˌkɒrɪˈleɪʃn/ | 相关性 | xiāng guān xìng |
| causation/kɔːˈseɪʃn/ | 因果 | yīn guǒ |
| qualitative/ˈkwɒlɪteɪtɪv/ | 定性 | dìng xìng |
| quantitative/ˈkwɒntɪteɪtɪv/ | 定量 | dìng liàng |
| discrete/dɪˈskriːt/ | 离散的 | lí sàn de |
| continuous/kənˈtɪnjuːəs/ | 连续的 | lián xù de |
"Statistics" — the word that means both data and lies
- "There are three kinds of lies: lies, damned lies, and statistics." — often attributed to Mark Twain.
- Good statistics tells the truth about data. Bad statistics misleads. The skill is telling them apart.
"统计"——既指数据又指谎言的词
- "有三种谎言:谎言、该死的谎言,和统计。"——常被归于马克·吐温。
- 好的统计讲述关于数据的真相。坏的统计误导。技能是把它们区分开。
Data handling cycle · 数据处理循环
Follow a statistical question from collection to display. · 遵循统计问题,从数据收集到展示的全过程。
Tally tables 计数表 and two-way tables 双向表
- A tally table records each value with a mark ($\mid$), grouping them in fives for easy counting.
- A two-way table sorts data by two features at once (e.g. boys/girls against walk/bus/car).
A two-way table of 60 students by gender and transport might show: 15 boys walk, 10 boys take the bus; 12 girls walk, 23 girls take the bus. Each cell is a count.
Data is collected from people, a sample drawn from a population
计数表和双向表
- 一个计数表(tally table)用一个标记($\mid$)记录每个值,把它们五个一组以便容易计数。
- 一个双向表(two-way table)同时按两个特征分类数据(例如男孩/女孩对步行/公交/汽车)。
一个 60 名学生按性别和交通方式的双向表可能显示:15 个男孩步行,10 个男孩坐公交;12 个女孩步行,23 个女孩坐公交。每个单元格是一个计数。

数据从人收集,一个样本从一个总体中抽取
A two-way table sorts data by how many features at once? · 列联表按同时包含多少个特征对数据进行分类?
A two-way table cross-tabulates two features (e.g. gender vs transport). · 列联表对两个特征进行交叉制表(例如性别与交通方式)。
A table where you make a mark for each value, then count, is a ______ table. · 每记录一个值就画一条竖线,然后计数的表格是______表。
A tally table records each value with a mark before counting. · 划记表在计数前用划线记录每个数值。
Reading data honestly
- Only draw conclusions the data actually supports.
- Don't assume a trend that isn't shown, or causes that aren't proven.
- Correlation 相关性 is not causation 因果: two things can rise together without one causing the other.
Check the axes. A graph with a truncated $y$-axis can make small differences look huge. Always check the scale before drawing conclusions.
A Galton board shows how data piles up into a distribution
诚实地读数据
- 只得出数据实际支持的结论。
- 不要假设一个没有显示的趋势,或没有被证明的原因。
- 相关不是因果:两样东西能一起上升而没有一个造成另一个。
检查坐标轴。 一个 $y$ 轴被截断的图能使小差异看起来巨大。总是在得出结论前检查刻度。

一个高尔顿板显示数据如何堆积成一个分布
You should only draw conclusions that the data really supports. · 你只能得出数据真正支持的结论。
Over-claiming beyond the data is a common exam error to avoid. · 超出数据范围过度推断是考试中常见的易错点。
If two quantities both increase together, one must cause the other. · 如果两个量都随之增加,是否意味着其中一个必然导致另一个?
Correlation does not prove causation. Both could be influenced by a third factor. · 相关性不代表因果性。两者可能都受第三个因素影响。
Types of data
- Qualitative 定性 (categorical): colours, opinions, brands.
- Quantitative 定量 (numerical): height, age, score.
- Quantitative data is discrete 离散的 (counted: number of siblings) or continuous 连续的 (measured: height, time).
数据类型
- 定性(qualitative,分类的):颜色、意见、品牌。
- 定量(quantitative,数值的):身高、年龄、分数。
- 定量数据是离散的(discrete,计数的:兄弟姐妹的数量)或连续的(continuous,测量的:身高、时间)。
The number of siblings a student has is what type of data? · 学生拥有的兄弟姐妹数量属于什么类型的数据?
Number of siblings is counted (not measured), so it is discrete quantitative. · 兄弟姐妹的数量是通过数出来的(而非测量),所以是离散定量数据。
Height is an example of ______ quantitative data. · 身高是______定量数据的一个例子。
Height is measured (not counted), so it is continuous. · 身高是通过测量得出的(而非数出来的),所以是连续的。
Why data matters
- Governments use census data to plan schools and hospitals. Companies use sales data to decide what to stock. Medical researchers use trial data to approve new drugs.
Two-way tables split data into parts, just like a bar model splits a total into proportional sections.
为什么数据重要
- 政府用普查数据规划学校和医院。公司用销售数据决定进什么货。医学研究人员用试验数据批准新药。
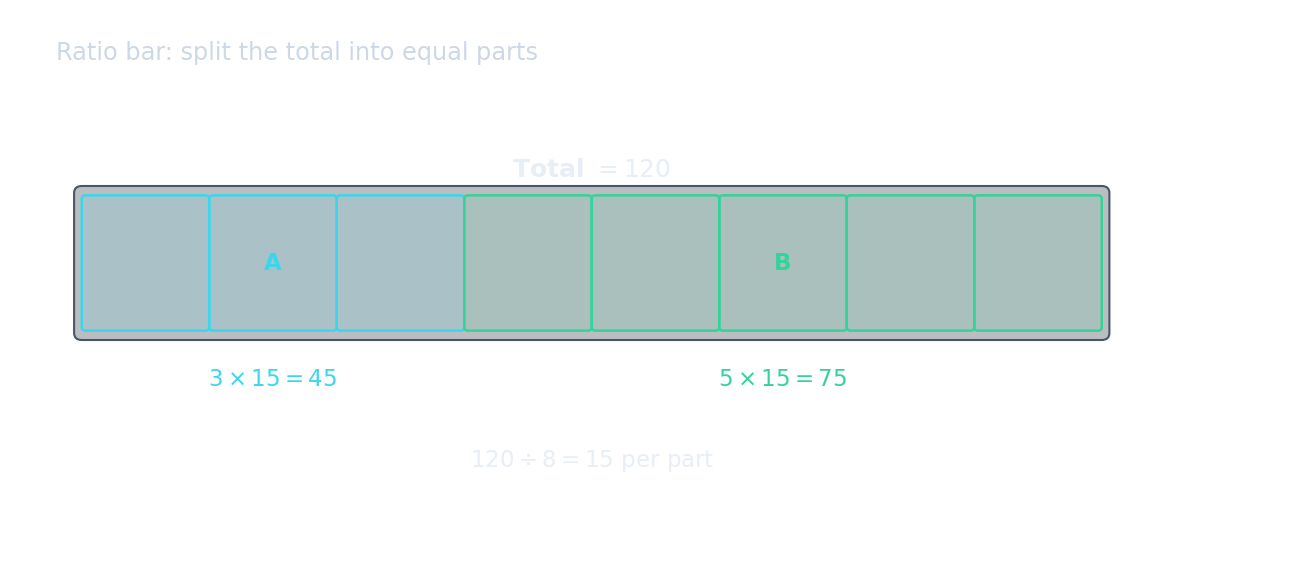
双向表把数据分成部分,就像一个条形模型把一个总数分成成比例的部分。
Complete and interpret a two-way table
- In a survey, junior bus 6, junior walk 4, senior bus 3 and senior walk 7 give row totals 10,10; column totals 9,11; grand total 20. Check totals in both directions.
- To compare two samples, use both an average and a spread. Scores A: $4,6,8$ and B: $5,6,7$ have equal means 6 but ranges 4 and 2. B is more consistent in this sample; three scores per group cannot establish a general population claim.
完成并解读二维列联表
- 在一项调查中,低年级坐公交6人,低年级步行4人,高年级坐公交3人,高年级步行7人,由此得出行合计为10,10;列合计为9,11;总计为20。请双向核对所有合计数据是否正确。
- 比较两组样本时,需同时使用平均值和离散程度。分数A:$4,6,8$与B:$5,6,7$具有相同的均值6,但极差分别为4和2。在本题中,B组表现更稳定;每组仅三个数据点无法得出关于总体的普遍结论。
A survey has junior bus 6, junior walk 4, senior bus 3, senior walk 7. Find the total who walk. · 一项调查中,初中生乘公交 6 人,初中生步行 4 人,高中生乘公交 3 人,高中生步行 7 人。求步行的总人数。
Add the walk column: 4 + 7 = 11. · 将步行列相加:4 + 7 = 11。
You've got it
- a tally table counts values with marks; a two-way table sorts by two features at once
- only conclude what the data actually shows — correlation $\neq$ causation
- data types: qualitative (categories) or quantitative (numbers: discrete or continuous)
你掌握了
- 一个计数表用标记计数值;一个双向表同时按两个特征分类
- 只得出数据实际显示的结论——相关 $\neq$ 因果
- 数据类型:定性(分类)或定量(数字:离散或连续)