1 Understand and use the probability scale from 0 to 1.
Probability notation is not required. Probabilities should be given as a fraction, decimal or percentage. Problems may require using information from tables, graphs or Venn diagrams (limited to two sets).
2 Calculate the probability of a single event.
3 Understand that the probability of an event not occurring = 1 – the probability of the event occurring.
e.g. The probability that a counter is blue is 0.8. What is the probability that it is not blue?
Source: Cambridge International syllabus · แหล่งที่มา: หลักสูตร Cambridge International
English
Probability 概率 measures how likely an event 事件 is. It runs on a scale from $0$ (impossible) to $1$ (certain), and can be written as a fraction, decimal or percentage. We write $\text{P}(A)$ for the probability of event $A$.
For equally likely outcomes 结果,
$$\text{P}(\text{event}) = \frac{\text{number of favourable outcomes}}{\text{total number of outcomes}}.$$
The probability that an event does not happen is
$$\text{P}(A') = 1 - \text{P}(A).$$
Worked example. A bag has $3$ red and $5$ blue counters. Find the probability of not drawing red.
Slide the marker from 0 (impossible) to 1 (certain) to place an event on the probability scale. · เลื่อนมาร์คเกอร์จาก 0 (เป็นไปได้ยาก) ถึง 1 (แน่นอน) เพื่อวางเหตุการณ์บน สเกลความน่าจะเป็น
Source: Cambridge International syllabus · แหล่งที่มา: หลักสูตร Cambridge International
English
When outcomes are not equally likely, do an experiment. The relative frequency 相对频率 estimates the probability:
$$\text{relative frequency} = \frac{\text{number of times it happened}}{\text{total number of trials}}.$$
The more trials you do, the better the estimate. A fair 公平 object gives equal chances; one with bias 偏倚 does not; random 随机 means each outcome happens by chance.
The expected frequency 期望频数 is how many times you expect an event in $n$ trials:
Two-dice probability · ความน่าจะเป็นของลูกเต๋าสองลูก
Roll the two dice many times: the bars start jumpy but settle into the theoretical triangle peaking at 7 — experimental probability closing in on theory. · โยกลูกเต๋าสองลูกหลายครั้ง: แท่งกราฟเริ่มผันผวนแต่จะนิ่งลงเป็นสามเหลี่ยมทางทฤษฎีที่ยอดที่ 7 — ความน่าจะเป็นเชิงทดลองเข้าใกล้ทฤษฎี
Source: Cambridge International syllabus · แหล่งที่มา: หลักสูตร Cambridge International
English
For two or more events together (combined events 组合事件), two rules help:
AND (both happen): multiply the probabilities — when the events are independent 独立事件 (one does not affect the other).
OR (either happens): add the probabilities — when the events are mutually exclusive 互斥 (they cannot both happen).
Three pictures help you organise the work.
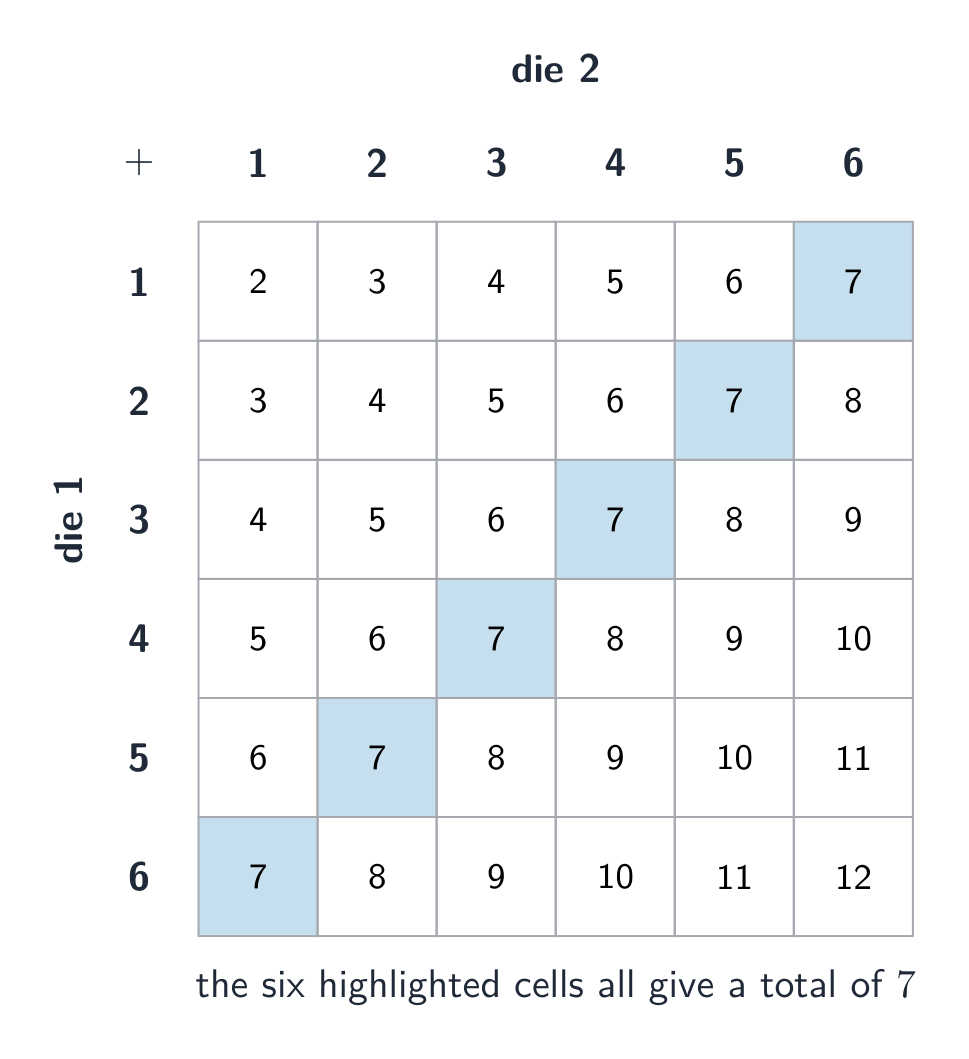
Sample space diagrams
A sample space diagram 样本空间图 is a table or grid listing every possible outcome — useful for two dice or two spinners. Count the outcomes you want out of the total.
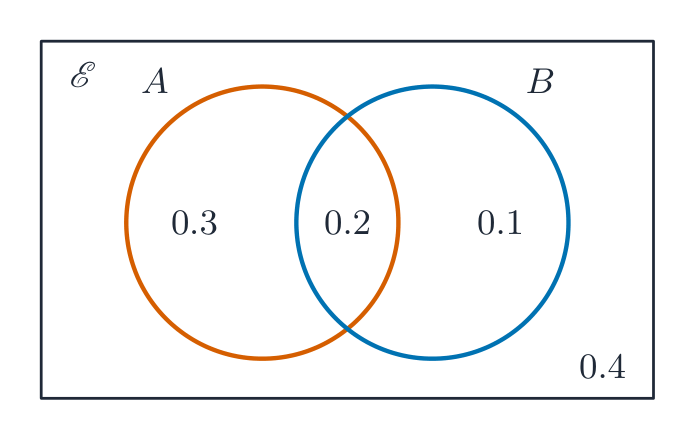
Venn diagrams
A Venn diagram 维恩图 sorts outcomes into overlapping sets. From it you can read $\text{P}(A \cap B)$ (in both) and $\text{P}(A \cup B)$ (in either).
Tree diagrams
A tree diagram 树状图 shows each stage as a set of branches. Write the probability on each branch and the outcome at the end. Multiply along the branches, then add the paths you want.
Worked example (with replacement). From the bag ($3$ red, $5$ blue), a counter is drawn, replaced, then a second is drawn. This is with replacement 有放回, so the chances do not change. Find the probability of two reds.
Worked example (without replacement, Extended). Now the first counter is not replaced — drawing without replacement 无放回. After one red is taken, $2$ reds remain out of $7$:
Multiply the probabilities along each branch; the four outcomes always add up to 1. · คูณความน่าจะเป็นตามกิ่งแต่ละเส้น; ผลลัพธ์สี่อย่างรวมกันได้ 1 เสมอ
Explore · สำรวจ
Combined events · เหตุการณ์ร่วม
P(A ∩ B) = P(A)·P(B|A)
Combine two events: the area model shows AND (overlap) versus OR (union). · รวมสองเหตุการณ์: โมเดลพื้นที่ แสดง AND (ทับซ้อน) เทียบกับ OR ( unión )
Source: Cambridge International syllabus · แหล่งที่มา: หลักสูตร Cambridge International
English
Conditional probability 条件概率 is the probability of one event given that another has already happened. Read it from a Venn diagram, two-way table or tree diagram by looking only at the part that matches the condition.
Worked example. In a class of $30$, $18$ study French and, of those, $7$ also study German. A French student is picked. Find the probability they also study German.
Change the branch probabilities and read combined and conditional probabilities off the tree. · เปลี่ยนความน่าจะเป็นในแต่ละกิ่งและอ่านความน่าจะเป็นร่วมและความน่าจะเป็นเงื่อนไขจาก ต้นไม้
8.4
Exam tips · ข้อแนะนำสำหรับการสอบ
English
Every probability lies between $0$ and $1$, and the probabilities of all the outcomes add to $1$.
For "and" (both events) multiply the probabilities; for "or" (either event) add them. On a tree diagram, multiply along the branches.
Watch for without replacement: the second probability changes because one item has already been removed.
Expected frequency = probability × number of trials.
Pick one and the site follows you — notes, papers, videos and practice all open on it. · เลือกหนึ่งตัว และเว็บจะติดตามคุณ — หมายเหตุ, ใบงาน, วิดีโอ และการฝึกฝนจะเปิดอยู่ที่นั้น
Type to search notes, lessons, code, vocabulary and past-paper questions across every subject. · พิมพ์เพื่อค้นหาบันทึก, บทเรียน, โค้ด, คำศัพท์ และคำถามข้อสอบเก่าในทุกวิชา