

English
- explain the meanings of the terms haploid (n) and diploid (2n)
- explain what is meant by homologous pairs of chromosomes
- explain the need for a reduction division during meiosis in the production of gametes
- describe the behaviour of chromosomes in plant and animal cells during meiosis and the associated behaviour of the nuclear envelope, the cell surface membrane and the spindle (names of the main stages of meiosis, but not the sub-divisions of prophase I, are expected: prophase I, metaphase I, anaphase I, telophase I, prophase II, metaphase II, anaphase II and telophase II)
- interpret photomicrographs and diagrams of cells in different stages of meiosis and identify the main stages of meiosis
- explain that crossing over and random orientation (independent assortment) of pairs of homologous chromosomes and sister chromatids during meiosis produces genetically different gametes
- explain that the random fusion of gametes at fertilisation produces genetically different individuals
ไทย
- อธิบายความหมายของคำศัพท์ haploid (n) และ diploid (2n)
- อธิบายความหมายของ homologous pairs ของ chromosomal
- อธิบายเหตุผลที่ต้องมีการ reduction division ระหว่าง meiosis ในการผลิต gametes
- อธิบายพฤติกรรมของ chromosomal ในเซลล์พืชและสัตว์ระหว่าง meiosis และพฤติกรรมที่เกี่ยวข้องของ nuclear envelope, cell surface membrane และ spindle (ชื่อของขั้นตอนหลักของ meiosis แต่ไม่รวมถึง sub-divisions ของ prophase I เป็นที่ต้องการ: prophase I, metaphase I, anaphase I, telophase I, prophase II, metaphase II, anaphase II และ telophase II)
- ตีความ photomicrographs และแผนภาพของเซลล์ในระยะต่างๆ ของ meiosis และระบุขั้นตอนหลักของ meiosis
- อธิบายว่า การแลกเปลี่ยนยีน (crossing over) และการจัดเรียงแบบสุ่ม (random orientation) หรือการแยกตัวอย่างอิสระ (independent assortment) ของคู่โครโมโซมโฮโมโลกัสและครोมาทิดน้องสาวในระหว่าง meiosis ทำให้เกิด gametes ที่มีความแตกต่างทางพันธุกรรม
- อธิบายว่าการรวมกันของ gametes แบบสุ่มในกระบวนการ fertilisation ทำให้เกิดบุคคลที่มีความแตกต่างทางพันธุกรรม

 *คู่โฮโมโลกัสพา
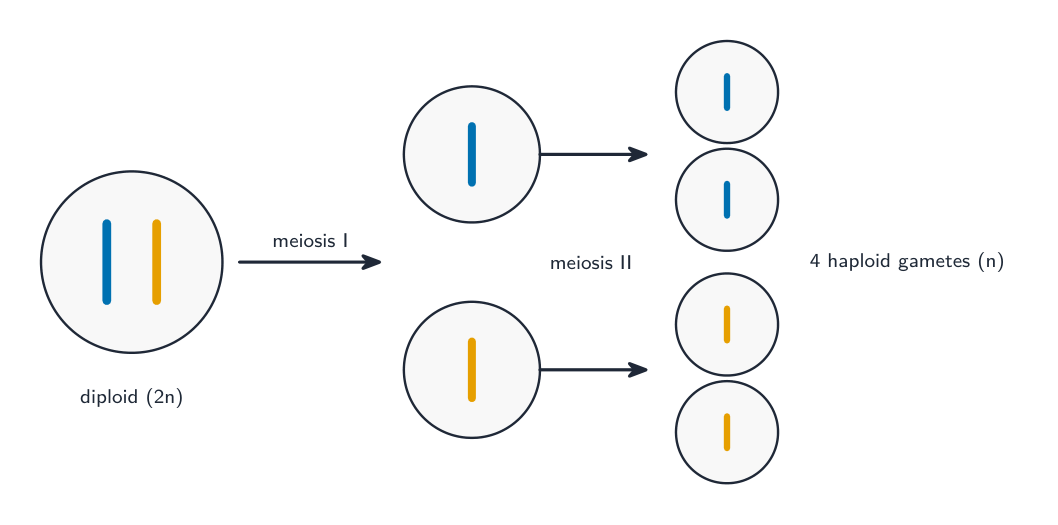 *การแบ่งสองครั้งลดจำนวนโครโมโซดลงครึ่งหนึ่ง: เมยโอซิส I แยกคู่โฮโมโลกัส, เมยโอซิส II แยกโครมาทิด — ให้แกลเลตแฮพลอยด์สี่ตัว
 *ครอสชิ่งโอเวอร์: คู่โครโมโซมแลกเปลี่ยนส่วนที่ตรงกันที่ไจาสมา สร้างการผสมผสานอัลลีลใหม่
 *การจัดเรียงอย่างอิสระ: คู่โครโมโซดเรียงตัวในลำดับสุ่ม ทำให้แกลเลตได้รับหลายรูปแบบการผสมผสาน
 *เนื่องจากยีนอยู่บนโครโมโซด X ลูกชายของแม่ carrier อาจตาบอดสี ในขณะที่ลูกสาวเป็นเพียง carriers — ผลลัพธ์ต่างตามเพศ