A-Level Ekonomi (9708) terbagi menjadi dua. Ekonomi Mikro: kelangkaan, sistem harga, elastisitas, kegagalan pasar, intervensi pemerintah. Ekonomi Makro: pendapatan nasional, multiplier, inflasi, pengangguran, pertumbuhan, kebijakan, dan perdagangan. A-Level 2 mendalami area yang sama daripada menambah area baru.
Keterampilan yang diuji bukan hafalan. Ini adalah gambar diagram, lalu evaluasi. Jawaban yang menjelaskan sebuah kebijakan mendapat nilai rendah. Jawaban yang mengatakan apa yang dilakukan kebijakan, menggambar diagram, lalu mengatakan kapan itu tidak akan berfungsi mendapat nilai tinggi.
"Tergantung pada" bukanlah sikap hati-hati di sini — kondisi-kondisinya tepat berada di tempat nilai evaluasi berada.
The fundamental economic problem · Masalah ekonomi mendasar
Syllabus · Silabus
English
explain the fundamental economic problem of scarcity arising from finite resources and unlimited wants
explain choice and opportunity cost for consumers, producers and governments
distinguish positive and normative statements in the context of choice
Bahasa Indonesia
jelaskan masalah ekonomi mendasar kelangkaan yang muncul dari sumber daya terbatas dan kebutuhan tak terbatas
jelaskan pilihan dan biaya peluang untuk konsumen, produsen dan pemerintah
bedakan pernyataan positif dan normatif dalam konteks pilihan
Source: Cambridge International syllabus · Sumber: Silabus Cambridge International
English
Economics starts with one big idea: scarcity 稀缺性. We never have enough to give everyone everything they want.
resources 资源 are the things we use to make goods and services. They are finite 有限的 — there is only a limited amount, so they are scarce 稀缺.
goods 物品 (things you can touch, like food) and services 服务 (work done for you, like a haircut) are what we make from resources.
human wants 欲望 are unlimited. People always want more.
Because wants are bigger than resources, this is called the economic problem 经济问题. Every society must answer three questions:
What to produce?
How to produce it?
For whom to produce it?
Choice and opportunity cost
Because resources are scarce, you must choose. Every choice means you give up something else.
opportunity cost 机会成本 — the next best alternative 替代选择 you give up when you make a decision.
Opportunity cost is faced by everyone:
consumers 消费者 (people who buy and use goods): buy a phone, and you give up the holiday that money could have paid for.
producers 生产者 and firms 企业 (the businesses that make goods): use a factory to make cars, and you give up the trucks it could have made.
governments 政府: spend tax money on hospitals, and you give up the schools that money could have built.
Bahasa Indonesia
Ekonomi dimulai dengan satu ide besar: kelangkaan. Kita tidak pernah memiliki cukup sumber daya untuk memberi setiap orang segala sesuatu yang mereka inginkan.
sumber daya adalah hal-hal yang kita gunakan untuk membuat barang dan jasa. Mereka terbatas — jumlahnya hanya terbatas, sehingga mereka langka.
barang (benda yang bisa disentuh, seperti makanan) dan jasa (pekerjaan yang dilakukan untuk Anda, seperti potong rambut) adalah hasil produksi dari sumber daya.
keinginan manusia bersifat tak terbatas. Orang selalu menginginkan lebih banyak lagi.
Karena keinginan lebih besar daripada sumber daya, ini disebut masalah ekonomi. Setiap masyarakat harus menjawab tiga pertanyaan:
Apa yang diproduksi?
Bagaimana cara memproduksinya?
Untuk siapa memproduksinya?
Pilihan dan biaya peluang
Karena sumber daya langka, Anda harus memilih. Setiap pilihan berarti Anda mengorbankan sesuatu yang lain.
biaya peluang — alternatif terbaik berikutnya yang Anda korbankan saat Anda membuat keputusan.
Biaya peluang dihadapi oleh semua orang:
konsumen (orang yang membeli dan menggunakan barang): membeli ponsel, dan Anda mengorbankan liburan yang uang tersebut bisa biayai.
produsen dan perusahaan (bisnis yang membuat barang): menggunakan pabrik untuk membuat mobil, dan Anda mengorbankan truk yang bisa dibuat oleh pabrik tersebut.
pemerintah: menghabiskan pajak untuk rumah sakit, dan Anda mengorbankan sekolah-sekolah yang uang tersebut bisa bangun.
1.2
Thinking like an economist · Berpikir seperti ekonom
Syllabus · Silabus
English
explain economics as a social science and the use of the ceteris paribus assumption
distinguish positive and normative statements and the role of value judgements
distinguish microeconomics and macroeconomics
Bahasa Indonesia
jelaskan ekonomi sebagai sains sosial dan penggunaan asumsi ceteris paribus
bedakan pernyataan positif dan normatif serta peran penilaian nilai
bedakan mikroekonomi dan makroekonomi
Source: Cambridge International syllabus · Sumber: Silabus Cambridge International
English
Economics as a social science
Economics is a social science 社会科学. It studies how people behave when they make choices. Like other sciences, it builds models 模型 (simple pictures of the real world) and tests them with data.
The real world is complex, so economists change one thing at a time and keep everything else fixed. This is the idea of ceteris paribus 其他条件不变 — a Latin phrase meaning "all other things stay the same". For example: "if the price of coffee rises, people buy less coffee, ceteris paribus".
Positive and normative statements
a positive statement 实证表述 is about fact. It can be tested as true or false. Example: "a higher price of petrol reduces the amount people buy."
a normative statement 规范表述 is about opinion. It says what should happen, and it cannot be tested as true or false. Example: "the government should make petrol cheaper."
Normative statements rest on a value judgement 价值判断 — a personal view about what is good or fair. Two people can agree on the facts and still disagree about what should be done.
Microeconomics and macroeconomics
microeconomics 微观经济学 studies single parts of the economy: one market, one firm, one consumer.
macroeconomics 宏观经济学 studies the whole economy together: total output 产出, jobs, and rising prices.
Bahasa Indonesia
Ekonomi sebagai ilmu sosial
Ekonomi adalah ilmu sosial. Ia mempelajari bagaimana perilaku manusia saat membuat pilihan. Seperti sains lainnya, ekonomi membangun model (gambar sederhana dari dunia nyata) dan mengujinya dengan data.
Dunia nyata kompleks, sehingga ekonom mengubah satu hal sekaligus dan mempertahankan yang lain tetap konstan. Ini adalah konsep ceteris paribus — frasa Latin yang berarti "semua hal lain tetap sama". Contoh: "jika harga kopi naik, orang membeli lebih sedikit kopi, ceteris paribus".
Pernyataan positif dan normatif
pernyataan positif berkaitan dengan fakta. Dapat diuji kebenarannya atau keniscayaan. Contoh: "harga bensin yang lebih tinggi mengurangi jumlah pembelian masyarakat."
pernyataan normatif berkaitan dengan opini. Menyatakan apa yang seharusnya terjadi, dan tidak dapat diuji kebenarannya atau keniscayaan. Contoh: "pemerintah seharusnya menurunkan harga bensin."
Pernyataan normatif didasarkan pada penilaian nilai — pandangan pribadi tentang apa yang baik atau adil. Dua orang dapat setuju atas fakta tetapi tetap berbeda pendapat mengenai apa yang seharusnya dilakukan.
Pernyataan positif dapat diuji; pernyataan normatif adalah penilaian nilai
Mikroekonomi dan makroekonomi
mikroekonomi mempelajari bagian-bagian tunggal dalam ekonomi: satu pasar, satu perusahaan, satu konsumen.
makroekonomi mempelajari keseluruhan ekonomi secara bersama-sama: total output, lapangan kerja, dan kenaikan harga.
Explore · Jelajahi
Economic method lab · Laboratorium metode ekonomi
Classify statements by the role they play in economic reasoning. · Klasifikasikan pernyataan berdasarkan peran mereka dalam penalaran ekonomi.
define land, labour, capital and enterprise and their rewards (rent, wages, interest, profit)
explain division of labour and specialisation and their advantages and disadvantages
explain the mobility of factors of production
Bahasa Indonesia
definisikan tanah, tenaga kerja, modal dan kewirausahaan serta imbalannya (sewa, upah, bunga, laba)
jelaskan pembagian kerja dan spesialisasi serta keunggulan dan kekurangannya
jelaskan mobilitas faktor produksi
Source: Cambridge International syllabus · Sumber: Silabus Cambridge International
English
The factors of production 生产要素 are the four kinds of resource used to make goods and services. Each one earns a reward 报酬.
Factor
What it is
Its reward
land 土地
natural resources (fields, water, oil, minerals)
rent 地租
labour 劳动
human work, both physical and mental
wages 工资
capital 资本
man-made things used to produce, like machines, tools and factories
interest 利息
enterprise 企业家才能
the skill of bringing the other three together and taking the risk
profit 利润
Land includes some non-renewable resources 不可再生资源 (like oil and coal) that can run out. Enterprise is supplied by the entrepreneur 企业家, the person who has the business idea and risks their own money.
Specialisation and division of labour
specialisation 专业化 is when a worker, firm or country makes only the things it is best at, then trades for the rest.
Inside a workplace, specialisation leads to the division of labour 劳动分工: a big job is split into small tasks, and each worker 工人 does one task again and again.
Advantages
Disadvantages
workers get faster and better at one task
doing one task is boring, so workers may quit
less time wasted moving between jobs
if one worker is absent, the whole line can stop
output per worker rises, so costs fall
workers learn only one narrow skill
Mobility of factors
mobility 流动性 means how easily a factor can move to a new use.
occupational mobility 职业流动性 — how easily a factor moves from one job or use to another. A teacher who retrains as a nurse is occupationally mobile.
geographical mobility 地理流动性 — how easily a factor moves from one place to another. Land cannot move at all, so it has no geographical mobility.
Labour is often not very mobile. Family ties, the cost of housing, and missing skills all make it hard for workers to move.
Bahasa Indonesia
Faktor-faktor produksi adalah empat jenis sumber daya yang digunakan untuk menghasilkan barang dan jasa. Setiap faktor mendapatkan imbalan.
Empat faktor produksi dan imbalan yang diperoleh masing-masing
Faktor
Apa itu
Imbalannya
tanah
sumber daya alam (lahan pertanian, air, minyak, mineral)
sewa
tenaga kerja
kerja manusia, baik fisik maupun mental
gaji
modal
benda buatan manusia yang digunakan untuk memproduksi, seperti mesin, alat, dan pabrik
bunga
kewirausahaan
keterampilan menggabungkan tiga faktor lainnya dan menanggung risiko
laba
Tanah mencakup beberapa sumber daya tak terbarukan (seperti minyak dan batu bara) yang dapat habis. Kewirausahaan disediakan oleh wirausaha, yaitu orang yang memiliki ide bisnis dan berisiko menggunakan uangnya sendiri.
Tambang tembaga terbuka: tanah mencakup sumber daya alam (mineral, minyak, air) yang diekstraksi oleh perusahaan.
Spesialisasi dan pembagian kerja
Spesialisasi terjadi ketika seorang pekerja, perusahaan, atau negara hanya membuat barang yang paling mereka kuasai, lalu menukarnya dengan barang lain.
Di dalam tempat kerja, spesialisasi mengarah pada pembagian kerja: pekerjaan besar dibagi menjadi tugas-tugas kecil, dan setiap pekerja melakukan satu tugas berulang-ulang.
Keuntungan
Kerugian
pekerja menjadi lebih cepat dan terampil pada satu tugas
melakukan satu tugas terasa membosankan, sehingga pekerja mungkin berhenti bekerja
lebih sedikit waktu terbuang berpindah antar pekerjaan
jika satu pekerja absen, seluruh lini produksi bisa terhenti
output per pekerja meningkat, sehingga biaya turun
pekerja hanya menguasai satu keterampilan sempit
Lini perakitan mobil: modal (mesin dan robot) ditambah pembagian kerja, di mana setiap pekerja mengulang satu tugas.
Mobilitas faktor
Mobilitas berarti seberapa mudah sebuah faktor dapat berpindah ke penggunaan baru.
mobilitas okupasional — seberapa mudah faktor berpindah dari satu pekerjaan atau penggunaan ke yang lain. Seorang guru yang mengikuti pelatihan ulang sebagai perawat memiliki mobilitas okupasional.
mobilitas geografis — seberapa mudah faktor berpindah dari satu tempat ke yang lain. Tanah tidak dapat bergerak sama sekali, sehingga tidak memiliki mobilitas geografis.
Tenaga kerja seringkali tidak terlalu mobile. Ikatan keluarga, biaya perumahan, dan kurangnya keterampilan semuanya membuat pekerja sulit untuk berpindah.
Explore · Jelajahi
Factors of production lab · Laboratorium faktor produksi
Sort real resources by the factor of production they represent. · Urutkan sumber daya riil berdasarkan faktor produksi yang mereka wakili.
explain how resources are allocated in market, planned and mixed economic systems
explain the role of the price mechanism (signalling, incentive, rationing) in allocating resources
evaluate the advantages and disadvantages of each system
Bahasa Indonesia
jelaskan bagaimana sumber daya dialokasikan dalam sistem ekonomi pasar, terencana dan campuran
jelaskan peran mekanisme harga (sinyal, insentif, rasionalisasi) dalam mengalokasikan sumber daya
evaluasi keunggulan dan kekurangan setiap sistem
Source: Cambridge International syllabus · Sumber: Silabus Cambridge International
English
An economic system is the way a country decides how to allocate 配置 (share out) its scarce resources. There are three types.
a market economy 市场经济 — firms and people own resources, and prices decide what is made. The government does little.
a planned economy 计划经济 (also called a command economy 指令经济) — the government owns resources and decides what is made, how, and for whom.
a mixed economy 混合经济 — a blend of the two. The private sector 私营部门 (firms and households) and the public sector 公共部门 (the government) both make decisions. Almost every real country is mixed.
The price mechanism
In a market economy, resources are guided by the price mechanism 价格机制. Prices do three jobs:
signalling 信号传递 — a price tells buyers and sellers where resources are wanted. A rising price says "this is wanted — make more".
incentive 激励 — a higher price rewards producers, so they want to supply more of that good.
rationing 配给 — when a good is scarce, a higher price shares it out to those who are willing and able to pay.
Comparing the systems
System
Strengths
Weaknesses
market
choice, low prices, strong incentive to work and invent
large gap between rich and poor; some goods not supplied
planned
smaller gap between rich and poor; key goods provided for all
weak incentive; shortages and surpluses; slow to change
mixed
tries to keep the good points of both
the right balance is hard to find
In practice no country sits at a pure extreme. China's economy, for instance, is officially a socialist market economy, where markets set most prices while the government guides key sectors and owns major enterprises. Every real system mixes the two and sits somewhere on the spectrum below.
Bahasa Indonesia
Sistem ekonomi adalah cara suatu negara memutuskan untuk mengalokasikan (membagi) sumber dayanya yang langka. Ada tiga jenisnya.
ekonomi pasar — perusahaan dan individu memiliki sumber daya, dan harga menentukan apa yang diproduksi. Pemerintah berperan minim.
ekonomi terencana (juga disebut ekonomi komando) — pemerintah拥有 sumber daya dan memutuskan apa yang diproduksi, bagaimana cara memproduksinya, dan untuk siapa.
ekonomi campuran — gabungan dari keduanya. Sektor swasta (perusahaan dan rumah tangga) dan sektor publik (pemerintah) sama-sama mengambil keputusan. Hampir setiap negara nyata adalah campuran.
Mekanisme harga
Dalam ekonomi pasar, sumber daya dipandu oleh mekanisme harga. Harga melakukan tiga fungsi:
penyinyalan — harga memberi tahu pembeli dan penjual di mana sumber daya dibutuhkan. Harga yang naik berarti "ini dibutuhkan — produksikan lebih banyak".
insentif — harga yang lebih tinggi memberikan penghargaan kepada produsen, sehingga mereka ingin menyediakan lebih banyak barang tersebut.
rasionalisasi — ketika suatu barang langka, harga yang lebih tinggi membaginya kepada mereka yang bersedia dan mampu membayar.
Di pasar, harga melakukan tiga fungsi sekaligus — menyinyalkan, memberikan insentif, dan merasionalkan barang langka
Membandingkan sistem-sistem
Sistem
Kelebihan
Kekurangan
pasar
pilihan, harga rendah, insentif kuat untuk bekerja dan berinovasi
kesenjangan besar antara kaya dan miskin; beberapa barang tidak tersedia
terencana
kesenjangan antara kaya dan miskin lebih kecil; barang-barang utama disediakan untuk semua orang
insentif lemah; kelangkaan dan surplus; lambat berubah
campuran
mencoba mempertahankan的优点 dari kedua sistem
keseimbangan yang tepat sulit ditemukan
Secara praktik, tidak ada negara yang berada di ekstrem murni. Ekonomi Tiongkok, misalnya, secara resmi adalah ekonomi pasar sosialis, di mana pasar menetapkan sebagian besar harga sementara pemerintah membimbing sektor-sektor kunci dan dimiliki perusahaan-perusahaan besar. Setiap sistem nyata mencampurkan keduanya dan berada di somewhere pada spektrum di bawah ini.
Sistem ekonomi membentuk spektrum: pasar murni di satu ujung, perencanaan pemerintah penuh di ujung lain, dan ekonomi campuran di antaranya.
Production possibility curves · Kurva kemungkinan produksi
Syllabus · Silabus
English
draw and interpret PPCs to show opportunity cost, scarcity, choice and efficiency
explain movements along and shifts of the PPC and constant versus increasing opportunity cost
relate the PPC to economic growth and the allocation between capital and consumer goods
Bahasa Indonesia
gambar dan tafsirkan KPP untuk menunjukkan biaya peluang, kelangkaan, pilihan dan efisiensi
jelaskan pergerakan di sepanjang KPP dan pergeseran KPP serta biaya peluang konstan versus meningkat
hubungkan KPP dengan pertumbuhan ekonomi dan alokasi antara barang modal dan barang konsumsi
Source: Cambridge International syllabus · Sumber: Silabus Cambridge International
English
The PPF and opportunity cost
A production possibility curve 生产可能性曲线 (PPC) is a line showing the largest combinations of two goods an economy can make when all its resources are fully and well used.
Imagine an economy that makes only food and machines. The PPC is drawn with food on one axis and machines on the other.
a point on the curve: all resources are used with full efficiency 效率.
a point inside the curve: resources are wasted (for example, unemployment 失业 of workers). The economy could do better.
a point outside the curve: impossible today, because there are not enough resources. This shows scarcity.
Moving along the curve shows opportunity cost: to make more food, you must move resources away from machines, so you make fewer machines. This is the trade-off 取舍 between the two goods.
The shape of the curve shows how opportunity cost behaves:
a straight-line PPC means constant opportunity cost — each extra unit of food costs the same number of machines.
a curve that bows outwards means increasing opportunity cost — each extra unit of food costs more and more machines, because resources are not equally good at making both goods.
Shifts and growth
When the PPC moves outward (to the right), the economy can make more of both goods. This is economic growth 经济增长. It happens when there are more resources, or better ones (new technology 技术, a bigger or more skilled workforce). War or disaster can move the PPC inward — this is economic decline 经济衰退.
A country must also choose between two kinds of good now:
capital goods 资本品 — goods used to make other goods (machines, factories).
consumer goods 消费品 — goods people use directly (food, clothes).
Making more capital goods today means fewer consumer goods today. But more capital goods help the economy grow faster, so the PPC shifts out by more in the future.
Worked example. Why is a production possibility curve usually drawn concave (bowed outwards) rather than as a straight line? A straight line would mean the opportunity cost of each extra unit stays constant. The curve bows out because factors of production are not perfectly substitutable - they are specialised. Starting from all-food production, the first factors moved into making cars are the ones least suited to farming, so very little food is given up for a lot of cars. Keep going and you must move factors that are increasingly good at farming and increasingly bad at making cars, so each extra car costs more and more food. That rising cost is increasing opportunity cost, and the bowed shape is simply its picture. A straight-line PPC is not wrong - it just assumes factors are perfectly substitutable, and naming that assumption is what earns the mark.
Bahasa Indonesia
PPF dan biaya peluang
Kurva kemungkinan produksi (PPC) adalah garis yang menunjukkan kombinasi terbesar dua barang yang dapat dihasilkan suatu ekonomi ketika semua sumber dayanya digunakan sepenuhnya dan optimal.
Bayangkan sebuah ekonomi yang hanya memproduksi makanan dan mesin. PPC digambar dengan makanan pada satu sumbu dan mesin pada sumbu lainnya.
titik pada kurva: semua sumber daya digunakan dengan efisiensi penuh.
titik di dalam kurva: sumber daya terbuang (contohnya, pengangguran tenaga kerja). Ekonomi bisa berkinerja lebih baik.
sebuah titik di luar kurva: tidak mungkin saat ini, karena sumber daya tidak mencukupi. Ini menunjukkan kelangkaan.
Sebuah titik pada kurva menggunakan semua sumber daya (efisien); di dalam kurva berarti pemborosan, misal pengangguran; di luar belum mungkin terjadi.
Bergerak sepanjang kurva menunjukkan biaya peluang: untuk memproduksi lebih banyak pangan, Anda harus memindahkan sumber daya dari mesin, sehingga Anda menghasilkan lebih sedikit mesin. Ini adalah trade-off antara kedua barang tersebut.
Bentuk kurva menunjukkan bagaimana biaya peluang berperilaku:
PPC garis lurus berarti biaya peluang konstan — setiap tambahan unit pangan membutuhkan jumlah mesin yang sama.
kurva yang melengkung ke luar berarti biaya peluang meningkat — setiap tambahan unit pangan membutuhkan semakin banyak mesin, karena sumber daya tidak sama baiknya dalam membuat kedua barang tersebut.
PPC garis lurus berarti setiap tambahan unit pangan membutuhkan biaya yang sama; PPC melengkung berarti setiap tambahan unit membutuhkan semakin banyak mesin.
Pergeseran dan pertumbuhan
Ketika PPC bergerak ke luar (ke kanan), ekonomi dapat memproduksi lebih banyak dari kedua barang. Ini adalah pertumbuhan ekonomi. Hal ini terjadi ketika ada lebih banyak sumber daya, atau sumber daya yang lebih baik (teknologi baru, tenaga kerja yang lebih besar atau terampil). Perang atau bencana dapat menggeser PPC ke dalam — ini adalah penurunan ekonomi.
Sumber daya yang lebih banyak atau lebih baik menggeser seluruh PPC ke luar (pertumbuhan); perang atau bencana menggesernya ke dalam (penurunan).
Sebuah negara juga harus memilih antara dua jenis barang sekarang:
barang modal — barang yang digunakan untuk membuat barang lain (mesin, pabrik).
barang konsumsi — barang yang digunakan langsung oleh orang-orang (pangan, pakaian).
Memproduksi lebih banyak barang modal hari ini berarti lebih sedikit barang konsumsi hari ini. Namun, barang modal yang lebih banyak membantu ekonomi tumbuh lebih cepat, sehingga PPC bergeser keluar lebih jauh di masa depan.
Memilih lebih banyak barang modal hari ini berarti lebih sedikit barang konsumsi sekarang, tetapi PPC masa depan bergeser keluar lebih jauh.
Contoh worked. Mengapa kurva kemungkinan produksi biasanya digambar cekung (melengkung ke luar) alih-alih sebagai garis lurus? Garis lurus akan berarti biaya peluang setiap tambahan unit tetap konstan. Kurva melengkung ke luar karena faktor produksi tidak dapat saling menggantikan secara sempurna — mereka bersifat khusus. Memulai dari produksi pangan penuh, faktor pertama yang dialihkan untuk membuat mobil adalah faktor yang paling tidak sesuai untuk pertanian, sehingga sangat sedikit pangan dikorbankan untuk banyak mobil. Terus berlanjut dan Anda harus memindahkan faktor yang semakin baik dalam pertanian dan semakin buruk dalam membuat mobil, sehingga setiap tambahan mobil membutuhkan semakin banyak pangan. Kenaikan biaya ini adalah biaya peluang meningkat, dan bentuk melengkung hanyalah visualisasinya. PPC garis lurus tidak salah — itu hanya mengasumsikan faktor dapat saling menggantikan secara sempurna, dan menyebutkan asumsi itulah yang mendapat nilai.
Explore · Jelajahi
The production possibility frontier · Kurva kemungkinan produksi
Producing more of one good means giving up some of the other — that trade-off is the opportunity cost, shown by the slope of the frontier. · Memproduksi lebih banyak satu barang berarti mengorbankan sebagian dari yang lain — trade-off ini adalah biaya peluang, ditunjukkan oleh kemiringan kurva.
Explore · Jelajahi
Allocating scarce resources · Mengalokasikan sumber daya yang langka
An economy can't have more of everything: making more of one good means giving up some of another — the frontier's slope is that opportunity cost. · Suatu ekonomi tidak bisa memiliki lebih dari segalanya: memproduksi lebih banyak satu barang berarti mengorbankan sebagian barang lain — kemiringan frontier tersebut adalah biaya peluang.
Explore · Jelajahi
The production possibility curve · Kurva kemungkinan produksi
Move along the curve. Producing more of one good means producing less of the other — the curve shows opportunity cost and scarcity. · Gerakkan sepanjang kurva. Memproduksi lebih banyak satu barang berarti memproduksi lebih sedikit barang lainnya — kurva menunjukkan biaya peluang dan kelangkaan.
Types of goods and services · Jenis barang dan jasa
Syllabus · Silabus
English
distinguish free goods and economic (private) goods
explain the characteristics of public goods (non-rivalry, non-excludability) and the free-rider problem
explain merit and demerit goods and the role of information and value judgements
Bahasa Indonesia
bedakan barang gratis dan barang ekonomi (privat)
jelaskan karakteristik barang publik (non-rivalri, non-eksklusivitas) dan masalah penumpang bebas
jelaskan barang merit dan barang demerit serta peran informasi dan penilaian nilai
Source: Cambridge International syllabus · Sumber: Silabus Cambridge International
English
Free goods and economic goods
a free good 免费物品 has no opportunity cost. Its supply is unlimited, so it has no price (for example, air or sunlight).
an economic good 经济物品 (also called a private good 私人物品) is scarce. Making it has an opportunity cost, so it has a price.
A private good has two features. It has rivalry 竞争性 (if I eat the apple, you cannot) and excludability 排他性 (the seller can stop you using it unless you pay).
Public goods
A public good 公共物品 is the opposite of a private good. It has two features:
non-rivalry 非竞争性 — one person using it does not reduce the amount left for others.
non-excludability 非排他性 — you cannot stop people who do not pay from using it.
Because of non-excludability, public goods suffer from the free-rider problem 搭便车问题: people enjoy the good without paying for it. So private firms cannot make a profit and will not supply it. The government must provide public goods instead — for example, street lighting and national defence 国防.
Merit and demerit goods
a merit good 优值品 is better for you (and for society) than you realise, so people buy too little of it. Examples: education and health care.
a demerit good 劣值品 is worse for you than you realise, so people buy too much of it. Examples: cigarettes and alcohol.
People misjudge these goods because of information failure 信息失灵 — they do not have, or do not use, the full facts about the benefit or harm.
Deciding what counts as a merit or demerit good is partly a value judgement, so people may disagree about which goods belong on each list.
Bahasa Indonesia
Barang gratis dan barang ekonomi
barang gratis tidak memiliki biaya peluang. Penawarannya tak terbatas, sehingga tidak memiliki harga (misalnya udara atau sinar matahari).
barang ekonomi (juga disebut barang pribadi) langka. Memproduksinya memiliki biaya peluang, sehingga memiliki harga.
Barang pribadi memiliki dua fitur. Ia memiliki sifat rival (jika saya memakan apel, Anda tidak bisa) dan dapat dieksklusi (penjual dapat mencegah Anda menggunakannya kecuali Anda membayar).
Barang gratis tidak memiliki biaya peluang dan tidak memiliki harga; barang ekonomi langka, bersifat rival, dan dapat dieksklusi
Barang publik
Barang publik adalah kebalikan dari barang pribadi. Ia memiliki dua fitur:
non-rivalitas — satu orang menggunakannya tidak mengurangi jumlah yang tersisa bagi orang lain.
non-eksklusivitas — Anda tidak dapat mencegah orang yang tidak membayar untuk menggunakannya.
Karena non-eksklusivitas, barang publik menderita masalah penumpang bebas: orang menikmati barang tersebut tanpa membayarnya. Jadi perusahaan swasta tidak dapat menghasilkan keuntungan dan tidak akan menyediakannya. Pemerintah harus menyediakan barang publik sebagai gantinya — misalnya, penerangan jalan dan pertahanan nasional.
Rivalitas dan eksklusivitas memberikan empat jenis barang: pribadi, klub, sumber daya bersama, dan publik.
Barang merit dan demerit
barang merit lebih baik untuk Anda (dan masyarakat) daripada yang Anda sadari, sehingga orang membeli terlalu sedikit darinya. Contoh: pendidikan dan perawatan kesehatan.
barang demerit lebih buruk untuk Anda daripada yang Anda sadari, sehingga orang membeli terlalu banyak darinya. Contoh: rokok dan alkohol.
Pendidikan adalah barang merit klasik. Nilainya yang penuh — pekerjaan lebih baik, dan masyarakat yang lebih terampil — mudah diremehkan, sehingga jika dibiarkan sendiri, orang membeli lebih sedikit darinya daripada yang baik bagi mereka atau negara. Itulah mengapa pemerintah menyediakannya dan mensubsidinya
Orang menilai keliru barang-barang ini karena kegagalan informasi — mereka tidak memiliki, atau tidak menggunakan, fakta lengkap tentang manfaat atau bahayanya.
Menentukan apa yang dianggap sebagai barang merit atau demerit sebagian merupakan penilaian nilai, sehingga orang mungkin berbeda pendapat tentang barang mana yang termasuk dalam masing-masing daftar.
Explore · Jelajahi
Goods and services lab · Laboratorium barang dan jasa
Classify examples by rivalry, excludability or whether they are services. · Klasifikasikan contoh berdasarkan rivalitas, ekskludabilitas, atau apakah mereka merupakan jasa.
explain the determinants of demand and supply and distinguish movements along from shifts of the curves
derive individual and market demand and supply
explain the relationship between marginal utility and the demand curve
Bahasa Indonesia
jelaskan penentu permintaan dan penawaran serta bedakan pergerakan di sepanjang kurva dengan pergeseran kurva
turunkan permintaan dan penawaran individu serta pasar
jelaskan hubungan antara utilitas marjinal dan kurva permintaan
Source: Cambridge International syllabus · Sumber: Silabus Cambridge International
Demand shifts right: P and Q rise
demand 需求 is the quantity of a good that buyers are willing and able to buy at each price 价格 in a period of time. It is not just a wish — buyers must also be able to pay.
The law of demand says: when the price rises, the quantity demanded 需求量 falls; when the price falls, the quantity demanded rises. Price and quantity move in opposite directions.
So the demand curve 需求曲线 slopes downward, from top-left to bottom-right.
What shifts the demand curve
A change in the good's own price is shown as a movement along the demand curve. A change in any other cause shifts the whole curve to a new position — this is a shift 移动 of demand. The main causes (the determinants 决定因素) are:
income 收入 — for most goods, higher income raises demand.
the price of a substitute 替代品 — a good you can use instead (tea for coffee). If the substitute's price rises, demand for this good rises.
the price of a complement 互补品 — a good used together with this one (cars and petrol). If the complement's price rises, demand for this good falls.
tastes and fashion, the size of the population, and advertising.
A change in income, tastes or related prices shifts the whole curve ($D_1$ right, $D_2$ left); a change in the good's own price is a movement along it.
Individual and market demand
One consumer 消费者 has an individual demand. The market demand 市场需求 is found by adding up the quantity that all consumers want at each price (adding the curves sideways).
Marginal utility and demand
utility 效用 is the satisfaction you get from consuming a good. marginal utility 边际效用 is the extra utility from one more unit.
The law of diminishing marginal utility 边际效用递减 says each extra unit gives less extra satisfaction than the one before. Because later units are worth less to you, you will only buy them at a lower price. This is why the demand curve slopes downward.
Each extra unit adds less satisfaction than the last — so buyers will only pay less for later units, which is why demand slopes downward
Explore · Jelajahi
Demand & supply · Permintaan & Penawaran
Demand slopes down — a lower price, more is wanted. · Permintaan menurun ke bawah — harga lebih rendah, jumlah yang diinginkan lebih banyak.
supply 供给 is the quantity of a good that producers 生产者 are willing and able to sell at each price in a period of time.
The law of supply says: when the price rises, the quantity supplied 供给量 rises. Higher prices mean more profit 利润, so firms make more. So the supply curve 供给曲线 slopes upward.
What shifts the supply curve
A change in the good's own price is a movement along the supply curve. Other causes shift the whole curve:
costs of production 生产成本 — if wages, raw materials or rent get dearer, supply falls.
technology — better machines raise supply.
a subsidy 补贴 (government payment to producers) raises supply; an indirect tax lowers it.
the number of firms 企业 in the market, and weather (for farm goods).
Lower costs, better technology or a subsidy shift supply right ($S_1$); higher costs or a tax shift it left ($S_2$).
Individual and market supply
The market supply 市场供给 is found by adding up the quantity all firms will sell at each price.
Explore · Jelajahi
Demand & supply · Permintaan & Penawaran
Supply slopes up — a higher price, more is produced. · Penawaran meningkat ke atas — harga lebih tinggi, jumlah yang diproduksi lebih banyak.
define, calculate and interpret price elasticity of demand (PED), income elasticity (YED) and cross elasticity (XED)
explain the determinants of each and the relationship between PED and total revenue/expenditure
explain the usefulness of elasticities to firms and government
Bahasa Indonesia
definisikan, hitung dan tafsirkan elastisitas harga permintaan (EHP), elastisitas pendapatan (YED) dan elastisitas silang (XED)
jelaskan penentu masing-masing dan hubungan antara EHP dengan pendapatan total/pengeluaran
jelaskan kegunaan elastisitas bagi perusahaan dan pemerintah
Source: Cambridge International syllabus · Sumber: Silabus Cambridge International
Supply shifts right: P falls, Q rises
price elasticity of demand 需求价格弹性 (PED) measures how much the quantity demanded responds when the price changes.
$$\text{PED} = \frac{\%\ \text{change in quantity demanded}}{\%\ \text{change in price}}$$
PED is normally negative (because of the law of demand), but we usually look at the size and drop the minus sign.
Worked example. The price of a good rises by 10% and the quantity demanded falls by 25%. Find the PED and classify the demand.
$$\text{PED} = \frac{-25}{10} = -2.5$$
Ignoring the minus sign, $2.5 > 1$, so demand is elastic — quantity responded much more than the price did.
Petrol has price-inelastic demand: drivers must buy it, so a higher price cuts the quantity bought only a little.
Value
Name
Meaning
more than 1
elastic 富有弹性
quantity responds a lot
less than 1
inelastic 缺乏弹性
quantity responds a little
equal to 1
unit elastic 单位弹性
quantity changes by the same % as price
0
perfectly inelastic 完全无弹性
quantity does not change at all
infinity
perfectly elastic 完全有弹性
any price rise sends demand to zero
When demand is inelastic (steep), a price change barely moves quantity; when it is elastic (shallow), the same price change moves quantity a lot.
What makes demand elastic or inelastic
the number and closeness of substitutes (more substitutes → more elastic).
whether the good is a necessity 必需品 (inelastic) or a luxury 奢侈品 (elastic).
the share of income spent on the good (a large share → more elastic).
time — demand is more elastic in the long run, when buyers can find other options.
habit or addiction makes demand inelastic.
PED and total revenue
total revenue 总收益 is the money a firm earns: $\text{TR} = \text{price} \times \text{quantity}$. PED tells a firm what happens to revenue when it changes the price:
If demand is…
price rises
price falls
inelastic
total revenue rises
total revenue falls
elastic
total revenue falls
total revenue rises
unit elastic
total revenue stays the same
total revenue stays the same
This is useful to firms (how to price for more revenue) and to governments 政府 (a tax on an inelastic good, like petrol, raises a lot of revenue without cutting sales much).
explain equilibrium price and quantity and how shifts in demand and supply change equilibrium
explain disequilibrium (excess demand and excess supply) and the functions of the price mechanism
apply demand and supply analysis to product, factor and foreign exchange markets
Bahasa Indonesia
jelaskan harga dan kuantitas keseimbangan serta bagaimana pergeseran permintaan dan penawaran mengubah keseimbangan
jelaskan ketidakseimbangan (permintaan berlebih dan penawaran berlebih) serta fungsi mekanisme harga
terapkan analisis permintaan dan penawaran pada pasar produk, faktor dan valuta asing
Source: Cambridge International syllabus · Sumber: Silabus Cambridge International
In a market, buyers and sellers meet and the price settles where demand equals supply
Equilibrium
The market is in equilibrium 均衡 where the demand curve crosses the supply curve. Here demand equals supply. This gives the equilibrium price 均衡价格 and the equilibrium quantity 均衡数量. There is no pressure for the price to change.
At the equilibrium price $P^*$ and quantity $Q^*$ the curves cross, so quantity demanded equals quantity supplied.
Disequilibrium
When the price is not at equilibrium, the market is in disequilibrium 非均衡:
if the price is too low, there is excess demand 超额需求 (a shortage 短缺). Buyers compete, so the price is pushed up.
if the price is too high, there is excess supply 超额供给. Sellers cannot sell everything, so the price is pushed down.
In both cases the price moves back to equilibrium. This shows the price mechanism doing its jobs of signalling, rationing and giving an incentive.
Above the equilibrium price there is excess supply; below it there is excess demand (a shortage). Either way the price is pushed back to equilibrium.
How shifts change the equilibrium
Change
Effect on price
Effect on quantity
demand rises (shifts right)
rises
rises
demand falls (shifts left)
falls
falls
supply rises (shifts right)
falls
rises
supply falls (shifts left)
rises
falls
With supply fixed, a rise in demand ($D \to D_1$) raises both the equilibrium price and the equilibrium quantity.
Demand and supply in different markets
The same analysis works in many markets:
in product markets 产品市场, demand and supply set the price of goods and services.
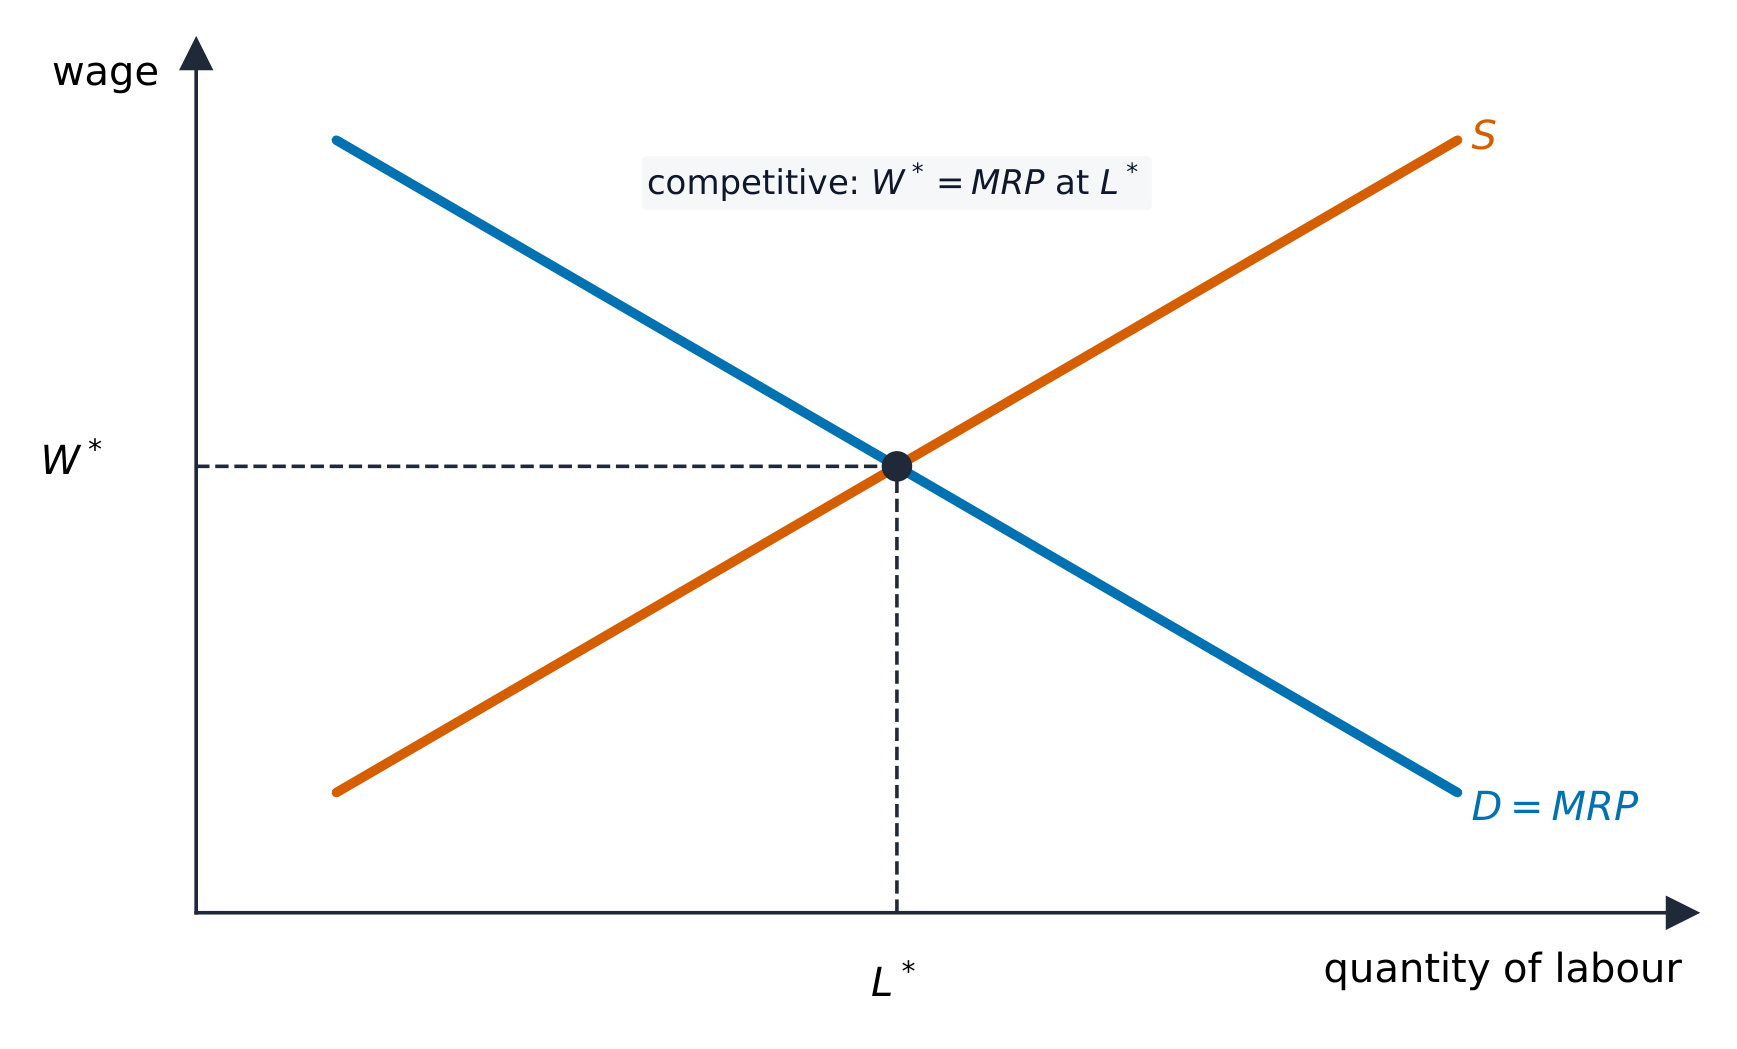
in factor markets 要素市场, they set the price of factors — for example, the demand for and supply of labour set the wage 工资.
in the foreign exchange market 外汇市场, the demand for and supply of a currency set the exchange rate 汇率 (the price of one currency in terms of another).
Explore · Jelajahi
Demand & supply · Permintaan & Penawaran
Where demand meets supply sets the equilibrium price and quantity. · Di mana permintaan bertemu penawaran menetapkan harga dan kuantitas keseimbangan.
Explore · Jelajahi
Finding the equilibrium price · Menemukan harga keseimbangan
Shift demand or supply and watch the equilibrium price and quantity move to where the two lines cross. · Geser permintaan atau penawaran dan saksikan harga keseimbangan serta kuantitas bergerak ke titik persimpangan kedua garis.
define and identify consumer surplus and producer surplus on a diagram
explain how changes in demand, supply and price affect consumer and producer surplus
Bahasa Indonesia
definisikan dan identifikasi surplus konsumen dan surplus produsen pada diagram
jelaskan bagaimana perubahan dalam permintaan, penawaran, dan harga memengaruhi surplus konsumen dan produsen
Source: Cambridge International syllabus · Sumber: Silabus Cambridge International
consumer surplus 消费者剩余 is the gain to buyers. It is the difference between the most a consumer was willing to pay and the price actually paid. On a diagram it is the area below the demand curve and above the price line.
producer surplus 生产者剩余 is the gain to sellers. It is the difference between the price a producer receives and the lowest price the producer would have accepted. On a diagram it is the area above the supply curve and below the price line.
Consumer surplus is the area below demand and above the price; producer surplus is the area above supply and below the price.
How they change:
if demand rises, the price and quantity rise, so producer surplus rises and consumer surplus usually rises too.
if supply rises, the price falls and quantity rises, so consumer surplus rises.
a higher price (with the curves fixed) raises producer surplus but lowers consumer surplus.
Together, consumer surplus plus producer surplus is the total welfare 福利 (gain to society) from the market. It is largest at the free-market equilibrium.
Explore · Jelajahi
Demand & supply · Permintaan & Penawaran
Surplus sits between the curves and the going price. · Surplus terletak di antara kurva dan harga berjalan.
explain market failure as the failure to achieve an efficient allocation of resources
explain the reasons for intervention: externalities, public goods, merit/demerit goods, monopoly power, inequality, asymmetric information
Bahasa Indonesia
jelaskan kegagalan pasar sebagai kegagalan dalam mencapai alokasi sumber daya yang efisien
jelaskan alasan untuk intervensi: eksternalitas, barang publik, barang merit/demerit, kekuatan monopoli, ketidaksetaraan, informasi asimetris
Source: Cambridge International syllabus · Sumber: Silabus Cambridge International
A free market often gives a good result, but not always. market failure 市场失灵 is when the market does not allocate 配置 (share out) resources efficiently — too much or too little of a good is made. Then the government may step in.
There are several reasons for market failure.
A coal power station: producing electricity can impose a negative externality such as pollution on people who are not part of the deal.
Externalities
An externality 外部性 is a cost or a benefit that falls on a third party 第三方 — someone who is not the buyer or the seller.
a negative externality 负外部性 is an external cost 外部成本 paid by others, like the pollution from a factory. The social cost 社会成本 (the cost to all of society) is bigger than the private cost 私人成本 (the cost to the producer). When people ignore the external cost, the market makes too much of the good.
a positive externality 正外部性 is an external benefit 外部收益 enjoyed by others, like the protection that vaccination gives to everyone. Here the market makes too little, because buyers ignore the benefit to others.
With a negative externality, social cost (MSC) is above private cost (MPC), so the market over-produces at $Q_m$ instead of the social optimum $Q^*$; the shaded triangle is the welfare loss.With a positive externality, social benefit (MSB) is above private benefit (MPB), so the market under-produces at $Q_m$ instead of the social optimum $Q^*$.
Public goods
A public good 公共物品 (like street lighting or national defence) has non-rivalry 非竞争性 and non-excludability 非排他性. Because non-payers cannot be shut out, there is a free-rider problem 搭便车问题, so private firms make no profit and supply none. The market fails completely.
Merit and demerit goods
A merit good 优值品 (like education) is under-consumed; a demerit good 劣值品 (like cigarettes) is over-consumed. People misjudge them because of information failure 信息失灵 — they do not know, or do not use, the true benefit or harm.
Monopoly power
monopoly 垄断 means one firm dominates a market. A firm with monopoly power 垄断势力 can cut output and raise the price above the competitive level. This wastes resources and harms consumers.
Inequality and asymmetric information
the market rewards people who own resources, so it can produce great inequality 不平等 — some people are left with too little to live on.
asymmetric information 信息不对称 is when one side of a deal knows more than the other (a used-car seller knows the faults; the buyer does not). This leads to poor decisions and unfair deals.
Explore · Jelajahi
The market and where it fails · Pasar dan di mana ia gagal
Supply and demand set the market price and quantity at their intersection. Market failure is when this free-market outcome is not the best one for society. · Penawaran dan permintaan menetapkan harga dan kuantitas pasar pada titik potongnya. Kegagalan pasar adalah ketika hasil pasar bebas ini bukan yang terbaik bagi masyarakat.
explain methods of intervention: indirect taxes, subsidies, maximum and minimum prices, buffer stocks, regulation, provision, tradable permits
analyse the effects of intervention, including the incidence of indirect taxes and the concept of government failure
Bahasa Indonesia
jelaskan metode intervensi: pajak tidak langsung, subsidi, harga maksimum dan minimum, stok penyangga, regulasi, penyediaan, izin dapat diperdagangkan
analisislah efek dari intervensi, termasuk beban pajak tidak langsung dan konsep kegagalan pemerintah
Source: Cambridge International syllabus · Sumber: Silabus Cambridge International
A maximum price creates a shortage
Indirect taxes
An indirect tax 间接税 is a tax on spending. It raises a firm's costs, shifts the supply curve to the left, and so raises the price and cuts the quantity. Governments tax demerit goods (like tobacco) and goods with negative externalities to make people use less.
Cigarettes are a demerit good — overconsumed because people misjudge the harm — so governments tax them heavily.
The incidence of a tax 税收归宿 is who really pays it. This depends on elasticity:
if demand is inelastic 缺乏弹性, consumers pay most of the tax (the price rises by nearly the full tax).
if demand is elastic 富有弹性, producers pay most of the tax (they cannot pass it on).
An indirect tax shifts supply up to $S+\text{tax}$, raising the price and cutting the quantity; the burden is shared between consumers and producers.
Subsidies
A subsidy 补贴 is a government payment to producers. It lowers their costs, shifts the supply curve to the right, and so lowers the price and raises the quantity. Subsidies are used for merit goods and goods with positive externalities.
A subsidy shifts supply down to $S+\text{subsidy}$, lowering the price and raising the quantity traded.
Maximum and minimum prices
a maximum price 最高限价 is a legal top price, set below equilibrium (for example, rent control). Because the price is held down, quantity demanded is greater than quantity supplied, so there is a shortage 短缺.
a minimum price 最低限价 is a legal bottom price, set above equilibrium (for example, a minimum wage, or a floor for farm prices). Because the price is held up, quantity supplied is greater than quantity demanded, so there is excess supply 超额供给.
A maximum price set below equilibrium leaves a shortage; a minimum price set above equilibrium leaves a surplus.
Buffer stocks
A buffer stock 缓冲库存 is used to steady the price of farm goods. The government buys and stores the good when the price is low, and sells from the store when the price is high. This keeps the price inside a target band.
A buffer stock holds the price in a band: the government buys when it hits the floor and sells when it hits the ceiling
Regulation, provision and permits
regulation 管制 means rules and laws — bans, age limits, safety standards, or pollution limits.
state provision 政府提供 means the government 政府 supplies a good directly, often free at the point of use (public goods and merit goods like schools and hospitals).
tradable permits 可交易许可证 set a total cap on pollution and give firms permits to pollute. Firms that pollute less can sell spare permits to firms that pollute more. This caps total pollution at the lowest cost.
Government failure
Intervention does not always help. government failure 政府失灵 is when the government's action makes the use of resources worse, not better. Common causes:
poor information, so the government sets the wrong tax or subsidy.
high cost of running the policy.
unintended results — for example, a maximum price can create an illegal black market 黑市.
decisions made for political reasons rather than for efficiency.
Worked example. A government puts a £2 per-packet tax on cigarettes, whose demand is very price-inelastic. Who really pays it, and what does that mean for the policy's two aims? The incidence falls mainly on whichever side is less able to respond - the more inelastic one. Because smokers keep buying almost the same quantity as the price rises, producers can pass most of the tax on, so consumers bear most of the incidence: the price might rise by about £1.80, with producers absorbing only about £0.20. That creates the tension the question is really testing. As a revenue raiser the tax succeeds: quantity barely falls, so revenue is large and steady. As a way of cutting consumption it largely fails - for exactly the same reason. And because poorer smokers spend a larger share of their income on it, the tax is regressive. Argue from elasticity to incidence, then judge each aim separately.
Explore · Jelajahi
Reasons for intervention · Alasan intervensi
Governments step into markets when the free-market equilibrium isn't the best outcome for society. · Pemerintah masuk ke pasar ketika keseimbangan pasar bebas bukan hasil terbaik bagi masyarakat.
distinguish income and wealth and explain the causes of inequality
explain policies to redistribute income and wealth (progressive taxation, benefits, provision of services) and their effects
Bahasa Indonesia
bedakan pendapatan dan kekayaan serta jelaskan penyebab ketimpangan
jelaskan kebijakan untuk mendistribusikan ulang pendapatan dan kekayaan (pajak progresif, tunjangan, penyediaan layanan) dan dampaknya
Source: Cambridge International syllabus · Sumber: Silabus Cambridge International
It helps to separate two ideas:
income 收入 is a flow 流量 — money received over a period, such as wages, rent and interest.
wealth 财富 is a stock 存量 — the value of assets owned at a point in time, such as houses, shares and savings.
Wealth produces income (savings earn interest), and income can be saved to build wealth, so the two are linked. Inequality has many causes: differences in skills and wages, the ownership of wealth, inheritance, and unemployment.
Policies to reduce inequality
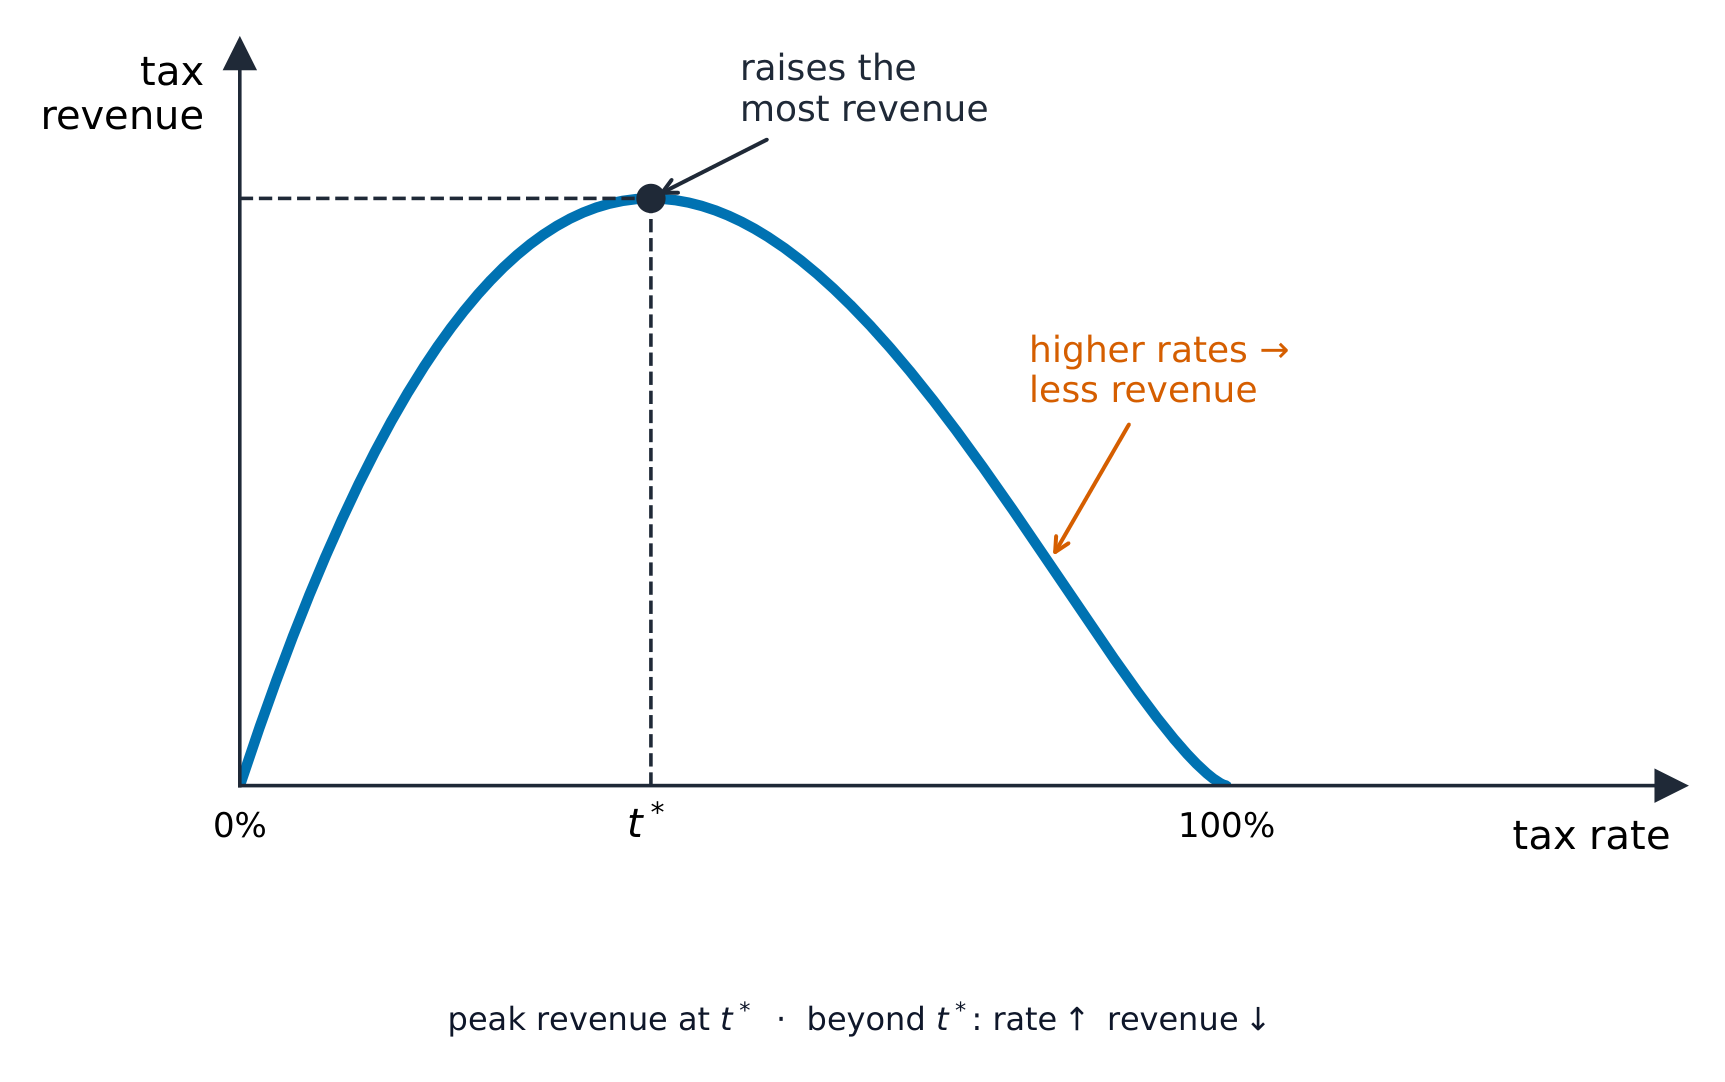
a progressive tax 累进税 takes a larger percentage 百分比 from higher incomes than from lower incomes. This narrows the gap after tax.
benefits 福利金 (also called transfer payments 转移支付) are money paid by the government to the poor, the old, and the unemployed.
state provision of free services, like education and health care, raises the real living standards of poorer people.
Together these policies bring about redistribution 再分配 — moving income and wealth from richer to poorer people. But there is a trade-off 取舍: very high taxes and large benefits may weaken the incentive 激励 to work and to invest.
Wealth and poverty side by side: markets alone may leave large income inequality unaddressed
Macroeconomics 宏观经济学 looks at the whole economy at once: its total output, its jobs, and its prices. This handout covers how we measure the economy and the main problems it can face.
4.1
National income statistics
Syllabus · Silabus
English
define GDP, GNI and national income and distinguish nominal and real, and total and per capita values
explain the uses and limitations of national income statistics for measuring living standards and making comparisons
Bahasa Indonesia
definisikan PDB, PNB dan pendapatan nasional serta bedakan nilai nominal dan nyata, serta total dan per kapita
jelaskan kegunaan dan keterbatasan statistik pendapatan nasional untuk mengukur standar hidup dan melakukan perbandingan
Source: Cambridge International syllabus · Sumber: Silabus Cambridge International
To judge how an economy is doing, we measure its national income 国民收入 — the total value of everything it produces in a year.
National income (GDP) is the value of all the goods and services a country produces in a year.
gross domestic product 国内生产总值 (GDP) is the value of all goods and services made inside a country in a year.
gross national income 国民总收入 (GNI) is GDP plus the income a country's people and firms earn abroad, minus income foreigners earn inside it.
Two important differences:
nominal 名义 values are measured at current prices. real 实际 values are adjusted to remove the effect of rising prices, so they show the true change in output. Always compare real values over time.
total values cover the whole country. per capita 人均 values are divided by the population, so they show the average per person.
Uses and limitations
National income is used to measure the standard of living 生活水平 and to compare countries. But it has limits:
it ignores the distribution 分配 of income — a high average can hide great inequality.
it leaves out unpaid work (housework) and the informal economy 非正规经济 (hidden, untaxed activity).
it says nothing about pollution, leisure time, or health.
So a higher GDP per capita usually means a better life, but not always.
GDP per capita shows average income and output, but misses distribution, unpaid work and pollution
Explore · Jelajahi
National income flow · Aliran pendapatan nasional
Watch spending become income, output and expenditure in the circular flow. · Perhatikan pengeluaran menjadi pendapatan, output, dan pengeluaran dalam aliran melingkar.
explain the circular flow of income with injections (investment, government spending, exports) and leakages (saving, taxation, imports)
explain equilibrium in the circular flow and the distinction between a closed and open economy
Bahasa Indonesia
jelaskan arus putar pendapatan dengan injeksi (investasi, pengeluaran pemerintah, ekspor) dan kebocoran (tabungan, perpajakan, impor)
jelaskan keseimbangan dalam arus putar dan perbedaan antara ekonomi tertutup dan terbuka
Source: Cambridge International syllabus · Sumber: Silabus Cambridge International
The circular flow of income
The circular flow of income 收入循环流 shows money moving around the economy. Households 家庭 supply factors of production to firms 企业 and receive income (wages, rent, interest, profit). They spend that income on goods and services, and the money flows back to firms.
Money also leaves and enters this flow:
leakages 漏出 take money out of the flow: saving 储蓄, taxation 税收, and spending on imports 进口.
injections 注入 put money into the flow: investment 投资, government spending 政府支出, and exports 出口.
The flow is in equilibrium 均衡 when total injections equal total leakages. If injections are greater, the economy grows; if leakages are greater, it shrinks.
Money loops between households and firms; leakages (saving, taxation, imports) drain it, while injections (investment, government spending, exports) add to it.
A closed economy 封闭经济 has no trade with other countries. An open economy 开放经济 trades, so it has exports and imports.
Explore · Jelajahi
Injections & leakages · Injeksi & kebocoran
Money loops between households and firms. Injections grow national income, leakages shrink it; they are equal at equilibrium. · Uang berputar antara rumah tangga dan perusahaan. Injeksi menambah pendapatan nasional, kebocoran menguranginya; keduanya sama pada keseimbangan.
Explore · Jelajahi
The circular flow of income · Aliran melingkar pendapatan
Money flows in a loop: households earn income from firms, then spend it back on the firms' goods. Step round the cycle. · Uang mengalir dalam siklus: rumah tangga mendapat pendapatan dari perusahaan, lalu menghabiskannya kembali untuk barang perusahaan. Putarlah mengelilingi siklus tersebut.
define the components of aggregate demand (C + I + G + (X−M)) and explain the shape of the AD curve
explain short-run and long-run aggregate supply and the determinants of AD and AS
use AD/AS analysis to determine macroeconomic equilibrium and the price level and real output
Bahasa Indonesia
definisikan komponen permintaan agregat (C + I + G + (X−M)) dan jelaskan bentuk kurva AD
jelaskan penawaran agregat jangka pendek dan jangka panjang serta faktor penentu AD dan AS
gunakan analisis AD/AS untuk menentukan keseimbangan makroekonomi dan tingkat harga serta output riil
Source: Cambridge International syllabus · Sumber: Silabus Cambridge International
Aggregate demand and supply
Aggregate demand
aggregate demand 总需求 (AD) is the total spending on a country's goods and services at each price level. It has four parts:
$$AD = C + I + G + (X - M)$$
C is consumption 消费 — spending by households.
I is investment — spending by firms on capital.
G is government spending.
(X − M) is net exports 净出口 — exports minus imports.
Aggregate demand is total spending: consumption, investment, government spending and net exports
The AD curve slopes downward: a lower price level means higher real spending, so a greater real output is demanded. AD shifts when any of its four parts changes (for example, a tax cut raises C).
Aggregate supply
aggregate supply 总供给 (AS) is the total output firms are willing to make at each price level.
short-run aggregate supply 短期总供给 (SRAS) slopes upward. In the short run, higher prices make production more profitable, so firms supply more. SRAS shifts when costs change (wages, raw materials, taxes).
long-run aggregate supply 长期总供给 (LRAS) shows the economy's full productive capacity 生产能力. It shifts only when the quantity or quality of factors changes.
Macroeconomic equilibrium
macroeconomic equilibrium 宏观经济均衡 is where AD crosses AS. It sets the price level 价格水平 and the real output 实际产出 of the economy. A shift in AD or AS changes both.
Equilibrium sets the price level $P$ and real output $Y$ where AD meets short-run AS; vertical LRAS marks full capacity.
distinguish actual and potential growth and explain the causes of economic growth
explain the costs and benefits of economic growth and the business (trade) cycle
Bahasa Indonesia
bedakan pertumbuhan aktual dan potensi serta jelaskan penyebab pertumbuhan ekonomi
jelaskan biaya dan manfaat pertumbuhan ekonomi serta siklus bisnis (perdagangan)
Source: Cambridge International syllabus · Sumber: Silabus Cambridge International
economic growth 经济增长 is a rise in a country's real output (real GDP) over time.
actual growth 实际增长 is the rise in output that really happens (a movement to a point further out, or from inside the LRAS towards it).
potential growth 潜在增长 is the rise in the economy's capacity (the LRAS shifting outward).
Growth is caused by more or better factors of production: a bigger or more skilled workforce, more investment in capital, new technology, and higher productivity 生产率 (output per worker).
The business cycle
Real output does not grow smoothly. The business cycle 经济周期 (also called the trade cycle) is the up-and-down pattern of output over the years. It has four phases: boom 繁荣 (fast growth), recession 衰退 (falling output), slump 萧条 (the low point), and recovery 复苏.
Real GDP swings through boom, recession, slump and recovery around its rising long-run trend.
Costs and benefits of growth
Benefits
Costs
higher incomes and living standards
can cause inflation if AD grows too fast
more jobs
pollution and use of resources
less poverty; more tax for public services
the gap between rich and poor may widen
Economic growth brings higher incomes and jobs, but can bring inflation, pollution and inequality
Explore · Jelajahi
Economic growth shifts the frontier out · Pertumbuhan ekonomi menggeser kurva batas produksi ke luar
Growth means the economy can produce more of BOTH goods — the whole frontier moves outward as resources or technology improve. · Pertumbuhan berarti ekonomi dapat memproduksi lebih banyak KEDUA jenis barang — seluruh kurva batas bergerak ke luar seiring perbaikan sumber daya atau teknologi.
define and measure unemployment (claimant count and labour force survey)
explain the types and causes of unemployment (frictional, structural, cyclical, seasonal) and its consequences
Bahasa Indonesia
definisikan dan ukur pengangguran (jumlah pengusul tunjangan dan survei tenaga kerja)
jelaskan jenis dan penyebab pengangguran (friksional, struktural, siklikal, musiman) serta konsekuensinya
Source: Cambridge International syllabus · Sumber: Silabus Cambridge International
unemployment 失业 means people who are able and willing to work, and are looking for a job, but cannot find one.
Measuring unemployment
the claimant count 申领救济人数 counts only people claiming unemployment benefits. It is cheap but misses those who do not claim.
the labour force survey 劳动力调查 asks a large sample whether they are working or seeking work. It follows an international standard, so it is better for comparing countries. The labour force 劳动力 is everyone working or looking for work.
Two ways to count the unemployed - and what each one misses
Types and causes
frictional unemployment 摩擦性失业 — short-term, while people move between jobs.
structural unemployment 结构性失业 — when an industry declines and workers' skills no longer match the jobs available.
cyclical unemployment 周期性失业 — caused by low AD in a recession. This is usually the largest type.
seasonal unemployment 季节性失业 — when work is only available at certain times of the year (such as farming or tourism).
Three types of unemployment: frictional, structural and cyclical
Consequences
Unemployment wastes output (the economy produces inside its PPC), lowers incomes, and costs the government (more benefits, less tax). It also harms families and can raise crime and ill health.
Explore · Jelajahi
Unemployment in the labour market · Pengangguran di pasar tenaga kerja
If the wage is stuck ABOVE the equilibrium, more workers want jobs than firms will hire — that gap is unemployment. · Jika upah tertahan DI ATAS titik keseimbangan, lebih banyak pekerja menginginkan pekerjaan daripada yang ingin disewa perusahaan — kesenjangan itulah pengangguran.
define inflation, deflation and disinflation and explain how the price level is measured
explain the causes (demand-pull and cost-push) and consequences of inflation and deflation
Bahasa Indonesia
definisikan inflasi, deflasi dan desinflasi serta jelaskan bagaimana tingkat harga diukur
jelaskan penyebab (tarikan permintaan dan dorongan biaya) serta konsekuensi inflasi dan deflasi
Source: Cambridge International syllabus · Sumber: Silabus Cambridge International
Inflation, deflation and disinflation
inflation 通货膨胀 is a sustained rise in the general price level. Money then buys less, so its purchasing power 购买力 falls.
deflation 通货紧缩 is a sustained fall in the general price level.
disinflation 反通货膨胀 is when inflation is still positive but is slowing down (prices rise, but more slowly).
Inflation is measured from the price of a basket of everyday goods like these.
The price level is measured with the consumer price index 消费者价格指数 (CPI). A typical household's spending is used to build a "basket" of goods. Each good is given a weight 权重 for how much is spent on it, and the change in the basket's cost from year to year is the inflation rate:
$$\text{inflation rate} = \frac{\text{change in index}}{\text{starting index}} \times 100\%.$$
Worked example. A country's CPI rises from $100$ to $104$ over one year, then to $107$ the year after. Find the inflation rate in each year.
Year 1: $\dfrac{104 - 100}{100} \times 100\% = 4\%$. Year 2: $\dfrac{107 - 104}{104} \times 100\% = 2.9\%$.
Notice that prices are still rising in year 2, just more slowly — this fall in the inflation rate (from $4\%$ to $2.9\%$) is disinflation, not deflation.
Worked example. A worker's wage rises from $\text{\pounds} 500$ to $\text{\pounds} 520$ a week (a $4\%$ rise) while the CPI rises by $4\%$. What happens to the real wage?
Money (nominal) pay is up $4\%$, but prices are also up $4\%$, so the real wage — what the pay can actually buy — is unchanged. A pay rise only raises living standards if it beats inflation.
Causes of inflation
demand-pull inflation 需求拉动型通货膨胀 — AD rises faster than AS, so "too much money chases too few goods".
cost-push inflation 成本推动型通货膨胀 — firms' costs rise (wages or raw materials), so they raise prices, shifting SRAS to the left.
Demand-pull inflation comes from AD shifting right; cost-push inflation comes from SRAS shifting left. Both raise the price level.
Consequences
Inflation lowers purchasing power, especially for people on fixed incomes. It creates uncertainty, can make a country's exports dearer, and helps borrowers but harms savers. Deflation sounds good but can be harmful: people delay buying (waiting for lower prices), so AD falls, firms cut output, and unemployment rises.
Explore · Jelajahi
Aggregate demand and supply · Permintaan dan penawaran agregat
The overall price level sits where aggregate demand meets aggregate supply — a shock to either moves prices and output. · Tingkat harga keseluruhan berada di tempat permintaan agregat bertemu penawaran agregat — guncangan pada salah satunya akan mengubah harga dan output.
Governments try to steer the whole economy. This handout covers what they aim for and the three sets of tools they use.
5.1
Macroeconomic policy objectives
Syllabus · Silabus
English
state the macroeconomic policy objectives: stable low inflation, full employment, economic growth, balance of payments stability, redistribution of income
explain potential conflicts between objectives
Bahasa Indonesia
nyatakan tujuan kebijakan makroekonomi: inflasi rendah yang stabil, pekerjaan penuh, pertumbuhan ekonomi, stabilitas neraca pembayaran, distribusi ulang pendapatan
jelaskan potensi konflik antar tujuan
Source: Cambridge International syllabus · Sumber: Silabus Cambridge International
A government usually has five main aims:
price stability 物价稳定 — low and steady inflation 通货膨胀 (often a target of about 2% a year).
full employment 充分就业 — jobs for almost everyone who wants to work.
economic growth 经济增长 — a rising real output over time.
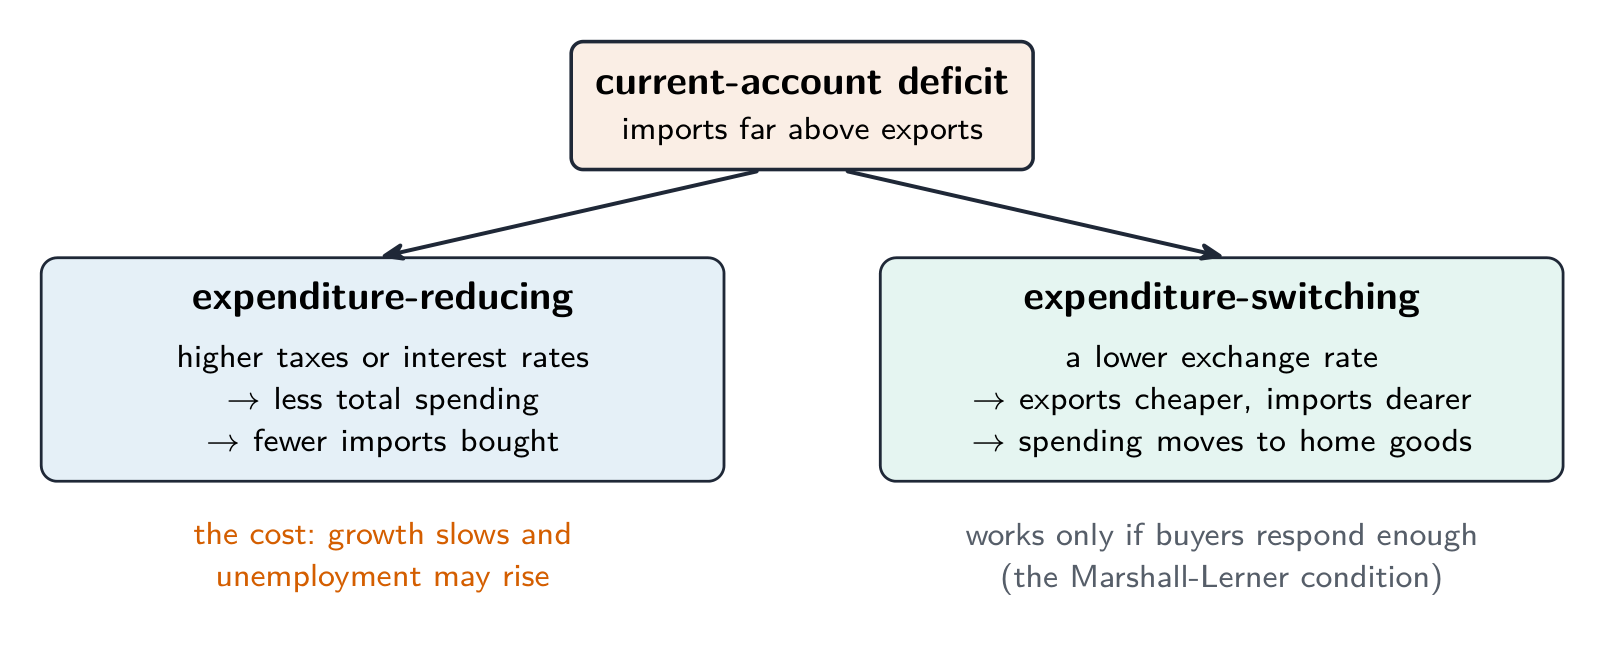
balance of payments 国际收支 stability — not importing far more than the country exports for years on end.
redistribution of income 收入再分配 — narrowing the gap between rich and poor.
Conflicts between objectives
The aims can conflict 冲突 — reaching one can hurt another:
growth versus inflation: fast growth raises aggregate demand 总需求, which can pull prices up.
growth versus the balance of payments: as incomes rise, people buy more imports, worsening the trade balance.
unemployment versus inflation: cutting unemployment by raising demand can cause more inflation.
growth versus the environment: more output often means more pollution.
Chasing fast growth can pull against price stability, the balance of payments and the environment
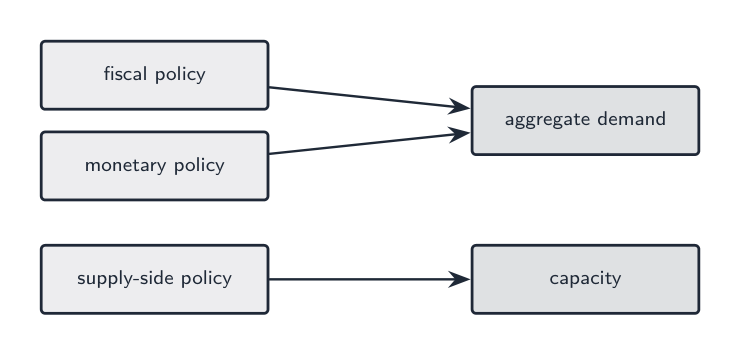
The government has three sets of tools. Fiscal and monetary policy are demand-side policies 需求侧政策 (they work on AD). Supply-side policy works on aggregate supply 总供给.
Fiscal and monetary policy work on aggregate demand; supply-side policy works on aggregate supply
Explore · Jelajahi
Macro objective lab · Laboratorium tujuan makro
Classify policy examples by the macroeconomic objective they target. · Klasifikasikan contoh kebijakan berdasarkan tujuan makroekonomi yang dituju.
explain fiscal policy (government spending and taxation) and the budget balance
distinguish direct and indirect taxes and progressive, proportional and regressive taxes
explain the use and effectiveness of fiscal policy
Bahasa Indonesia
jelaskan kebijakan fiskal (pengeluaran pemerintah dan perpajakan) serta neraca anggaran
bedakan pajak langsung dan tidak langsung serta pajak progresif, proporsional dan regresif
jelaskan penggunaan dan efektivitas kebijakan fiskal
Source: Cambridge International syllabus · Sumber: Silabus Cambridge International
fiscal policy 财政政策 is the use of government spending and taxation to influence the economy.
Governments use fiscal policy — government spending and taxation, set through the legislature — to steer the economy.
The budget 预算 compares the two:
a budget deficit 预算赤字 is when spending is greater than tax revenue. The government must borrow, adding to the national debt 国债.
a budget surplus 预算盈余 is when tax revenue is greater than spending.
Types of tax
a direct tax 直接税 is paid straight to the government on income or profit (income tax, corporation tax).
an indirect tax 间接税 is a tax on spending (added to the price of goods).
Taxes are also grouped by how the rate changes with income:
Type
How it works
progressive tax 累进税
the rate rises as income rises (the rich pay a larger share)
proportional tax 比例税
the rate stays the same at every income
regressive tax 累退税
the rate falls as income rises (the poor pay a larger share)
Under a progressive tax the average rate rises with income; under a proportional tax it stays flat; under a regressive tax it falls.
Using fiscal policy
expansionary 扩张性 fiscal policy raises government spending or cuts taxes. This raises AD, to fight a recession and unemployment.
contractionary 紧缩性 fiscal policy cuts spending or raises taxes. This lowers AD, to fight inflation.
Expansionary fiscal or monetary policy shifts AD right, raising output and the price level; contractionary policy does the reverse.
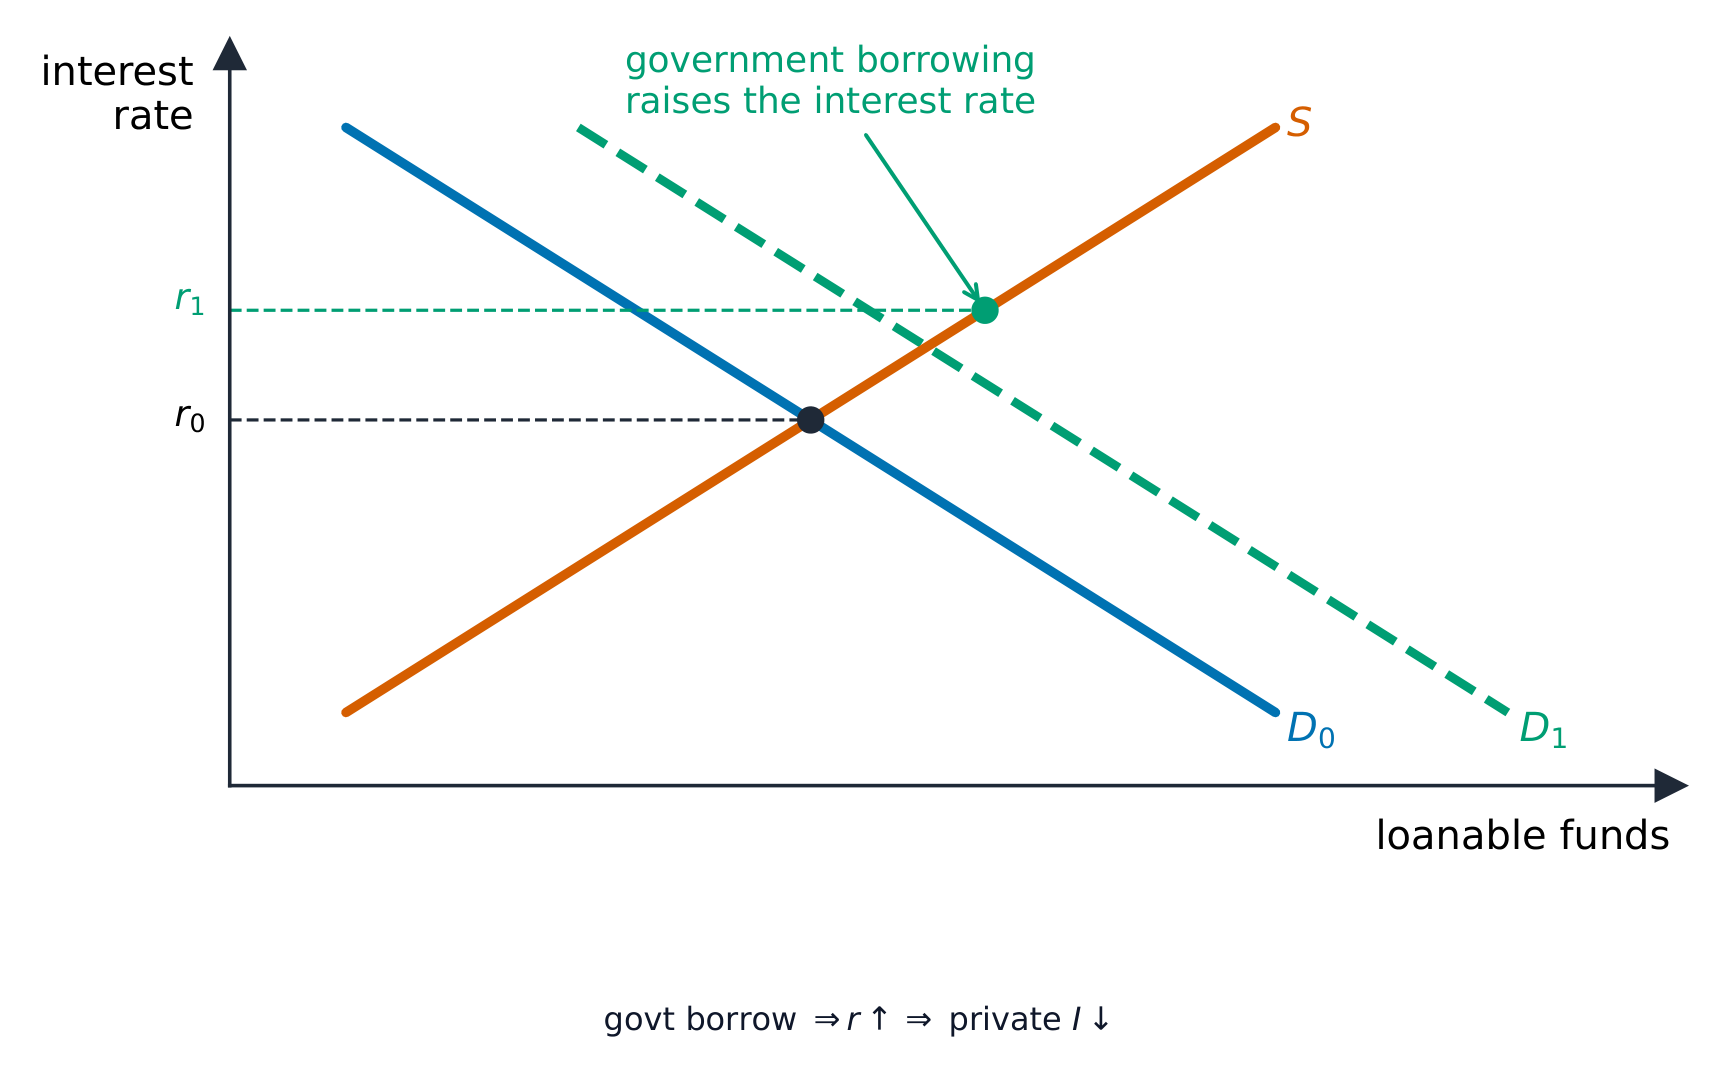
Effectiveness. Fiscal policy can act fast on AD, but it has problems: time lags (a budget is set once a year), large deficits and debt, and crowding out 挤出效应 — when heavy government borrowing pushes up interest rates and reduces private investment.
Explore · Jelajahi
Fiscal policy shifts AD · Kebijakan fiskal menggeser AD
Government spending and taxes move aggregate demand (AD). Drag AD to see real output and the price level change. · Pembelajaan pemerintah dan pajak menggerakkan permintaan agregat (AD). Seret AD untuk melihat perubahan output riil dan tingkat harga.
explain monetary policy (interest rates, money supply, exchange rate) and the role of the central bank
explain the transmission mechanism and the effectiveness of monetary policy
Bahasa Indonesia
jelaskan kebijakan moneter (suku bunga, penyediaan uang, kurs mata uang) dan peran bank sentral
jelaskan mekanisme transmisi dan efektivitas kebijakan moneter
Source: Cambridge International syllabus · Sumber: Silabus Cambridge International
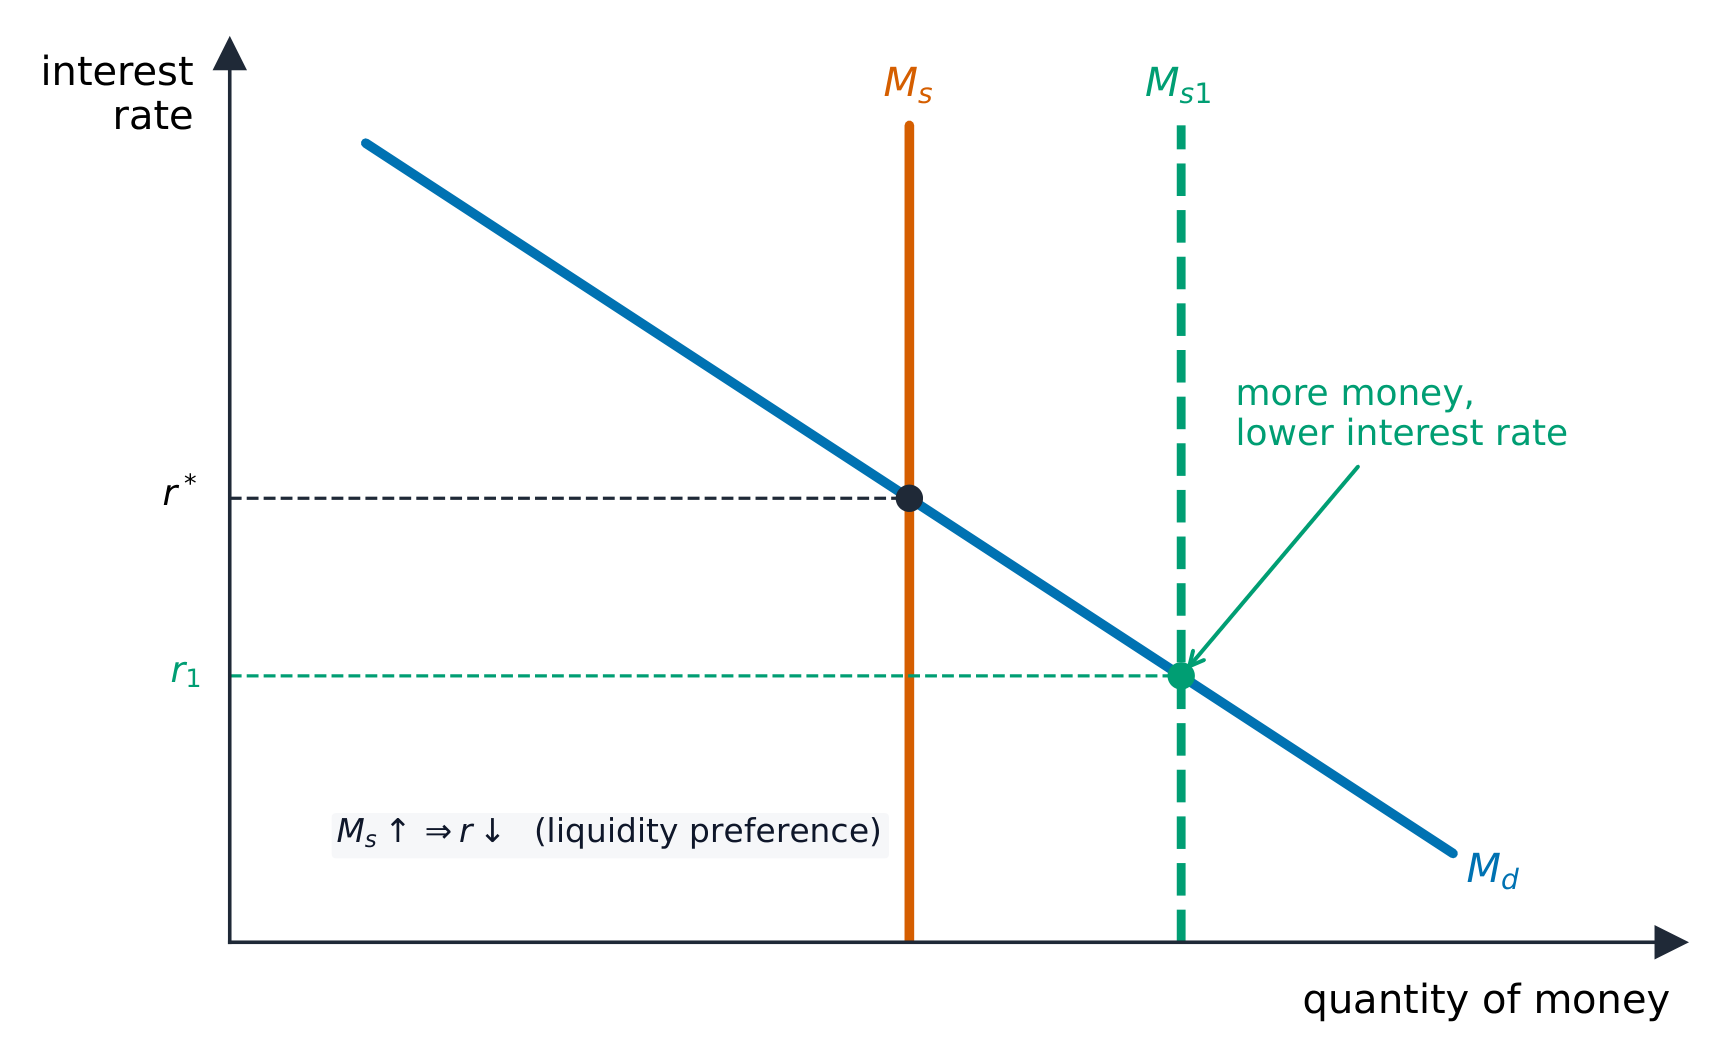
monetary policy 货币政策 is run by the central bank 中央银行. Its main tool is the interest rate 利率, but it can also change the money supply 货币供给 or influence the exchange rate 汇率.
A central bank, like the Bank of England, sets the interest rate — the main tool of monetary policy.
The transmission mechanism
The transmission mechanism 传导机制 is how a change in the interest rate reaches the wider economy. If the central bank raises the interest rate:
borrowing becomes dearer, so households and firms spend and invest less.
saving is rewarded, so people spend less.
the currency tends to rise, so exports fall.
All of these lower AD, which slows inflation. A cut in the interest rate does the opposite, raising AD.
A higher interest rate works through three channels to cut spending, investment and exports, lowering AD and slowing inflation.
Effectiveness. Monetary policy is flexible (the rate can change at any time), but it works with a time lag of a year or more. In a deep slump, even very low rates may not make worried firms and households borrow.
Explore · Jelajahi
Monetary policy shifts AD · Kebijakan moneter menggeser AD
Changing interest rates moves aggregate demand. Lower rates → more borrowing and spending → AD shifts right. · Perubahan suku bunga menggerakkan permintaan agregat. Suku bunga turun → lebih banyak peminjaman dan belanja → AD bergeser ke kanan.
explain supply-side policies (market-based and interventionist: education and training, incentives, privatisation, deregulation, infrastructure)
explain the use and effectiveness of supply-side policy
Bahasa Indonesia
jelaskan kebijakan sisi penawaran (berbasis pasar dan intervensi: pendidikan dan pelatihan, insentif, privatisasi, ** deregulasi**, infrastruktur)
jelaskan penggunaan dan efektivitas kebijakan sisi penawaran
Source: Cambridge International syllabus · Sumber: Silabus Cambridge International
supply-side policy 供给侧政策 tries to raise the economy's productive capacity 生产能力 — to shift long-run aggregate supply to the right. It aims to make markets work better and raise productivity 生产率.
Supply-side policy raises capacity, shifting LRAS right: real output rises and the price level falls — growth with lower inflation.
There are two kinds.
Market-based policies let markets work more freely:
cutting income tax and benefits to strengthen the incentive 激励 to work.
privatisation 私有化 — selling state firms to private owners, who run them for profit.
deregulation 放松管制 — removing rules that block competition.
Interventionist policies use the government directly:
spending on education and training 培训 to raise workers' skills.
spending on infrastructure 基础设施 — roads, ports and broadband.
support for research and new technology.
Effectiveness. Supply-side policy is powerful because it can raise growth and lower inflation at the same time, with no trade-off. But it is slow (education takes years to pay off), costly, and some measures, like cutting benefits, can widen inequality.
Worked example. An economy is in a deep recession with a large output gap, and interest rates are already near zero. Which policy should the government use, and why is the other one weak here? Monetary policy is weak: with the base rate already near zero there is almost no room to cut further, and even cheap credit will not make firms invest when they expect no demand. Fiscal policy is stronger: government spending raises aggregate demand directly, without waiting for anyone to choose to borrow, and the multiplier means each pound spent raises national income by more than a pound as it is re-spent. Weigh the costs against it - a bigger budget deficit and rising debt, plus time lags on large projects. Match the policy to the constraint named in the question: here it is the zero lower bound, and that is precisely what makes fiscal policy the answer.
Explore · Jelajahi
Supply-side policy shifts AS · Kebijakan sisi penawaran menggeser AS
Supply-side policies raise the economy's productive capacity — aggregate supply (AS) shifts right, lowering the price level at higher output. · Kebijakan sisi penawaran meningkatkan kapasitas produktif ekonomi — penawaran agregat (AS) bergeser ke kanan, menurunkan tingkat harga pada output yang lebih tinggi.
explain absolute and comparative advantage and the gains from specialisation and trade
explain the terms of trade and the benefits and limitations of trade theory
Bahasa Indonesia
jelaskan keunggulan mutlak dan komparatif serta keuntungan dari spesialisasi dan perdagangan
jelaskan suku perdagangan dan manfaat serta keterbatasan teori perdagangan
Source: Cambridge International syllabus · Sumber: Silabus Cambridge International
international trade 国际贸易 lets countries buy and sell with each other. Trade lets each country specialise 专业化 in what it makes best, so the world makes more in total.
A container port: international trade moves goods between countries in huge volumes
Absolute and comparative advantage
a country has an absolute advantage 绝对优势 in a good if it can make more of it with the same resources than another country.
a country has a comparative advantage 比较优势 in a good if it can make it at a lower opportunity cost 机会成本 than another country.
Comparative advantage is the key idea: a country should make the goods it gives up least to produce, and trade for the rest. Look at this example, where each country uses the same resources:
Country
Wine (units)
Cloth (units)
Country A
20
10
Country B
5
5
Country A is better at both (absolute advantage in both). But think about opportunity cost:
in A, making 1 cloth means giving up 2 wine.
in B, making 1 cloth means giving up 1 wine.
So B gives up less to make cloth — B has the comparative advantage in cloth. A has it in wine. If A makes only wine and B makes only cloth, and they trade, both can end up with more than before.
Country A can make more of both goods, but its PPC is steeper: it gives up 2 wine per cloth, while B gives up only 1, so B has the comparative advantage in cloth.
Terms of trade
The terms of trade 贸易条件 measure the price of a country's exports compared with the price of its imports. It is worked out as an index:
$$\text{terms of trade} = \frac{\text{index of export prices}}{\text{index of import prices}} \times 100.$$
If export prices rise faster than import prices, the terms of trade "improve" — the country can buy more imports for the same exports.
Worked example. Over a year, a country's export price index rises from $100$ to $110$, while its import price index rises from $100$ to $105$. Find the new terms of trade.
$$\text{terms of trade} = \frac{110}{105} \times 100 = 104.8.$$
The figure is above $100$, so the terms of trade have improved: each unit of exports now buys about $4.8\%$ more imports than before.
Limits of the theory
The gains are real, but the simple theory assumes no transport costs, no trade barriers, and that costs do not change with output. In the real world these do not fully hold, and specialising in one good is risky if its price falls.
Explore · Jelajahi
Why countries trade · Mengapa negara berdagang
Each country specialises where its opportunity cost is lowest, then trades — both can consume beyond their own frontier. · Setiap negara berspesialisasi di mana opportunity cost-nya terendah, lalu berdagang — keduanya dapat mengonsumsi melampaui batas kemampuan sendiri.
describe tools of protection (tariffs, quotas, subsidies, embargoes, administrative barriers)
explain the arguments for and against protectionism and its effects on stakeholders
Bahasa Indonesia
deskripsikan alat proteksi (tarif, kuota, subsidi, embargo, hambatan administratif)
jelaskan argumen pro dan kontra proteksionisme serta dampaknya pada para pemangku kepentingan
Source: Cambridge International syllabus · Sumber: Silabus Cambridge International
protectionism 贸易保护主义 means a government protecting home producers from foreign competition. The main tools:
Three tools of protection: tariffs, quotas and subsidies
a tariff 关税 — a tax on imports, which raises their price.
a quota 配额 — a legal limit on the quantity of a good that may be imported.
a subsidy 补贴 to home producers, so they can sell more cheaply than foreign rivals.
an embargo 禁运 — a complete ban on trade with a country or in a good.
administrative barriers 行政壁垒 — extra paperwork and tough standards that make importing hard.
A tariff raises the price from the world price to "world price + tariff": domestic supply rises, demand falls, and imports shrink; the shaded box is the government's tariff revenue.
For and against
Arguments for protection include protecting an infant industry 幼稚产业 (a young industry that needs time to grow), saving jobs, and stopping dumping 倾销 (foreign firms selling below cost to destroy local rivals).
Arguments against are strong: protection raises prices for consumers, protects weak firms so they stay inefficient, and can lead to retaliation 报复 — other countries hitting back with their own barriers.
Effects on stakeholders
A tariff affects each stakeholder 利益相关者 differently: home producers gain, the government gains tariff revenue, but consumers lose (higher prices, less choice) and foreign producers lose sales.
Explore · Jelajahi
Protectionism in the market · Proteksionisme di pasar
A tariff or quota shifts effective supply and raises the domestic price, protecting home producers but costing consumers. Shift the lines to see it. · Tarif atau kuota menggeser penawaran efektif dan menaikkan harga domestik, melindungi produsen lokal namun merugikan konsumen. Geser garis untuk melihatnya.
describe the structure of the balance of payments and the components of the current account (trade in goods and services, primary and secondary income)
explain the causes and consequences of current account deficits and surpluses
Bahasa Indonesia
deskripsikan struktur neraca pembayaran dan komponen akun berjalan (perdagangan barang dan jasa, pendapatan primer dan sekunder)
jelaskan penyebab dan konsekuensi defisit dan surplus akun berjalan
Source: Cambridge International syllabus · Sumber: Silabus Cambridge International
The balance of payments 国际收支 is a record of all money flows between one country and the rest of the world. Its most-studied part is the current account 经常账户, which has four parts:
trade in goods 货物贸易 — exports and imports of physical goods.
trade in services 服务贸易 — exports and imports of services (tourism, banking).
primary income 初次收入 — income from work and investment abroad (wages, profit, interest).
secondary income 二次收入 — transfers with nothing given back, like foreign aid.
The current account adds up four flows: trade in goods and services, plus primary income (from work and investment) and secondary income (transfers)
A current account deficit 经常账户赤字 means a country buys more from abroad than it sells. A current account surplus 经常账户盈余 is the opposite. A long deficit can mean rising debt to other countries; a large surplus can mean the country saves a lot but consumes little.
Explore · Jelajahi
Current account flow · Arus akun berjalan
Track exports, imports and income flows into the current account. · Lacak ekspor, impor, dan arus pendapatan ke dalam akun berjalan.
explain the determination of floating exchange rates by demand and supply of currency, and fixed and managed systems
explain the causes and effects of appreciation and depreciation on the economy
Bahasa Indonesia
jelaskan penentuan kurs mengambang oleh permintaan dan penawaran mata uang, serta sistem tetap dan kelolaan
jelaskan penyebab dan efek peningkatan nilai dan penurunan nilai terhadap perekonomian
Source: Cambridge International syllabus · Sumber: Silabus Cambridge International
Exchange rates: appreciation
An exchange rate 汇率 is the price of one currency in terms of another. There are three main systems.
A currency exchange: the exchange rate is the price of one currency in terms of another.
a floating exchange rate 浮动汇率 is set freely by the demand for and supply of the currency. If more people want a currency (to buy its exports), its value rises.
a fixed exchange rate 固定汇率 is held at a set value by the central bank, which buys and sells the currency to keep it there.
a managed exchange rate 管理浮动汇率 mostly floats, but the central bank steps in now and then to steady it.
A floating exchange rate is set where demand for the currency meets supply. More demand for pounds ($D \to D_1$) raises the rate — an appreciation.
Appreciation and depreciation
Under floating rates:
appreciation 升值 is a rise in the currency's value. Exports become dearer for foreigners, and imports become cheaper.
depreciation 贬值 is a fall in the currency's value. Exports become cheaper, and imports become dearer.
A depreciation can therefore raise export sales and cut imports, helping the current account — but it can also raise inflation, because imports cost more.
Worked example. Suppose the exchange rate is $\text{\pounds} 1 = \$1.40$.
A UK exporter's $\text{\pounds} 200$ machine costs an American buyer $\text{\pounds} 200 \times 1.40 = \$280$. If the pound then appreciates to $\text{\pounds} 1 = \$1.60$, the same machine costs $\text{\pounds} 200 \times 1.60 = \$320$ — dearer for the American, so fewer are sold. Going the other way, a $\$700$ invoice from a US supplier costs a UK firm $\$700 \div 1.40 = \text{\pounds} 500$.
Explore · Jelajahi
The foreign-exchange market · Pasar valuta asing
A currency has its own market. More demand for £ (or less supply) pushes the exchange rate up — it appreciates. · Setiap mata uang memiliki pasarnya sendiri. Permintaan lebih besar terhadap £ (atau penawaran lebih sedikit) mendorong kurs naik — ia mengalami apresiasi.
explain expenditure-switching and expenditure-reducing policies and supply-side measures to correct a deficit
evaluate the effectiveness of these policies
Bahasa Indonesia
jelaskan kebijakan pergeseran pengeluaran dan pengurangan pengeluaran serta langkah sisi penawaran untuk memperbaiki defisit
evaluasi efektivitas kebijakan-kebijakan ini
Source: Cambridge International syllabus · Sumber: Silabus Cambridge International
A government can use three kinds of policy to cut a deficit:
expenditure-reducing 支出减少 policies lower total demand (higher taxes or interest rates), so people buy fewer imports. But they also slow growth and raise unemployment.
expenditure-switching 支出转换 policies move spending away from imports towards home goods (a tariff, or a lower exchange rate). But they can cause retaliation or inflation.
supply-side policies raise the competitiveness 竞争力 of home firms (better skills and technology), so exports rise. These work best in the long run but are slow.
Trade flows at a container port: a current account deficit means imports of goods and services exceed exports
Explore · Jelajahi
Current account flow · Arus akun berjalan
Track exports, imports and income flows into the current account. · Lacak ekspor, impor, dan arus pendapatan ke dalam akun berjalan.
This topic looks more deeply at consumers, costs and firms.
7.1
Utility and consumer choice
Syllabus · Silabus
English
explain total and marginal utility and the law of diminishing marginal utility
derive the equi-marginal principle and explain how it relates to the demand curve, including the limitations of the marginal utility approach
Bahasa Indonesia
jelaskan utilitas total dan margin serta hukum utilitas marginal yang semakin menurun
turunkan prinsip ekuimarginal dan jelaskan hubungannya dengan kurva permintaan, termasuk keterbatasan pendekatan utilitas margin
Source: Cambridge International syllabus · Sumber: Silabus Cambridge International
utility 效用 is the satisfaction a consumer gets from a good.
Consumers spend a limited income to get the most utility (satisfaction) they can.
total utility 总效用 is the satisfaction from all the units consumed.
marginal utility 边际效用 is the extra satisfaction from one more unit.
The law of diminishing marginal utility 边际效用递减 says each extra unit gives less extra satisfaction. Total utility still rises, but more and more slowly.
As more is consumed, total utility rises but flattens, because marginal utility falls — each extra unit adds less satisfaction.
The equi-marginal principle
A consumer with a fixed budget gets the most total utility when the last dollar spent on each good gives the same extra utility. This is the equi-marginal principle 等边际原则:
$$\frac{MU_A}{P_A} = \frac{MU_B}{P_B}$$
Because marginal utility falls as you buy more, you only buy extra units when the price falls. This is why the demand curve 需求曲线 slopes downward.
Utility is maximised when the last dollar on each good gives the same extra utility
Limitations
The approach is hard to use in practice: utility cannot really be measured in numbers, and people do not calculate like this. It also ignores habit and advertising.
total utility rises more slowly as quantity increases · total utilitas naik lebih lambat seiring peningkatan kuantitas
Add units consumed and see why extra satisfaction usually falls. · Tambahkan unit yang dikonsumsi dan lihat mengapa kepuasan tambahan biasanya turun.
explain indifference curves and budget lines and consumer equilibrium
explain income and substitution effects for normal, inferior and Giffen goods
Bahasa Indonesia
jelaskan kurva indiferen dan garis anggaran serta keseimbangan konsumen
jelaskan efek pendapatan dan substitusi untuk barang normal, inferior dan Giffen
Source: Cambridge International syllabus · Sumber: Silabus Cambridge International
An indifference curve 无差异曲线 shows all the combinations of two goods that give a consumer the same total utility. It slopes downward (more of one good means less of the other) and bows in towards the origin.
A budget line 预算线 shows all the combinations the consumer can just afford with their income, at the current prices.
consumer equilibrium 消费者均衡 is the best the consumer can do: the point where the budget line just touches the highest possible indifference curve.
The consumer's best choice is where the budget line is tangent to the highest reachable indifference curve; a higher curve is unaffordable.
Income and substitution effects
When the price of a good falls, the consumer buys more for two reasons:
the substitution effect 替代效应 — the good is now cheaper than others, so the consumer switches towards it.
the income effect 收入效应 — the consumer's money now buys more, so real income has risen.
These effects work differently for different goods:
for a normal good 正常品, both effects raise the quantity bought.
for an inferior good 低档品, the income effect works the other way (higher real income lowers demand), but it is usually weaker, so demand still rises when price falls.
a Giffen good 吉芬品 is a rare, very inferior good where the income effect is so strong that demand actually falls when the price falls. Its demand curve slopes upward.
Explore · Jelajahi
Budget line lab · Lab garis anggaran
good B = income / priceB - slope x good A · barang B = pendapatan / hargaB - kemiringan x barang A
Move quantity of one good and see the trade-off with the other good. · Gerakkan jumlah satu barang dan lihat pengorbanannya dengan barang lainnya.
explain productive and allocative efficiency, Pareto optimality and dynamic efficiency
explain market failure, including from monopoly, externalities, public goods, information failure and factor immobility
Bahasa Indonesia
jelaskan efisiensi produktif dan efisiensi alokatif, optimalitas Pareto serta efisiensi dinamis
jelaskan kegagalan pasar, termasuk yang disebabkan oleh monopoli, eksternalitas, barang publik, kegagalan informasi dan ketidakfleksibilitas faktor produksi
Source: Cambridge International syllabus · Sumber: Silabus Cambridge International
Economists judge how well resources are used.
Productive efficiency is lowest cost; allocative is making what people want
productive efficiency 生产效率 — making goods at the lowest possible cost (using the fewest resources).
allocative efficiency 配置效率 — making the goods people most want, where price equals marginal cost.
Pareto optimality 帕累托最优 — a point where no one can be made better off without making someone else worse off.
dynamic efficiency 动态效率 — improving over time through new technology and better products.
market failure 市场失灵 happens when the free market does not reach an efficient result. The main causes are monopoly power, externalities 外部性, public goods 公共物品, information failure 信息失灵, and factor immobility 要素不流动性 (factors cannot move quickly to where they are needed).
Explore · Jelajahi
Allocative efficiency · Efisiensi alokasi
The market is allocatively efficient where supply meets demand — price equals marginal cost. Market failure pushes it away from that point. · Pasar bersifat alokatif efisien di mana penawaran bertemu permintaan — harga sama dengan biaya marjinal. Kegagalan pasar menjauhkannya dari titik tersebut.
distinguish private, external and social costs and benefits
analyse positive and negative externalities of production and consumption using marginal analysis and explain deadweight welfare loss
Bahasa Indonesia
bedakan biaya dan manfaat pribadi, eksternal dan sosial
analisis eksternalitas positif dan negatif dari produksi dan konsumsi menggunakan analisis marjinal dan jelaskan kerugian kesejahteraan mati (deadweight welfare loss)
Source: Cambridge International syllabus · Sumber: Silabus Cambridge International
Some costs and benefits fall on people outside the deal. We separate three levels:
a private cost 私人成本 or private benefit 私人收益 falls on the buyer or seller.
an external cost 外部成本 or external benefit 外部收益 falls on a third party.
the social cost 社会成本 is private cost plus external cost; the social benefit 社会收益 is private benefit plus external benefit.
Marginal analysis
We study externalities with marginal analysis 边际分析, using these curves:
marginal private cost 边际私人成本 (MPC) and marginal social cost 边际社会成本 (MSC).
marginal private benefit 边际私人收益 (MPB) and marginal social benefit 边际社会收益 (MSB).
The best outcome for society is where MSC = MSB. But the market produces where MPC = MPB. The gap between these creates lost welfare.
a negative externality 负外部性 (like pollution) means MSC is above MPC. The market makes too much.
a positive externality 正外部性 (like education) means MSB is above MPB. The market makes too little.
The lost welfare from making too much or too little is the deadweight welfare loss 无谓损失 — the triangle on the diagram between the social and private curves.
Industrial pollution: a negative externality where social cost exceeds private cost
Explore · Jelajahi
Externalities shift the social curve · Eksternalitas menggeser kurva sosial
A negative externality means the social cost is above the private supply curve; the free-market quantity is then too high. · Eksternalitas negatif berarti biaya sosial berada di atas kurva penawaran pribadi; kuantitas pasar bebas menjadi terlalu tinggi.
explain fixed, variable, total, average and marginal cost and short-run and long-run production (law of diminishing returns, returns to scale)
explain total, average and marginal revenue and normal, supernormal (abnormal) and subnormal profit
Bahasa Indonesia
jelaskan biaya tetap, variabel, total, rata-rata dan marjinal serta produksi jangka pendek dan panjang (hukum hasil yang semakin berkurang, hasil skala)
jelaskan pendapatan total, rata-rata dan marjinal serta laba normal, supernormal (abnormal) dan subnormal
Source: Cambridge International syllabus · Sumber: Silabus Cambridge International
Economies of scale: average cost falls
Costs
In the short run 短期, at least one factor is fixed; in the long run 长期, all factors can change.
A large steel plant: big firms gain economies of scale, so average cost falls as output rises.
Cost
Meaning
fixed cost 固定成本
does not change with output (rent on a factory)
variable cost 可变成本
changes with output (raw materials)
total cost 总成本
fixed cost plus variable cost
average cost 平均成本
total cost per unit: $AC = TC / Q$
marginal cost 边际成本
the cost of one more unit: $MC = \Delta TC / \Delta Q$
Worked example. Making $10$ units costs £500 in total; making $11$ units costs £540. Find the average cost at $10$ units and the marginal cost of the 11th unit.
Here $MC$ ($\text{\pounds} 40$) is below $AC$ ($\text{\pounds} 50$), so making the 11th unit pulls the average cost down — whenever marginal cost is below average cost, average cost falls.
In the short run, output is limited by the law of diminishing returns 边际报酬递减: as you add more of a variable factor (workers) to a fixed factor (machines), each extra worker eventually adds less output. This makes marginal cost rise.
Marginal, average total and average variable cost are all U-shaped; MC cuts the two average curves at their lowest points.
In the long run, all factors vary, so we look at returns to scale 规模报酬. As a firm grows, it can gain economies of scale 规模经济 (lower average cost from buying in bulk, using big machines, and specialising). If it grows too big, it may suffer diseconomies of scale 规模不经济 (poor communication and control), and average cost rises.
Long-run average cost falls with economies of scale, reaches a minimum, then rises with diseconomies of scale.
Revenue
Revenue
Meaning
total revenue 总收益
all money from sales: $TR = P \times Q$
average revenue 平均收益
revenue per unit, which equals the price
marginal revenue 边际收益
the revenue from one more unit: $MR = \Delta TR / \Delta Q$
Worked example. A firm sells $10$ units at £50 each. To sell an 11th unit it must lower the price to £48 on every unit. Find the total revenue at each output and the marginal revenue of the 11th unit.
The marginal revenue ($\text{\pounds} 28$) is well below the £48 price, because the lower price applies to all $11$ units, not just the extra one.
Profit
Profit is total revenue minus total cost. Economists include the opportunity cost of the owner's resources in cost, so:
normal profit 正常利润 is just enough profit to keep the firm in the industry. It counts as a cost.
supernormal profit 超常利润 (also called abnormal profit) is profit above normal.
subnormal profit 次正常利润 is profit below normal — the firm may leave in the long run.
A firm makes the most profit at the output where $MR = MC$.
Worked example. At its best output a firm makes $100$ units, sells each for £12 (its average revenue), and has an average cost of £9. Find the supernormal profit.
Because average revenue (£12) is above average cost (£9), the firm earns supernormal profit. If instead $AR = AC$, it would make only normal profit; if $AR < AC$, it would make a loss.
Explore · Jelajahi
Revenue & profit · Pendapatan & keuntungan
y = ax² + bx + c
Total revenue rises then falls as price changes. · Total revenue naik lalu turun saat harga berubah.
Explore · Jelajahi
Costs and the firm · Biaya dan perusahaan
Average cost is U-shaped; marginal cost cuts it at the minimum. Different market structures price relative to these curves. · Biaya rata-rata berbentuk U; biaya marjinal memotongnya di titik minimum. Struktur pasar yang berbeda menentukan harga relatif terhadap kurva-kurva ini.
Explore · Jelajahi
Average and marginal cost · Biaya rata-rata dan biaya marjinal
Change output. Marginal cost cuts average cost at its lowest point — the heart of the theory of the firm. · Ubah output. Biaya marjinal memotong biaya rata-rata pada titik terendahnya — inti dari teori perusahaan.
explain the assumptions, behaviour and outcomes of perfect competition, monopolistic competition, oligopoly and monopoly
explain price and non-price competition, collusion, price discrimination and the efficiency of each market structure
Bahasa Indonesia
jelaskan asumsi, perilaku dan hasil dari persaingan sempurna, persaingan monopolistik, oligopoli dan monopoli
jelaskan persaingan harga dan non-harga, kolusi, diskriminasi harga serta efisiensi setiap struktur pasar
Source: Cambridge International syllabus · Sumber: Silabus Cambridge International
A market structure 市场结构 describes a market by the number of firms, the barriers to entry, and the type of product.
Structure
Firms
Barriers
Product
Long-run profit
perfect competition 完全竞争
very many
none
identical
normal only
monopolistic competition 垄断竞争
many
low
slightly different
normal
oligopoly 寡头垄断
a few
high
varies
often supernormal
monopoly 垄断
one
very high
unique
supernormal
The four structures sit on a spectrum of competition: many firms at one end (perfect competition), a single firm at the other (monopoly)
in perfect competition, each firm is a tiny price taker 价格接受者 — it must accept the market price. Firms make only normal profit in the long run, and the market is both productively and allocatively efficient.
in monopolistic competition, many firms sell slightly different products (product differentiation 产品差异化), so each has a little price-setting power, but free entry competes profit away.
in an oligopoly, a few large firms dominate. They watch each other closely. They may compete hard on price, or they may agree to fix prices — this is collusion 合谋, and a group that does so is a cartel 卡特尔.
a monopoly is a single seller protected by high barriers to entry 进入壁垒. It can earn supernormal profit for a long time but is usually inefficient.
In long-run equilibrium a perfectly competitive firm produces where MC = MR at the bottom of ATC, making only normal profit.A monopoly produces where MC = MR, then charges the higher price buyers will pay (read off the AR curve), keeping a supernormal profit.
Price and non-price competition
price competition 价格竞争 means cutting prices to win customers.
non-price competition 非价格竞争 means competing in other ways — advertising, quality, branding and service.
Price discrimination
price discrimination 价格歧视 is charging different consumers different prices for the same good (for example, cheaper train tickets for students). It needs price-setting power, groups with different elasticities, and a way to stop resale between groups. It raises the firm's profit.
Explore · Jelajahi
Pricing and competition · Penetapan harga dan persaingan
How a firm prices depends on demand and supply; with market power it can charge above the competitive level. · Bagaimana perusahaan menetapkan harga bergantung pada permintaan dan penawaran; dengan kekuatan pasar ia dapat mengenakan harga di atas tingkat persaingan.
explain why firms grow (internal and external — horizontal, vertical, conglomerate integration) and why some remain small
explain barriers to entry and exit and the survival of small firms
Bahasa Indonesia
jelaskan mengapa perusahaan tumbuh (internal dan eksternal — integrasi horizontal, vertikal, konglomerat) dan mengapa beberapa tetap kecil
jelaskan halangan masuk dan keluar serta kelangsungan hidup perusahaan kecil
Source: Cambridge International syllabus · Sumber: Silabus Cambridge International
Firms grow in two ways:
internal growth 内部增长 (organic) — growing bigger by selling more.
external growth 外部增长 — joining with another firm through a merger 合并 or takeover. Types:
horizontal integration 横向一体化 — joining a firm at the same stage of the same industry (two car makers).
vertical integration 纵向一体化 — joining a firm at a different stage (a car maker buys a tyre maker).
conglomerate integration 混合一体化 — joining a firm in a different industry, to spread risk.
External growth on the production chain: horizontal, vertical and conglomerate integration
Why some firms stay small
Many firms stay small because the market is small (local services), the owner wants to keep control, or there are few economies of scale. They survive by offering personal service or filling a niche 利基市场.
Firms also face barriers to entry and barriers to exit 退出壁垒 (such as costly machines that cannot be sold). High exit barriers can trap a firm in a loss-making market.
Explore · Jelajahi
Firm objective lab · Labu tujuan perusahaan
Classify real firm decisions by the objective they reveal. · Klasifikasikan keputusan perusahaan nyata berdasarkan tujuan yang ditunjukkannya.
explain alternative objectives of firms: profit maximisation, revenue maximisation, sales maximisation, satisficing
explain the divorce of ownership from control (principal–agent problem) and its consequences
Bahasa Indonesia
jelaskan alternatif tujuan perusahaan: maksimisasi laba, maksimisasi pendapatan, maksimisasi penjualan, satisficing
jelaskan pemisahan kepemilikan dari pengendalian (masalah prinsipal-agen) dan dampaknya
Source: Cambridge International syllabus · Sumber: Silabus Cambridge International
Not every firm simply chases the most profit.
profit maximisation 利润最大化 — producing where MR = MC. The traditional aim.
revenue maximisation 收益最大化 — producing where MR = 0, perhaps to grow market share.
sales maximisation 销售最大化 — selling as much as possible while still making normal profit.
satisficing 满意化 — aiming for "good enough" results that keep owners, workers and customers all reasonably happy.
Divorce of ownership from control
In large companies the owners (shareholders) are not the managers. This divorce of ownership from control 所有权与控制权分离 creates the principal-agent problem 委托代理问题: managers (the agents) may pursue their own aims — bigger salaries or an easier life — instead of the owners' aim of maximum profit.
Explore · Jelajahi
Firm objective lab · Labu tujuan perusahaan
Classify real firm decisions by the objective they reveal. · Klasifikasikan keputusan perusahaan nyata berdasarkan tujuan yang ditunjukkannya.
Calculate AC, MC, TR and MR, and remember a firm maximises profit where $MR = MC$.
Distinguish the market structures (perfect competition, monopolistic competition, oligopoly, monopoly) by number of firms, barriers and price-setting power.
Distinguish normal from supernormal profit and link long-run entry and exit to it.
On a cost diagram, note that MC cuts AC at the minimum of AC.
8
Government microeconomic intervention (A Level) · Intervensi mikroekonomi pemerintah (A Level)
explain policies to correct market failure: taxes, subsidies, price controls, tradable permits, regulation, provision, nationalisation and privatisation
explain competition policy and the concept of government failure
Bahasa Indonesia
jelaskan kebijakan untuk memperbaiki kegagalan pasar: pajak, subsidi, pengendalian harga, izin dapat diperdagangkan, regulasi, penyediaan, nasionalisasi dan privatisasi
jelaskan kebijakan persaingan dan konsep kegagalan pemerintah
Source: Cambridge International syllabus · Sumber: Silabus Cambridge International
English
A government has many tools to push a market towards a better use of resources.
an indirect tax 间接税 on a good with a negative externality (like fuel) raises its price and cuts the quantity used.
a subsidy 补贴 for a good with a positive externality (like solar panels) lowers its price and raises the quantity.
a price control 价格管制 sets a legal maximum or minimum price.
tradable permits 可交易许可证 cap total pollution and let firms buy and sell the right to pollute.
regulation 管制 uses rules and laws, such as bans, safety standards and pollution limits.
state provision 政府提供 means the government supplies a good directly, often free (schools, hospitals, defence).
nationalisation 国有化 is taking an industry into government ownership; privatisation 私有化 is selling a state industry to private owners.
Competition policy
A firm with monopoly power 垄断势力 can raise prices and cut output. competition policy 竞争政策 is the set of laws used to protect competition — for example, blocking mergers that create too much power, banning price-fixing, and fining firms that abuse their position.
Government failure
Intervention can backfire. government failure 政府失灵 is when the government's action leads to a worse use of resources than before — through poor information, high costs, long time lags, or unintended effects (such as a black market caused by a price control).
Bahasa Indonesia
Pemerintah memiliki banyak alat untuk mendorong pasar menuju penggunaan sumber daya yang lebih baik.
pajak tidak langsung pada barang dengan eksternalitas negatif (seperti bahan bakar) menaikkan harganya dan mengurangi kuantitas penggunaannya.
subsidi untuk barang dengan eksternalitas positif (seperti panel surya) menurunkan harganya dan meningkatkan kuantitasnya.
kontrol harga menetapkan batas harga maksimal atau minimal secara hukum.
izin yang dapat diperdagangkan membatasi total polusi dan memungkinkan perusahaan membeli dan menjual hak untuk mencemari lingkungan.
regulasi menggunakan aturan dan undang-undang, seperti larangan, standar keselamatan, dan batas polusi.
penyediaan negara berarti pemerintah menyediakan barang secara langsung, sering kali gratis (sekolah, rumah sakit, pertahanan).
nasionalisasi adalah mengambil industri ke dalam kepemilikan pemerintah; privatisasi adalah menjual industri milik negara kepada pemilik swasta.
Kebijakan kompetisi
Perusahaan dengan kekuatan monopoli dapat menaikkan harga dan menurunkan output. Kebijakan kompetisi adalah serangkaian undang-undang yang digunakan untuk melindungi kompetisi — misalnya, menolak akuisisi yang menciptakan terlalu banyak kekuatan, melarang penentuan harga bersama, dan mendenda perusahaan yang menyalahgunakan posisinya.
Kegagalan pemerintah
Intervensi bisa berbalik arah. Kegagalan pemerintah terjadi ketika tindakan pemerintah menyebabkan penggunaan sumber daya yang lebih buruk daripada sebelumnya — melalui informasi yang buruk, biaya tinggi, jeda waktu yang lama, atau efek tak terduga (seperti pasar gelap yang disebabkan oleh kontrol harga).
Barang demerit seperti rokok dikonsumsi berlebihan ketika biaya eksternal diabaikan — kegagalan pasar klasik
Explore · Jelajahi
When a market fails · Ketika sebuah pasar gagal
An externality (like pollution) means the market price ignores a real cost — output ends up above the efficient level. Add the external cost to see the gap. · Eksternalitas (seperti polusi) berarti harga pasar mengabaikan biaya nyata — output berakhir di atas tingkat efisien. Tambahkan biaya eksternal untuk melihat kesenjangan.
Equity and redistribution · Keadilan dan redistribusi
Syllabus · Silabus
English
distinguish equity, equality, and the difference between income and wealth
explain the Lorenz curve and Gini coefficient and policies to redistribute income and wealth (taxation, benefits, the difficulty of redistributing wealth)
Bahasa Indonesia
bedakan keadilan, kesetaraan, dan perbedaan antara pendapatan dan kekayaan
jelaskan kurva Lorenz dan koefisien Gini serta kebijakan untuk mendistribusikan ulang pendapatan dan kekayaan (pajak, tunjangan, kesulitan mendistribusikan kembali kekayaan)
Source: Cambridge International syllabus · Sumber: Silabus Cambridge International
English
It is important to separate two words that sound alike:
equity 公平 means fairness — people getting what is fair, which may not be an equal share.
equality 平等 means everyone getting the same.
A fair (equitable) outcome is not always an equal one. Most governments worry about too much inequality 不平等.
Remember the difference between the two things being shared:
income 收入 is a flow received over time (wages, rent, interest).
wealth 财富 is a stock of assets owned (houses, shares, savings).
Measuring inequality
the Lorenz curve 洛伦兹曲线 is a graph. It plots the share of total income against the share of the population, from poorest to richest. A straight diagonal line would mean perfect equality. The further the curve bends below the line, the more unequal the country.
the Gini coefficient 基尼系数 turns this into one number between 0 and 1. Zero means perfect equality; one means one person has everything. A higher number means more inequality.
Policies to redistribute
a progressive tax 累进税 takes a larger share from higher incomes.
benefits 福利金 (also called transfer payments 转移支付) give money to the poor, the old and the unemployed.
free state services (education, health care) raise the real living standards of the poor.
These bring about redistribution 再分配 — moving income from richer to poorer people. Wealth is harder to redistribute than income, because the rich can hide assets or move them abroad, and wealth taxes are hard to collect.
Worked example. Country X has a Gini coefficient of 0.25 and country Y one of 0.48. What does that mean, and what does each Lorenz curve look like? The Gini runs from 0 (perfect equality) to 1 (one person has everything), so a higher number means more unequal: country Y at 0.48 is markedly more unequal than X at 0.25. On the graph, Y's Lorenz curve sags further below the 45° line of equality, while X's hugs it more closely. The Gini is exactly the area between the line of equality and the Lorenz curve, as a fraction of the whole triangle beneath that line - which is why a bigger sag gives a bigger number. One caution is worth stating: the Gini measures relative inequality only. It says nothing about absolute living standards, so a poor country and a rich one can share the same Gini.
Bahasa Indonesia
Penting untuk membedakan dua kata yang terdengar mirip:
equity berarti keadilan — orang-orang mendapatkan apa yang adil, yang mungkin bukan bagian yang sama.
equality berarti setiap orang mendapatkan hal yang sama.
Equality memberikan hal yang sama kepada semua orang; equity memberikan apa yang adil kepada semua orang — sehingga hasil yang adil tidak selalu merupakan hasil yang samaKetidaksetaraan pendapatan: permukiman informal sering berada dekat dengan distrik yang jauh lebih kaya.
Hasil yang adil (equitable) tidak selalu merupakan hasil yang sama. Mayoritas pemerintah khawatir terhadap ketidaksetaraan yang terlalu besar.
Ingat perbedaan antara dua hal yang dibagikan:
income adalah aliran yang diterima seiring waktu (gaji, sewa, bunga).
wealth adalah stok aset yang dimiliki (rumah, saham, tabungan).
Mengukur ketidaksetaraan
kurva Lorenz adalah grafik. Ini memplot bagian dari total pendapatan terhadap bagian populasi, dari yang paling miskin hingga yang paling kaya. Garis diagonal lurus akan berarti kesetaraan sempurna. Semakin melengkung kurva ke bawah garis, semakin tidak setara negara tersebut.
koefisien Gini mengubahnya menjadi satu angka antara 0 dan 1. Nol berarti kesetaraan sempurna; satu berarti satu orang memiliki semuanya. Angka yang lebih tinggi berarti ketidaksetaraan yang lebih besar.
*Kurva Lorenz memplot bagian pendapatan kumulatif terhadap bagian populasi kumulatif; semakin menggantung di bawah garis kesetaraan, semakin tinggi koefisien Gini.
Kebijakan untuk mendistribusikan ulang
pajak progresif mengambil bagian yang lebih besar dari pendapatan yang lebih tinggi.
benefits (juga disebut transfer payments) memberikan uang kepada orang miskin, lansia, dan pengangguran}
layanan negara gratis (pendidikan, perawatan kesehatan) meningkatkan standar hidup riil masyarakat miskin.
Pajak progresif mengambil tarif lebih tinggi dari pendapatan yang lebih tinggi
Hal ini menyebabkan redistribusi — perpindahan pendapatan dari orang kaya ke orang miskin. Kekayaan lebih sulit didistribusikan ulang daripada pendapatan, karena orang kaya dapat menyembunyikan aset atau memindahkannya ke luar negeri, dan pajak kekayaan sulit dipungut.
Contoh terpecahkan. Negara X memiliki koefisien Gini 0,25 dan negara Y 0,48. Apa artinya itu, dan bagaimana bentuk kurva Lorenz masing-masing? Gini berkisar dari 0 (kesetaraan sempurna) hingga 1 (seseorang memiliki segalanya), sehingga angka yang lebih tinggi berarti ketidaksetaraan lebih besar: negara Y pada 0,48 jauh lebih tidak setara daripada X pada 0,25. Pada grafik, kurva Lorenz Y melengkung lebih jauh ke bawah garis kesetaraan 45°, sementara X mendekatinya lebih erat. Gini adalah tepat area antara garis kesetaraan dan kurva Lorenz, sebagai pecahan dari seluruh segitiga di bawah garis tersebut - itulah sebabnya lekukan yang lebih dalam menghasilkan angka yang lebih besar. Satu peringatan layak disebutkan: Gini mengukur ketimpangan relatif saja. Ini tidak memberikan informasi apa pun tentang standar hidup absolut, sehingga negara miskin dan negara kaya dapat memiliki Gini yang sama.
Follow how policy can change disposable income and opportunity. · Ikuti bagaimana kebijakan dapat mengubah pendapatan siap pakai dan kesempatan.
Explore · Jelajahi
Bend the Lorenz curve · Belokkan kurva Lorenz
Drag each economy's top-20% income share — the curve that hugs the line of equality has the lower Gini, and the quintile chips give the exam-table numbers. · Seret bagian pendapatan top-20% dari masing-masing ekonomi — kurva yang menempel pada garis kesetaraan memiliki Gini yang lebih rendah, dan chip kuartil memberikan angka tabel ujian.
explain the demand for and supply of labour, marginal revenue product (MRP) and wage determination in competitive labour markets
explain monopsony, trade unions, the national minimum wage, wage differentials and discrimination, and government intervention
Bahasa Indonesia
jelaskan permintaan dan penawaran tenaga kerja, produk pendapatan marjinal (MRP) dan penentuan upah di pasar tenaga kerja kompetitif
jelaskan monopsoni, serikat pekerja, upah minimum nasional, diferensial upah dan diskriminasi, serta intervensi pemerintah
Source: Cambridge International syllabus · Sumber: Silabus Cambridge International
English
A wage is just a price — the price of labour — so we use demand and supply to study the labour market 劳动力市场.
The demand for labour
The demand for labour 劳动力需求 is a derived demand 派生需求: firms want workers not for their own sake, but to make goods that sell. So labour demand depends on the marginal revenue product 边际收益产品 (MRP) — the extra revenue one more worker brings in. A worker is worth hiring while the MRP is at least as big as the wage.
The supply of labour
The supply of labour 劳动力供给 to a job rises when the wage 工资 rises, and also depends on training needed, working conditions, and how many people have the right skills.
In a competitive labour market, the wage settles where the demand for labour equals the supply of labour.
When the market is not competitive
a monopsony 买方垄断 is a single, dominant buyer of labour (for example, the only large employer in a town). It can pay a wage below the competitive level and hire fewer workers.
a trade union 工会 is an organised group of workers that bargains for higher pay. A union can push the wage above the competitive level, but this may reduce the number of jobs.
a national minimum wage 全国最低工资 is a legal lowest wage. Set above the market wage, it raises low pay but may cause some unemployment. Interestingly, in a monopsony it can raise both the wage and employment.
Wage differentials and discrimination
Wages differ between jobs — this is a wage differential 工资差异. The main reasons are differences in MRP (skilled work is more productive), the training and qualifications needed, and the risk or unpleasantness of the work.
Some wage gaps come from discrimination 歧视 — paying people differently because of gender, race or age rather than their productivity. Governments use equal-pay laws and anti-discrimination laws to reduce this.
Bahasa Indonesia
Upah hanyalah harga — harga tenaga kerja — jadi kita menggunakan permintaan dan penawaran untuk mempelajari pasar tenaga kerja.
Di pasar tenaga kerja, perusahaan membutuhkan pekerja dan upah adalah harga tenaga kerja.
Permintaan tenaga kerja
Permintaan tenaga kerja adalah permintaan turunan: perusahaan menginginkan pekerja bukan untuk dirinya sendiri, tetapi untuk membuat barang yang akan terjual. Jadi permintaan tenaga kerja bergantung pada produktivitas pendapatan marjinal (MRP) — tambahan pendapatan yang dihasilkan oleh satu pekerja tambahan. Seorang pekerja layak dipekerjakan selama MRP setidaknya sama besarnya dengan upah.
Penawaran tenaga kerja
Penawaran tenaga kerja untuk suatu pekerjaan meningkat ketika upah naik, dan juga bergantung pada pelatihan yang diperlukan, kondisi kerja, serta berapa banyak orang yang memiliki keterampilan yang sesuai.
Di pasar tenaga kerja yang kompetitif, upah menetapkan di mana permintaan tenaga kerja sama dengan penawaran tenaga kerja.
Di pasar tenaga kerja yang kompetitif, upah $W^*$ dan tingkat employment $L^*$ ditetapkan di mana permintaan tenaga kerja (MRP) bertemu dengan penawaran tenaga kerja.
Ketika pasar tidak kompetitif
monopsony adalah pembeli tunggal, dominan atas tenaga kerja (misalnya, satu-satunya employer besar di sebuah kota). Ia dapat membayar upah di bawah tingkat kompetitif dan mempekerjakan lebih sedikit pekerja.
serikat buruh adalah kelompok terorganisir dari pekerja yang bernegosiasi untuk gaji yang lebih tinggi. Serikat dapat mendorong upah di atas tingkat kompetitif, namun hal ini mungkin mengurangi jumlah lapangan kerja.
upah minimum nasional adalah batas upah hukum terendah. Ditetapkan di atas upah pasar, hal ini meningkatkan pembayaran rendah tetapi mungkin menyebabkan pengangguran tertentu. Menariknya, dalam monopsony hal ini dapat meningkatkan baik upah maupun jumlah kerja.
Upah minimum yang ditetapkan di atas upah keseimbangan berarti lebih banyak pekerja ingin bekerja daripada perusahaan yang mau merekrut, menyisakan pengangguran.
Perbedaan upah dan diskriminasi
Upah berbeda antar pekerjaan — ini adalah perbedaan upah. Alasan utamanya adalah perbedaan MRP (kerja terampil lebih produktif), pelatihan dan kualifikasi yang dibutuhkan, serta risiko atau ketidaknyamanan pekerjaan.
Beberapa kesenjangan upah berasal dari diskriminasi — membayar orang berbeda karena gender, ras, atau usia alih-alih produktivitas mereka. Pemerintah menggunakan undang-undang upah setara dan undang-undang anti-diskriminasi untuk mengurangi hal ini.
Explore · Jelajahi
The labour market · Pasar tenaga kerja
Wages are a price. The demand for labour (from firms) and the supply of labour (from workers) set the equilibrium wage. · Upah adalah harga. Permintaan tenaga kerja (dari perusahaan) dan penawaran tenaga kerja (dari pekerja) menetapkan upah keseimbangan.
This topic studies the wider economy at A Level depth: how spending multiplies, how growth links to the environment, the jobs–prices link, and money.
9.1
The circular flow and the multiplier
Syllabus · Silabus
English
explain the circular flow of income, injections and leakages, and the multiplier (including the marginal propensities)
explain the accelerator and the determinants of consumption, saving and investment
Bahasa Indonesia
jelaskan aliran uang circular, injeksi dan kebocoran, serta multiplier (termasuk propensi marjinal)
jelaskan accelerator dan penentu konsumsi, menabung dan investasi
Source: Cambridge International syllabus · Sumber: Silabus Cambridge International
The multiplier effect
The circular flow of income 收入循环流 shows money passing between households and firms. injections 注入 add money to the flow (investment, government spending, exports); leakages 漏出 take it out (saving, taxation, imports).
Income circulates between households and firms, with injections and leakages
The multiplier
An injection raises income by more than the first amount. This is the multiplier 乘数. When a firm builds a factory, the builders earn income, and they spend part of it, which becomes someone else's income, and so on.
How much is spent again depends on the marginal propensity to consume 边际消费倾向 (MPC) — the fraction of extra income that people spend on home goods. The rest leaks out. In a simple model:
$$\text{multiplier} = \frac{1}{1 - MPC}$$
A bigger MPC (smaller leakages) gives a bigger multiplier. The main leakages are measured by the marginal propensity to save 边际储蓄倾向 (MPS) and the marginal propensity to import 边际进口倾向 (MPM).
Worked example. In an economy the MPC is $0.8$. Find the multiplier, then the effect of a $\text{\pounds} 10$ billion rise in investment.
National income therefore rises by $5 \times \text{\pounds} 10\text{ billion} = \text{\pounds} 50\text{ billion}$ — five times the original injection. (Because all income is either spent or saved, $\text{MPC} + \text{MPS} = 1$, so here $\text{MPS} = 0.2$ and the multiplier is also $1/\text{MPS}$.)
An injection is spent round after round (each smaller by the MPC), so total income rises by a multiple of the first injection.
The accelerator
The accelerator 加速数 says that investment 投资 depends on the rate of change of output. When demand is rising quickly, firms need lots of new capital, so investment jumps. When demand merely stays high, investment falls back.
What drives consumption, saving and investment
consumption 消费 and saving 储蓄 depend on disposable income 可支配收入 (income after tax), wealth, interest rates, and confidence.
investment depends on interest rates, expected profit, technology, and business confidence.
Explore · Jelajahi
The circular flow and the multiplier · Aliran melingkar dan multiplier
Income circles between households and firms. An injection (e.g. investment) is re-spent again and again — the multiplier effect. · Pendapatan mengalir antar rumah tangga dan perusahaan. Suntikan (misalnya investasi) dibelanjakan lagi dan lagi — efek multiplier.
Explore · Jelajahi
The multiplier, round by round · Multiplier, putaran demi putaran
Drag the injection and the MPC, then press Play — each spending round is MPC times the last, and the total settles at k × the injection. · Seret injeksi dan MPC, lalu tekan Putar — setiap putaran pengeluaran adalah MPC kali putaran terakhir, dan totalnya settling di k × injeksi.
marginal propensity to consume/ˈmɑːdʒɪnl prəˈpensɪti tə kənˈsjuːm/
propensi konsumsi marjinal
marginal propensity to save/ˈmɑːdʒɪnl prəˈpensɪti tə seɪv/
propensiy margin untuk menabung
marginal propensity to import/ˈmɑːdʒɪnl prəˈpensɪti tʊ ɪmˈpɔːt/
propensi marjinal impor
accelerator/əkˈseləreɪtə/
accelerator
investment/ɪnˈvestmənt/
investasi
consumption/kənˈsʌmpʃn/
konsumsi
saving/ˈseɪvɪŋ/
tabungan
disposable income/dɪˈspəʊzəbl ˈɪŋkʌm/
pendapatan dapat dibelanjakan
9.2
Economic growth and sustainability
Syllabus · Silabus
English
distinguish actual and potential growth, output gaps and sustainable growth
explain the costs and benefits of growth and the relationship between growth and sustainability
Bahasa Indonesia
bedakan pertumbuhan aktual dan potensi, celah output dan pertumbuhan berkelanjutan
jelaskan biaya dan manfaat pertumbuhan serta hubungan antara pertumbuhan dan keberlanjutan
Source: Cambridge International syllabus · Sumber: Silabus Cambridge International
economic growth 经济增长 is a rise in real output.
Investment in new buildings and capital is a key driver of economic growth.
actual growth 实际增长 is the real rise in output that happens.
potential growth 潜在增长 is the rise in the economy's capacity.
The output gap 产出缺口 is the difference between actual output and potential output. A positive gap (actual above potential) tends to cause inflation; a negative gap (actual below potential) means spare capacity and unemployment.
Actual output swings around potential output; above it is a positive (inflationary) gap, below it a negative gap with spare capacity.
Sustainability
sustainable growth 可持续增长 is growth that meets today's needs without harming the ability of future generations to meet theirs. Fast growth can use up non-renewable resources and cause pollution, which threatens sustainability 可持续性. So a country must weigh growth today against the environment and resources of tomorrow.
The wind these turbines use is never used up, and they burn no fuel. Switching output from coal and oil to renewables like this lets an economy keep growing without spending the resources — or filling the air with the pollution — that would rob future generations
Explore · Jelajahi
Economics case lab · Laboratorium kasus ekonomi
Classify real examples by the economic idea they show. · Klasifikasikan contoh nyata berdasarkan ide ekonomi yang ditampilkannya.
explain the measurement, types and causes of unemployment and the natural rate of unemployment
explain the relationship between unemployment and inflation (the Phillips curve, short run and long run)
Bahasa Indonesia
jelaskan pengukuran, jenis dan penyebab pengangguran serta tingkat pengangguran alami
jelaskan hubungan antara pengangguran dan inflasi (kurva Phillips, jangka pendek dan jangka panjang)
Source: Cambridge International syllabus · Sumber: Silabus Cambridge International
unemployment 失业 is measured in two ways: the claimant count 申领救济人数 (people claiming benefits) and the wider labour force survey 劳动力调查 (a sample asked about work).
Four types of unemployment: frictional, structural, cyclical and seasonal
Types
frictional unemployment 摩擦性失业 — short spells between jobs.
structural unemployment 结构性失业 — skills no longer match the jobs, as industries decline.
cyclical unemployment 周期性失业 — caused by low demand in a recession.
seasonal unemployment 季节性失业 — work only at certain times of year.
The natural rate and the Phillips curve
The natural rate of unemployment 自然失业率 is the unemployment left when the labour market is in balance (mainly frictional and structural). It cannot be removed just by raising demand.
The Phillips curve 菲利普斯曲线 shows the link between unemployment and inflation:
in the short run, there is a trade-off: lower unemployment comes with higher inflation, because strong demand pushes up wages and prices.
in the long run, the curve is vertical at the natural rate. Once people expect inflation, there is no lasting trade-off — pushing unemployment below the natural rate only speeds up inflation.
The short-run Phillips curve shows a trade-off between unemployment and inflation; the long-run curve is vertical at the natural rate.
Explore · Jelajahi
Development chain lab · Laboratorium rantai pengembangan
Follow how policy and resources can change living standards. · Ikuti bagaimana kebijakan dan sumber daya dapat mengubah standar hidup.
natural rate of unemployment/ˈnætʃərəl reɪt ɒv ʌnemˈplɔɪmənt/
tingkat pengangguran alamiah
Phillips curve/ˈfɪlɪps kɜːv/
kurva Phillips
9.4
Money and banking
Syllabus · Silabus
English
explain the functions and characteristics of money and the role of the central bank and commercial banks
explain the demand for money (liquidity preference), the money supply, and the determination of interest rates, including moral hazard
Bahasa Indonesia
jelaskan fungsi dan karakteristik uang serta peran bank sentral dan bank komersial
jelaskan permintaan uang (preferensi likuiditas), penawaran uang, dan penentuan suku bunga, termasuk moral hazard
Source: Cambridge International syllabus · Sumber: Silabus Cambridge International
What money does
money 货币 is anything widely accepted in payment. It has four jobs:
a medium of exchange 交换媒介 — used to buy and sell, avoiding barter.
a store of value 价值储藏 — it keeps its worth over time, so you can save it.
a unit of account 记账单位 — a common way to measure and compare prices.
a standard of deferred payment 延期支付标准 — it lets people borrow and repay later.
Money does four jobs at once — without it, trade would fall back on slow, awkward barter
Good money is durable, easy to carry, easy to divide, hard to fake, and limited in supply.
Banks
the central bank 中央银行 issues notes, runs monetary policy, holds the country's reserves, and acts as lender of last resort 最后贷款人 to banks in trouble.
commercial banks 商业银行 take deposits and make loans. By lending out most of what is deposited, the banking system creates money.
Commercial banks take deposits and make loans — and by lending, the banking system creates most of the money in the economy.
The demand for money and interest rates
People hold money rather than other assets for its liquidity 流动性 (it can be spent at once). The demand for money 货币需求 — also called liquidity preference 流动性偏好 — comes from the need to make everyday payments, to keep a safety buffer, and to be ready to buy assets.
The interest rate 利率 is the price of borrowing money. It is set where the demand for money meets the money supply 货币供给. A larger money supply tends to lower the interest rate.
The interest rate is set where the demand for money meets the money supply; a larger money supply lowers it.
Moral hazard
moral hazard 道德风险 is the danger that banks take bigger risks because they expect to be rescued if things go wrong. If a bank believes the government will bail it out, it may lend recklessly — knowing it keeps the gains but passes losses to others.
Explore · Jelajahi
Economics case lab · Laboratorium kasus ekonomi
Classify real examples by the economic idea they show. · Klasifikasikan contoh nyata berdasarkan ide ekonomi yang ditampilkannya.
This topic pulls the macroeconomics together: the goals a government has, how they clash, and how well its tools work.
10.1
Objectives and the tools to reach them
Syllabus · Silabus
English
state and explain the macroeconomic policy objectives and how they are measured
explain the use of fiscal, monetary and supply-side policy to achieve the objectives
Bahasa Indonesia
nyatakan dan jelaskan tujuan kebijakan makroekonomi dan bagaimana cara mengukurnya
jelaskan penggunaan kebijakan fiskal, moneter dan sisi penawaran untuk mencapai tujuan-tujuan tersebut
Source: Cambridge International syllabus · Sumber: Silabus Cambridge International
Governments aim at several macroeconomic objectives 宏观经济目标 at once:
Fiscal and monetary policy act on demand; supply-side on capacityThe four macroeconomic objectives
Objective
How it is measured
economic growth 经济增长
the % change in real GDP
price stability 物价稳定 (low inflation 通货膨胀)
the % change in the consumer price index
full employment 充分就业
the unemployment rate
balance of payments 国际收支 stability
the current account balance
To reach these goals, the government uses three sets of tools:
fiscal policy 财政政策 — changing government spending and taxes.
monetary policy 货币政策 — changing the interest rate 利率 and the money supply.
supply-side policy 供给侧政策 — raising the economy's capacity and productivity.
Fiscal and monetary policy mainly work on aggregate demand 总需求, so they are quick but can cause inflation. Supply-side policy works on capacity, so it is slow but lasting.
Central banks, such as the European Central Bank, are a main tool of macroeconomic policy.
Explore · Jelajahi
Macro objective lab · Laboratorium tujuan makro
Classify policy examples by the macroeconomic objective they target. · Klasifikasikan contoh kebijakan berdasarkan tujuan makroekonomi yang dituju.
explain the links and trade-offs between macroeconomic problems (e.g. growth and inflation, unemployment and inflation, growth and the balance of payments)
analyse the interrelatedness of macroeconomic objectives
Bahasa Indonesia
jelaskan hubungan dan trade-off antara masalah makroekonomi (misalnya pertumbuhan dan inflasi, pengangguran dan inflasi, pertumbuhan dan neraca pembayaran)
analisis keterkaitan antar tujuan makroekonomi
Source: Cambridge International syllabus · Sumber: Silabus Cambridge International
The objectives are interrelated — reaching one can move another. Often there is a trade-off 取舍, a conflict 冲突 where gaining on one goal costs you on another.
unemployment versus inflation. Raising demand to cut unemployment tends to push prices up. The Phillips curve 菲利普斯曲线 shows this short-run trade-off. (In the long run it may disappear.)
growth versus inflation. Fast demand-led growth can overheat the economy and cause inflation.
growth versus the balance of payments. As incomes rise, people buy more imports, so the current account can worsen.
growth versus the environment. More output often means more pollution and use of resources.
growth versus equality. Growth does not always reach everyone, so the income gap can widen.
The objectives pull against each other, so a government must trade one off against another — there is rarely a way to win on all of them at once
Because the goals are linked, a government must often accept "second best" on one aim to protect another. A clever policy mix tries to ease the trade-offs — for example, supply-side policy can raise growth and lower inflation, easing the usual clash.
Explore · Jelajahi
Macro objective lab · Laboratorium tujuan makro
Classify policy examples by the macroeconomic objective they target. · Klasifikasikan contoh kebijakan berdasarkan tujuan makroekonomi yang dituju.
Source: Cambridge International syllabus · Sumber: Silabus Cambridge International
Each tool has strengths and weaknesses.
Financial markets react quickly to policy, which affects how well a policy works.
Fiscal policy
It can act directly and powerfully on demand, and it can target particular groups or regions. But:
it suffers time lags 时滞 — a budget is set once a year, and the effects take time.
large deficits add to the national debt 国债.
it can cause crowding out 挤出效应 — heavy government borrowing raises interest rates and reduces private investment.
Heavy government borrowing shifts the demand for loanable funds right, raising the interest rate ($r_0 \to r_1$) and crowding out private investment.
The Laffer curve 拉弗曲线 is a useful warning. It shows that as the tax rate rises, tax revenue 税收收入 first rises but then falls: very high rates discourage work and encourage tax avoidance, so revenue drops. There is a tax rate that raises the most revenue, and going above it is self-defeating.
Tax revenue is zero at both a 0% and a 100% tax rate; it peaks at the rate $t^*$, and pushing rates above $t^*$ actually lowers revenue.
Monetary policy
It is flexible — the interest rate can be changed at any time. But it also works with a long time lag, and in a deep slump even very low rates may fail to make worried firms and households borrow.
Supply-side policy
It is the only tool that can raise growth and lower inflation together, with no trade-off. But it is slow (education and training take years), it is costly, and some measures (like cutting benefits) can widen inequality.
Putting it together
No single policy can hit every target. The objectives conflict, the effects come with delays, and the future is uncertain. So governments usually combine demand-side policies 需求侧政策 (fiscal and monetary) for the short term with supply-side policy for the long term, and accept that some goals must be traded against others.
Worked example. A government cuts interest rates to reduce unemployment. Which other objective is put at risk, and why? Lower rates make borrowing cheaper and saving less attractive, so consumption and investment rise: aggregate demand rises, output rises, and unemployment falls. But that same rise in demand pulls prices up, especially as the economy nears full capacity - so the objective at risk is low inflation. This is the classic Phillips curve trade-off: lower unemployment bought at the price of higher inflation. It also tends to worsen the current account, because richer consumers buy more imports. Name the objective at risk and the mechanism joining the two - and remember that a supply-side policy is the one tool that can improve both objectives at once, which is usually the evaluation the question is fishing for.
Explore · Jelajahi
Economics case lab · Laboratorium kasus ekonomi
Classify real examples by the economic idea they show. · Klasifikasikan contoh nyata berdasarkan ide ekonomi yang ditampilkannya.
This final topic covers trade imbalances, exchange rates in depth, and how countries develop and connect.
11.1
Correcting a balance of payments imbalance
Syllabus · Silabus
English
explain expenditure-switching and expenditure-reducing policies and the Marshall–Lerner condition and J-curve effect
evaluate policies to correct a current account imbalance
Bahasa Indonesia
jelaskan kebijakan pergeseran pengeluaran dan pengurangan pengeluaran serta kondisi Marshall–Lerner dan efek J-curve
evaluasi kebijakan untuk memperbaiki ketidaksimbangan akun berjalan
Source: Cambridge International syllabus · Sumber: Silabus Cambridge International
A country with a large balance of payments 国际收支 problem — usually a deficit on the current account 经常账户 — can use two kinds of policy.
expenditure-reducing 支出减少 policies cut total demand (higher taxes or interest rates). With less spending, people buy fewer imports. But growth slows and unemployment may rise.
expenditure-switching 支出转换 policies move spending away from imports towards home goods. The main tool is a lower exchange rate 汇率 — a depreciation 贬值 under floating rates, or a devaluation 法定贬值 under a fixed system — which makes exports cheaper and imports dearer.
Two routes out of a deficit: spend less overall, or switch spending to home goods
The Marshall–Lerner condition and the J-curve
A lower exchange rate only improves the current account if buyers respond enough. The Marshall-Lerner condition 马歇尔勒纳条件 says the sum of the price elasticities of demand for exports and imports must be greater than one:
Worked example. After a depreciation, the demand for a country's exports has $PED = 0.6$ and its demand for imports has $PED = 0.7$. Will the current account improve?
$$0.6 + 0.7 = 1.3 > 1,$$
so the Marshall-Lerner condition is met, and the depreciation should improve the current account in the long run. (If the two elasticities had summed to less than $1$ — for example $0.3 + 0.4 = 0.7$ — a depreciation would make the deficit worse.)
Even when this holds, the gain takes time. The J-curve effect J曲线效应 describes what happens: just after a depreciation, the current account first gets worse (imports cost more straight away, but trade volumes are slow to change), then later improves as buyers adjust — tracing the shape of a letter J.
After a depreciation the current account first worsens (imports cost more at once), then improves as trade volumes adjust — tracing a letter J.
Explore · Jelajahi
Economics case lab · Laboratorium kasus ekonomi
Classify real examples by the economic idea they show. · Klasifikasikan contoh nyata berdasarkan ide ekonomi yang ditampilkannya.
explain nominal, real and trade-weighted (effective) exchange rates and how they are determined
explain fixed, floating and managed exchange rate systems, devaluation/revaluation and the effects of exchange rate changes
Bahasa Indonesia
jelaskan nilai tukar nominal, nyata dan berbobot perdagangan (efektif) serta cara penentuannya
jelaskan sistem nilai tukar tetap, mengambang dan dikelola, devaluasi/revaluasi dan dampak perubahan nilai tukar
Source: Cambridge International syllabus · Sumber: Silabus Cambridge International
Exchange rates: appreciation
An exchange rate is the price of one currency in terms of another. There is more than one way to measure it:
the nominal exchange rate 名义汇率 is the everyday market rate between two currencies.
the real exchange rate 实际汇率 adjusts the nominal rate for differences in prices between the countries, so it shows true competitiveness.
the trade-weighted exchange rate 贸易加权汇率, also called the effective exchange rate 有效汇率, is an average of a currency's value against all its trading partners, weighted by how much trade is done with each.
The three systems
a floating exchange rate 浮动汇率 is set by the demand for and supply of the currency.
a fixed exchange rate 固定汇率 is held at a set value by the central bank.
a managed exchange rate 管理浮动汇率 mostly floats, with the central bank stepping in at times.
Under floating rates, a rise in value is an appreciation 升值 and a fall is a depreciation. Under a fixed system, a deliberate rise is a revaluation 法定升值 and a deliberate fall is a devaluation. A weaker currency tends to raise exports and inflation; a stronger currency does the opposite.
The three exchange-rate systems, and the words for a rise or fall in each
Explore · Jelajahi
Exchange rates in the FX market · Kurs dalam pasar valuta asing (FX)
The exchange rate is set by the demand for and supply of the currency. Shift either to see the rate appreciate or depreciate. · Kurs ditetapkan oleh permintaan dan penawaran mata uang. Geser salah satu untuk melihat kurs appreciate atau depreciate.
distinguish economic growth and economic development and explain the characteristics of development
explain indicators of development including the Human Development Index (HDI) and other measures
Bahasa Indonesia
bedakan pertumbuhan ekonomi dan pembangunan ekonomi serta jelaskan karakteristik pembangunan
jelaskan indikator pembangunan termasuk Indeks Pembangunan Manusia (IPM) dan ukuran lainnya
Source: Cambridge International syllabus · Sumber: Silabus Cambridge International
It is important not to confuse two ideas:
Growth is more income; development is wider wellbeing too
economic growth 经济增长 is simply a rise in real output.
economic development 经济发展 is wider. It is about people's standard of living 生活水平 — their health, education, and freedom of choice, not just their income.
Economic development is wider than growth: it is about living standards in a fast-growing developing economy.
A country can grow without developing much (if the extra income goes to a few people). Development usually means rising incomes plus better health, more schooling, and less poverty.
Measuring development
The best-known measure is the Human Development Index 人类发展指数 (HDI). It combines three things into one number between 0 and 1:
income (GNI per person),
health (life expectancy 预期寿命 at birth),
education (mean and expected years of schooling 受教育年限).
The HDI rolls income, health and education into one number — so it captures living standards far better than income alone
Other useful signs of development include access to clean water, the number of doctors per person, and mobile-phone and internet use.
Explore · Jelajahi
Development chain lab · Laboratorium rantai pengembangan
Follow how policy and resources can change living standards. · Ikuti bagaimana kebijakan dan sumber daya dapat mengubah standar hidup.
Human Development Index/ˈhjuːmən dɪˈveləpmənt ˈɪndeks/
Indeks Pembangunan Manusia
life expectancy/laɪf ekˈspektənsi/
angka harapan hidup
years of schooling/jɪəz ɒv ˈskuːlɪŋ/
tahun sekolah
11.4
Comparing countries at different levels of development
Syllabus · Silabus
English
compare the economic and demographic characteristics of countries at different levels of development (income, population, employment structure, education, health)
explain the factors that influence the level of development
Bahasa Indonesia
bandingkan karakteristik ekonomi dan demografis negara pada tingkat pembangunan yang berbeda (pendapatan, populasi, struktur pekerjaan, pendidikan, kesehatan)
jelaskan faktor-faktor yang memengaruhi tingkat pembangunan
Source: Cambridge International syllabus · Sumber: Silabus Cambridge International
We often compare a developed country 发达国家 (high income, like Germany) with a developing country 发展中国家 (lower income, like Kenya). They differ in clear ways:
Feature
Developed
Developing
income per person
high
low
birth rate 出生率 and population growth
low
often high
life expectancy
high
lower
share of workers in farming
small
large
The employment structure 就业结构 also differs. As a country develops, workers move out of the primary sector 第一产业 (farming and mining), into the secondary sector 第二产业 (making goods), and later into the tertiary sector 第三产业 (services).
As a country develops, workers shift out of the primary sector and into the secondary and then the tertiary (services) sector.
Many things shape development: savings and investment, the quality of education and health, infrastructure, stable government and law, and access to world markets.
Explore · Jelajahi
Economics case lab · Laboratorium kasus ekonomi
Classify real examples by the economic idea they show. · Klasifikasikan contoh nyata berdasarkan ide ekonomi yang ditampilkannya.
explain the relationship between developed and developing countries through trade, aid, debt, foreign direct investment and multinationals, and migration/remittances
evaluate the impact of these relationships on development
Bahasa Indonesia
jelaskan hubungan antara negara maju dan berkembang melalui perdagangan, bantuan, utang, investasi asing langsung dan multinasional, serta migrasi/remittance
evaluasi dampak hubungan ini terhadap pembangunan
Source: Cambridge International syllabus · Sumber: Silabus Cambridge International
Richer and poorer countries are linked in several ways, each with good and bad sides.
trade can raise incomes, but many developing countries rely on a few primary exports whose prices swing sharply.
foreign aid 援助 can fund schools and roads, but it may create dependency or be wasted.
debt 债务 owed to other countries can pay for development, but repaying it can drain a poor country's budget.
foreign direct investment 外国直接投资 (FDI) by a multinational corporation 跨国公司 brings money, jobs and technology, but profits may flow back abroad and workers may be poorly treated.
migration 移民 of workers can ease unemployment and bring in remittances 侨汇 (money sent home), but it can also drain a country of its most skilled people.
Explore · Jelajahi
Economics case lab · Laboratorium kasus ekonomi
Classify real examples by the economic idea they show. · Klasifikasikan contoh nyata berdasarkan ide ekonomi yang ditampilkannya.
explain globalisation and its causes and the role of multinational corporations and trade blocs
evaluate the benefits and costs of globalisation for developed and developing economies
Bahasa Indonesia
jelaskan globalisasi dan penyebabnya serta peran perusahaan multinasional dan kerjasama dagang regional
evaluasi manfaat dan biaya globalisasi bagi perekonomian maju dan berkembang
Source: Cambridge International syllabus · Sumber: Silabus Cambridge International
globalisation 全球化 is the growing links between countries — in trade, money, technology and people — so that the world acts more like one market. Its causes include cheaper transport and communication, free trade 自由贸易 agreements, and the spread of multinational firms.
Countries often join a trade bloc 贸易集团 — a group that trades freely among themselves (like the European Union).
Globalisation: falling trade and transport costs tie national economies together.
Benefits and costs
Benefits
Costs
lower prices and more choice
some industries and jobs are lost to cheaper countries
faster growth and technology transfer
the gap between rich and poor can widen
larger markets for firms
more pollution and use of resources
poorer countries can industrialise
powerful multinationals may avoid tax and dodge protectionism 贸易保护主义 rules
Globalisation helps developed and developing economies in different ways, but the gains are not shared evenly, which is why it remains so argued about.
Explore · Jelajahi
Open economy lab · Laboratorium ekonomi terbuka
See how trade or exchange-rate pressure changes domestic outcomes. · Lihat bagaimana tekanan perdagangan atau kurs mata uang mengubah hasil domestik.
Pick one and the site follows you — notes, papers, videos and practice all open on it. · Pilih satu dan situs mengikuti Anda — catatan, kertas, video, dan latihan semua terbuka di sana.
Type to search notes, lessons, code, vocabulary and past-paper questions across every subject. · Ketik untuk mencari catatan, pelajaran, kode, kosakata, dan pertanyaan soal lama di setiap mata pelajaran.

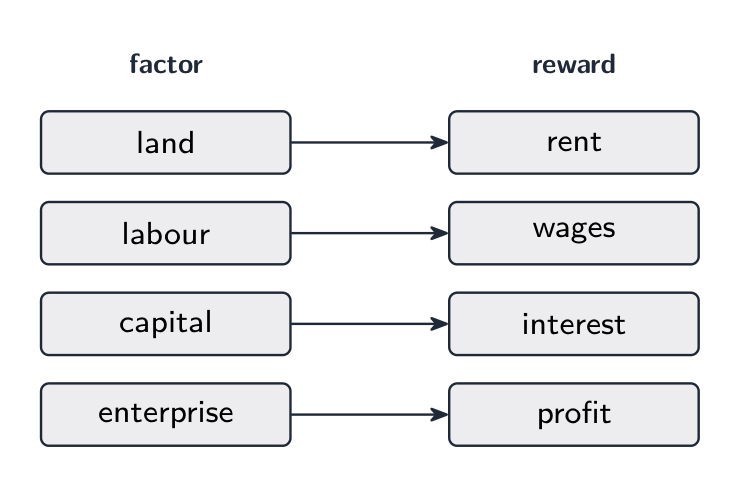


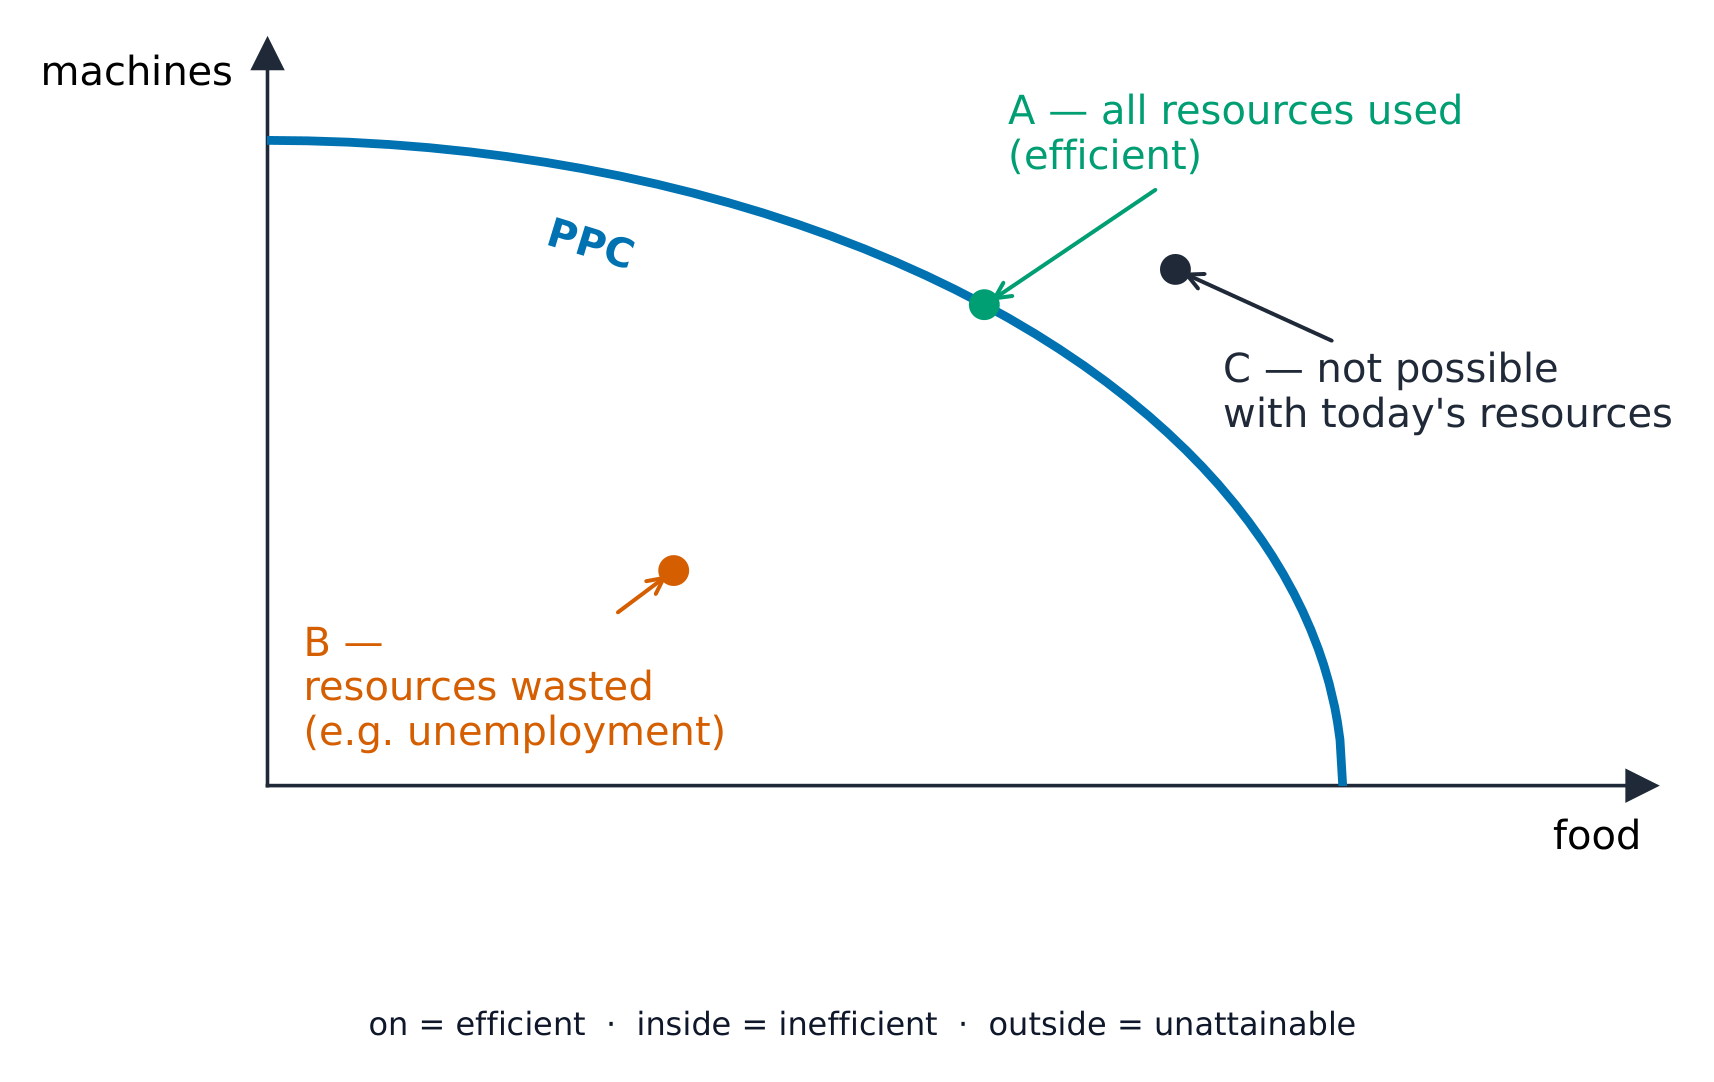


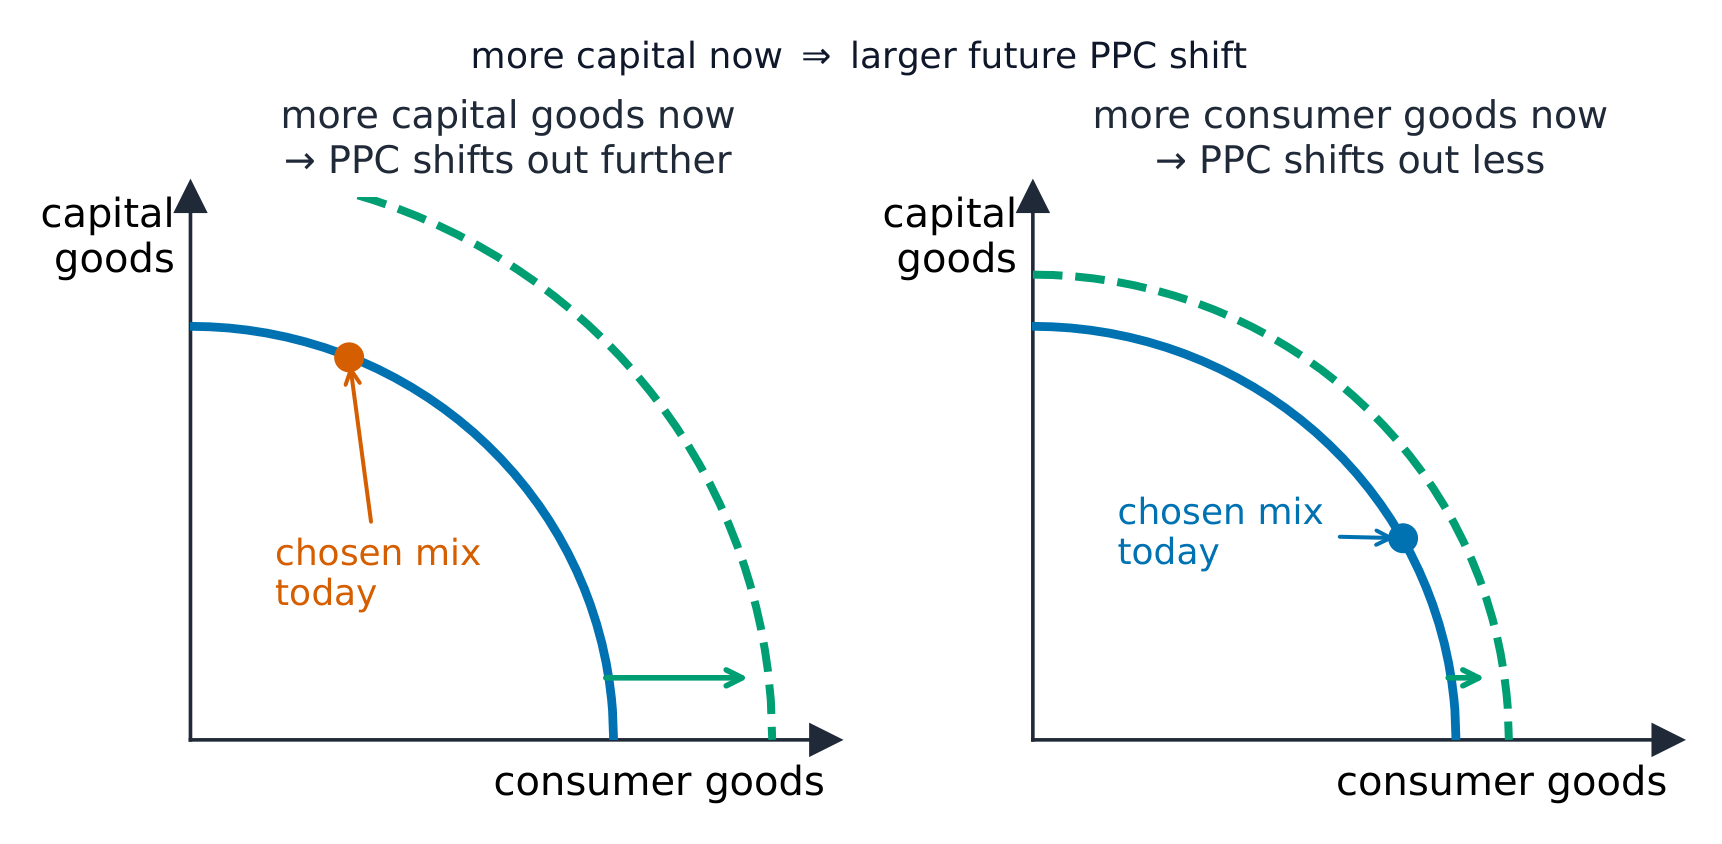

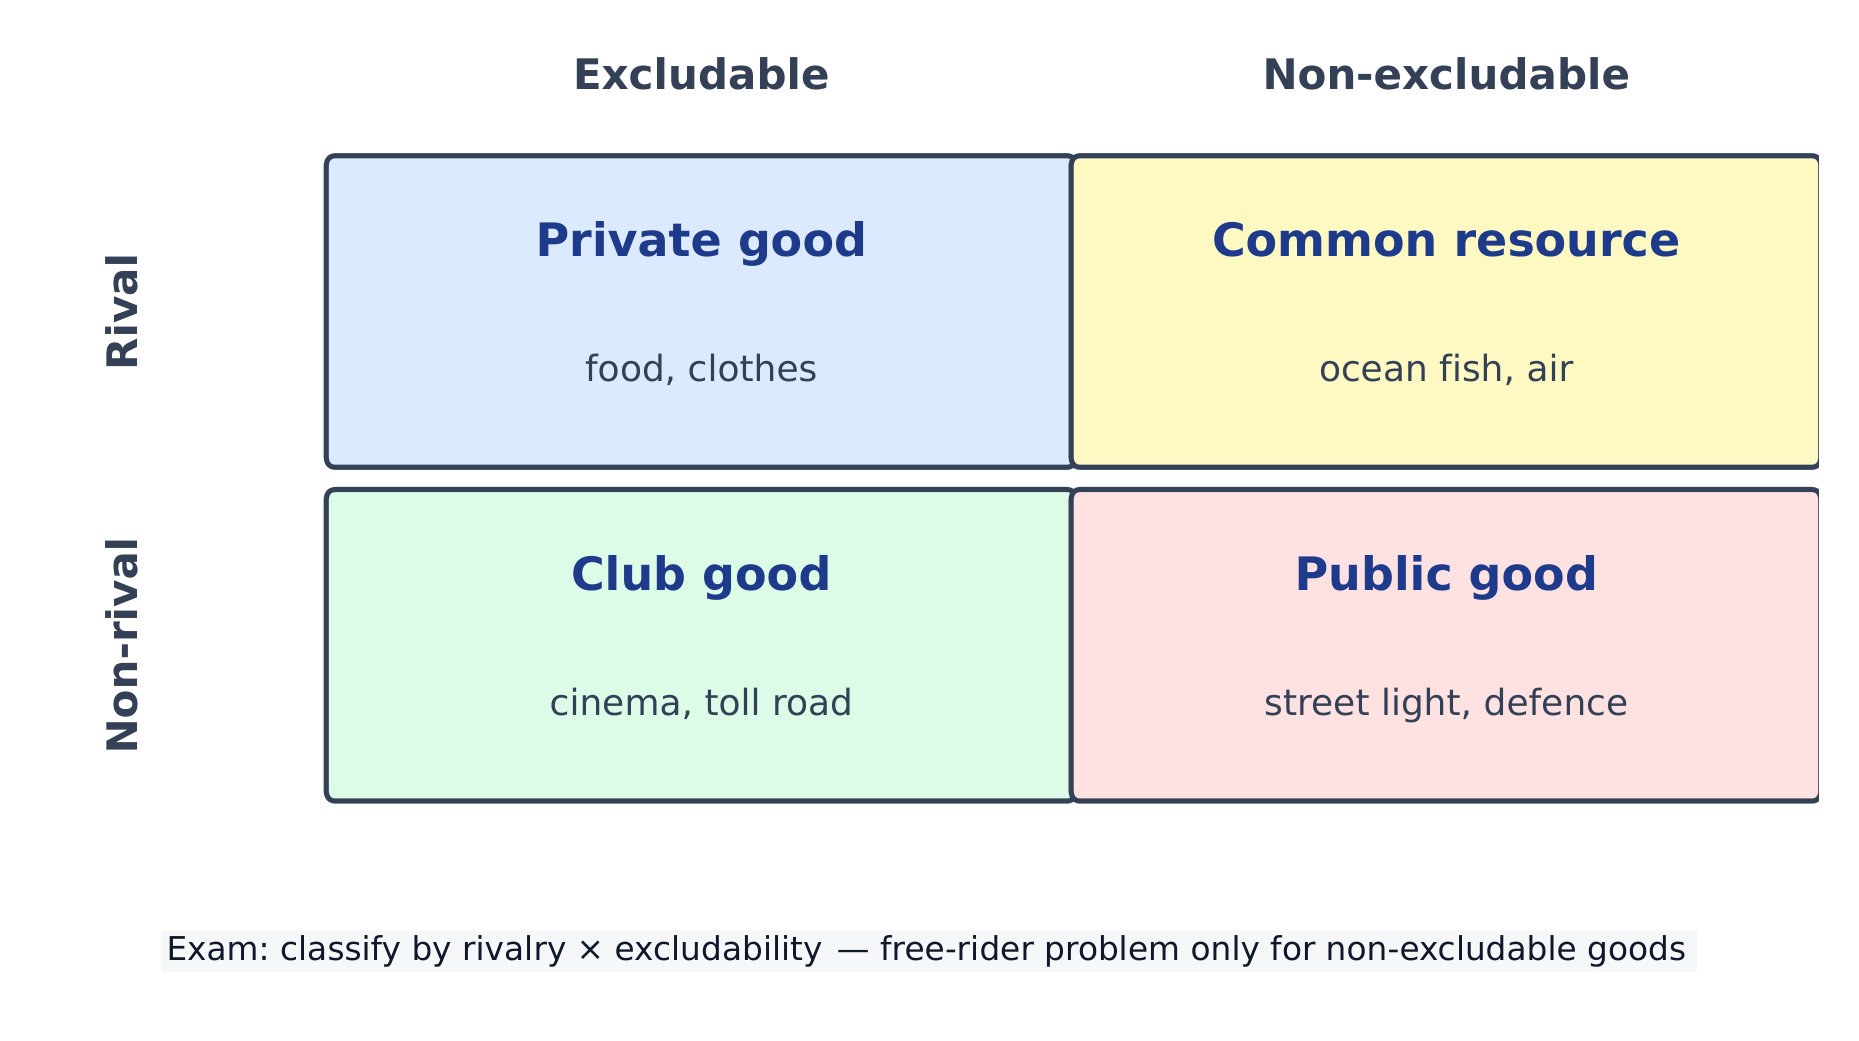


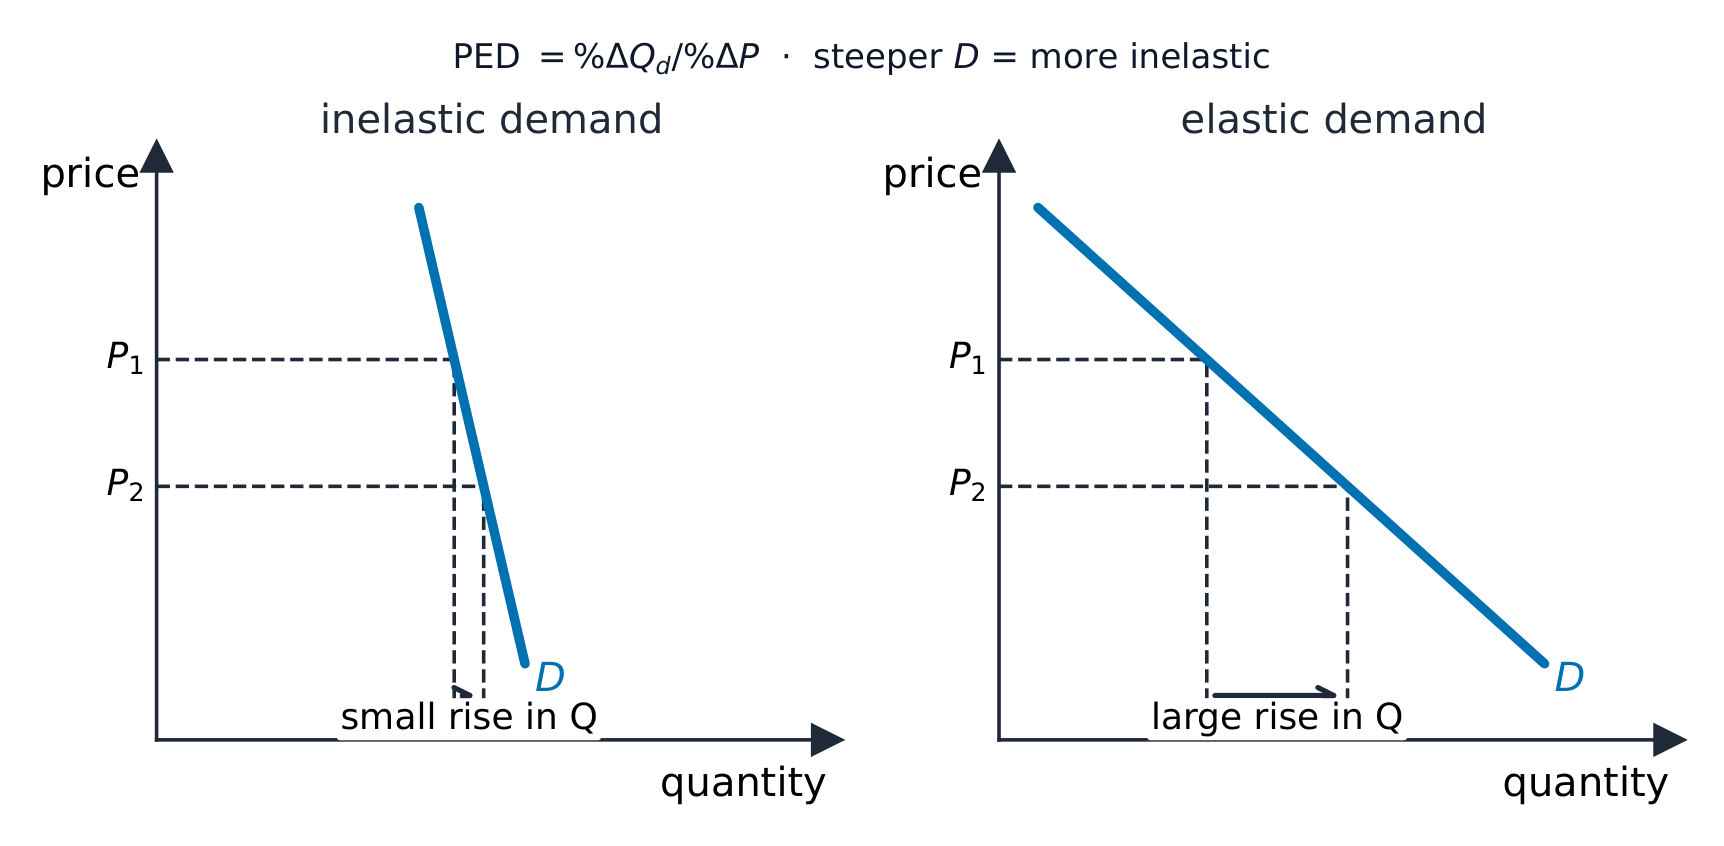


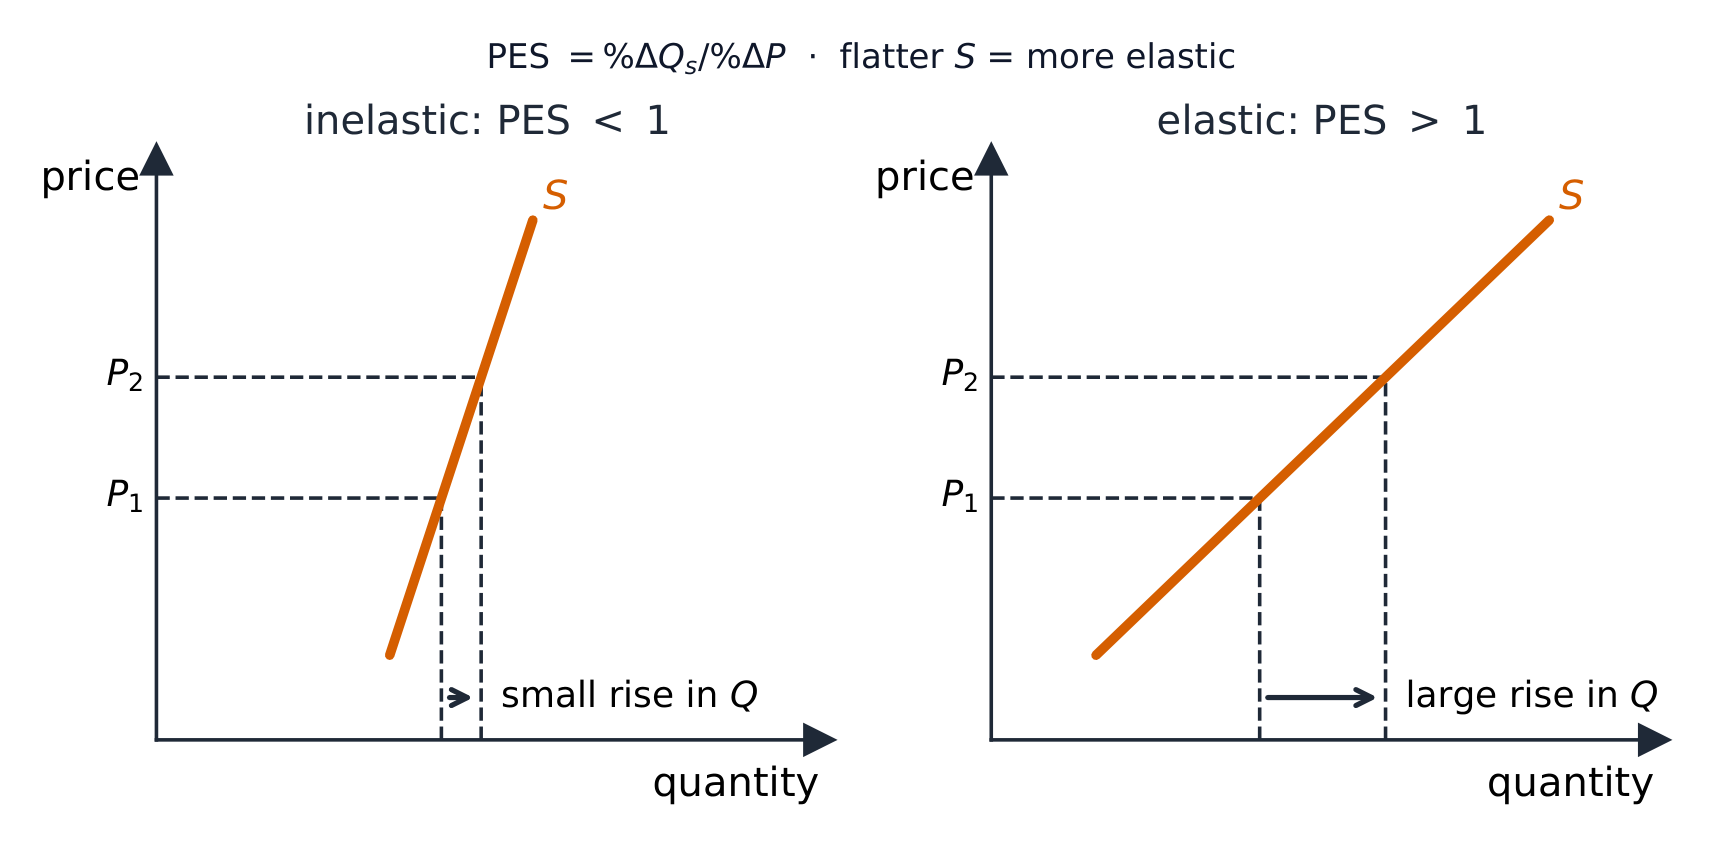

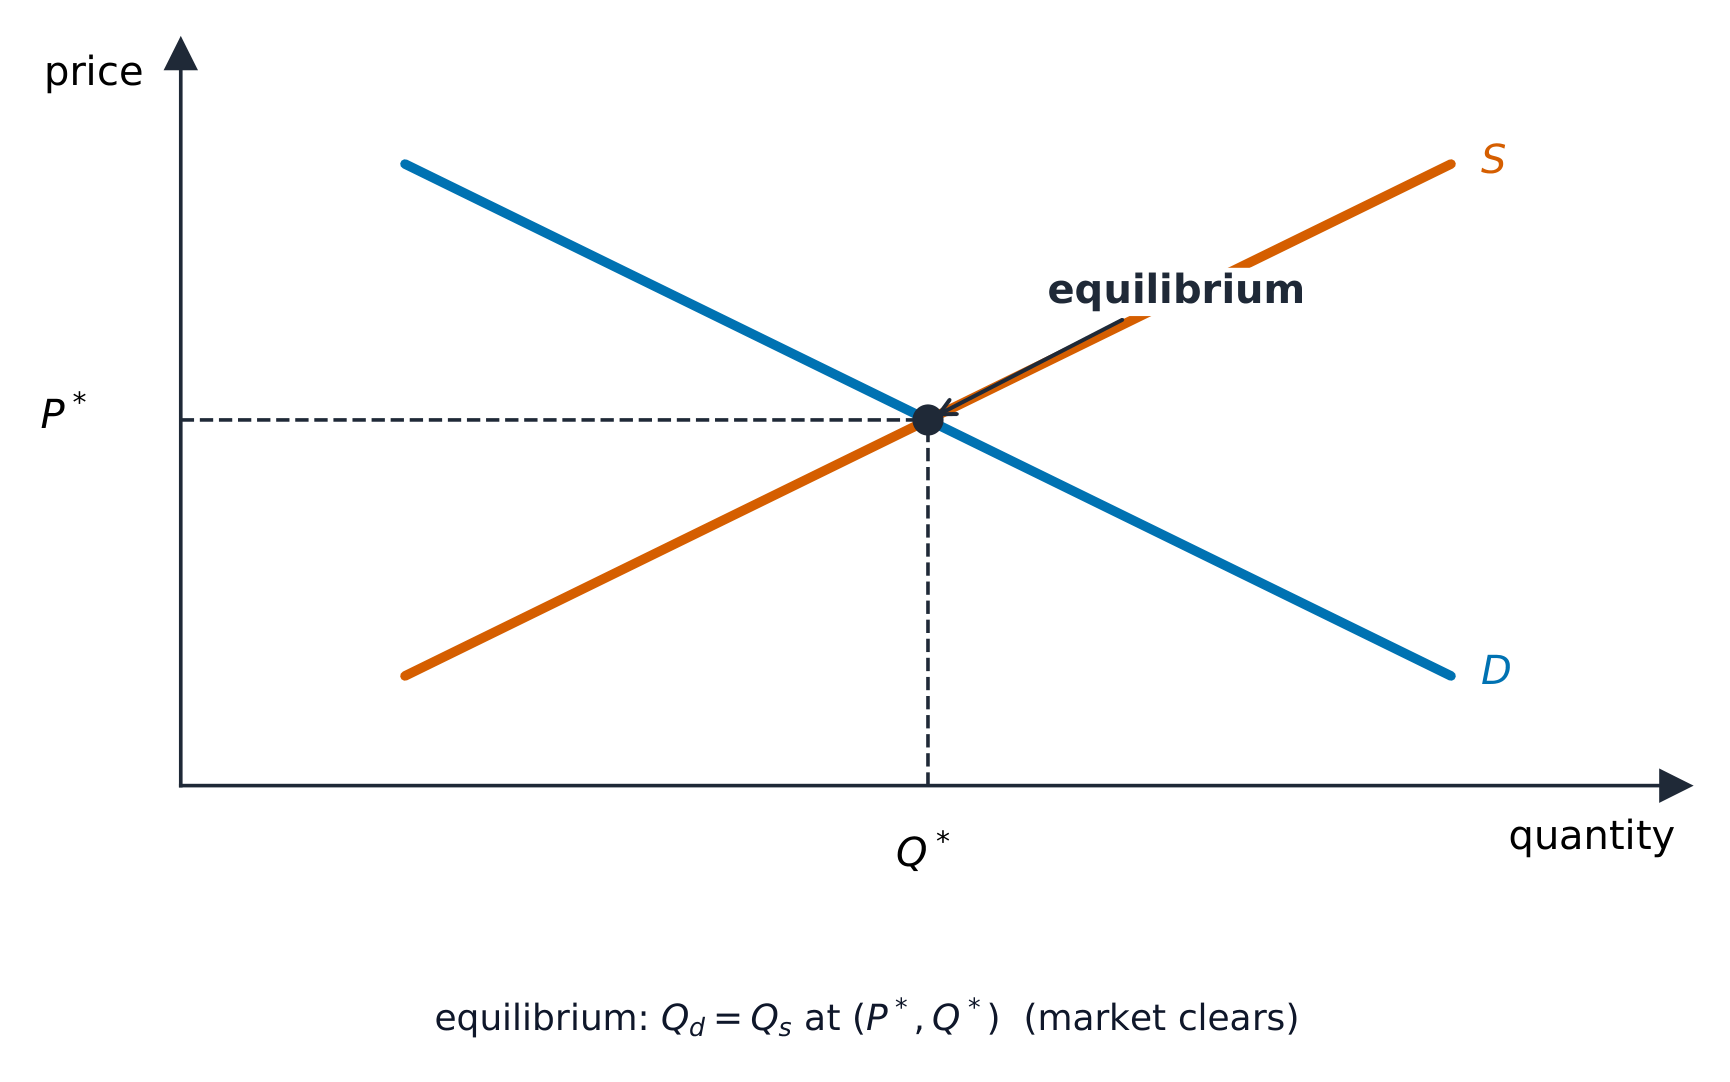
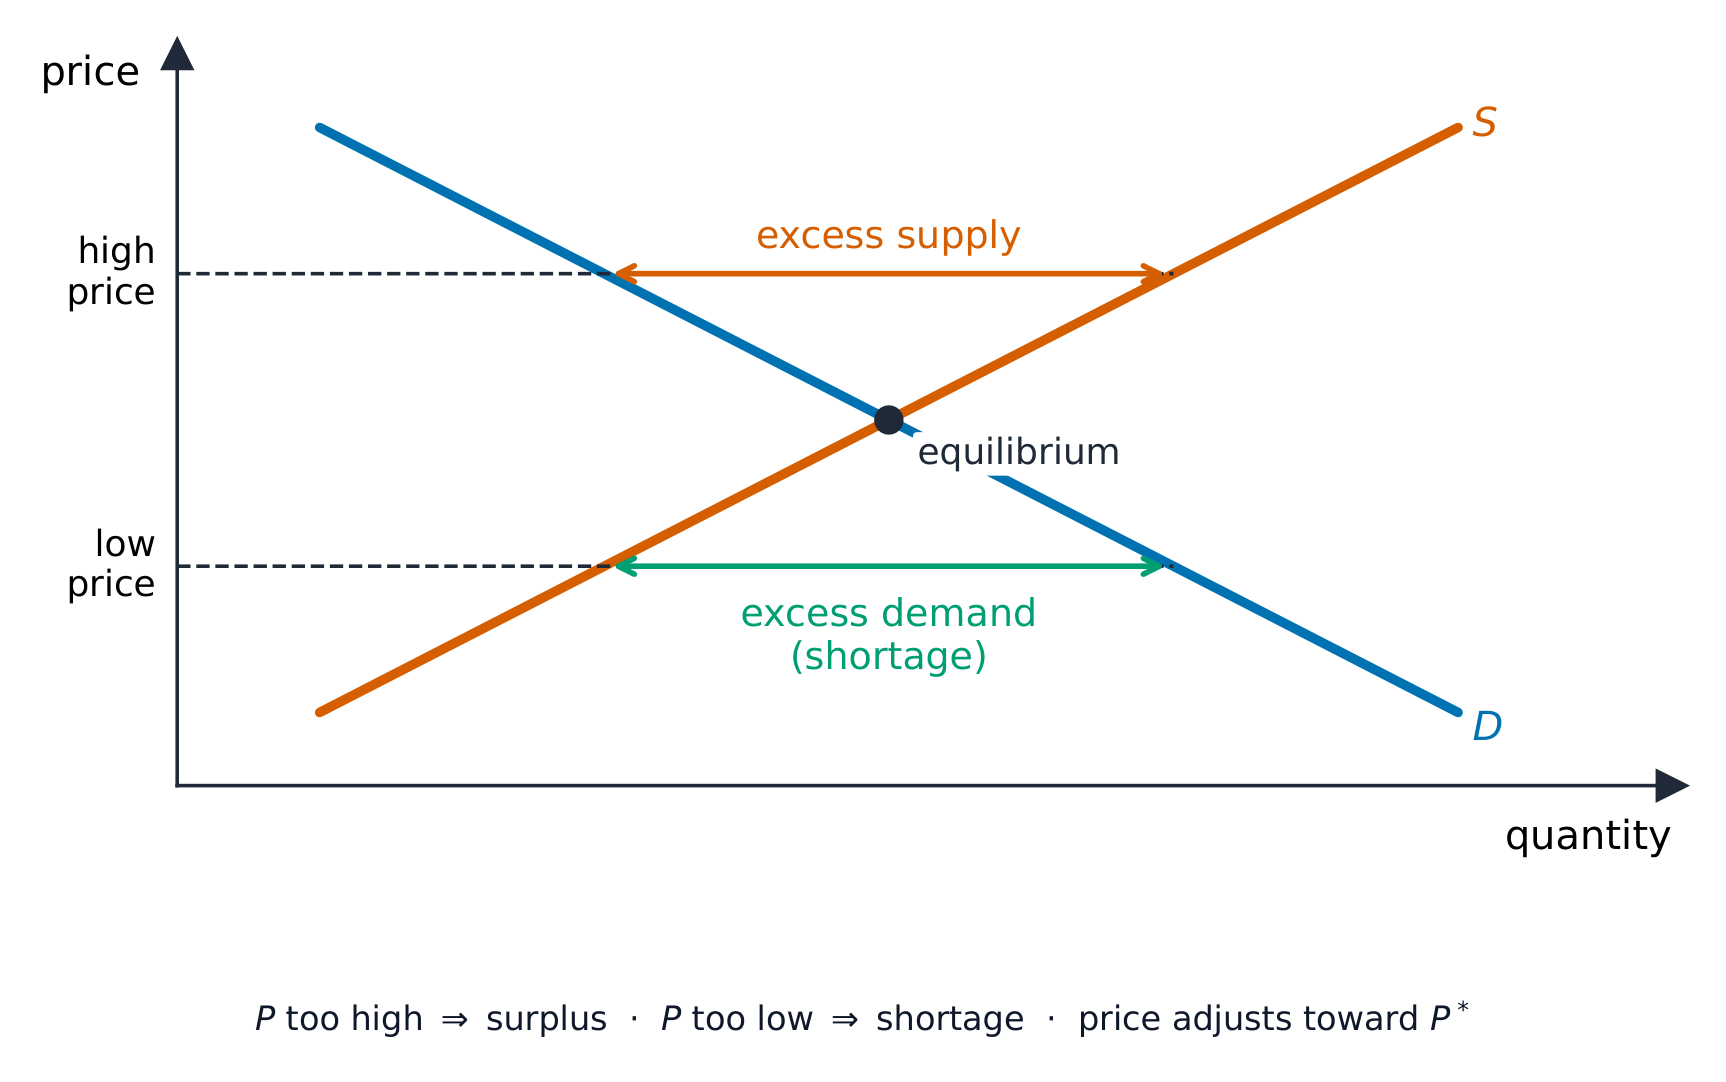
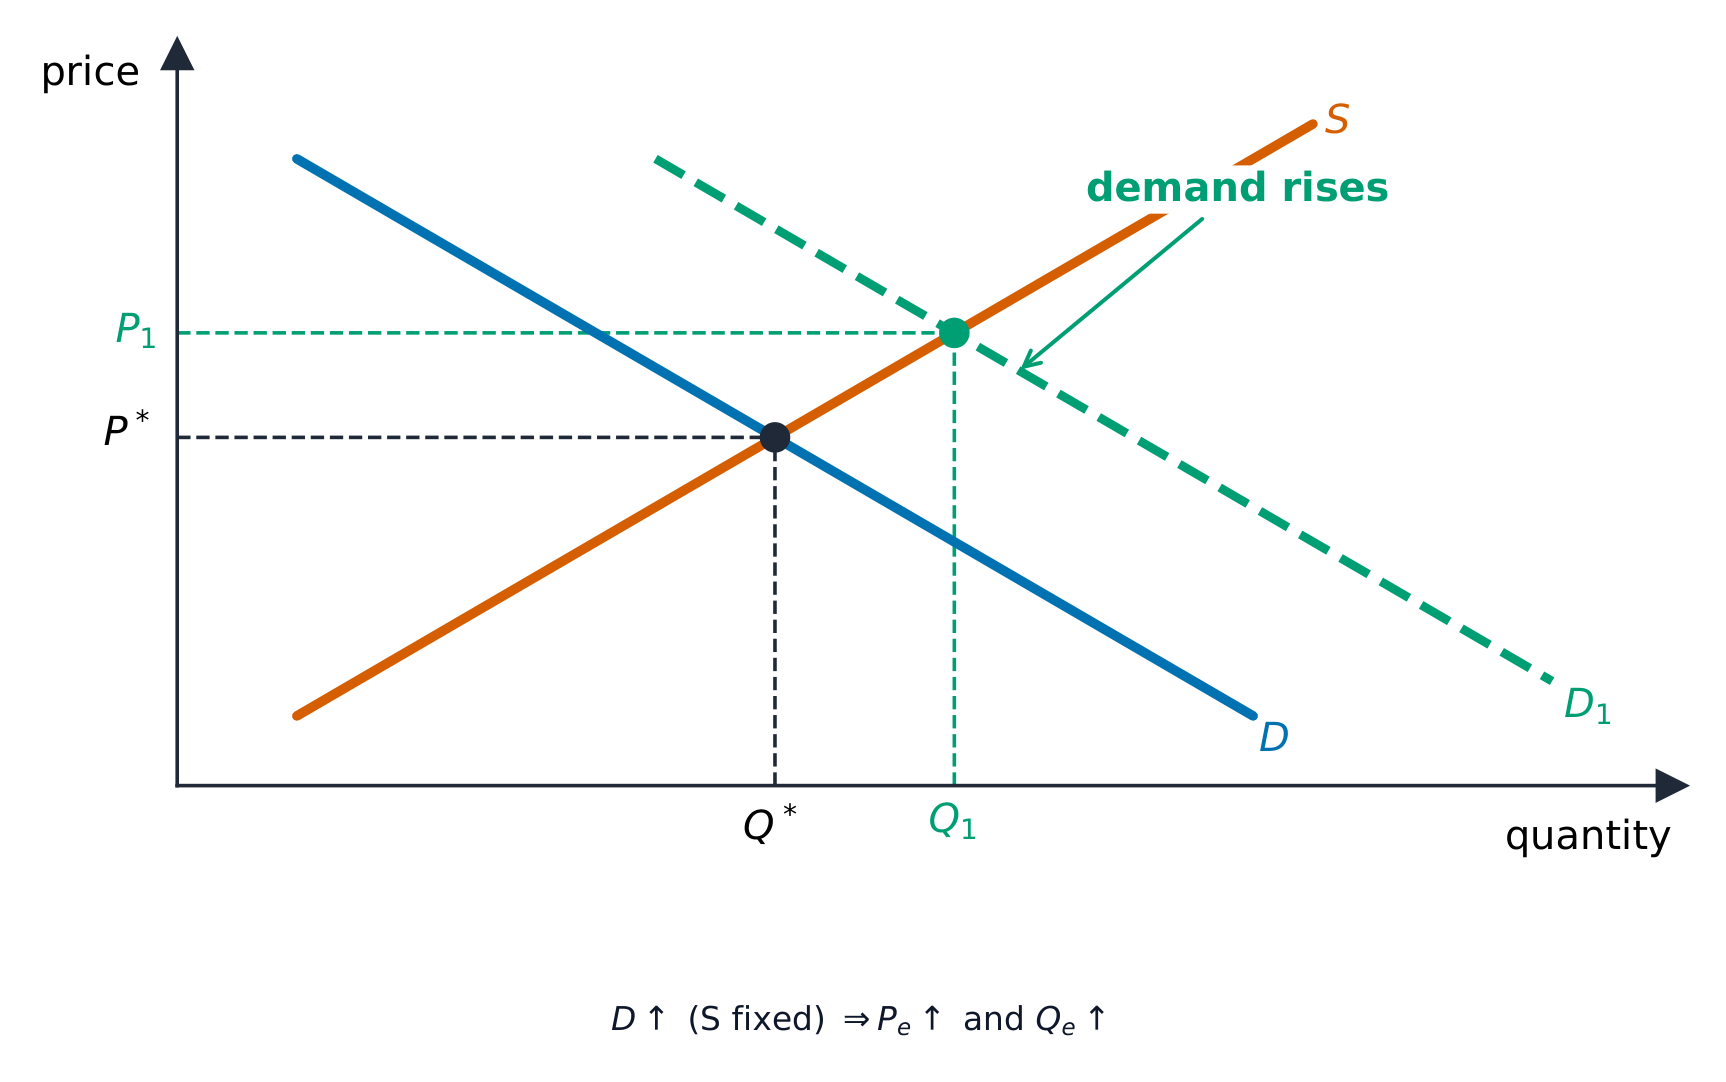
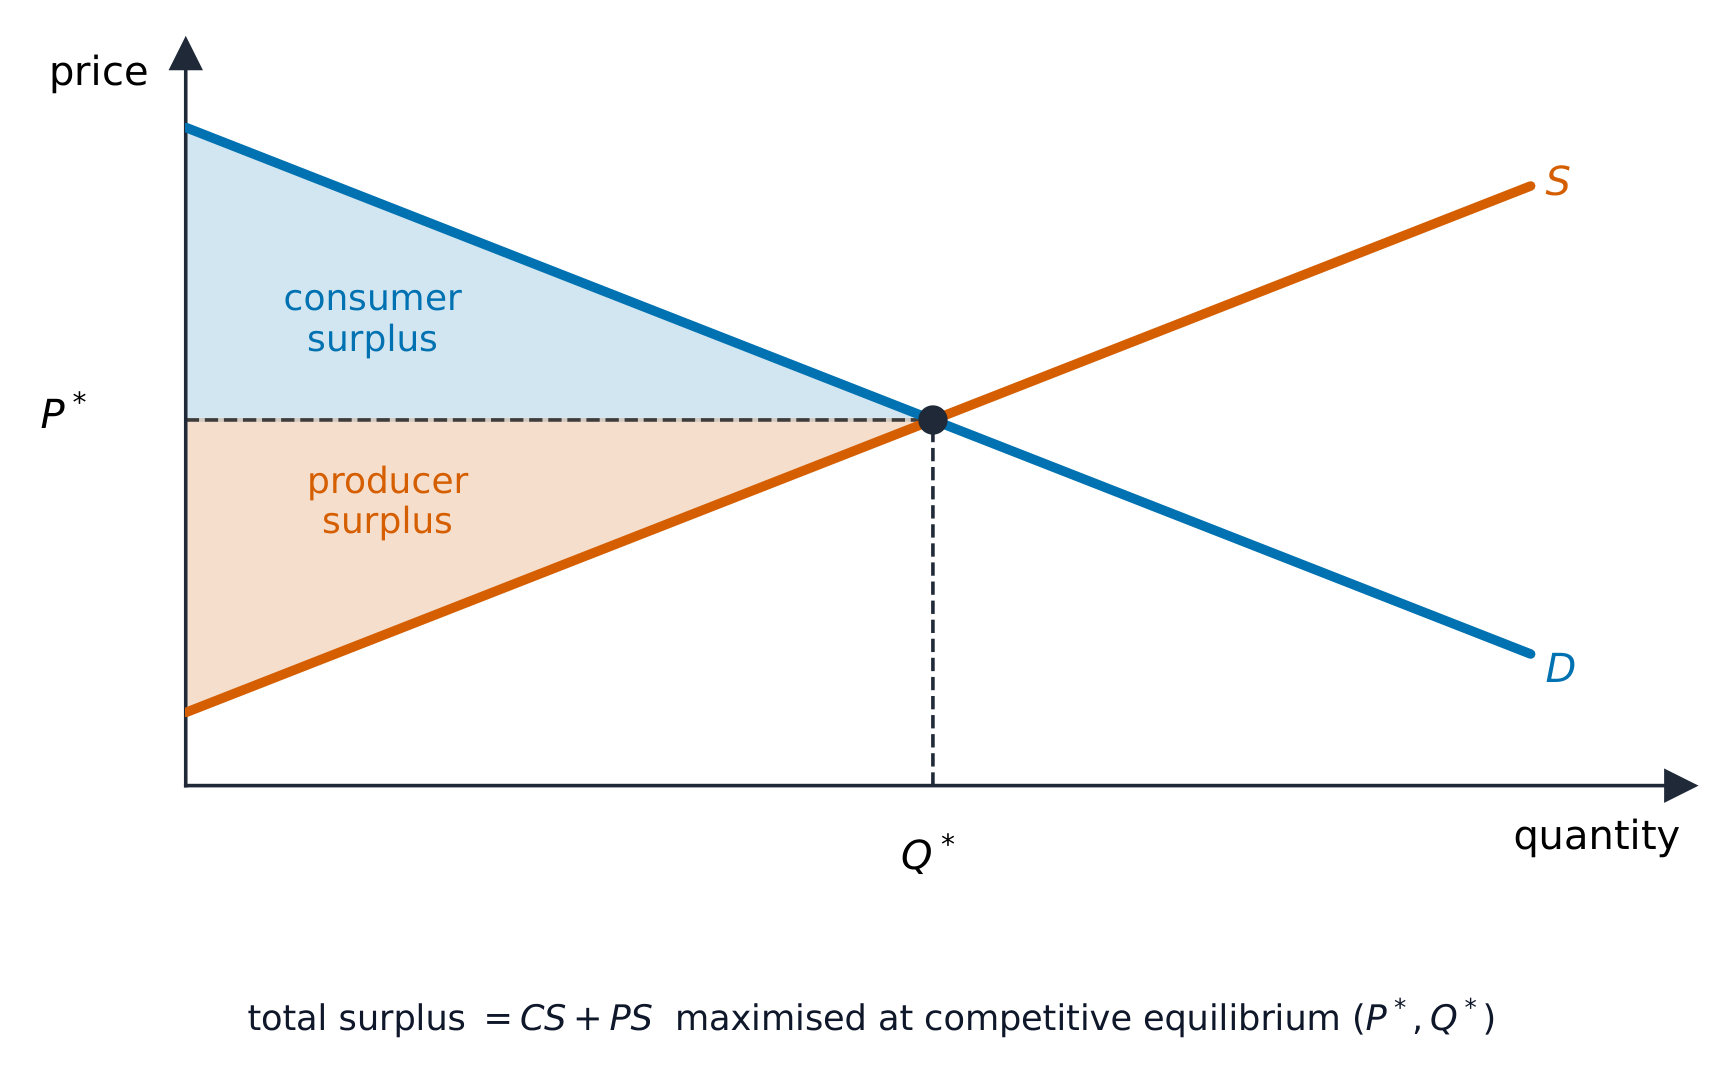

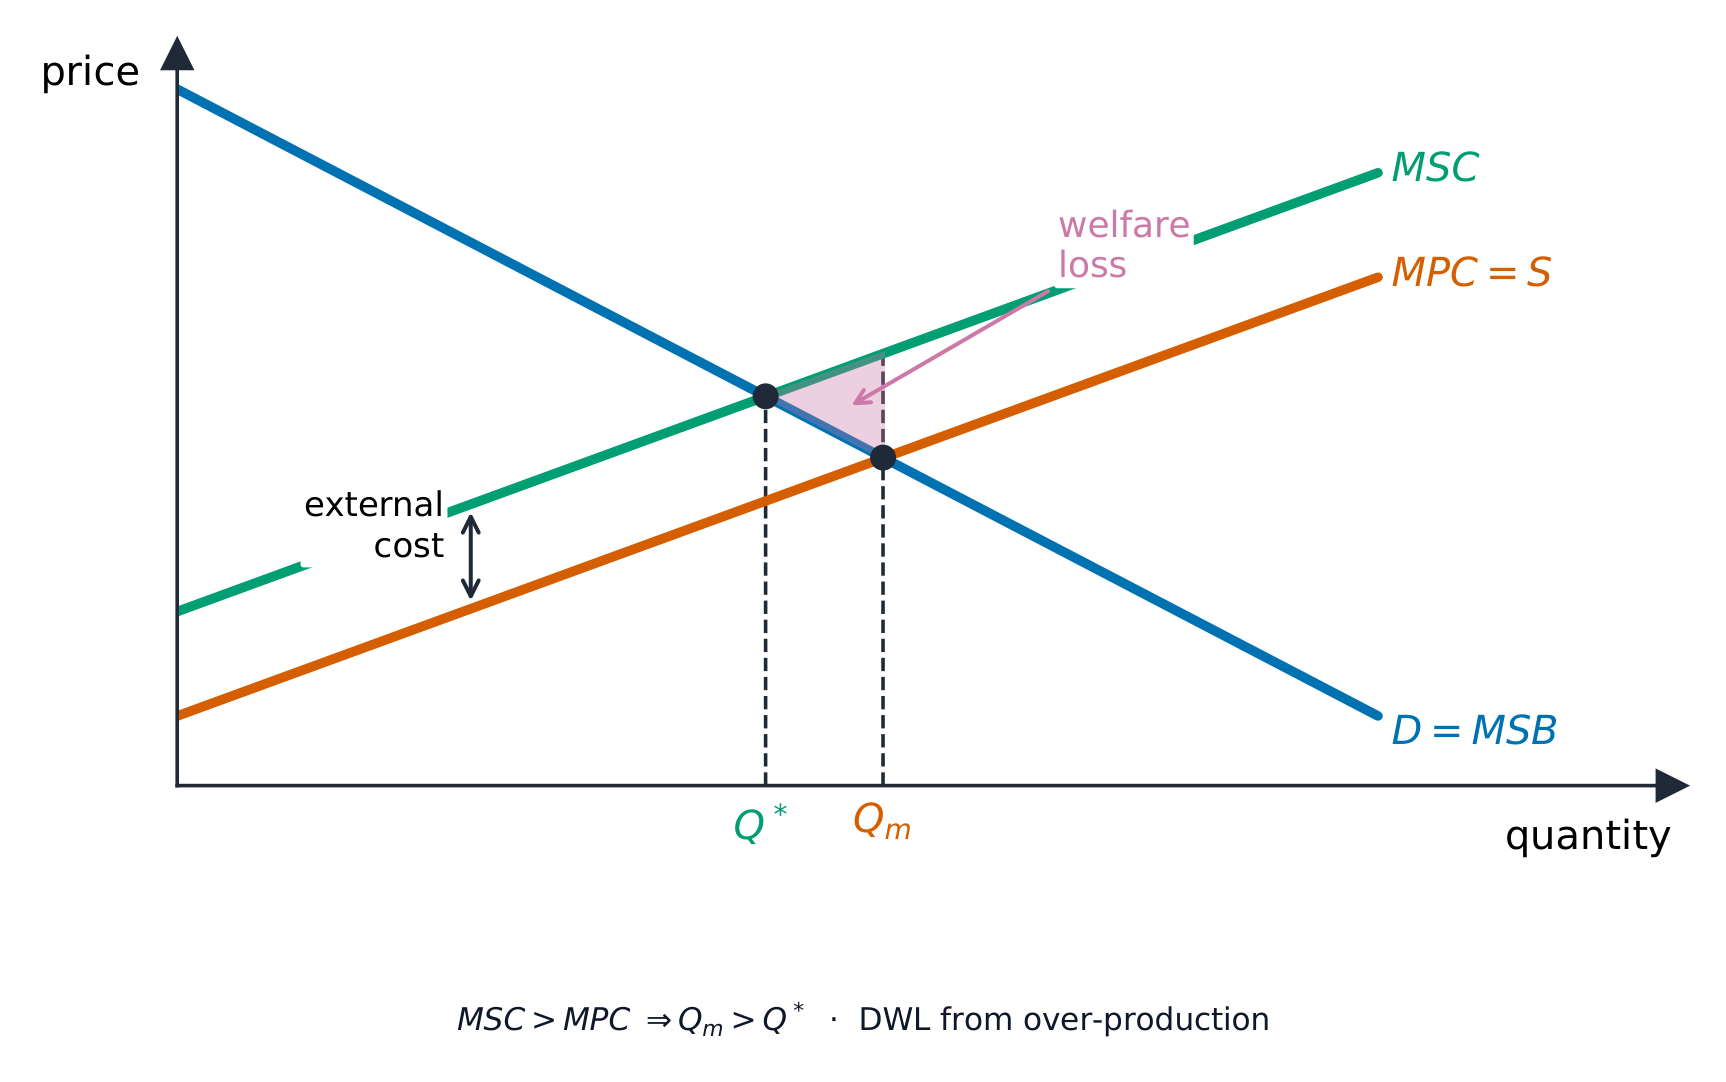


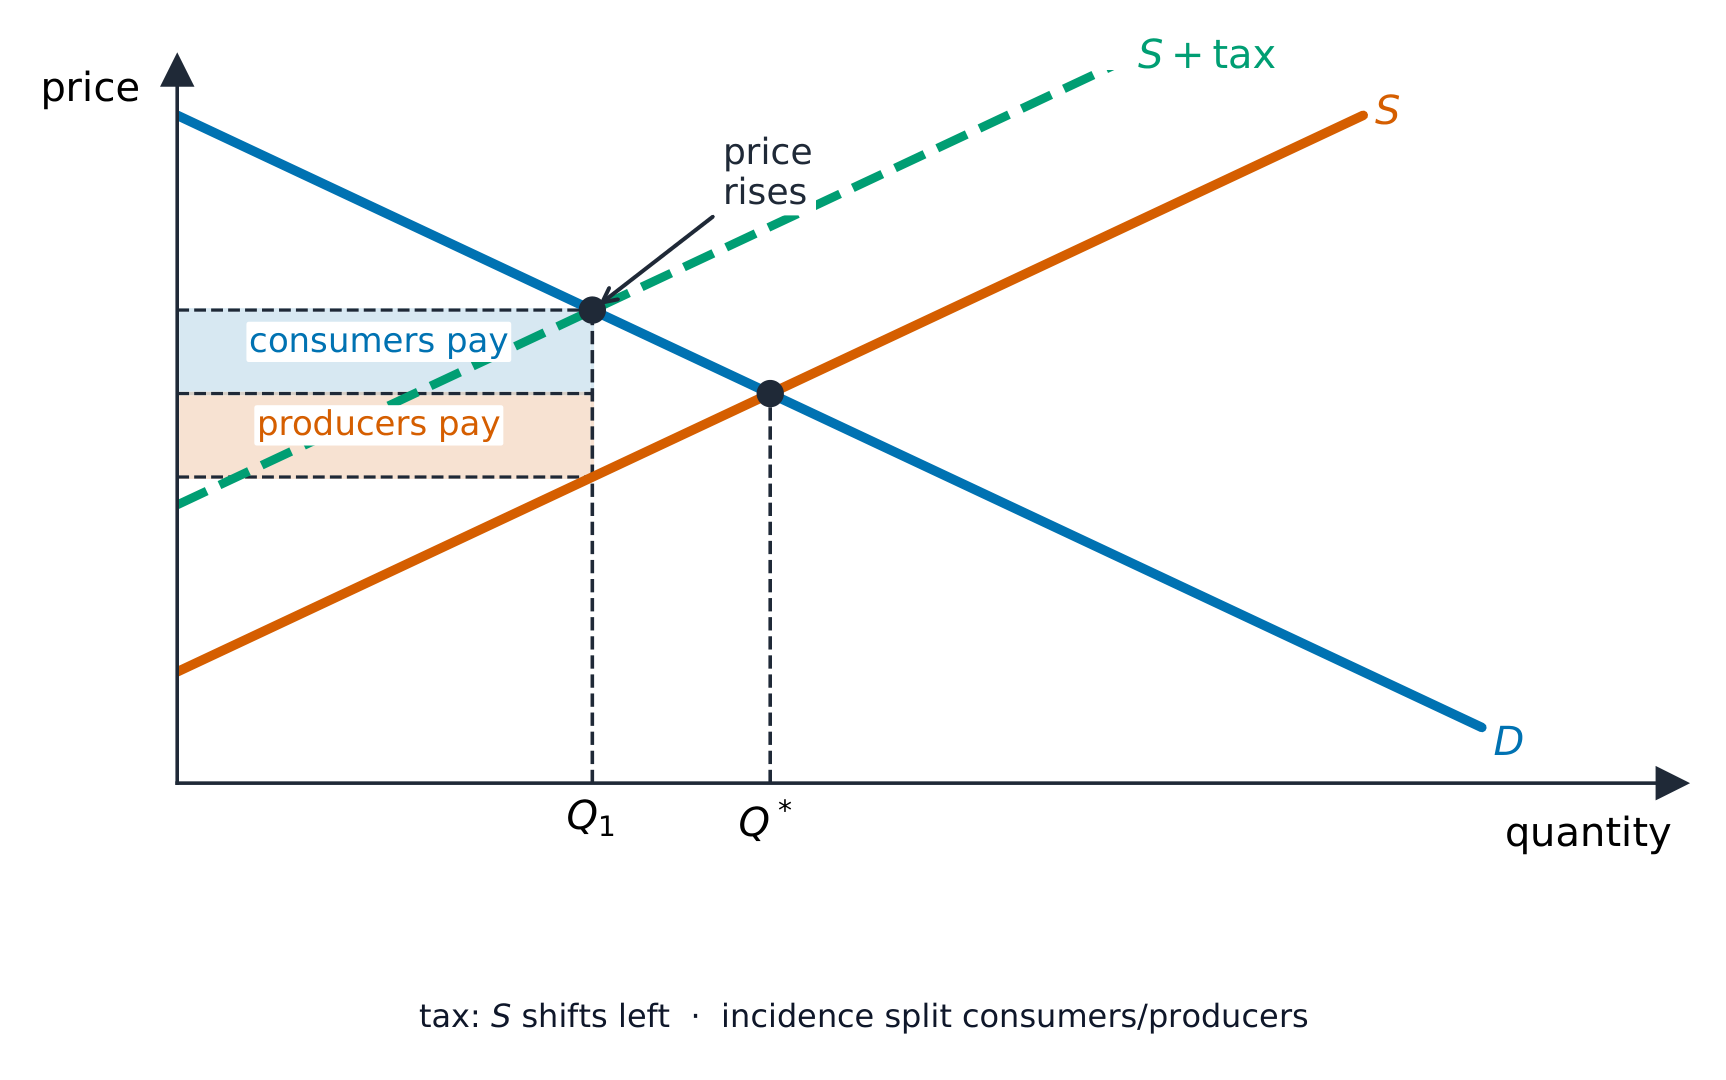

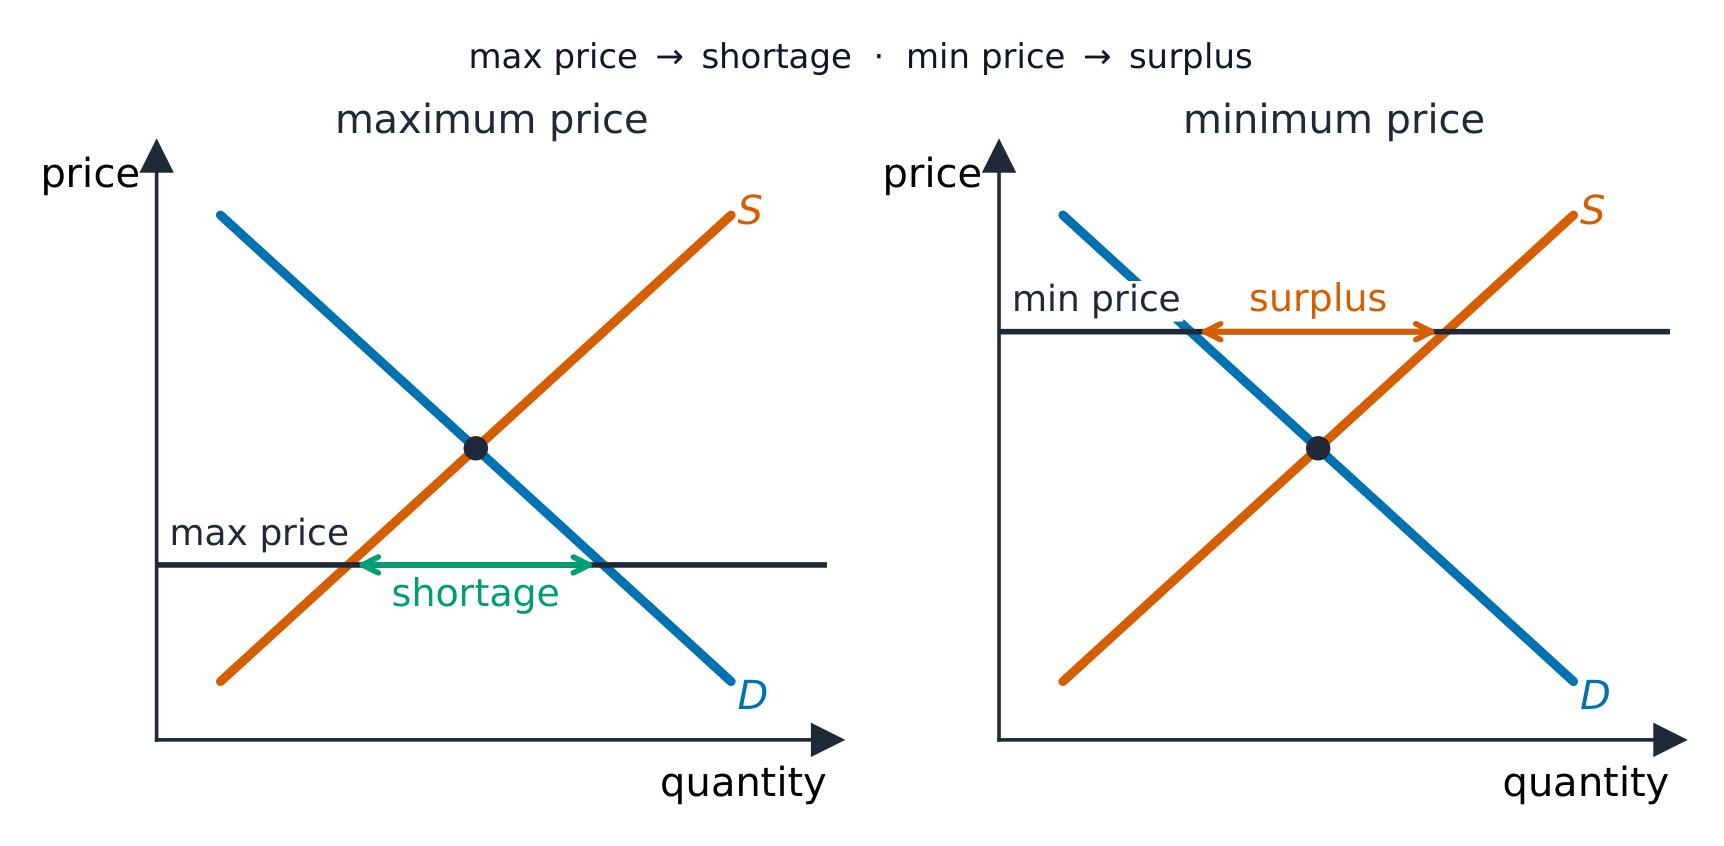


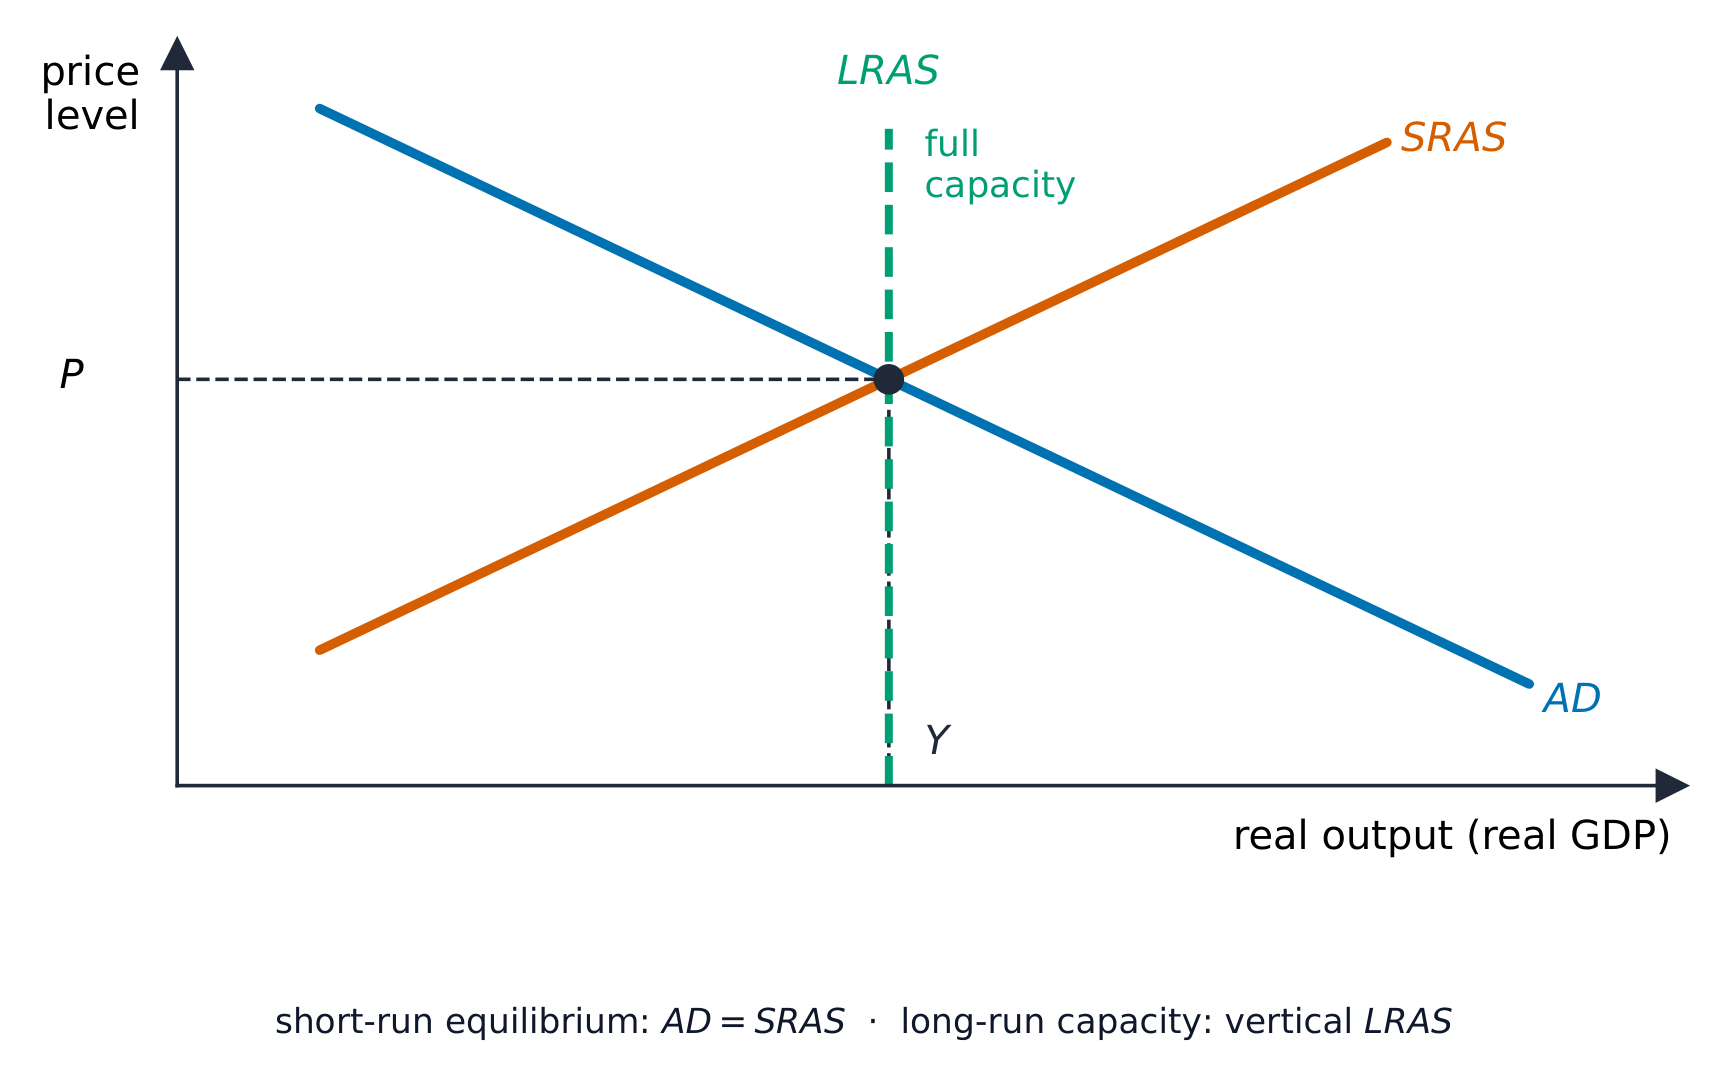
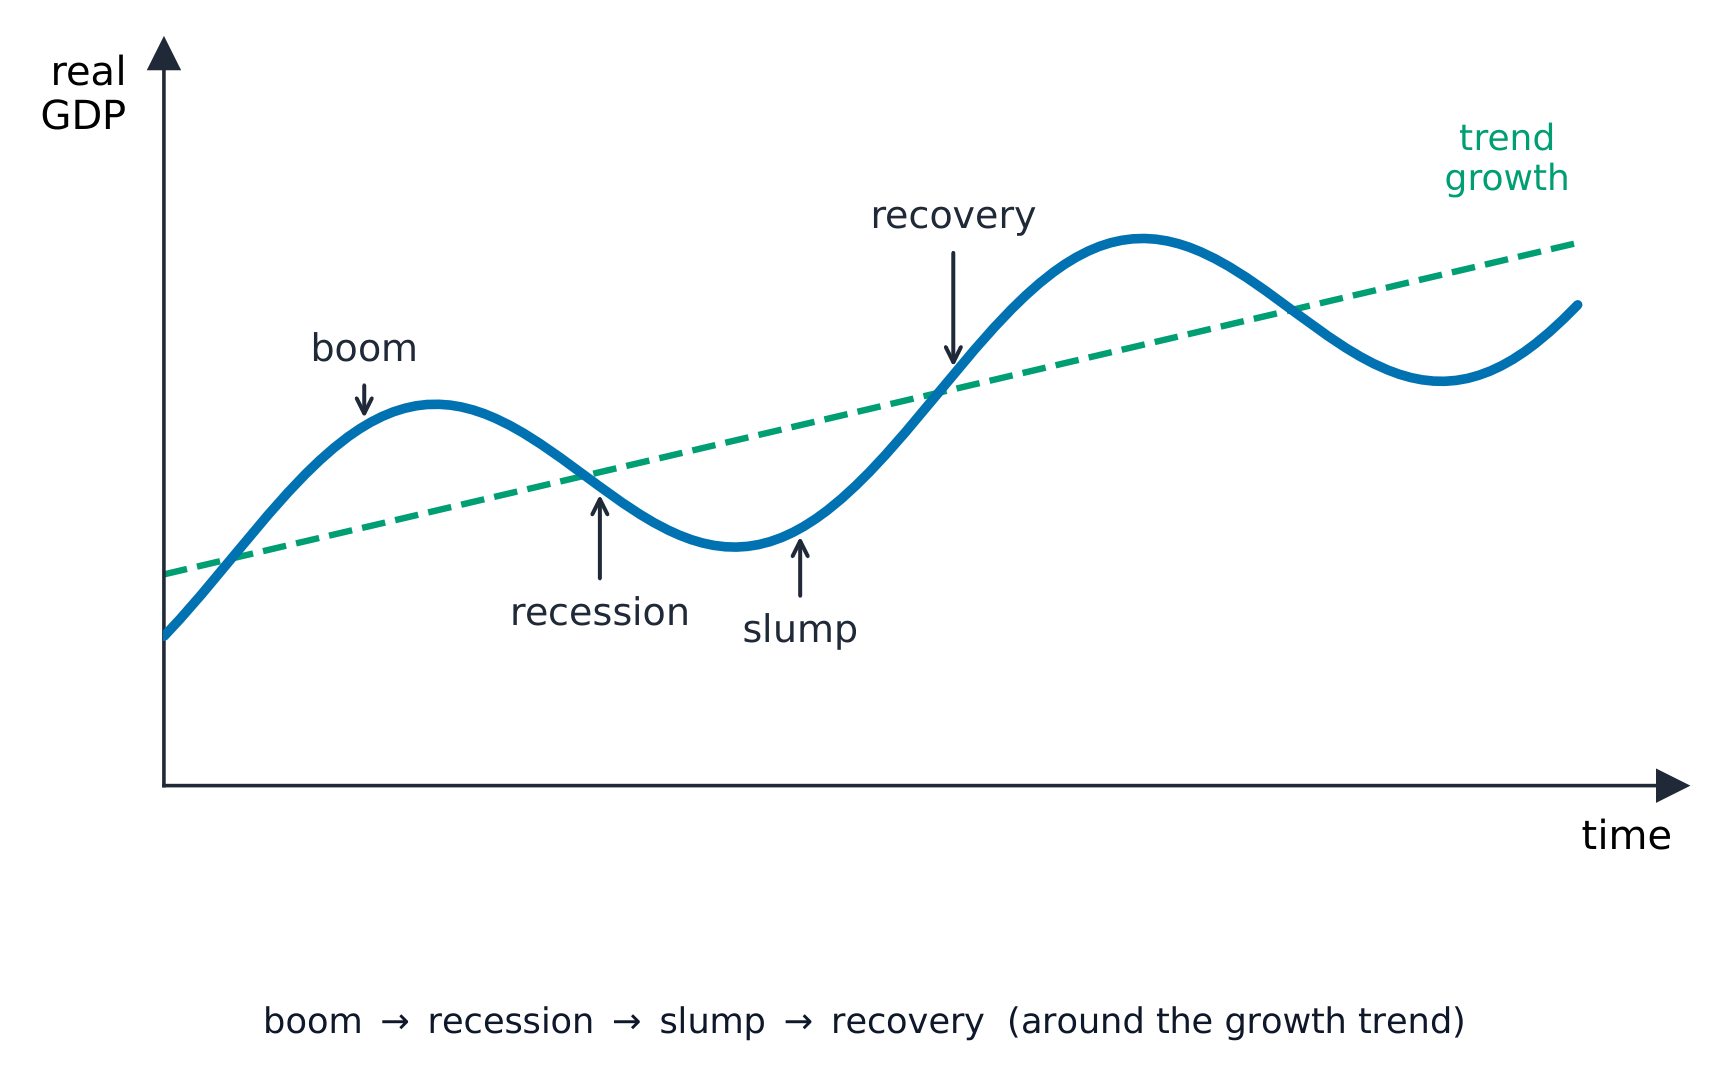
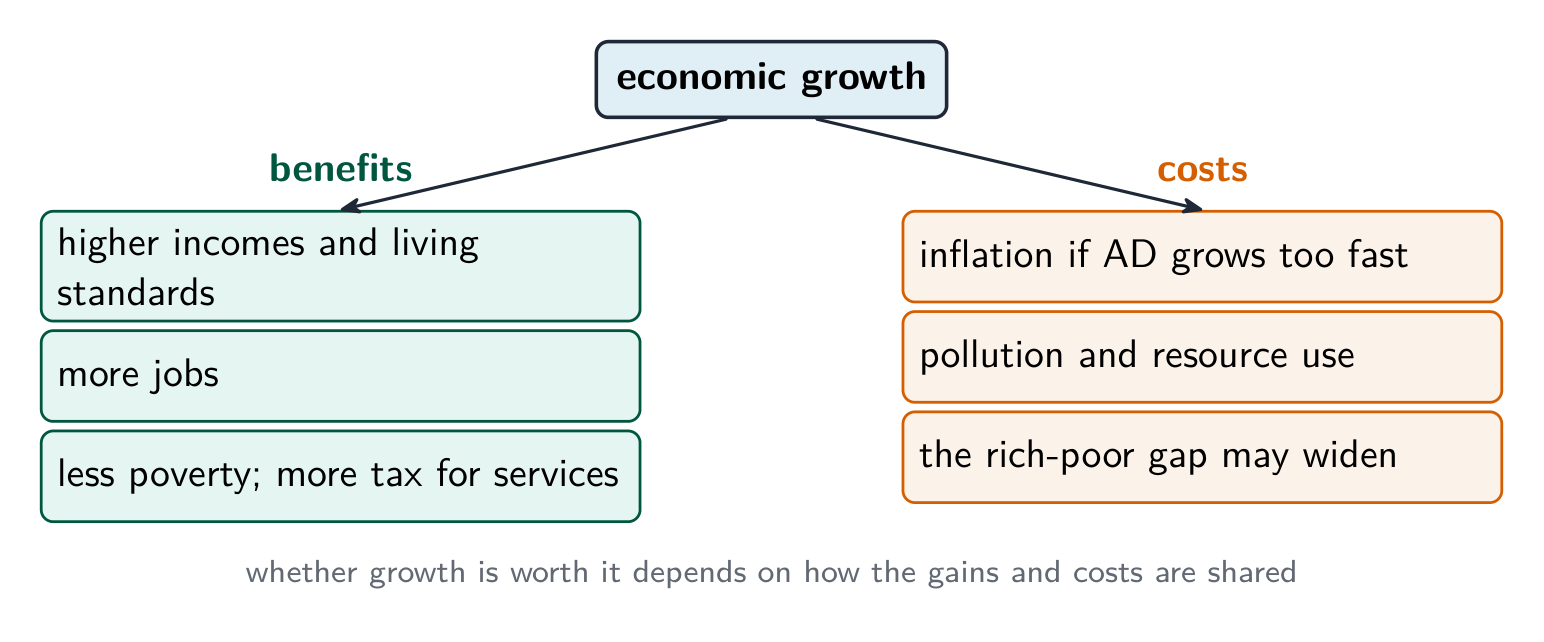
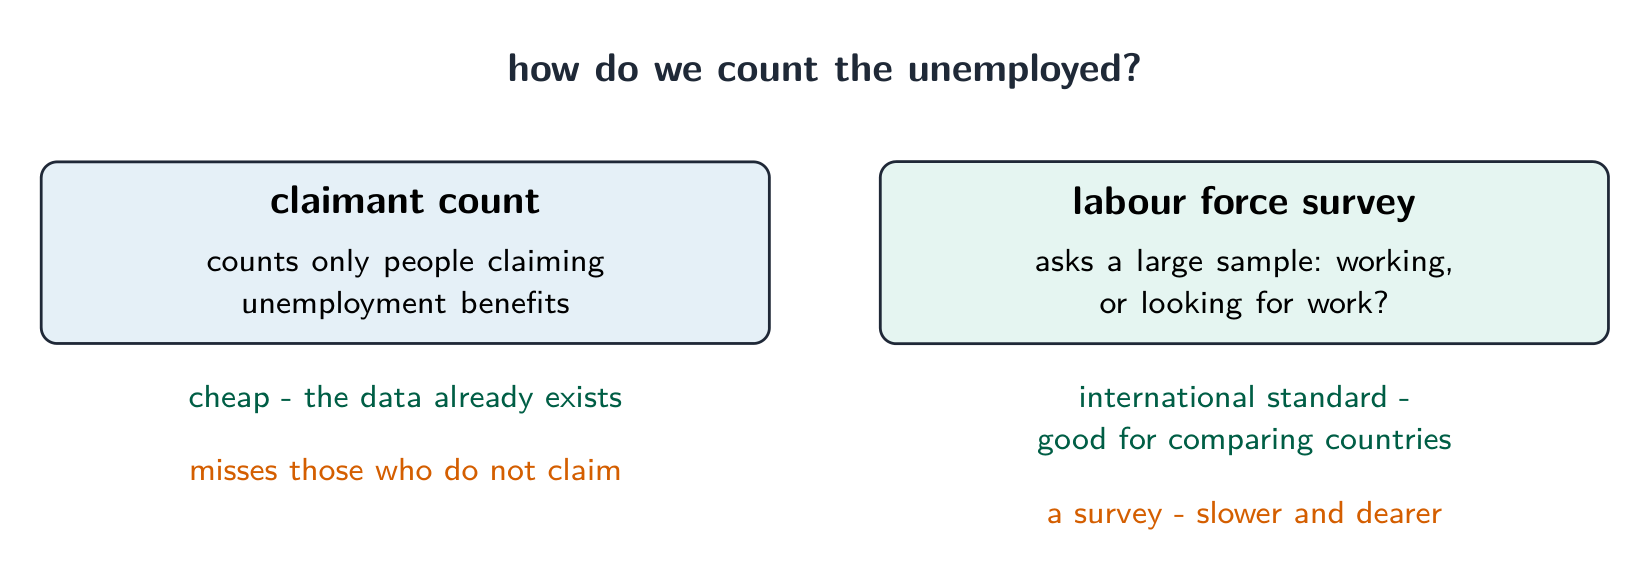


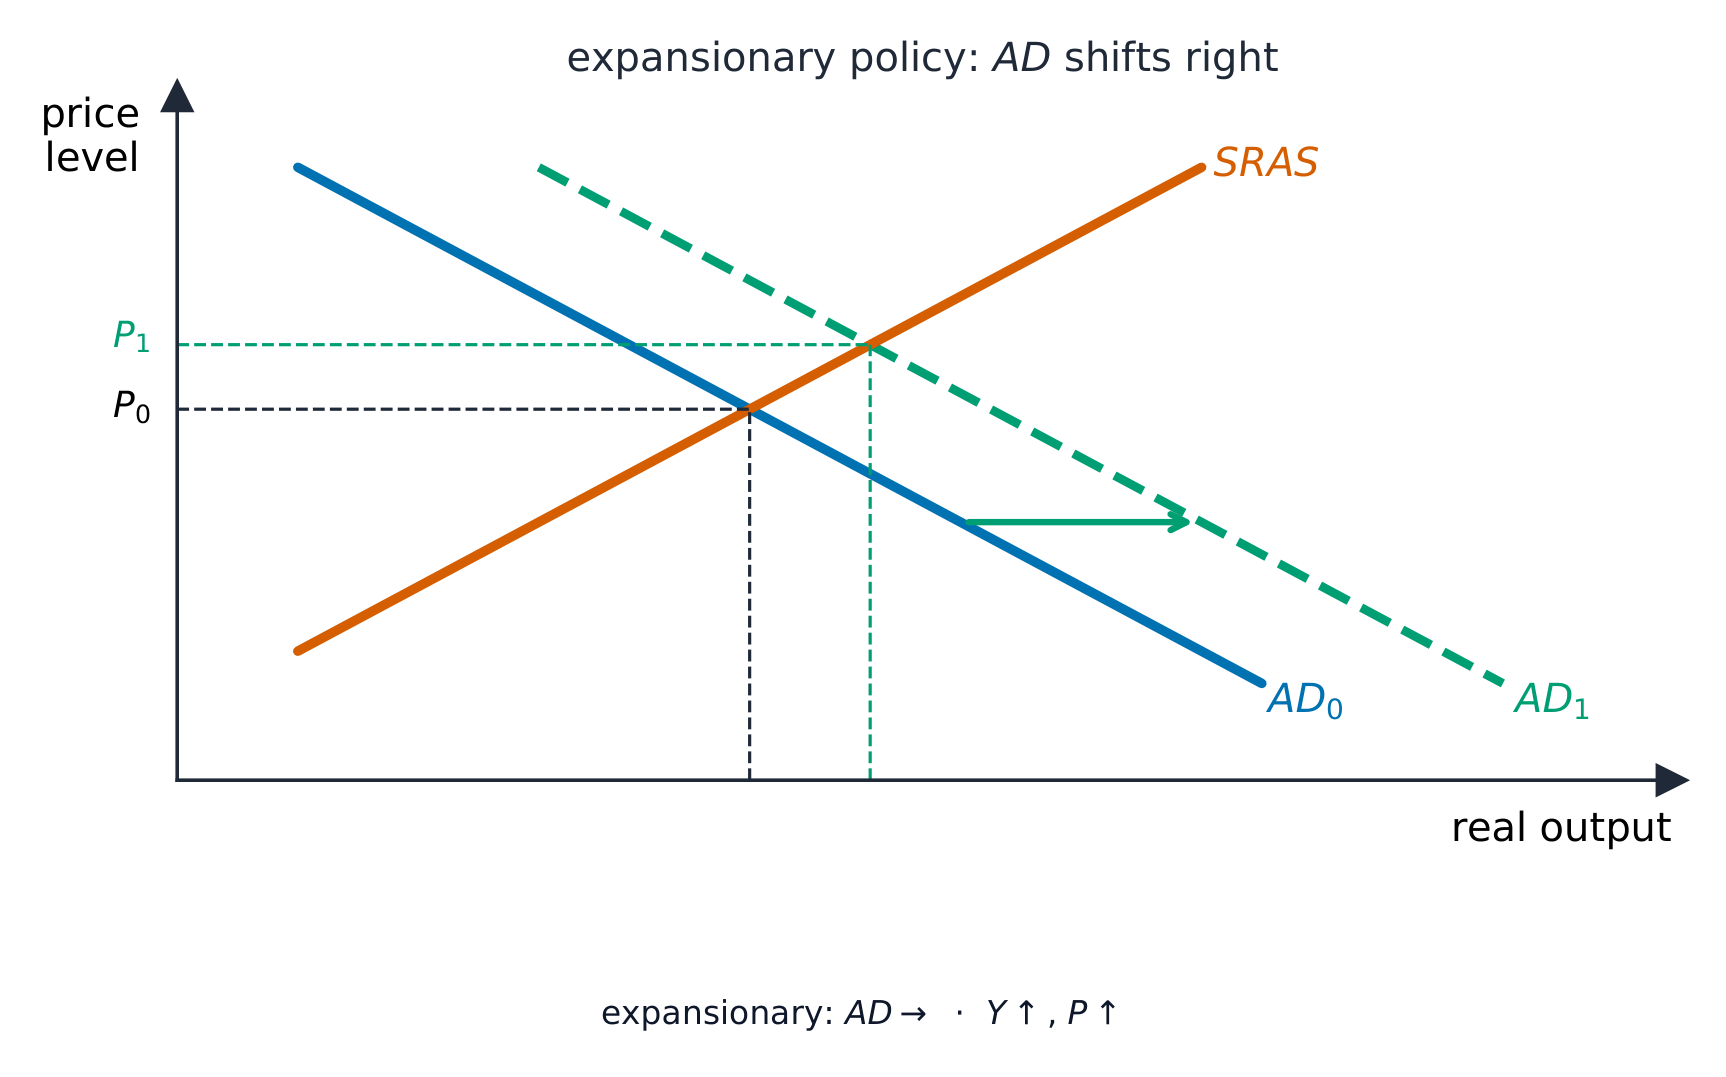


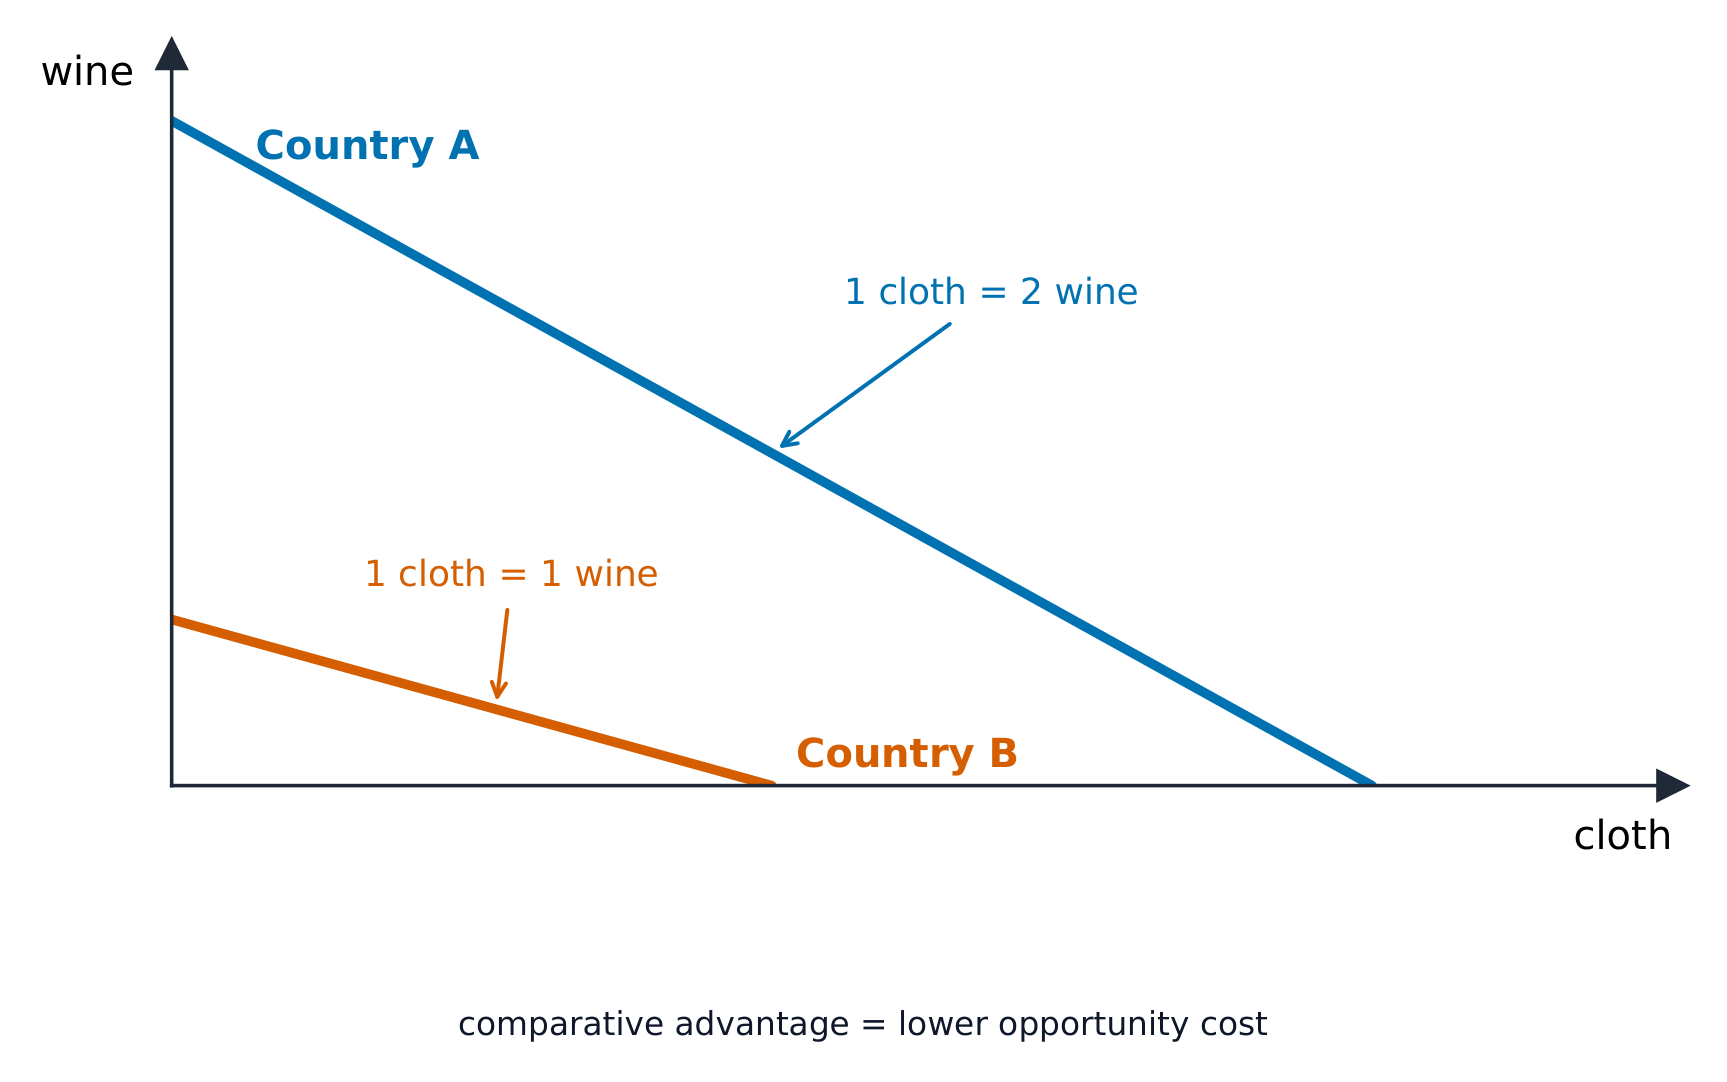


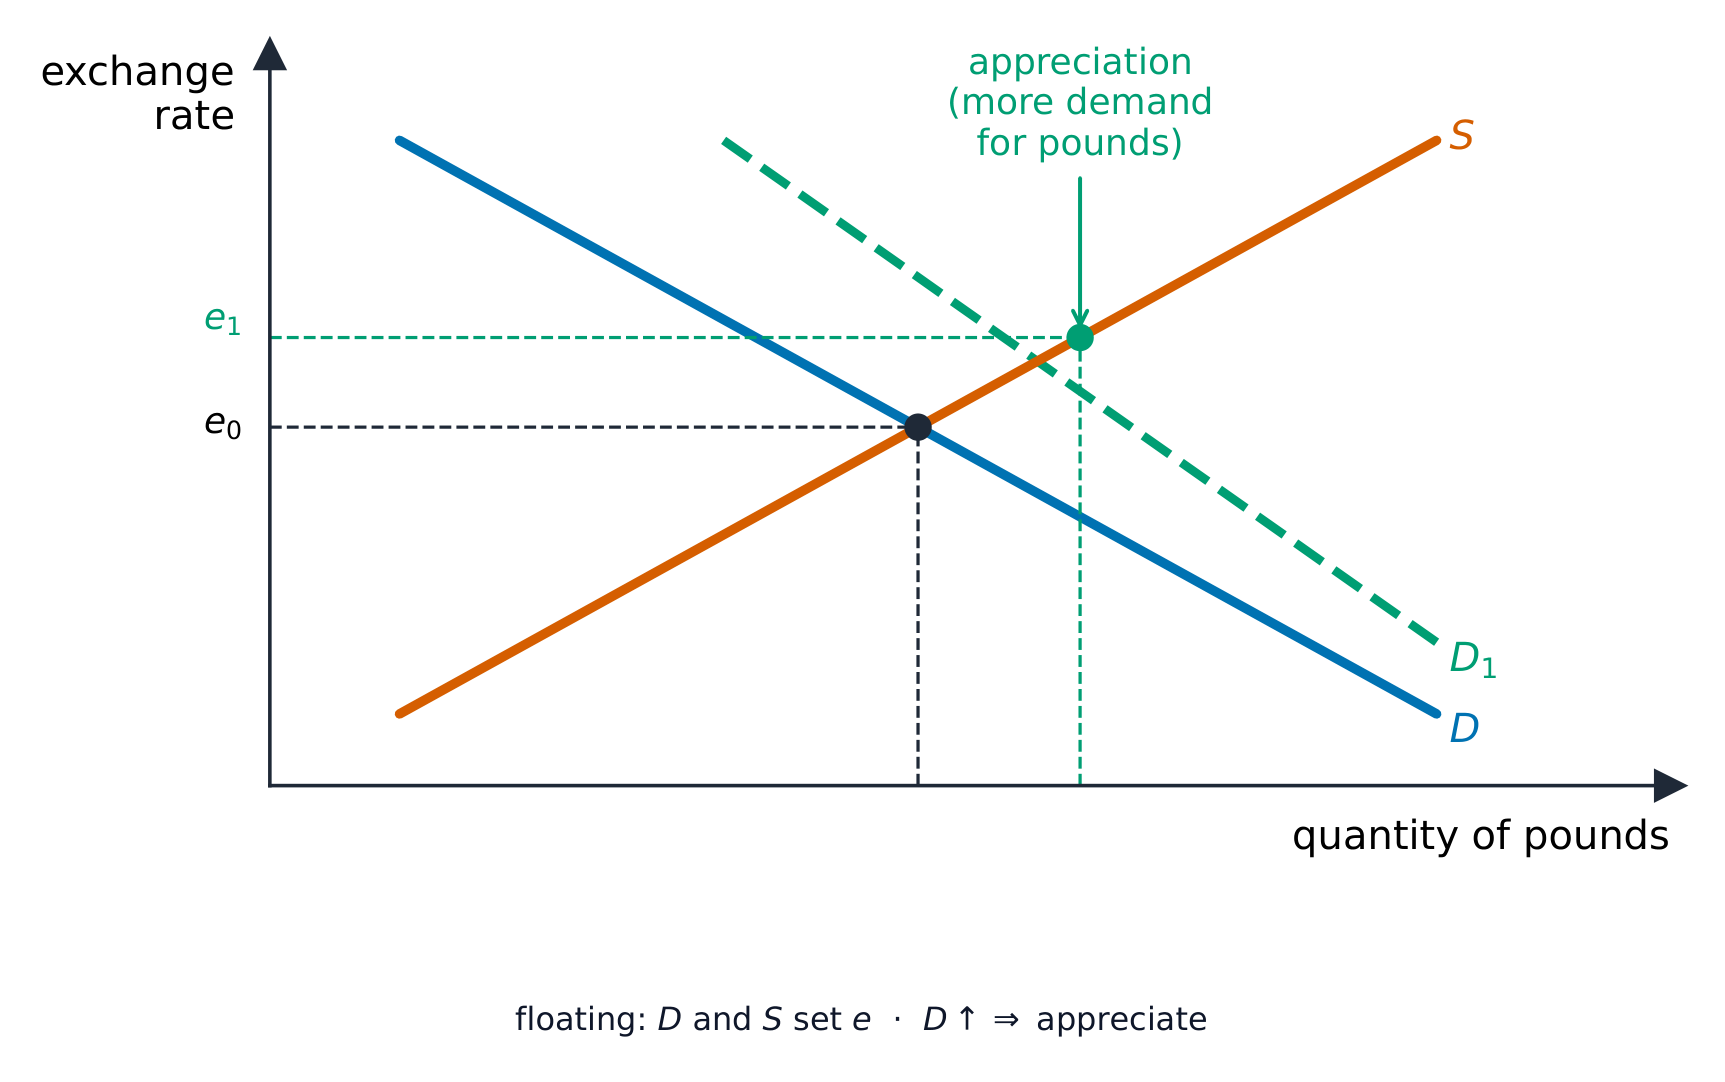


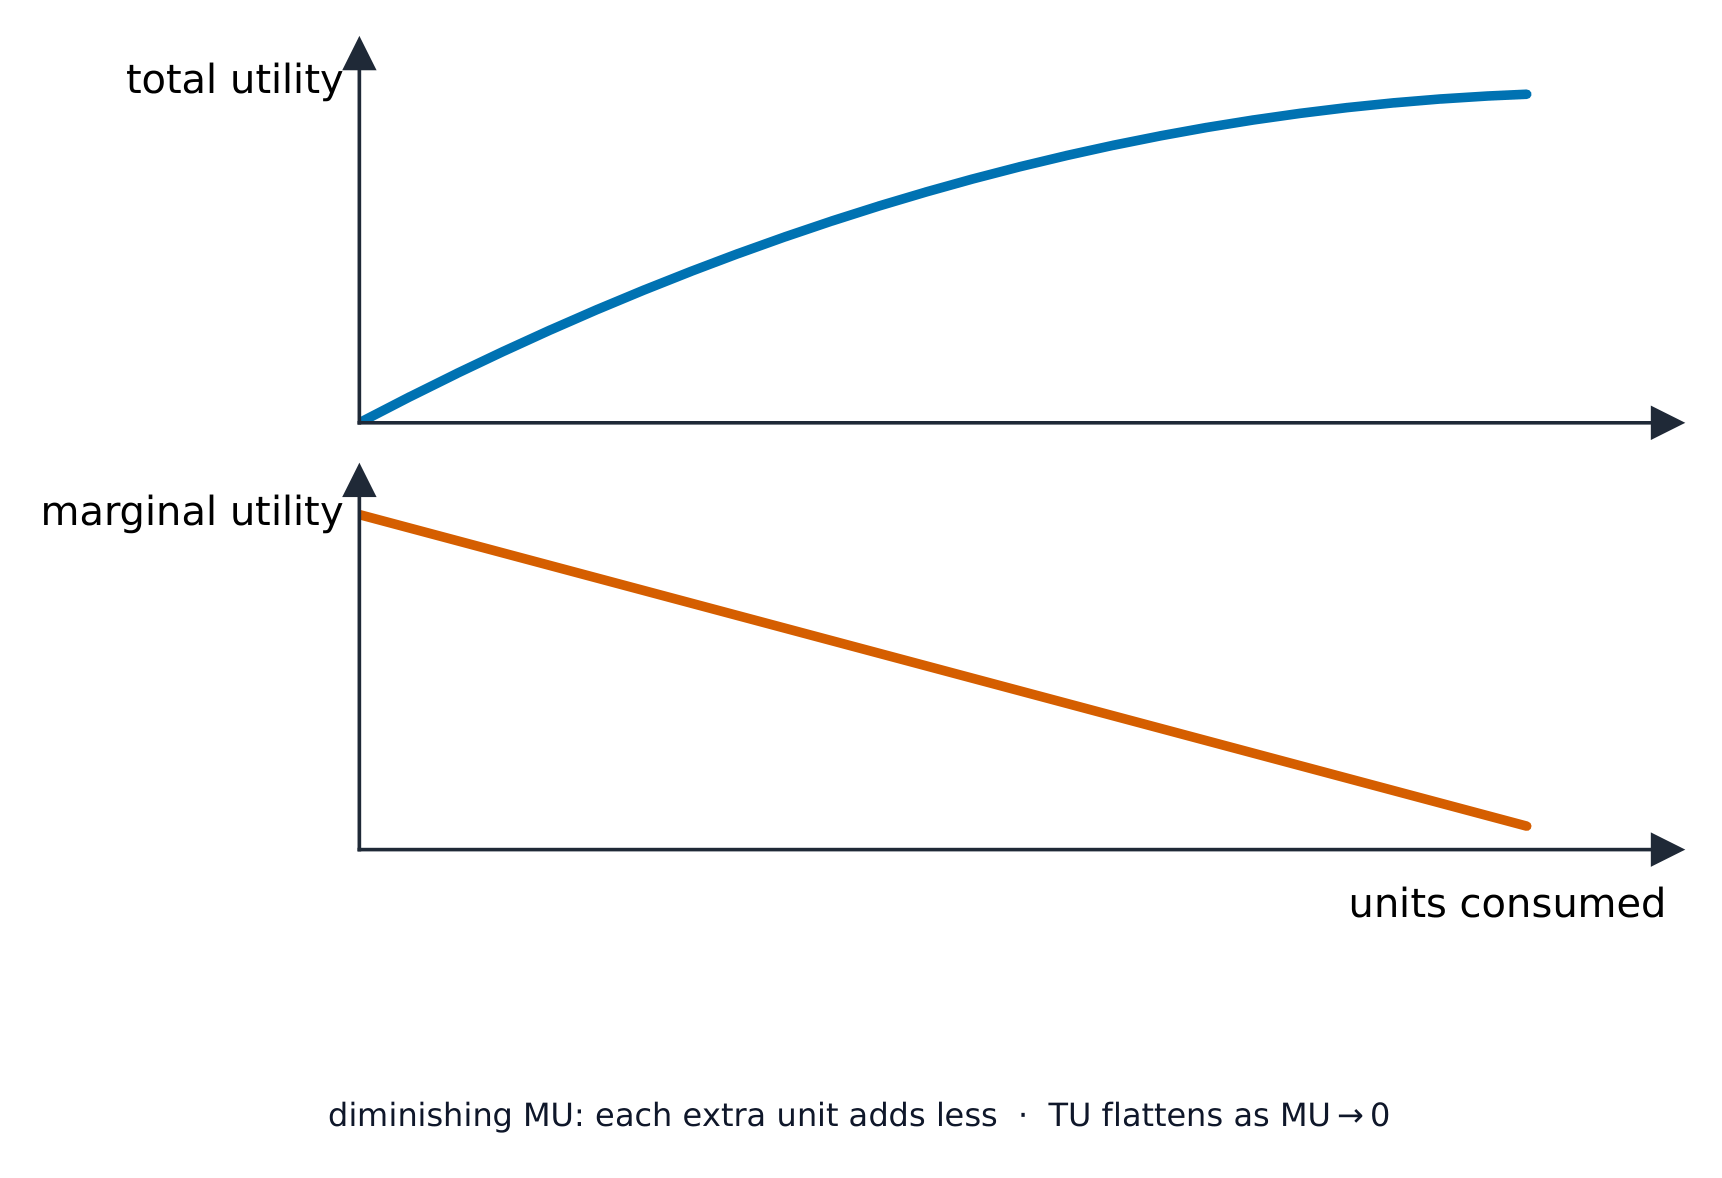
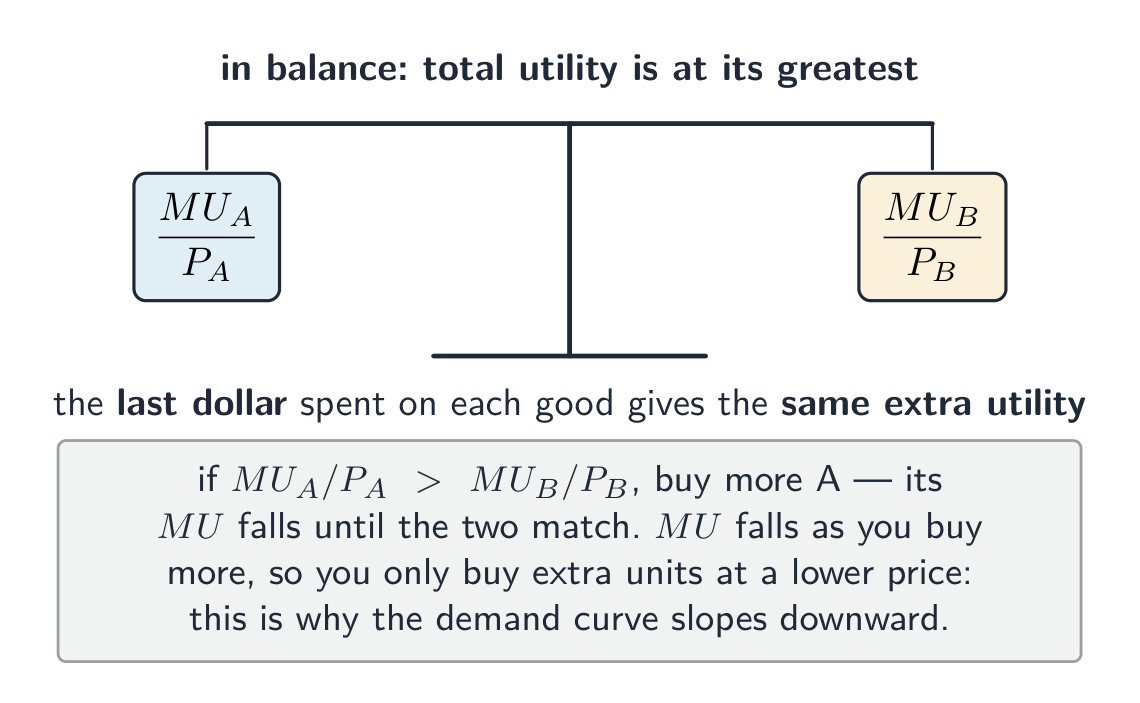


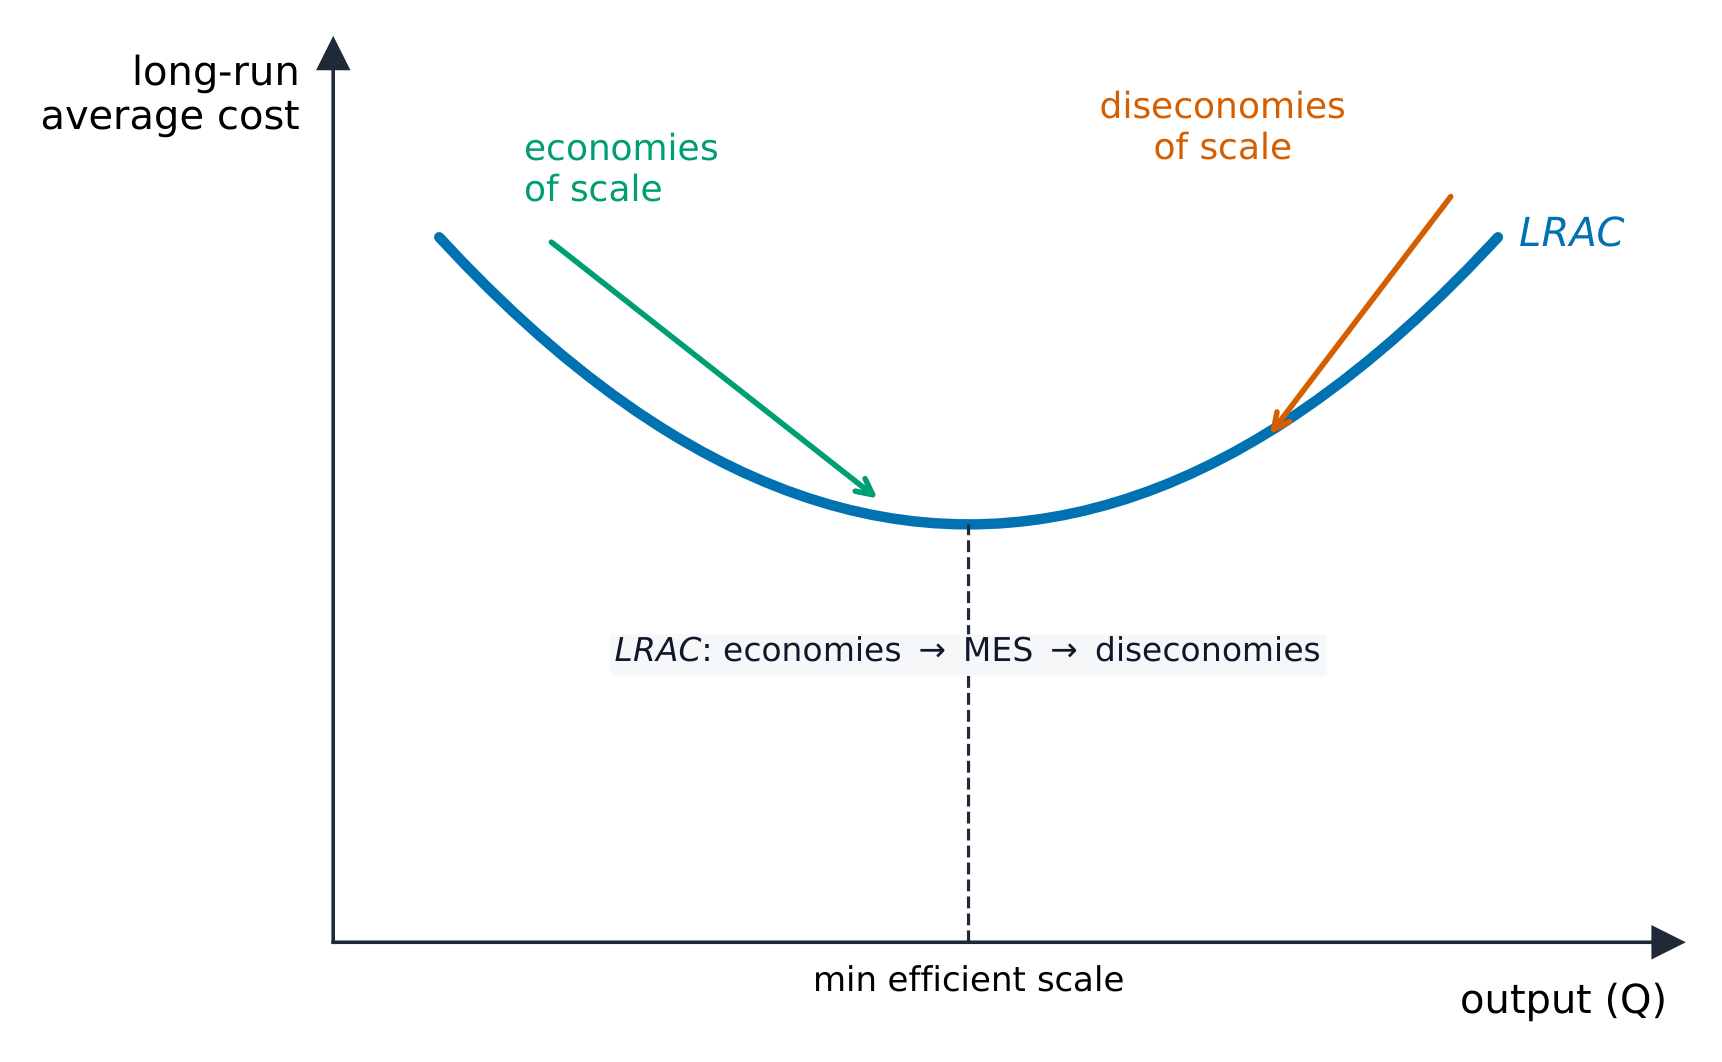

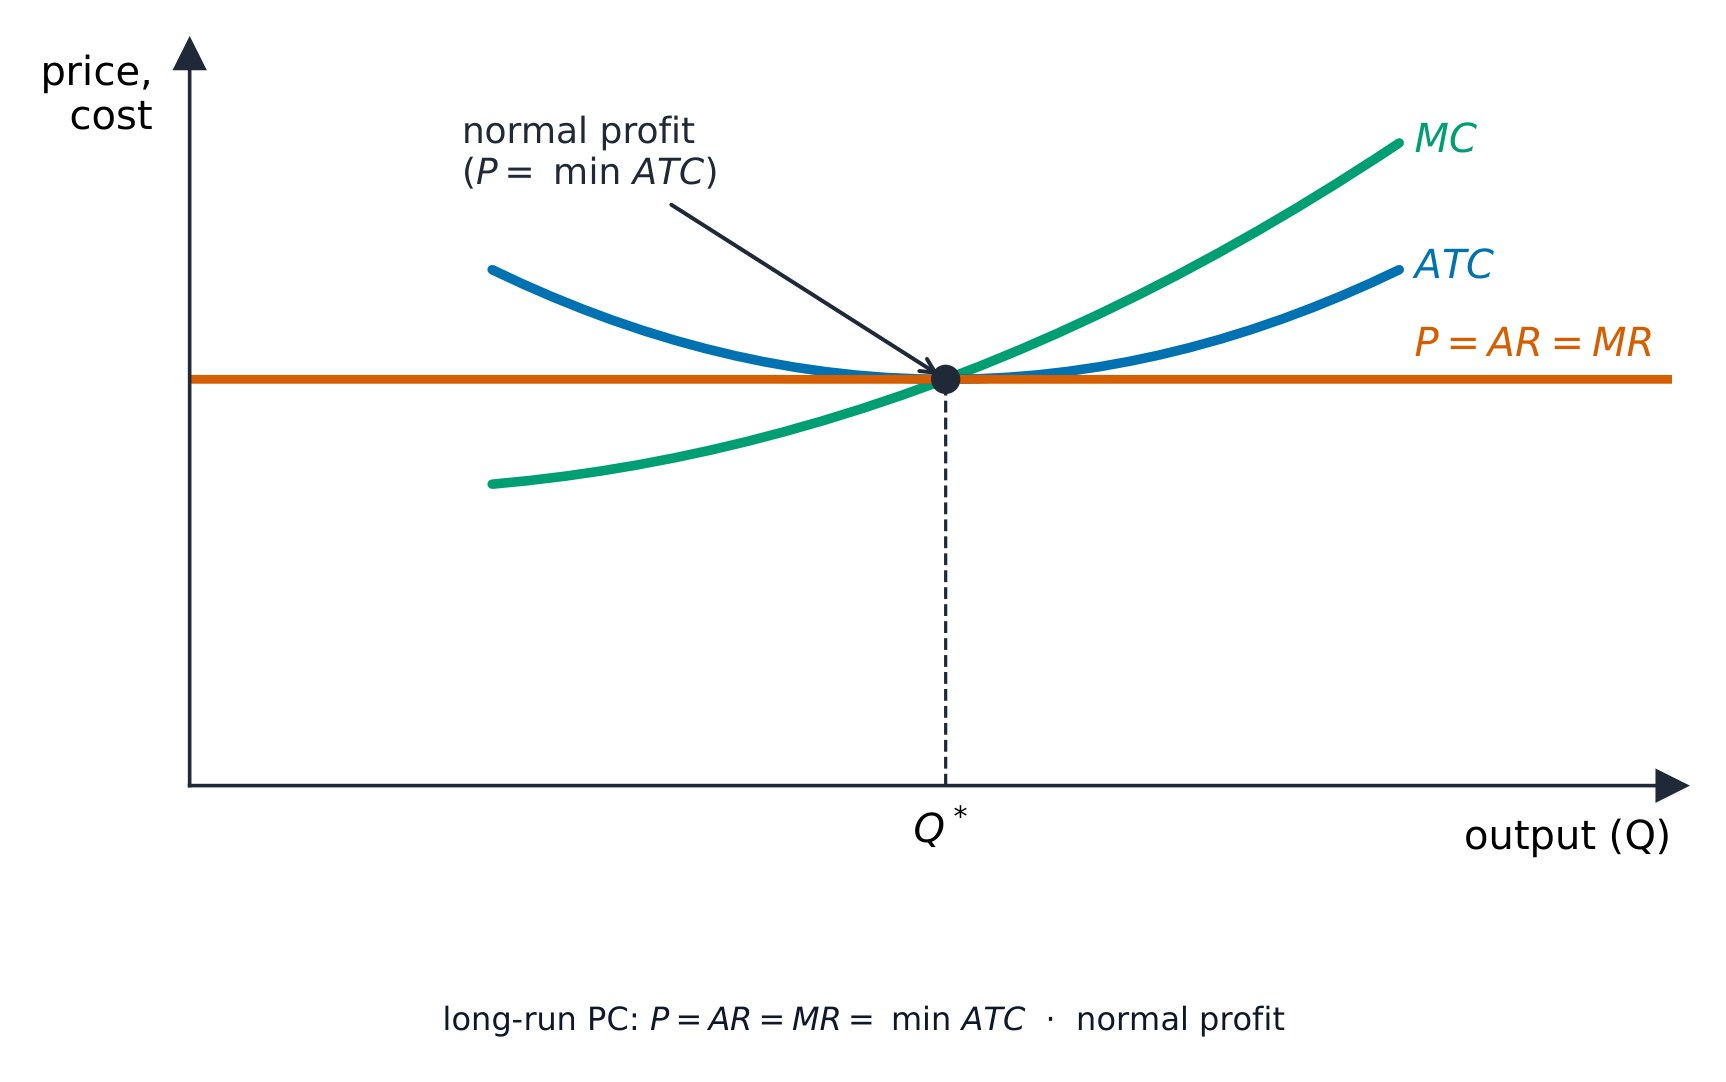


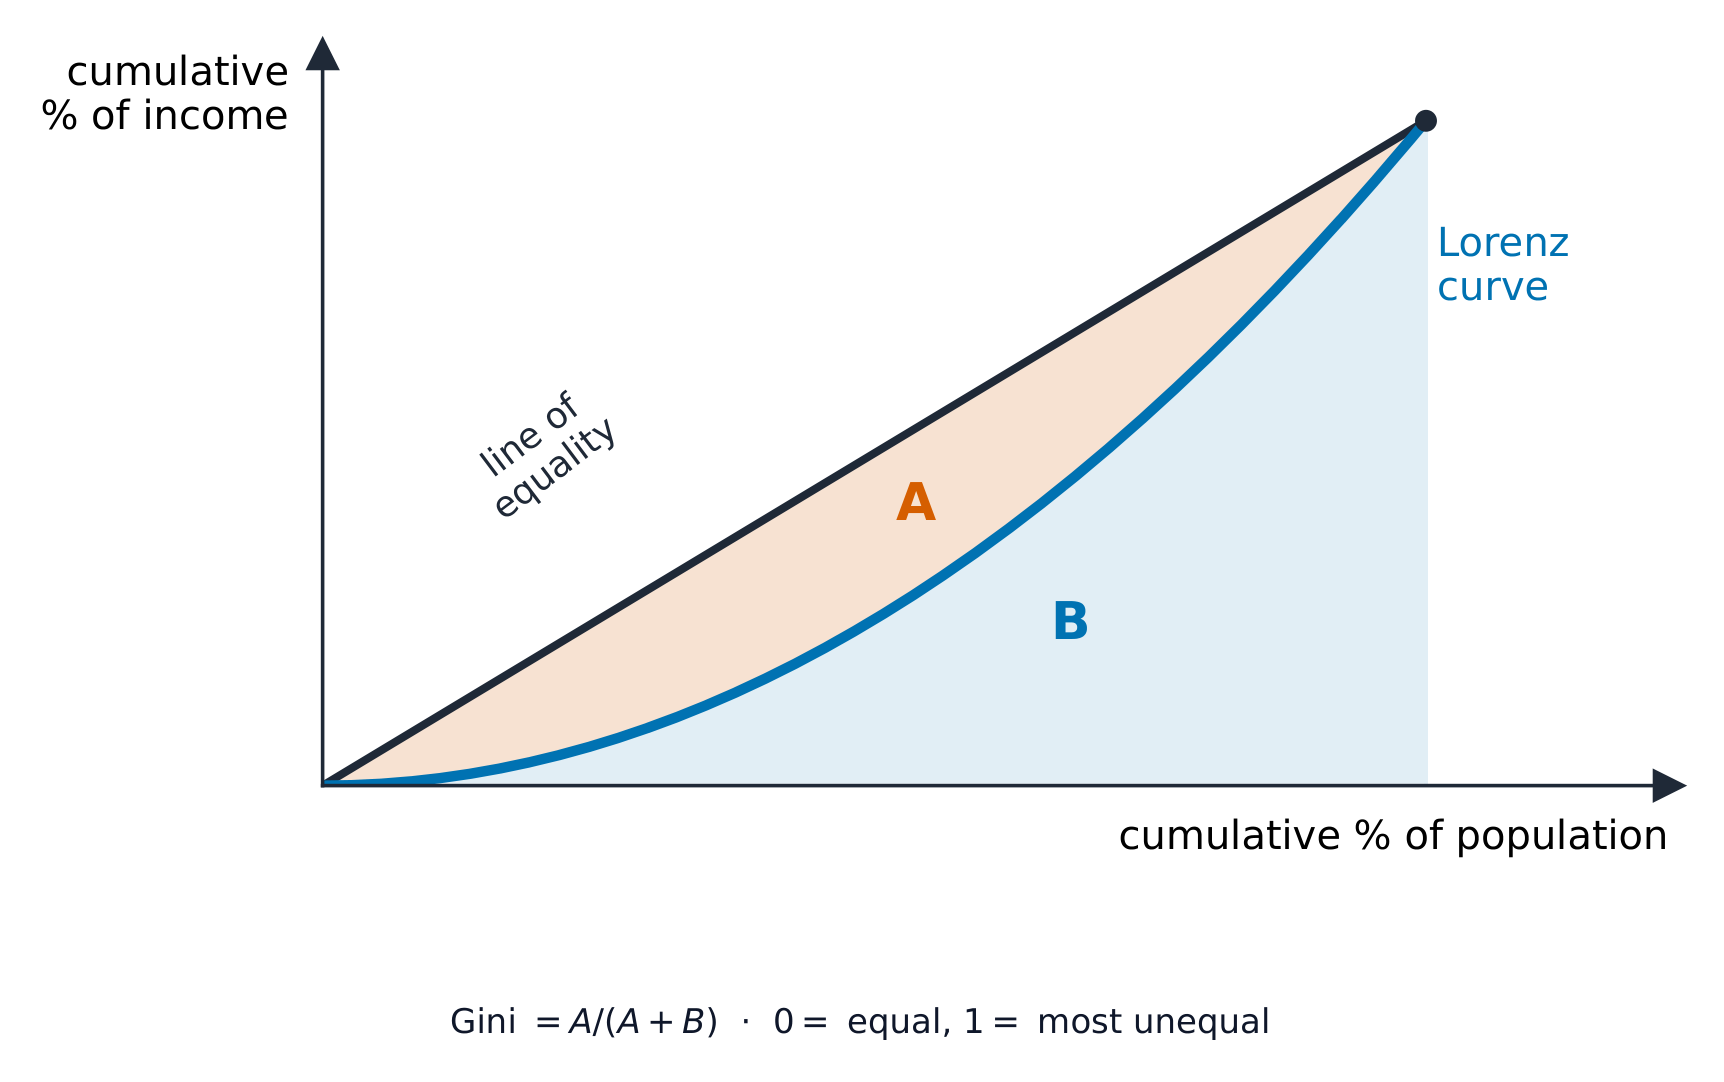 *Kurva Lorenz memplot bagian pendapatan kumulatif terhadap bagian populasi kumulatif; semakin menggantung di bawah garis kesetaraan, semakin tinggi koefisien Gini.