- explain market failure as the failure to achieve an efficient allocation of resources
- explain the reasons for intervention: externalities, public goods, merit/demerit goods, monopoly power, inequality, asymmetric information
Government microeconomic intervention
A-Level Economics · Topic 3
 14:54
14:54
Government microeconomic intervention
This power station makes electricity, and you pay for the electricity. But the people living beside it breathe the smoke, and they never agreed to anything.…
English narration · English + 中文 subtitles burned in
3.1
Why markets fail

Syllabus
Source: Cambridge International syllabus
A free market often gives a good result, but not always. market failure 市场失灵 is when the market does not allocate 配置 (share out) resources efficiently — too much or too little of a good is made. Then the government may step in.
The AS core in this topic is public goods, merit and demerit goods, price intervention, and income and wealth inequality. The externality diagrams and permit discussion below are a preview of the later A-Level microeconomics units; they do not replace the AS requirements.
Externalities
An externality 外部性 is a cost or a benefit that falls on a third party 第三方 — someone who is not the buyer or the seller.
- a negative externality 负外部性 is an external cost 外部成本 paid by others, like the pollution from a factory. The social cost 社会成本 (the cost to all of society) is bigger than the private cost 私人成本 (the cost to the producer). When people ignore the external cost, the market makes too much of the good.
- a positive externality 正外部性 is an external benefit 外部收益 enjoyed by others, like the protection that vaccination gives to everyone. Here the market makes too little, because buyers ignore the benefit to others.
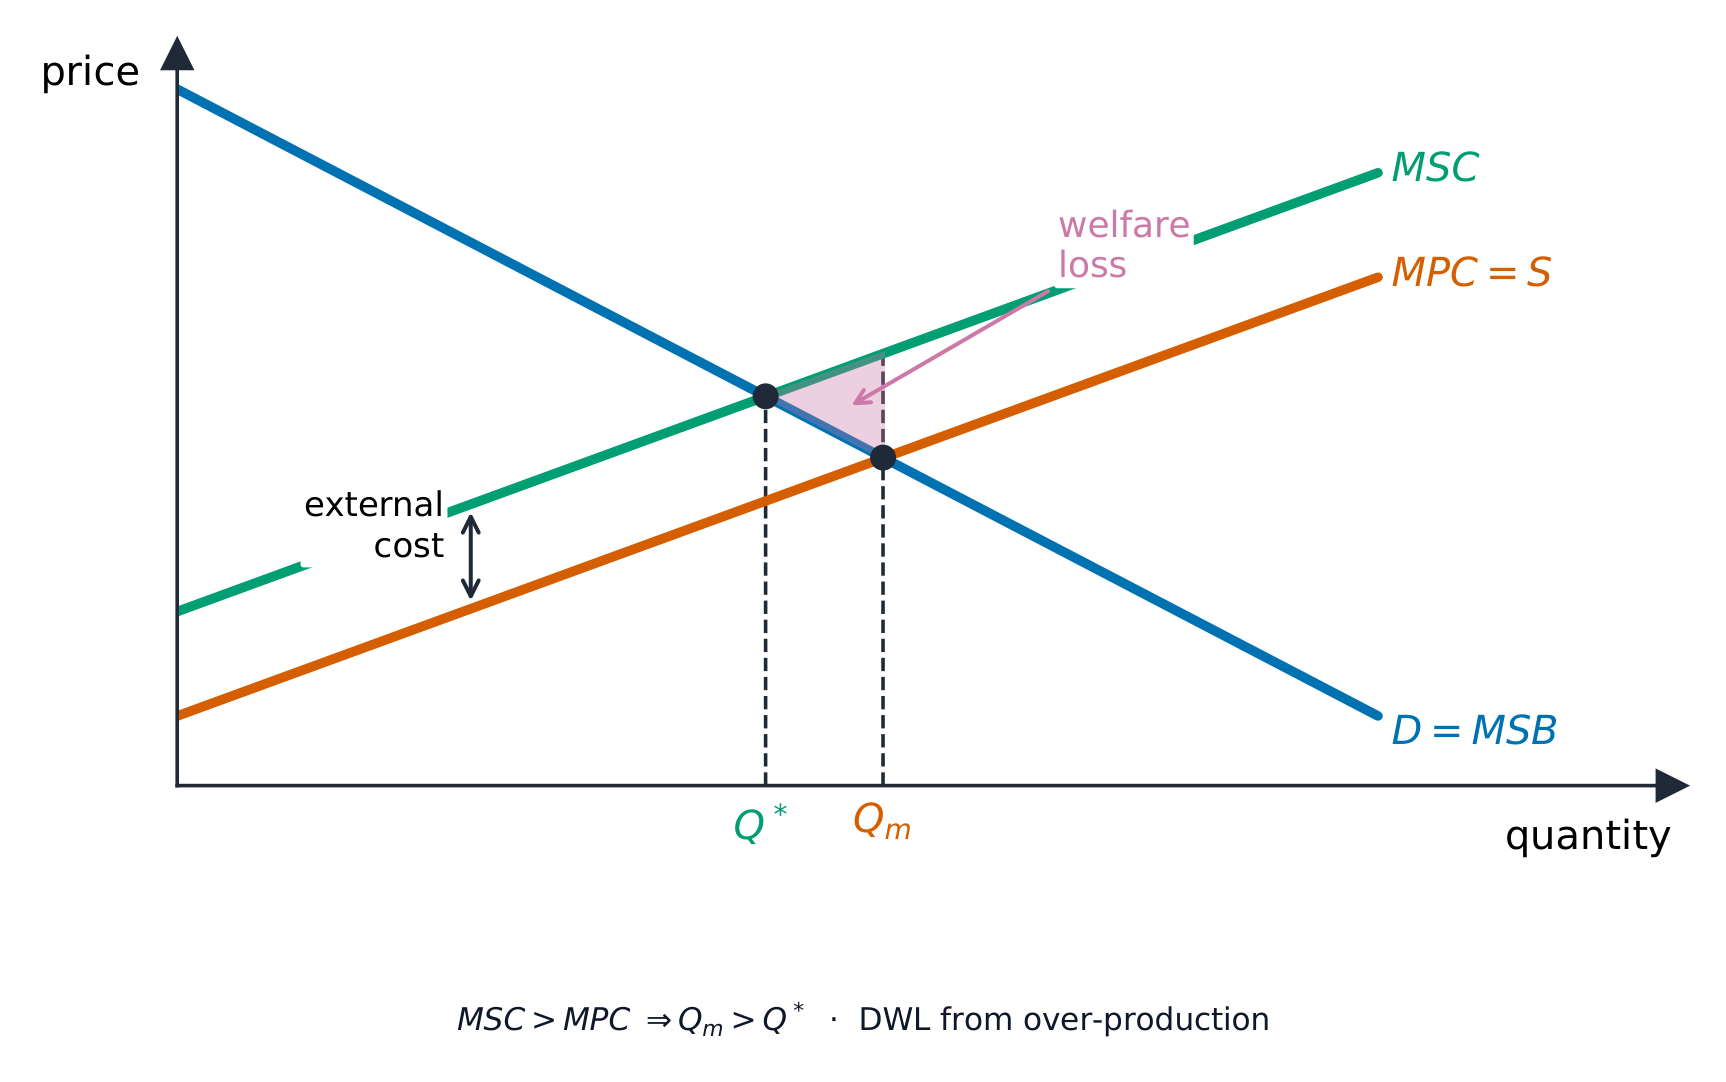
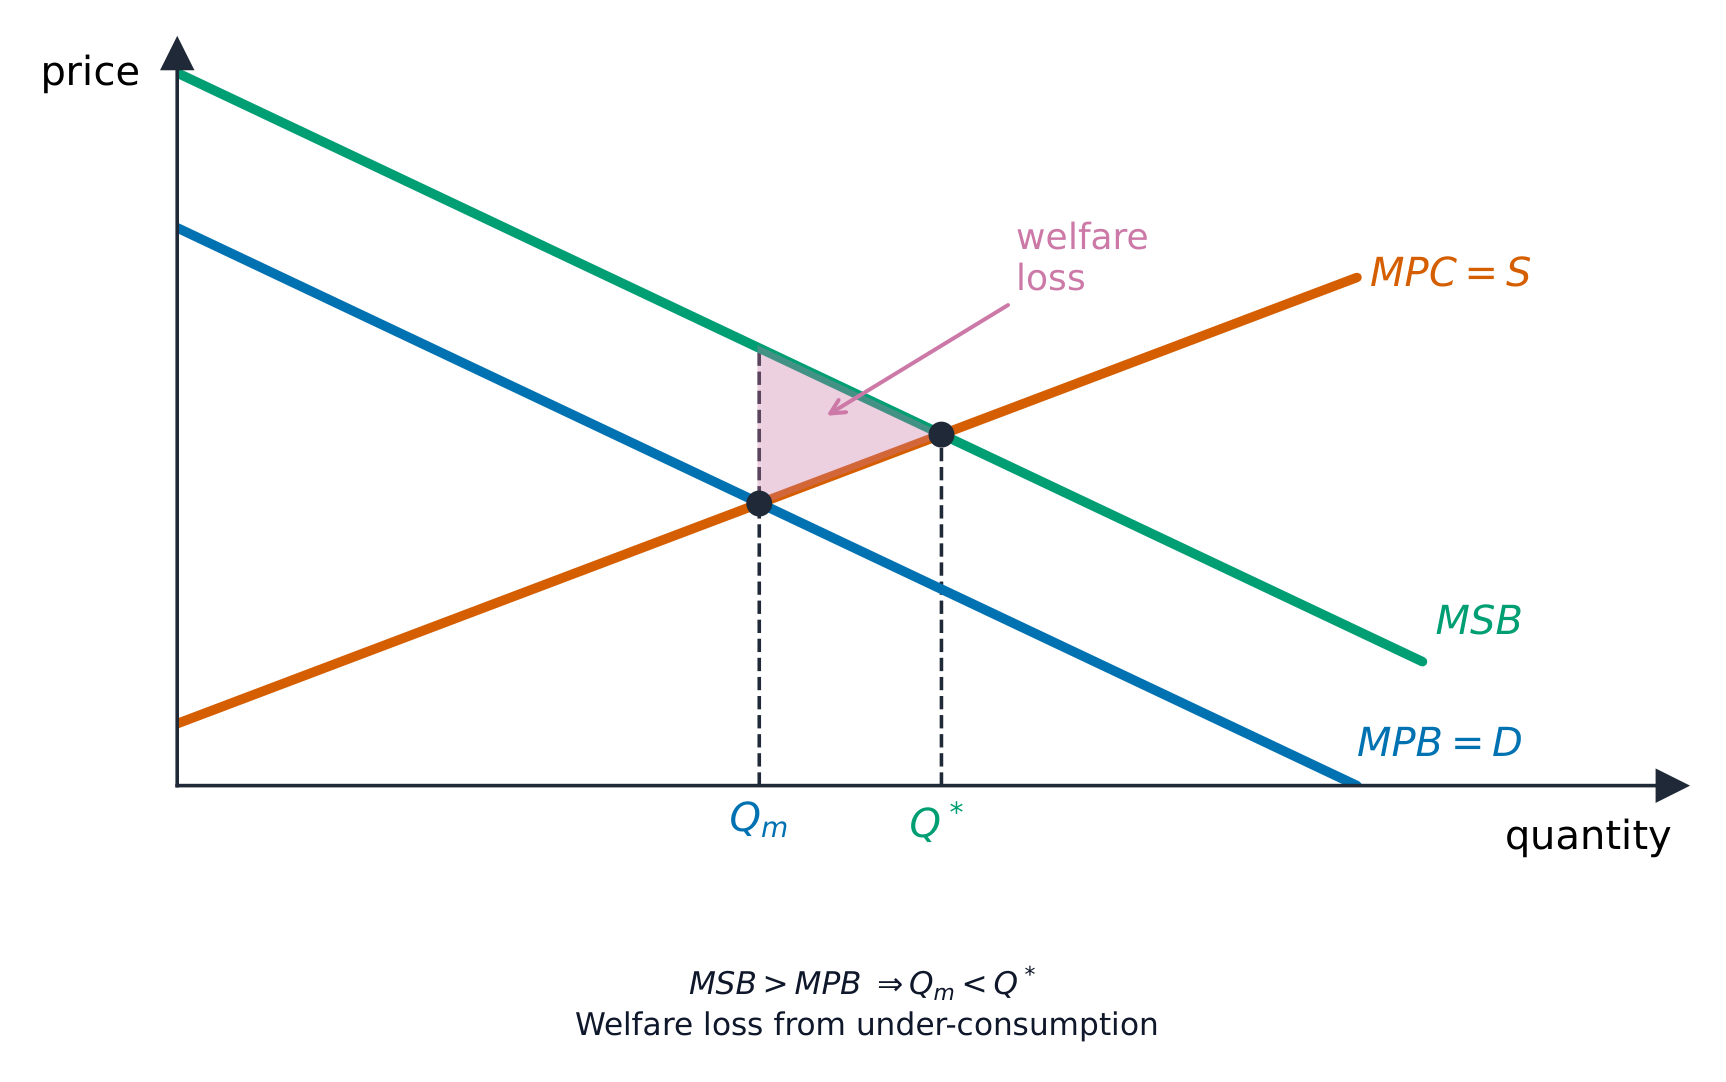
Public goods
A public good 公共物品 has non-rivalry 非竞争性: one more user's benefit does not reduce what existing users receive. It also has non-excludability 非排他性: preventing non-payers from benefiting is impractical. A flood-warning broadcast to a whole valley is an example. An individual cinema seat is different: a ticket can exclude non-payers and an occupied seat is unavailable to another person. A school lesson can be a merit good without being a pure public good; places and teacher time are limited.
Worked financing problem. A warning service costs £90 for one period. Three households value it at £50, £40 and £30. Their combined benefit is £120, above its cost, but no household values it enough to pay the entire £90 alone. Once the warning is broadcast, each can benefit without paying. This free-rider problem 搭便车问题 can prevent an ordinary seller from recovering the cost. It is not proof that every voluntary contribution is impossible: agreement, donations or a larger organisation may fund some provision. Tax-funded provision can solve the charging problem, but government must still estimate benefits and costs and decide which service to fund.
Merit and demerit goods
A merit good 优值品 is consumed less than is considered desirable when people underestimate or overlook its benefits. A demerit good 劣值品 is consumed more than is considered desirable when people underestimate or overlook its harm. This information failure 信息失灵 concerns people's decisions about their own benefits and costs. A benefit or harm to a third party is a separate externality; one activity may involve both.
Compare two barriers. A training course charges £200. Some adults wrongly believe the qualification has no value; others understand its value but cannot pay. Information about recognised qualifications addresses the first barrier. A subsidy or free state place may address the second. If there are only 20 places, a campaign alone cannot create another 30 places. A good answer identifies the cause, explains the policy's effect on consumption, and checks resources and opportunity cost.

Monopoly power
A monopoly 垄断 is a single seller in a defined market. Monopoly power 垄断势力 is the ability to influence price rather than accept it. Restricting output can raise price and harm consumers, but costs, entry barriers and available substitutes matter. Formal efficiency and firm-behaviour analysis belongs to the later A-Level microeconomics units.
Inequality and asymmetric information
- differences in earnings and asset ownership can produce inequality 不平等. An unequal distribution and an inefficient allocation are different claims: inequality alone does not establish a failure of allocative efficiency.
- asymmetric information 信息不对称 means one party knows relevant information the other lacks. If a buyer cannot distinguish a reliable used car worth £6000 from a faulty one worth £2000, a cautious offer of £4000 may discourage reliable-car sellers. Inspection or a credible warranty may improve the deal. It is not inevitable that only faulty cars remain; detailed information problems are a later A-Level extension.
Explore
Private steel market equilibrium
Explore private demand and supply shifts. This display does not draw external costs or social curves and cannot by itself identify a socially efficient quantity.
Vocabulary
Train
| English |
|---|
| market failure/ˈmɑːkɪt ˈfeɪlɪə/ |
| allocate/ˈæləkeɪt/ |
| externality/ekˈstɜːnælɪti/ |
| third party/θɜːd ˈpɑːti/ |
| negative externality/ˈneɡətɪv ekˈstɜːnælɪti/ |
| external cost/ekˈstɜːnl kɒst/ |
| social cost/ˈsəʊʃl kɒst/ |
| private cost/ˈpraɪvət kɒst/ |
| positive externality/ˈpɒzɪtɪv ekˈstɜːnælɪti/ |
| external benefit/ekˈstɜːnl ˈbenɪfɪt/ |
| public good/ˈpʌblɪk ɡʊd/ |
| non-rivalry/nɒn ˈraɪvəlri/ |
| non-excludability/nɒn eksˌkluːdəˈbɪlɪti/ |
| free-rider problem/friː ˈraɪdə ˈprɒbləm/ |
| merit good/ˈmerɪt ɡʊd/ |
| demerit good/ˈdemərɪt ɡʊd/ |
| information failure/ˌɪnfəˈmeɪʃn ˈfeɪlɪə/ |
| monopoly/məˈnɒpəli/ |
| monopoly power/məˈnɒpəli ˈpaʊə/ |
| inequality/ɪniːˈkwɒlɪti/ |
| asymmetric information/ˌeɪsɪˈmetrɪk ˌɪnfəˈmeɪʃn/ |
3.2
Methods of government intervention
Syllabus
- explain methods of intervention: indirect taxes, subsidies, maximum and minimum prices, buffer stocks, regulation, provision, tradable permits
- analyse the effects of intervention, including the incidence of indirect taxes and the concept of government failure
Source: Cambridge International syllabus
Indirect taxes
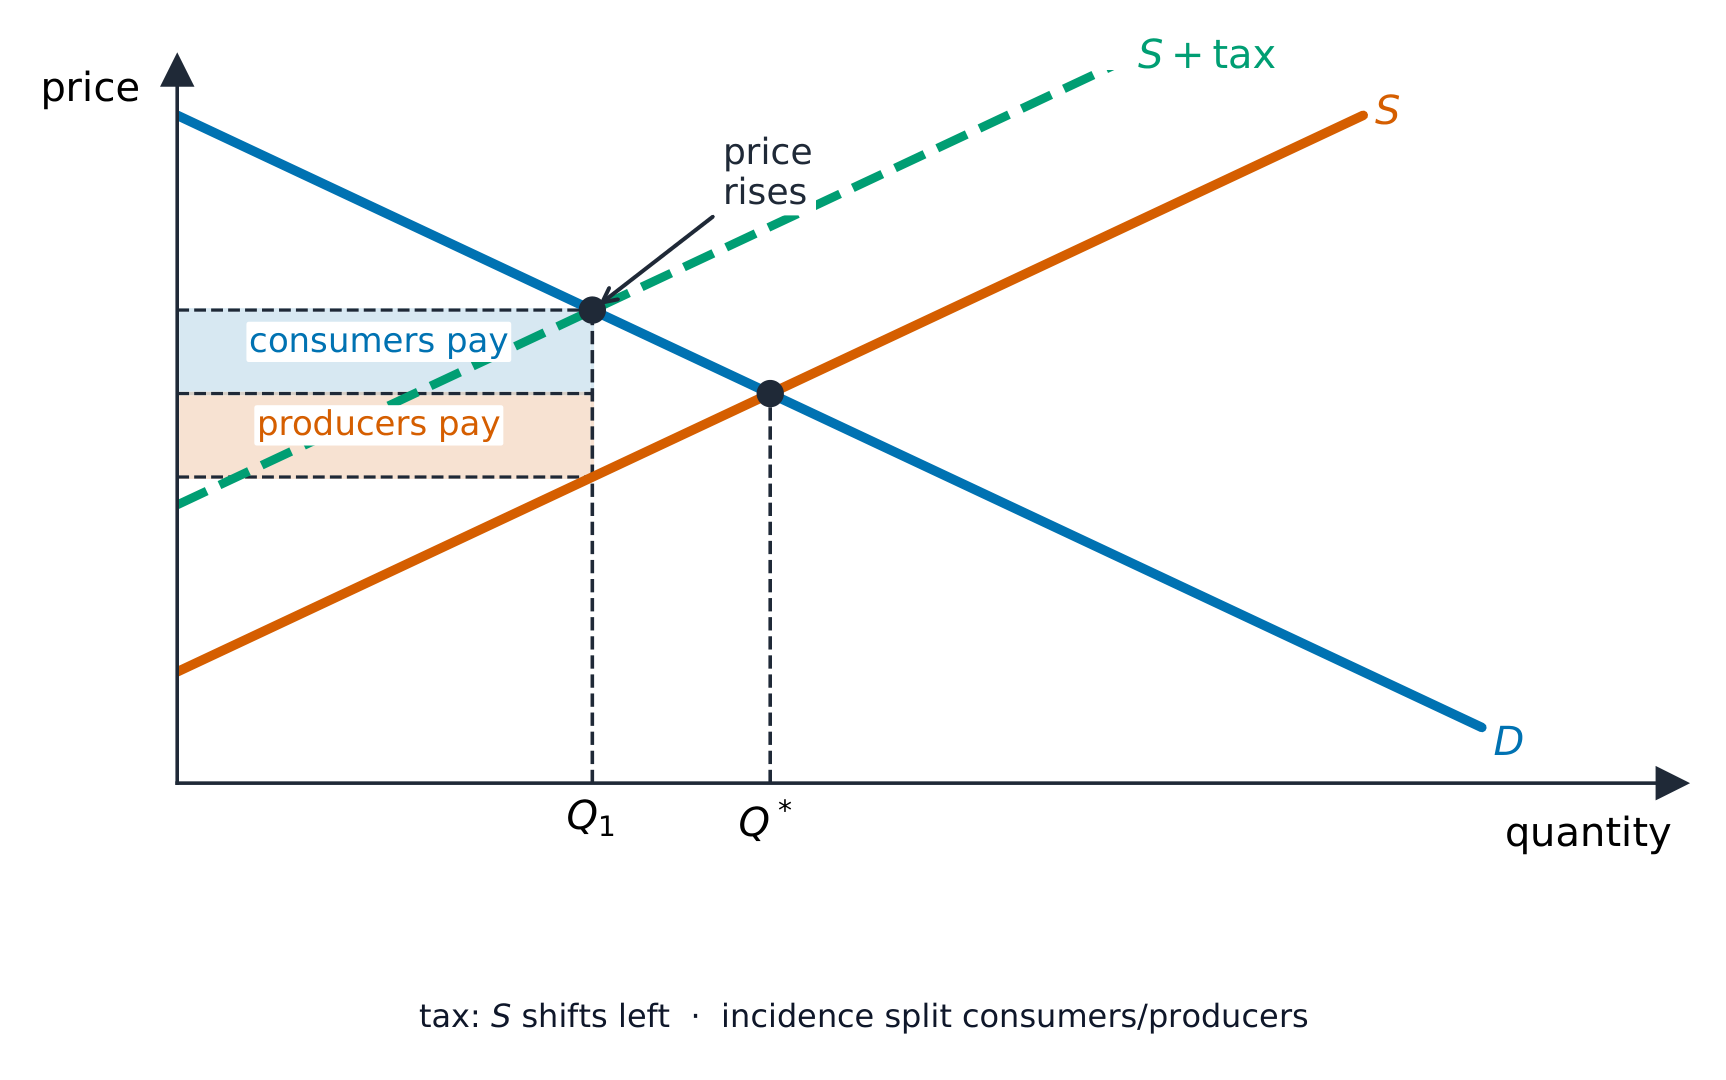
An indirect tax 间接税 is charged on goods or services. A specific tax is a fixed amount per unit; its amount does not rise with the selling price. In the competitive market model, it creates a wedge between the buyer's price and the amount the producer keeps. Keep these two prices separate.
Worked price wedge. Here P is pounds per unit and Q is units per period. Before tax, demand is P = 12 − Q and supply is P = 2 + Q:
$$P_D=P_S\quad\Rightarrow\quad12-Q=2+Q$$
$$Q_0=(12-2)/2=5\text{ units per period}$$
$$P_0=12-Q_0=12-5=\text{£}7\text{ per unit}$$
A specific tax of £3 per unit changes the price buyers must pay for each supplied quantity to 5 + Q. The producer still keeps 2 + Q:
$$P_b=P_s+t\quad\Rightarrow\quad12-Q=2+Q+3$$
$$Q_t=(12-5)/2=3.5\text{ units per period}$$
$$P_b=12-Q_t=12-3.5=\text{£}8.5\text{ per unit}$$
$$P_s=P_b-t=8.5-3=\text{£}5.5\text{ per unit}$$
$$R=tQ_t=3(3.5)=\text{£}10.5\text{ per period}$$
The incidence of a tax 税收归宿 is the distribution of the economic burden. Here buyers pay £1.5 more and producers keep £1.5 less per unit, so the burden is shared equally. The side legally sending the tax to government does not necessarily bear all of it.
Relative response matters. Holding supply conditions fixed, more inelastic 缺乏弹性 demand allows a larger buyer-price increase than more elastic 富有弹性 demand. When comparing who bears most, consider both demand and supply: the less responsive side bears more under the standard competitive model. Demand being inelastic alone does not prove that buyers bear most.
Counterexample: a different market. Demand is Qd = 120 − 2Pb and supply is Qs = 95 + 0.5Ps. The original price is £10 and quantity 100. At that point, absolute PED is 0.2 and PES is 0.05: demand is inelastic, but supply is even less responsive. A £2 tax gives Ps = Pb − 2:
$$Q_d=Q_s\quad\Rightarrow\quad120-2P_b=95+0.5(P_b-2)$$
$$P_b=(120-94)/2.5=\text{£}10.4\text{ per unit}$$
$$P_s=P_b-2=10.4-2=\text{£}8.4\text{ per unit}$$
$$Q_t=120-2P_b=120-2(10.4)=99.2\text{ units per period}$$
Buyers bear 0.4/2 =20% of the tax; producers bear 1.6/2 =80%. This is a constructed counterexample, not an estimate for a real cigarette market.
Judge each policy aim separately. Raising revenue, reducing consumption and improving allocation are different outcomes. A small quantity fall can coexist with substantial revenue; it does not establish that the tax has no health benefit. For external costs, consider marginal harm and other conditions; not every tax moves output toward the social optimum. Whether its household burden is regressive also depends on spending and income patterns, not merely the name of the taxed good.
Subsidies
A subsidy 补贴 is a government payment; this example is a specific payment to producers for each unit sold. It creates a wedge in the opposite direction: producers receive the buyer's payment plus the subsidy. Effects depend on responses and market conditions; a fixed grant is not automatically a per-unit supply shift.

Worked producer subsidy. Before subsidy, equating 12 − Q and 2.5 + Q gives Q0 =4.75 and P0 =£7.25. With a subsidy £2.4 per unit, the buyer-facing supply price becomes 0.1 + Q:
$$P_D=P_S-s\quad\Rightarrow\quad12-Q=2.5+Q-2.4$$
$$Q_{sub}=(12-0.1)/2=5.95\text{ units per period}$$
$$P_b=12-Q_{sub}=12-5.95=\text{£}6.05\text{ per unit}$$
$$P_s=P_b+s=6.05+2.4=\text{£}8.45\text{ per unit}$$
$$G=sQ_{sub}=2.4(5.95)=\text{£}14.28\text{ per period}$$
Buyer price falls by £1.2 and producer receipts rise by £1.2 per unit; neither side receives the whole benefit of the subsidy in this model. Government spending is not the same as the increase in producers' receipts relative to the old price.
Merit-good decision. A subsidy may make a training course cheaper, but low awareness, travel costs or a shortage of teachers may still limit attendance. Compare a production subsidy with information about benefits and direct provision of places. Evaluate consumption achieved, who benefits and the opportunity cost of public funds. Do not conclude that any payment automatically corrects all underconsumption.
Maximum and minimum prices
A maximum price 最高限价 is a legal upper limit. It binds when below the relevant equilibrium; a higher ceiling may leave price and quantity unchanged. A minimum price 最低限价 is a lower limit, binding when above equilibrium. First test whether the control binds, then compare quantities demanded and supplied.
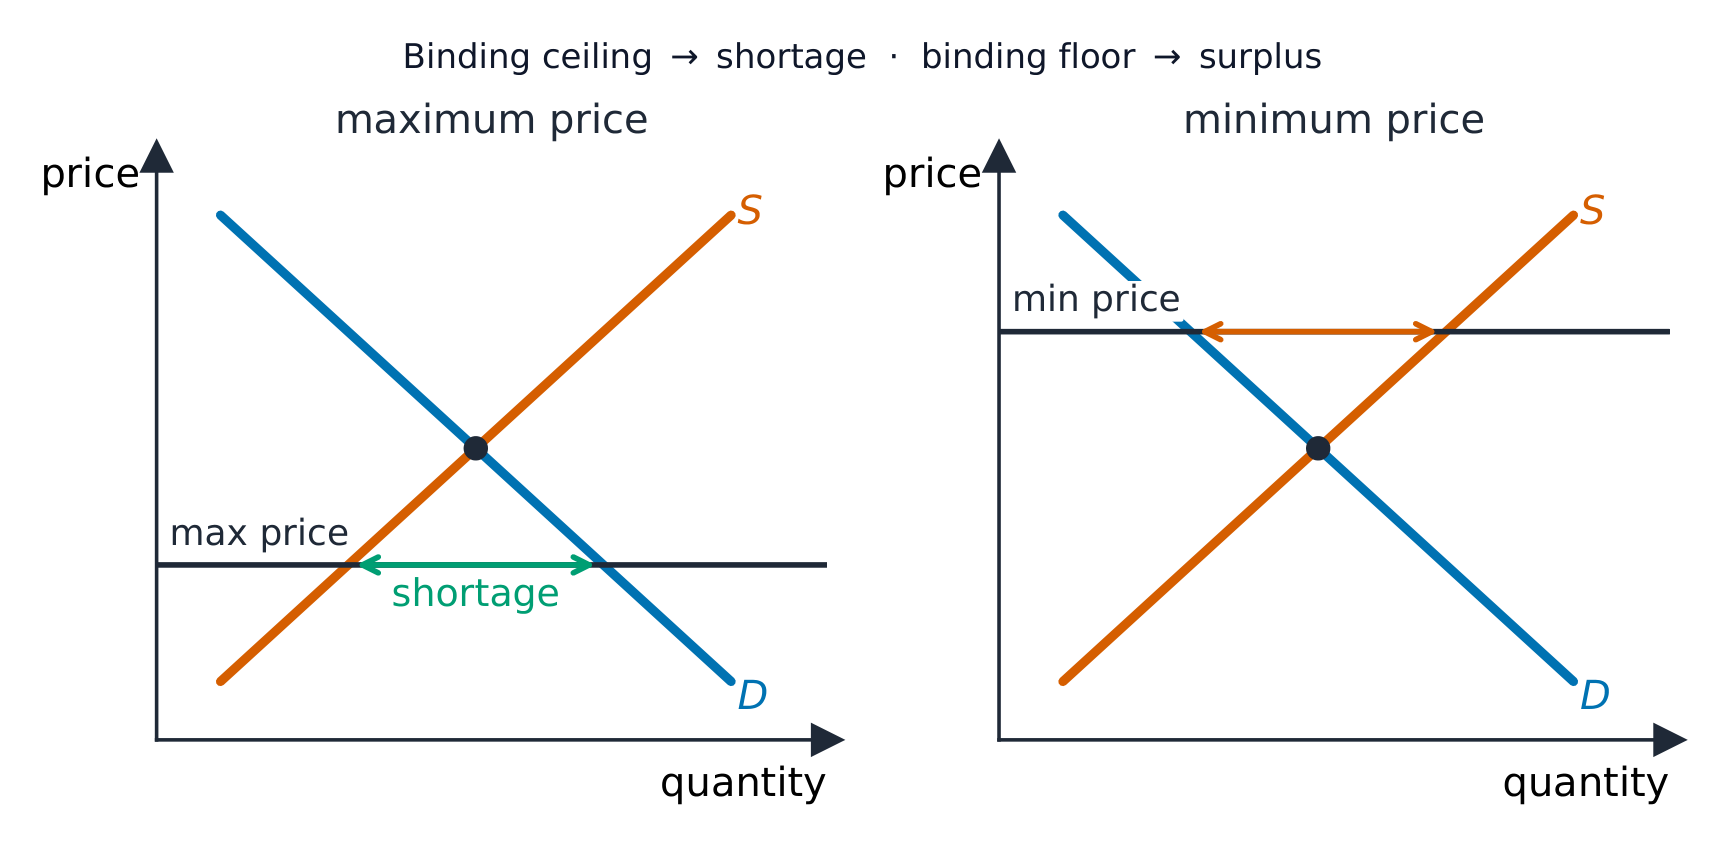
Ceiling case. In this separate market, Qd =10 − P and Qs =P. At a ceiling £3:
$$Q_d=10-P_c=10-3=7\text{ units per period}$$
$$Q_s=P_c=3\text{ units per period}$$
$$\text{shortage}=Q_d-Q_s=7-3=4\text{ units per period}$$
Without additional supply, only three units can be traded legally at that price. A shortage 短缺 is not a promise that every buyer gets cheaper goods. Queues, allocation rules or an illegal resale market may result. A ceiling £6 is above equilibrium and does not bind.
Floor case. At a floor £7, Qs =7 but Qd =3, creating excess supply 超额供给 of four units. Without government purchases, private buyers take only three units. If government guarantees to buy the remaining four at the floor, its spending is 7(4) =£28 per period and it must store or dispose of those units. A floor £4 does not bind. Changing the legal price is not the same as guaranteeing sales or household income.
Buffer stocks
A buffer stock 缓冲库存 scheme buys and stores a storable commodity when its price reaches a lower intervention price, then sells stock when price reaches the upper intervention price. Holding a band requires enough money and storage to buy, and enough usable stock to sell. It is not an automatic guarantee.

Worked harvest decisions. Demand is P =10 − Q. Normal supply P =Q gives equilibrium P5/Q5. The government targets a band £4.5–£5.5. An opening store contains three units.
| Harvest | Farm supply | Intervention price | Qd | Farm Qs |
|---|---|---|---|---|
| Bumper | P=Q−2 | £4.5 floor | 5.5 | 6.5 |
| Poor | P=Q+2 | £5.5 ceiling | 4.5 | 3.5 |
With the bumper crop, free-market price would be £4. At the target floor, buy 6.5 −5.5 =1 unit for £4.5; stock rises 3→4. With the poor crop, free-market price would be £6. At the target ceiling, sell 4.5 −3.5 =1 unit for £5.5; stock falls 4→3. These numbers exclude storage costs and spoilage.
If three poor-harvest periods start with stock 3 and no purchases, one-unit releases empty the store. In a fourth poor period the scheme cannot supply the missing unit without another source. Perishable goods, changing long-run demand and persistent surpluses create further problems.
Price stability is not identical to income stability. Farmers' receipts here are 4.5(6.5) =£29.25 after a bumper harvest, but 5.5(3.5) =£19.25 after a poor harvest: their own output differs. Selling stored stock does not give farmers the receipts from the current stock release. Compare buffer stocks with diversification, subsidies or other support when evaluating farm income.
Information and direct provision
State provision 政府提供 means that the government 政府 supplies or arranges a service. The service need not be free, and public funding does not by itself make it a public good. A free clinic still uses scarce appointments, staff and medicines. Direct provision can add capacity where a subsidy would only raise demand for fixed places; it needs finance, suitable staff and access for the intended users.
Choose an intervention. A district has 100 eligible children but only 60 childcare places. Forty additional places cost £4000 per period. A £1000 information campaign may help parents find existing vacancies, but it cannot remove this capacity shortfall if all 60 places are full. Compare the additional places with a different use of the same £4000, and check quality and location. Free childcare may enable parents to work; its total benefit is not measured only by the fee saved.
Later A-Level extension: regulation and permits
Regulation 管制 uses rules such as safety standards or pollution limits. Tradable permits 可交易许可证 allow firms to trade permission to emit under an enforced cap. Trading can move reductions towards firms able to cut pollution cheaply, but this depends on monitoring, enforcement and a functioning market; it does not guarantee minimum costs under all conditions. For example, if A can cut one unit for £10 and B for £30, making A cut meets a one-unit reduction target at lower resource cost. A trade can reward that cheaper reduction. The cap and compliance must still be checked.
Evaluating intervention and government failure
A policy being costly is not enough to show government failure 政府失灵. Compare its benefits and full costs with the outcome without the policy and with a relevant alternative. Failure means intervention makes resource allocation worse. Poor information, administration costs, unintended effects or decisions serving a narrow group can cause this. A binding ceiling can encourage an illegal black market 黑市, but that is a risk to analyse, not an automatic result of every price control. Formal government-failure analysis is developed in the later A-Level unit.
Illustrative comparison. A programme produces benefits worth £120 and uses resources costing £100, giving a net gain of £20. It is not a failure just because it costs £100. If another feasible programme gives benefits £140 for the same cost and the same relevant risks, its net gain is £40. Identify the objective, evidence and alternative before judging.
Explore
Education market: demand and supply shifts
Compare changes in a single education market. This is a private demand and supply display, not an aggregate-demand model or a measurement of external benefits.
Vocabulary
Train
| English |
|---|
| indirect tax/ɪndaɪˈrekt tæks/ |
| incidence of a tax/ˈɪnsɪdəns əvə tæks/ |
| inelastic/ɪnɪˈlæstɪk/ |
| elastic/ɪˈlæstɪk/ |
| subsidy/ˈsʌbsɪdi/ |
| maximum price/ˈmæksɪməm praɪs/ |
| shortage/ˈʃɔːtɪdʒ/ |
| minimum price/ˈmɪnɪməm praɪs/ |
| excess supply/ekˈses səˈplaɪ/ |
| buffer stock/ˈbʌfə stɒk/ |
| regulation/ˌreɡjʊˈleɪʃn/ |
| state provision/steɪt prəˈvɪʒn/ |
| government/ˈɡʌvənmənt/ |
| tradable permits/ˈtreɪdəbl ˈpɜːmɪts/ |
| government failure/ˈɡʌvənmənt ˈfeɪlɪə/ |
| black market/blæk ˈmɑːkɪt/ |
3.3
Income and wealth inequality

Syllabus
- distinguish income and wealth and explain the causes of inequality
- explain policies to redistribute income and wealth (progressive taxation, benefits, provision of services) and their effects
Source: Cambridge International syllabus
Income 收入 is a flow 流量 received over a period, such as wages, rent and interest. Wealth 财富 is a stock 存量 of assets owned at a point in time; net wealth subtracts debts. A person receiving £2000 each month does not therefore own £2000 of wealth. A house worth £150000 with a mortgage of £100000 contributes £50000 to net wealth. Savings can build wealth, and assets can produce income, but these are different measures.
Measuring and explaining inequality
The Gini coefficient 基尼系数 summarises inequality on a scale from 0 (complete equality) to 1 (the complete-inequality limit). Specify whether the data measure income or wealth, and use a comparable population, period and definition. The AS syllabus requires interpretation, not calculation of the coefficient.
Worked interpretation. A fictional country's disposable-income Gini falls from 0.42 to 0.35. Its measured income distribution becomes more equal. This does not establish that every poor household receives more money, that average real income rises, that wealth becomes more equal, or that one policy caused the change. Government can use the measure to review redistribution, alongside household-group data, employment, prices and access to services. Two countries with the same Gini may have different average living standards and different distributions within income groups.
Income differences may reflect qualifications, experience, demand for occupations, hours worked, unemployment, discrimination or bargaining power. Wealth differences may reflect accumulated savings, inheritance, asset-price changes and debts. Causes interact: unequal access to education may affect future earnings, and inherited assets may generate rent. Do not rank one cause as universally most important without evidence.
Progressive taxes and transfer payments
A progressive tax 累进税 takes a higher average percentage 百分比 of higher incomes. Compare average rates, not just amounts paid. Benefits 福利金, also called transfer payments 转移支付, are government payments without a current good or service received in return; eligibility differs between programmes.
Worked redistribution. Two households have annual incomes £10000 and £40000. Taxes of £1000 and £8000 give average rates 10% and 20%. If the lower-income household receives a £2000 transfer, their disposable incomes are:
$$Y_{d,L}=Y_L-T_L+B_L=10000-1000+2000=\text{£}11000\text{ per year}$$
$$Y_{d,H}=Y_H-T_H+B_H=40000-8000+0=\text{£}32000\text{ per year}$$
The income ratio falls from 4 to about 2.91. This is a two-household illustration, not a calculation of a national Gini or a claim that these taxes alone finance the entire government. Equal £1000 taxes instead take 10% and 2.5% of the original incomes; paying more pounds is not the definition of progressivity.
Minimum wages and access to essential services
A minimum wage is a legal floor on hourly pay. In an illustrative competitive labour market, demand is Ld =100 −5w and supply is Ls =5w. The original hourly wage is £10 and employment 50 workers. A binding £12 floor gives demand 40 and supply 60: 40 jobs and excess labour supply of 20 under this model. Workers who keep the same hours earn more, but excluded workers do not receive that wage. Household effects also depend on hours, other earners, prices and benefits. A floor £8 does not bind here. Other labour-market structures and their full analysis are developed later; the competitive prediction is not a universal empirical law.
Free or subsidised essential services can raise real living standards without increasing cash income. A £500 saving on childcare can matter to a household even if its measured cash income is unchanged. Funding, quality, waiting times and location determine whether poorer households can actually use the service. Education and childcare access may also improve future earnings; redistribution need not always reduce efficiency.
Income taxes compared with inheritance and capital taxes
Inheritance taxes target transfers of assets after a death; capital taxes target specified assets, ownership or gains, depending on the policy. They can address accumulated wealth that an income tax misses. Accurate valuation, debt, exemptions, collection and avoidance matter. A valuable house may produce little cash for paying a tax, while assets with reliable ownership records may be easier to assess than hidden business holdings.
Policy judgement. Regular recorded wages can make income taxation and transfers easier to administer than taxes on hard-to-value wealth. This is a conditional argument, not a rule that wealth can never be redistributed. Land records or estate information can assist wealth taxation; informal earnings can make income taxation difficult too. Assess which inequality is targeted, administrative capacity, avoidance and the effects on work, investment and opportunity. This redistribution 再分配 can involve a trade-off 取舍 when marginal tax and benefit rules weaken an incentive 激励 to earn more, but the strength of that response needs evidence.
Explore
Inequality policy route
Follow how policy can change disposable income and opportunity.
Vocabulary
Train
| English |
|---|
| income/ˈɪŋkʌm/ |
| flow/fləʊ/ |
| wealth/welθ/ |
| stock/stɒk/ |
| progressive tax/prəˈɡresɪv tæks/ |
| percentage/pəˈsentɪdʒ/ |
| benefits/ˈbenɪfɪts/ |
| transfer payments/ˈtrænsfɜː ˈpeɪmənts/ |
| redistribution/ˌriːˌdɪstrɪˈbjuːʃn/ |
| trade-off/treɪd ɒf/ |
| incentive/ɪnˈsentɪv/ |
| Gini coefficient/ˈdʒiːni ˌkəʊɪˈfɪʃənt/ |
3.3
Exam tips
- Identify the actual problem: public-good financing, misjudged benefit or harm, a price objective, or income/wealth inequality.
- Explain the mechanism with a relevant example, diagram or calculation. Distinguish prices, quantities, fiscal costs and household outcomes.
- Evaluate against the stated aim and a feasible alternative. Give a reasoned conclusion using conditions, not a fixed list of advantages and disadvantages.
- In tax incidence compare both demand and supply responses. For Gini data explain what the measure can and cannot establish; no Gini calculation is required.
- The externality diagrams, monopoly discussion and pollution permits in this handout are later A-Level previews. Study the AS core requirements first.
Interactive lessons on this topic
Work through it step by step, with instant-check exercises.