Macroeconomics 宏观经济学 studies the economy as a whole: output, jobs and prices. A bakery can sell more bread because it produces more, because prices rise, or both. National accounts help us separate these changes before judging economic performance.
The macroeconomy
A-Level Economics · Topic 4
 17:12
17:12
The macroeconomy
A city at night: every light is somebody working, building, selling. A shelf of food: every price tag changed this year. An economy is too big to see, so we…
English narration · English + 中文 subtitles burned in
4.1
National income statistics

Syllabus
- define GDP, GNI and national income and distinguish nominal and real, and total and per capita values
- explain the uses and limitations of national income statistics for measuring living standards and making comparisons
Source: Cambridge International syllabus
National income 国民收入 describes income generated by production during a period. GDP, GNI and NNI are related measures, but answer different questions. State the period, currency and price basis when comparing them.
Count final output or value added
Gross domestic product 国内生产总值 (GDP) is the value of final goods and services produced within an economy during a period. It includes government services, not just goods sold by private firms. Intermediate inputs are used to produce other output; do not count them again alongside that final output.
Value added 增加值 is output value minus the value of intermediate inputs bought from other producers.
Worked example — one domestic bread chain. All amounts are £ per batch. Assume no other bought inputs or product taxes.
| Producer | Sales | Bought inputs | Value added |
|---|---|---|---|
| Farmer | 20 | 0 | 20 |
| Miller | 35 | 20 | 15 |
| Baker | 60 | 35 | 25 |
The farmer sells grain, the miller sells flour and the baker sells the final bread to households. Adding sales gives £115, but counts the grain and flour more than once. Adding value added gives £60, the same as final bread sales.
Domestic, national, gross and net
Gross national income 国民总收入 (GNI) is residents' total primary income. Start with GDP, add primary income residents receive from abroad and subtract primary income paid to non-residents. Residency is different from citizenship. Export receipts are payments for output, not primary income from abroad.
$$\text{GNI}=\text{GDP}+\text{primary income received}-\text{primary income paid}$$
Worked example — annual accounts. GDP is £800 billion/year, primary income received from abroad is £50 billion/year and income paid abroad is £70 billion/year, all at the same price basis.
$$\text{GNI}=\text{GDP}+\text{income received}-\text{income paid}=800+50-70=780\text{ (£ billion/year)}$$
A foreign-owned factory's domestic output counts in GDP. Income it pays to non-residents enters the GNI adjustment; we do not remove its entire output simply because its owners live abroad.
Capital depreciation 资本折旧 means consumption of fixed capital through wear and obsolescence. Net national income 国民净收入 (NNI) deducts this from GNI. If capital depreciation is £60 billion/year:
$$\text{NNI}=\text{GNI}-\text{capital depreciation}=780-60=720\text{ (£ billion/year)}$$
Gross/net adjusts for capital used up. It does not remove inflation.
Market prices and basic prices
Market prices 市场价格 include taxes on products less subsidies on products. Basic prices 基本价格 remove this net product-tax component. For the syllabus conversion:
$$\text{GDP at basic prices}=\text{GDP at market prices}-\text{taxes on products}+\text{subsidies on products}$$
Worked example — separate accounts. GDP at market prices is £500 billion/year, product taxes £80 billion/year and product subsidies £20 billion/year.
$$\text{GDP}_{b}=\text{GDP}_{m}-\text{product taxes}+\text{product subsidies}=500-80+20=440\text{ (£ billion/year)}$$
Reverse the signs to check the original market-price value:
$$\text{GDP}_{m}=\text{GDP}_{b}+\text{product taxes}-\text{product subsidies}=440+80-20=500\text{ (£ billion/year)}$$
Do not subtract personal income tax or capital depreciation in this price-basis step.
Nominal, real and per capita
Nominal 名义 values use current prices. Real 实际 values remove price changes so that changes in the amount of output can be compared. Nominal figures remain useful for current money receipts and payments.
Worked example — separate two-year series. Nominal GDP is £800 billion/year in Year 0 and £924 billion/year in Year 1. The given GDP price index rises from 100 to 110, with Year 0 as the base. Use a GDP price index, rather than assuming a consumer price index measures all GDP prices.
$$\text{Real GDP}=\frac{\text{nominal GDP}}{\text{GDP price index}}\times100$$
$$\text{Real GDP}_{1}=\frac{\text{nominal GDP}_{1}}{\text{GDP price index}_{1}}\times100=\frac{924}{110}\times100=840\text{ (£ billion/year)}$$
$$\text{Real growth}=\frac{\text{real GDP}_{1}-\text{real GDP}_{0}}{\text{real GDP}_{0}}\times100\%=\frac{840-800}{800}\times100\%=5\%$$
Per capita 人均 means per person. If population rises from 40 million to 42 million in this example:
$$\text{Real GDP per capita}_{0}=\frac{\text{real GDP}_{0}}{\text{population}_{0}}=\frac{800\text{ billion £/year}}{40\text{ million people}}=£20{,}000\text{/person/year}$$
$$\text{Real GDP per capita}_{1}=\frac{\text{real GDP}_{1}}{\text{population}_{1}}=\frac{840\text{ billion £/year}}{42\text{ million people}}=£20{,}000\text{/person/year}$$
Output and population both rise 5%, leaving real output per person unchanged. The average does not show who receives income.
A lower positive growth rate does not mean falling output. If a real output index starts at 100, rises 4% and then 2%, its levels are 104 and 106.08. Growth slows by 2 percentage points but output rises in both years. Distinguish a forecast from an observed outcome.
Uses and limitations
National income statistics help compare output over time and resources available for consumption and public services. For comparisons across countries, check prices, currency conversion, purchasing power, population and data quality.
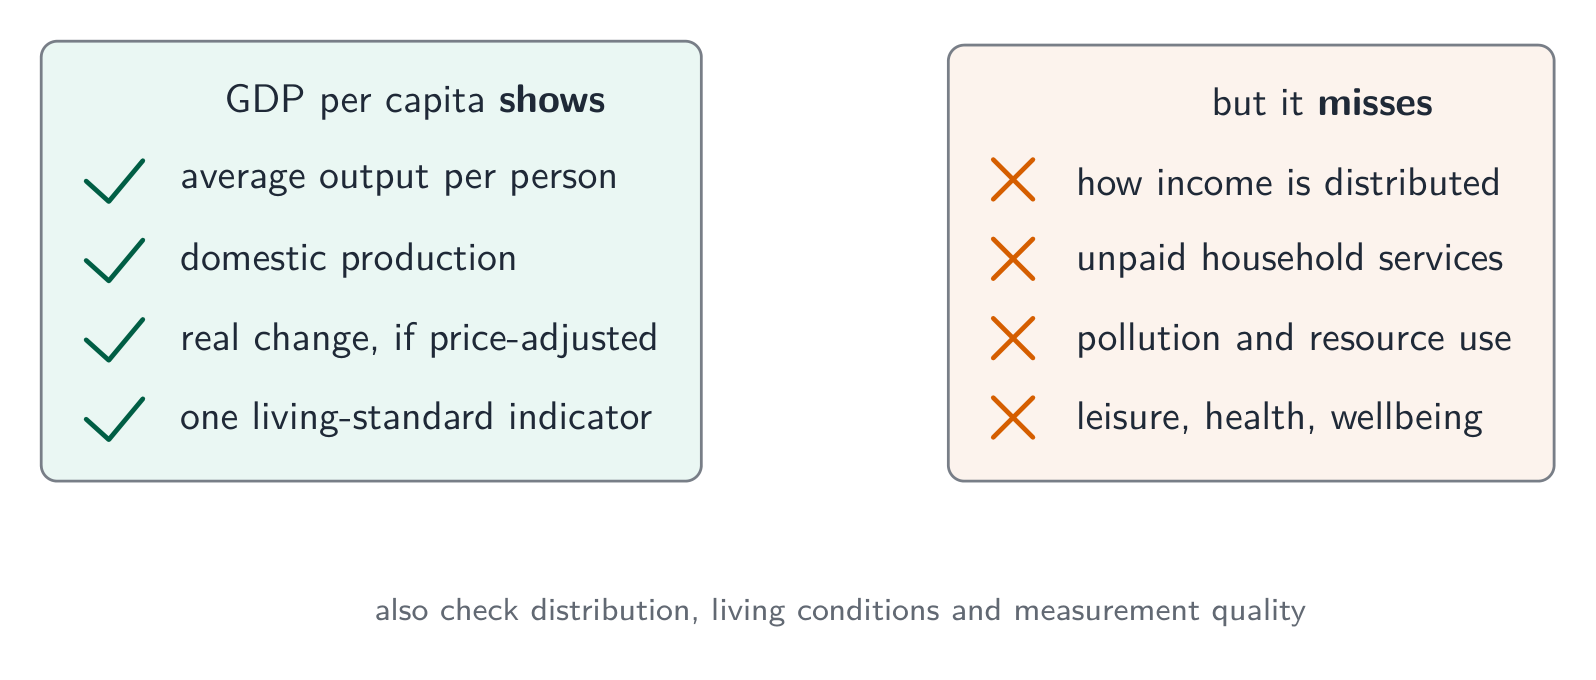
The standard of living 生活水平 is wider than output per person. Consider distribution 分配, leisure, health, access to services and pollution. For example, two economies can have the same average but give the poorest fifth 10% and 3% of income respectively. The average alone cannot rank their living conditions.
Most unpaid household services, such as cleaning your own home, are outside GDP; paying someone to provide the service can count. The informal economy 非正规经济 includes activity outside or insufficiently covered by formal arrangements. Production within the GDP boundary should be included in principle, but it can be difficult to measure fully. Do not claim that all informal production is excluded because it is untaxed.
Explore
National income flow
Watch spending become income, output and expenditure in the circular flow.
Vocabulary
Train
| English |
|---|
| macroeconomics/ˌmækrəˌriːkəˈnɒmɪks/ |
| national income/ˈnæʃənl ˈɪŋkʌm/ |
| gross domestic product/ɡrəʊs dəˈmestɪk ˈprɒdʌkt/ |
| gross national income/ɡrəʊs ˈnæʃənl ˈɪŋkʌm/ |
| nominal/ˈnɒmɪnl/ |
| real/rɪəl/ |
| per capita/pɜː ˈkæpɪtə/ |
| standard of living/ˈstændəd ɒv ˈlɪvɪŋ/ |
| distribution/ˌdɪstrɪˈbjuːʃn/ |
| informal economy/ɪnˈfɔːml ɪˈkɒnəmi/ |
| value added/ˈvæljuː ˈædɪd/ |
| net national income/net ˈnæʃənl ˈɪŋkʌm/ |
| capital depreciation/ˈkæpɪtl dɪˌpriːʃɪˈeɪʃn/ |
| market prices/ˈmɑːkɪt ˈpraɪsɪz/ |
| basic prices/ˈbeɪsɪk ˈpraɪsɪz/ |
4.2
The circular flow of income

Syllabus
- explain the circular flow of income with injections (investment, government spending, exports) and leakages (saving, taxation, imports)
- explain equilibrium in the circular flow and the distinction between a closed and open economy
Source: Cambridge International syllabus
The circular flow of income 收入循环流 links production, income and expenditure. Households 家庭 supply factor services to firms 企业 and receive wages, rent, interest and profit. Households buy goods and services from firms.
| Transaction | Real flow | Money flow |
|---|---|---|
| Employment | Labour to firms | Wages to households |
| Bread purchase | Bread to households | Spending to firms |
In each transaction the real flow and its payment go in opposite directions. Saving means households need not spend all current income on consumption.
Leakages and injections
Leakages 漏出 are saving 储蓄 ($S$), taxation 税收 ($T$) and imports 进口 ($M$). Injections 注入 are investment 投资 ($I$), government spending 政府支出 on goods and services ($G$), and exports 出口 ($X$).
A newly produced factory machine is investment; buying an existing share is an asset transaction, not new capital production. Government purchases of teaching services count in G. A pension is a transfer payment, rather than payment for current output; the recipient's later purchases may enter consumption. Imported shoes enter household consumption and imports: subtracting M prevents foreign production from being counted as domestic GDP.
A closed economy 封闭经济 has no foreign trade, so X and M are zero. An open economy 开放经济 includes international transactions. Government can be present in either.
Equilibrium and disequilibrium
Equilibrium 均衡 in this simple model requires planned injections to equal planned leakages at the current income level. Actual expenditure accounts include unplanned inventory changes; do not mistake an accounting identity for proof that plans are in balance.
Worked example — annual planned flows at fixed prices. Income Y is £300 billion/year; S = 35, T = 25, M = 30, I = 30, G = 40 and X = 20, all in £ billion/year. Assume no transfer payments. Find consumption C:
$$C=Y-S-T=300-35-25=240\text{ (£ billion/year)}$$
$$\text{Planned injections}=I+G+X=30+40+20=90\text{ (£ billion/year)}$$
$$\text{Planned leakages}=S+T+M=35+25+30=90\text{ (£ billion/year)}$$
$$\text{Planned expenditure}=C+I+G+X-M=240+30+40+20-30=300\text{ (£ billion/year)}$$
Planned expenditure equals current output, so there is no unplanned inventory change.
Change the plan. Investment rises to 40 while current output and other planned flows initially stay fixed.
$$\text{Planned expenditure}=C+I+G+X-M=240+40+40+20-30=310\text{ (£ billion/year)}$$
$$\text{Unplanned inventory change}=Y-\text{planned expenditure}=300-310=-10\text{ (£ billion/year)}$$
Unexpected inventory falls give firms a reason to raise production and employment if spare capacity allows. Near capacity, extra demand may mainly raise prices. As income changes, saving, taxes and imports may also change. An initial excess of injections does not guarantee a particular rise in real output. If planned spending falls below output, inventories rise unexpectedly and firms may reduce production. No multiplier calculation is needed here.
Check yourself
New annual data, all £ billion at the same price basis: GDP at market prices 600; product taxes 90; product subsidies 10; primary income received 30 and paid 50; capital depreciation 40. Find GDP at basic prices and NNI at market prices. Explain why neither answer alone establishes real growth.
Worked answer. The price-basis adjustment is:
$$\text{GDP}_{b}=\text{GDP}_{m}-\text{product taxes}+\text{product subsidies}=600-90+10=520\text{ (£ billion/year)}$$
The resident-income and capital-use adjustments are:
$$\text{NNI}_{m}=\text{GDP}_{m}+\text{income received}-\text{income paid}-\text{capital depreciation}=600+30-50-40=540\text{ (£ billion/year)}$$
Real growth needs comparable real output for at least two periods. These are different measures for one period.
Explore
Injections & leakages
Money loops between households and firms. Injections grow national income, leakages shrink it; they are equal at equilibrium.
Explore
The circular flow of income
Money flows in a loop: households earn income from firms, then spend it back on the firms' goods. Step round the cycle.
Vocabulary
Train
| English |
|---|
| circular flow of income/ˈsɜːkjʊlə fləʊ ɒv ˈɪŋkʌm/ |
| household/ˈhaʊshəʊld/ |
| firm/fɜːm/ |
| leakages/ˈliːkɪdʒɪz/ |
| saving/ˈseɪvɪŋ/ |
| taxation/tækˈseɪʃn/ |
| imports/ɪmˈpɔːts/ |
| injections/ɪnˈdʒekʃnz/ |
| investment/ɪnˈvestmənt/ |
| government spending/ˈɡʌvənmənt ˈspendɪŋ/ |
| exports/ˈekspɔːts/ |
| equilibrium/ˌiːkwɪˈlɪbrɪəm/ |
| closed economy/kləʊzd ɪˈkɒnəmi/ |
| open economy/ˈəʊpən ɪˈkɒnəmi/ |
4.3
Aggregate demand and aggregate supply
Syllabus
- define the components of aggregate demand (C + I + G + (X−M)) and explain the shape of the AD curve
- explain short-run and long-run aggregate supply and the determinants of AD and AS
- use AD/AS analysis to determine macroeconomic equilibrium and the price level and real output
Source: Cambridge International syllabus
Aggregate demand
Aggregate demand 总需求 (AD) is planned spending on domestic goods and services at each price level. Its components are household consumption 消费 C, spending on new capital I, government purchases of goods and services G, and net exports 净出口 X − M.
$$AD=C+I+G+(X-M)$$
Worked example — stated price level. Planned annual spending is C = 150, I = 30, G = 40, X = 25 and M = 35, all £ billion/year.
$$AD=C+I+G+(X-M)=150+30+40+(25-35)=210\text{ (£ billion/year)}$$
Net exports are negative: imports can exceed exports. Imported products can appear in C, I or G, so subtract M to remove foreign production. Buying an existing share is not spending on newly produced capital, and a pension is not a government purchase of current output.
A movement along AD and a shift
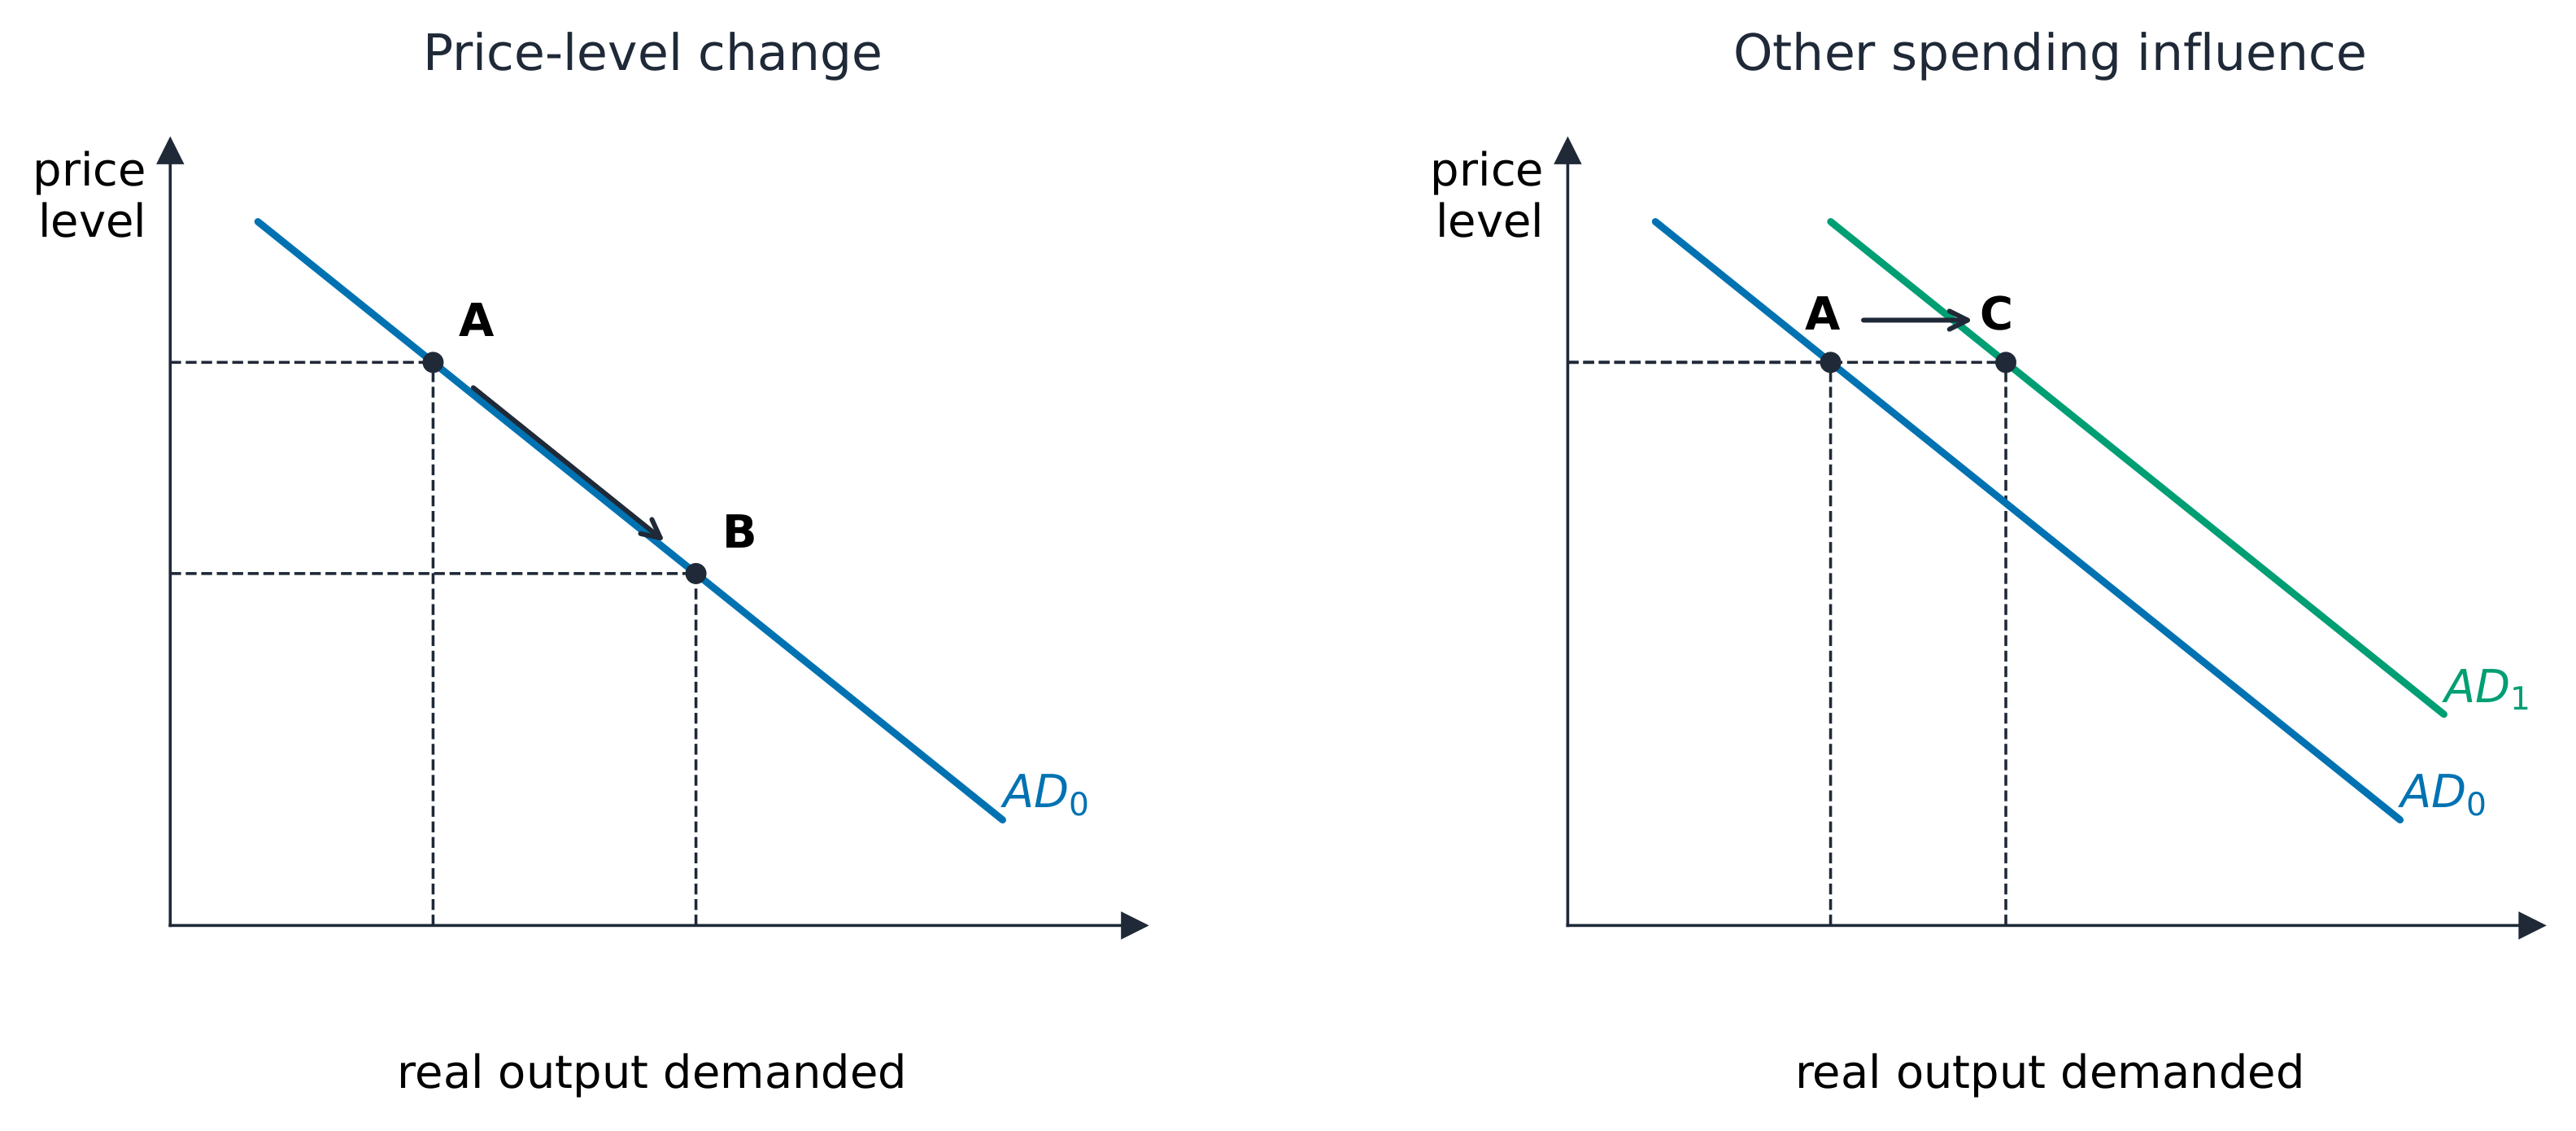
Hold other influences constant. A lower domestic price level can raise the purchasing power of money balances and make domestic goods cheaper relative to foreign goods. Real output demanded rises along the existing AD curve. This helps explain its downward slope.
By contrast, higher household confidence can increase consumption at each price level, shifting AD right. A change in a non-price influence changes the relationship, rather than moving along it.
Explain the decisions. A tax cut raises disposable income and may raise C, but households may save or repay debt; some purchases may be imports. Higher expected sales may encourage firms to buy new machinery, raising I, but spare existing capacity, expensive credit or uncertainty can weaken the response. Higher government purchases directly raise G. Stronger foreign demand may raise X. Explain the component and mechanism before drawing an AD shift; do not assume every change in income or borrowing causes the same spending response.
Aggregate supply
Aggregate supply 总供给 (AS) relates the price level to real output supplied. Short-run aggregate supply 短期总供给 (SRAS) slopes upward when some input costs adjust slowly. If output prices rise while wage rates and input prices initially stay fixed, producing extra output becomes more attractive: move up the same SRAS.
Higher imported fuel costs reduce profitable supply at each price level and shift SRAS left/up. Better productivity 生产率 can reduce unit costs and shift SRAS right. Separate a change in the price level from a change in a supply determinant.
Macroeconomic equilibrium
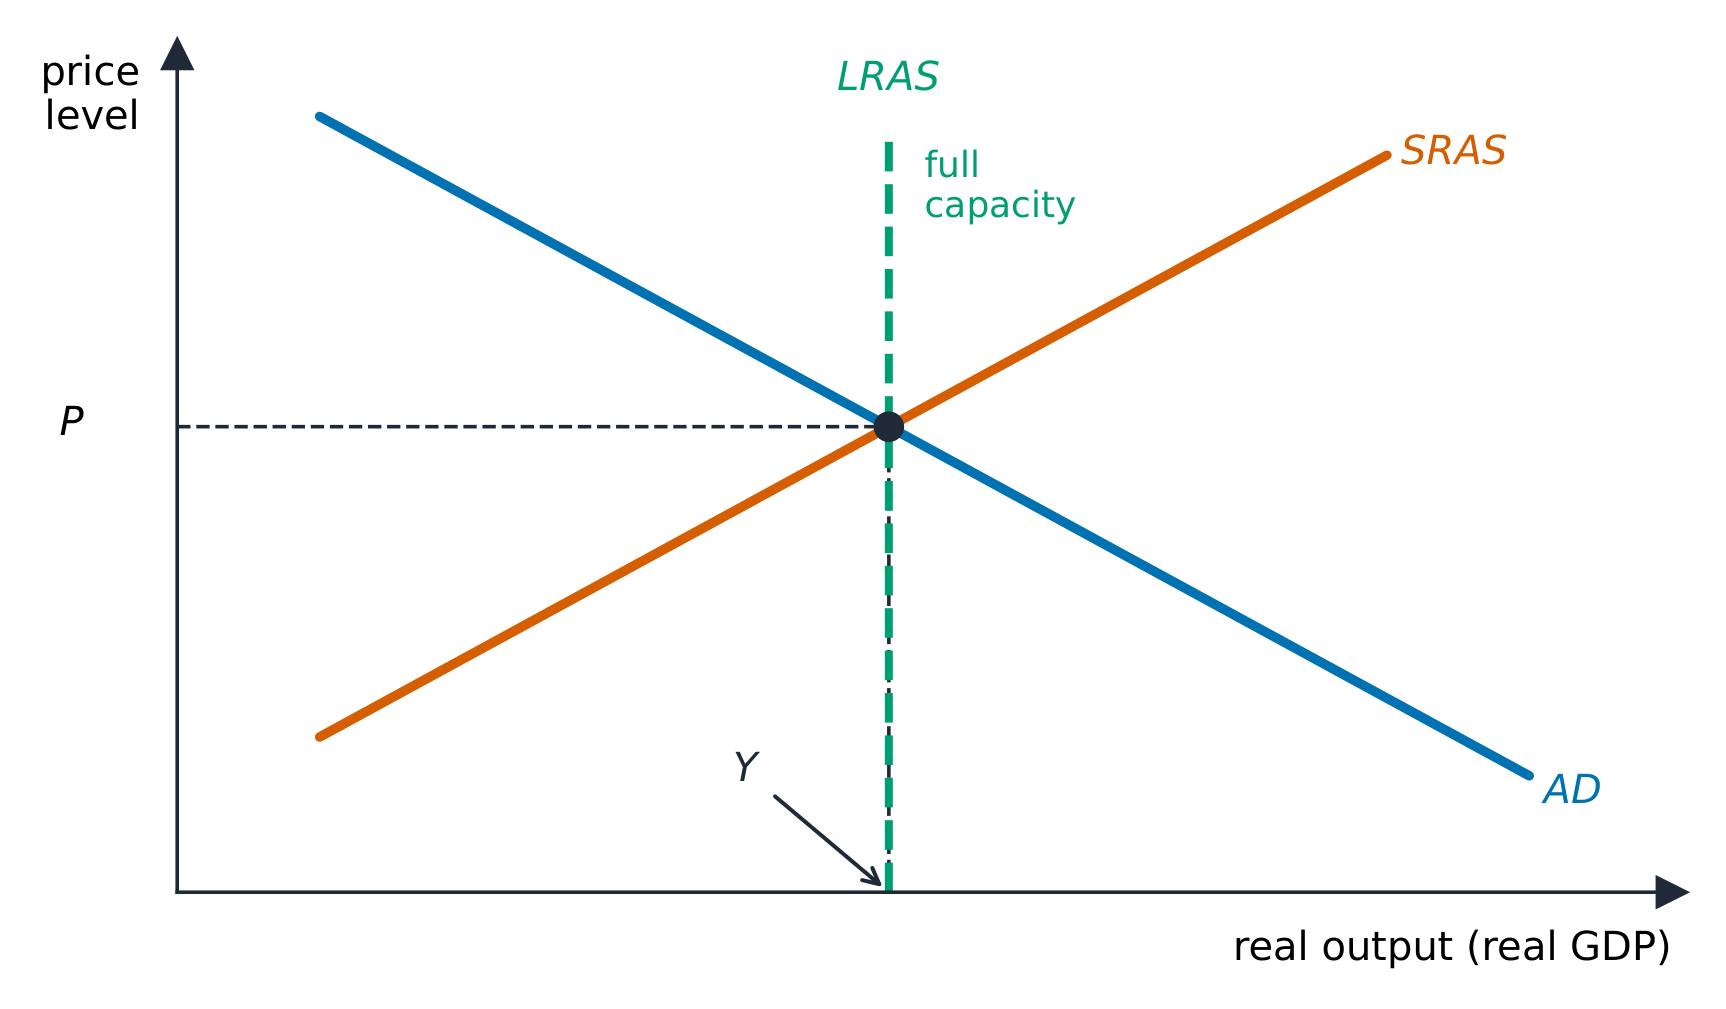
Macroeconomic equilibrium 宏观经济均衡 is the relevant AD/AS intersection. It determines the price level 价格水平 and real output 实际产出 in that model.
Compare changes in demand and supply
The paired diagrams below use a separate illustrative short-run model with upward-sloping SRAS and room for output to change. Each starts at the same initial intersection.
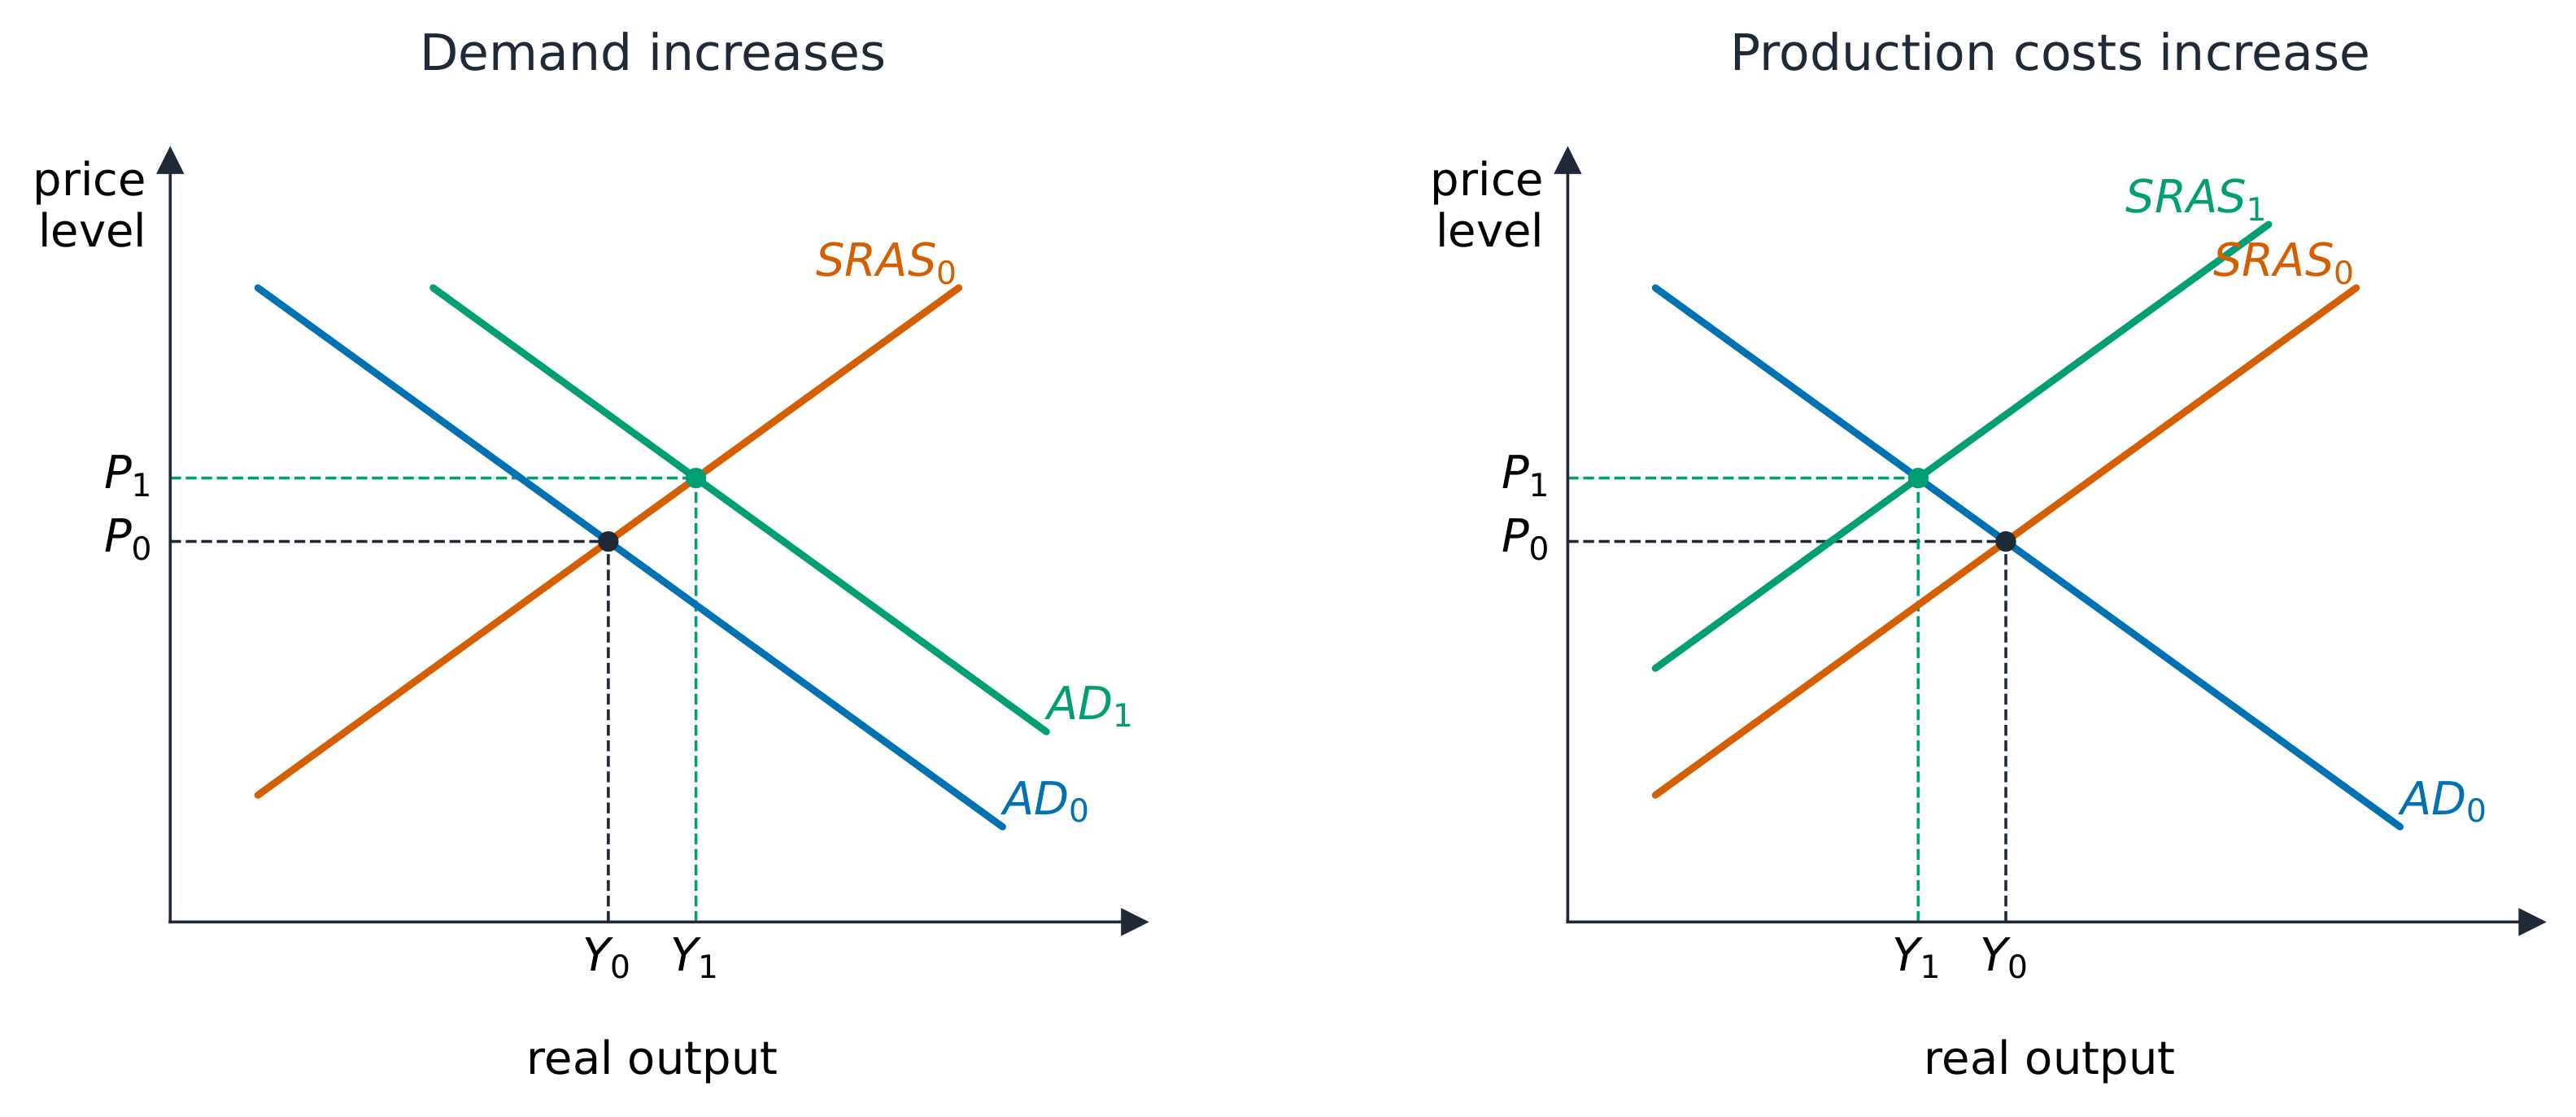
- When AD shifts right along upward-sloping SRAS, real output and the price level rise. Firms may need more workers; the employment response also depends on productivity and hours worked.
- When SRAS shifts left with AD unchanged, the price level rises while real output falls. Firms may reduce employment as they reduce production. This is a different mechanism from higher spending.
A shift showing a higher price level illustrates inflation pressure between periods. Persistent inflation means prices keep rising over time; one shock alone does not establish a permanently continuing inflation rate.
Capacity and the long run
Long-run aggregate supply 长期总供给 (LRAS) depends on productive capacity 生产能力: resources, skills, technology and productivity. More reliable electricity can reduce factory outages and expand sustainable production. Extra household spending initially shifts AD. Some spending, such as infrastructure construction, can raise demand now and improve supply later.
The syllabus permits vertical LRAS or a three-section representation: a highly elastic/flat section with spare capacity, an upward section as constraints increase, and a vertical section at capacity.
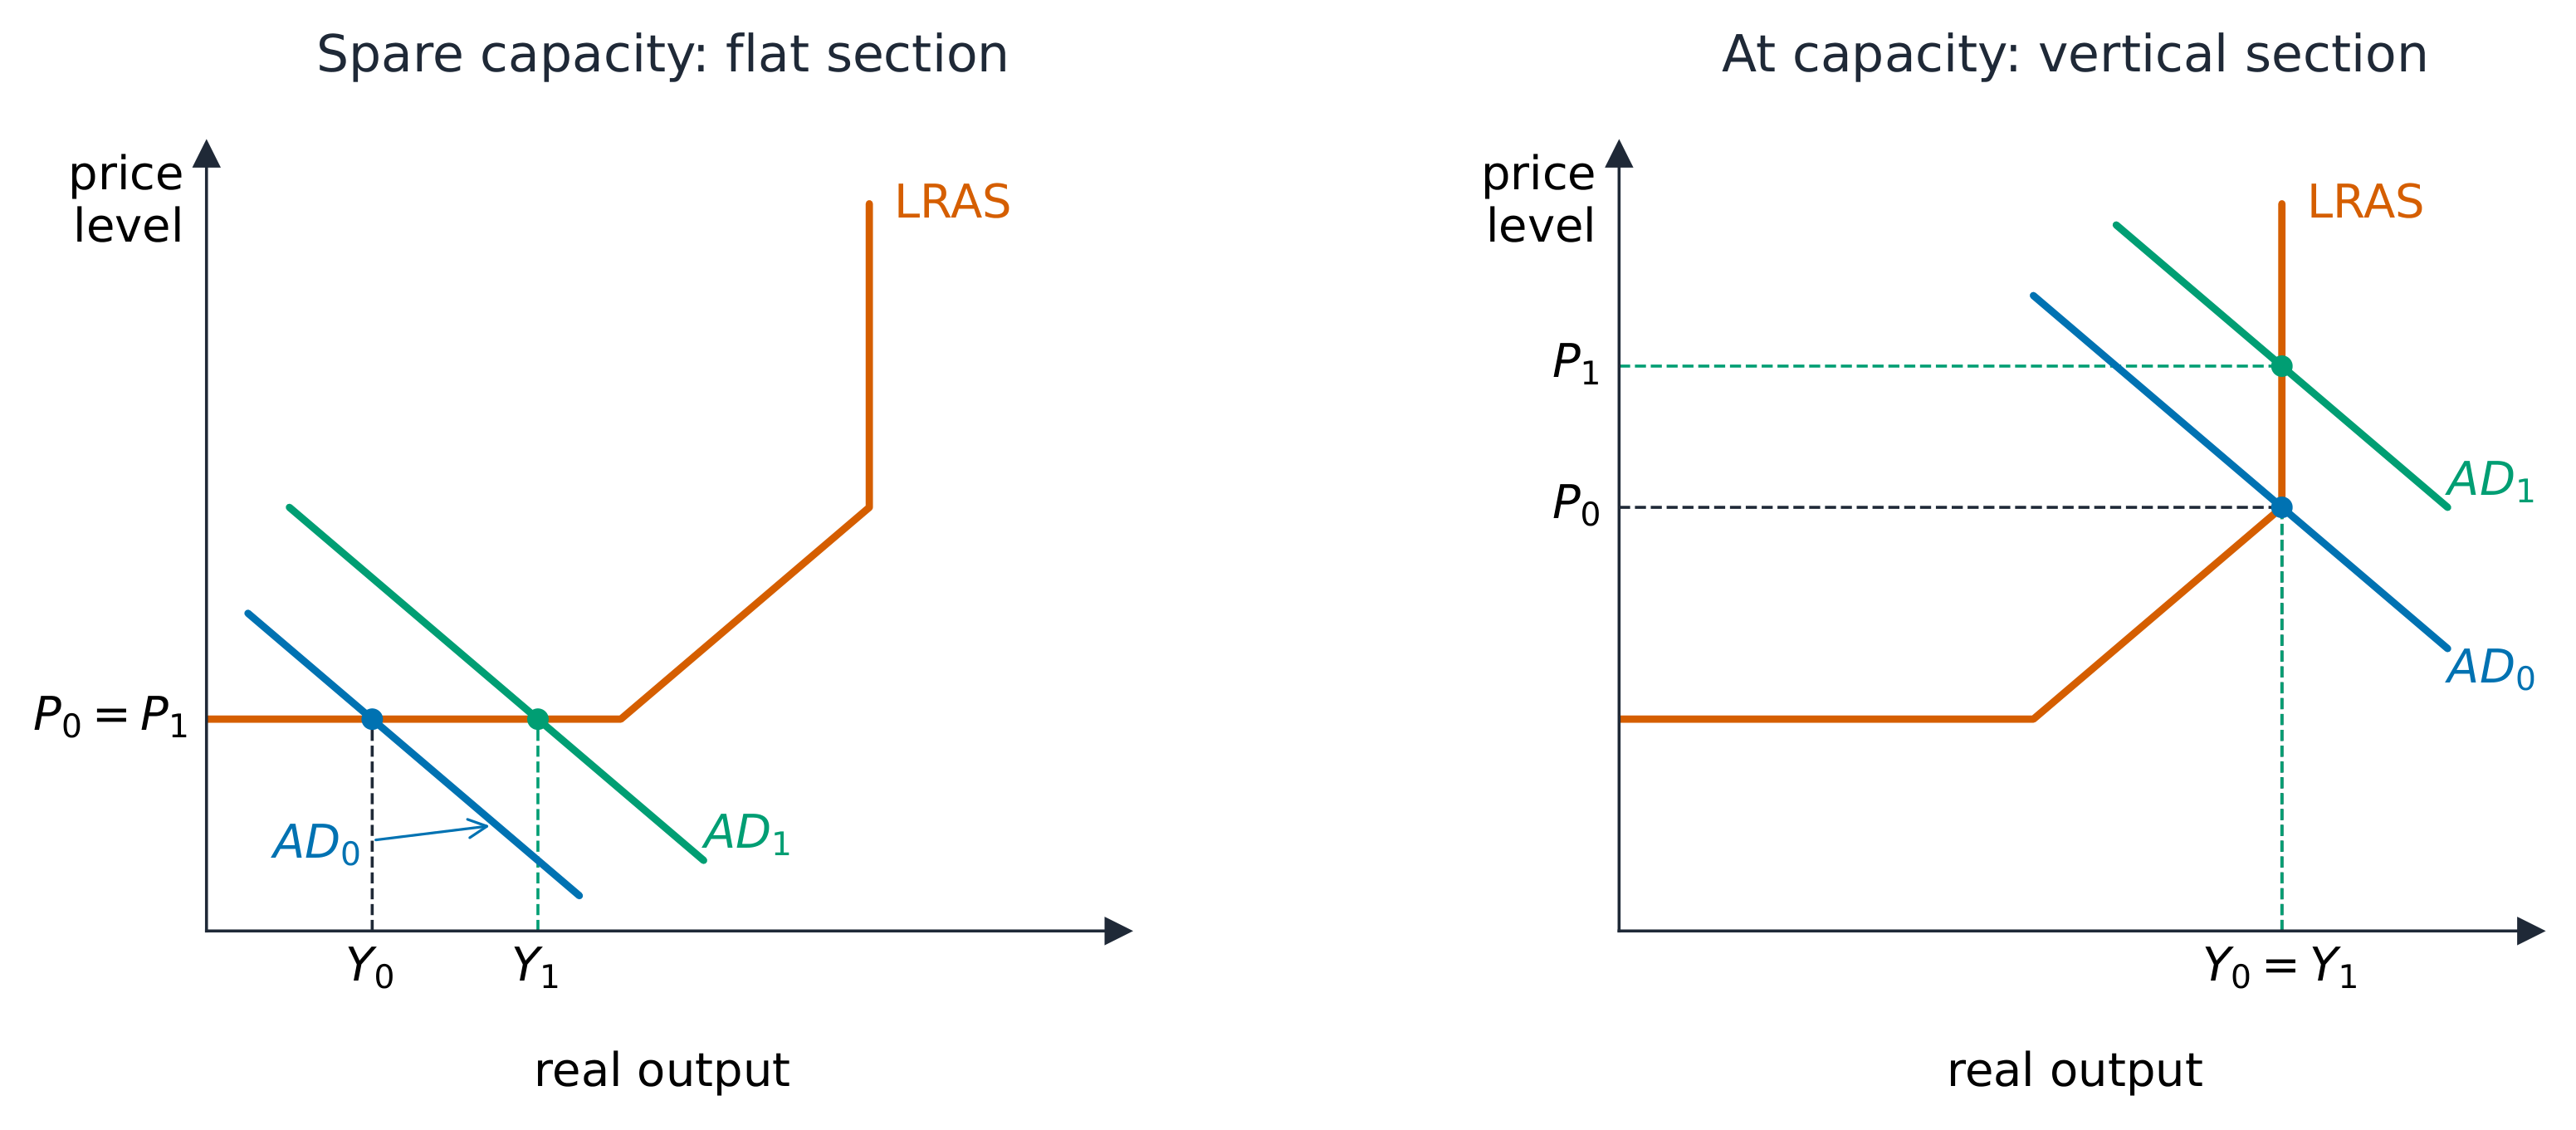
In the upward section, both output and prices can rise. Identify the model, the capacity position and the time period before concluding that every AD or AS shift changes both variables. Extra capacity does not guarantee enough demand to use it. These conditions explain why an increase in AD does not always lead to inflation.
Explore
Aggregate demand & supply
AD and AS cross at the price level and national output.
Vocabulary
Train
| English |
|---|
| aggregate demand/ˈæɡrɪɡeɪt dɪˈmænd/ |
| consumption/kənˈsʌmpʃn/ |
| net exports/net ˈekspɔːts/ |
| aggregate supply/ˈæɡrɪɡeɪt səˈplaɪ/ |
| short-run aggregate supply/ʃɔːt rʌn ˈæɡrɪɡeɪt səˈplaɪ/ |
| long-run aggregate supply/lɒŋ rʌn ˈæɡrɪɡeɪt səˈplaɪ/ |
| productive capacity/prəˈdʌktɪv kəˈpæsɪti/ |
| macroeconomic equilibrium/ˌmækrəˌriːkəˈnɒmɪk ˌiːkwɪˈlɪbrɪəm/ |
| price level/praɪs ˈlevl/ |
| real output/rɪəl ˈaʊtpʊt/ |
| productivity/ˌprɒdəkˈtɪvɪti/ |
4.4
Economic growth
Syllabus
- distinguish actual and potential growth and explain the causes of economic growth
- explain the costs and benefits of economic growth and the business (trade) cycle
Source: Cambridge International syllabus
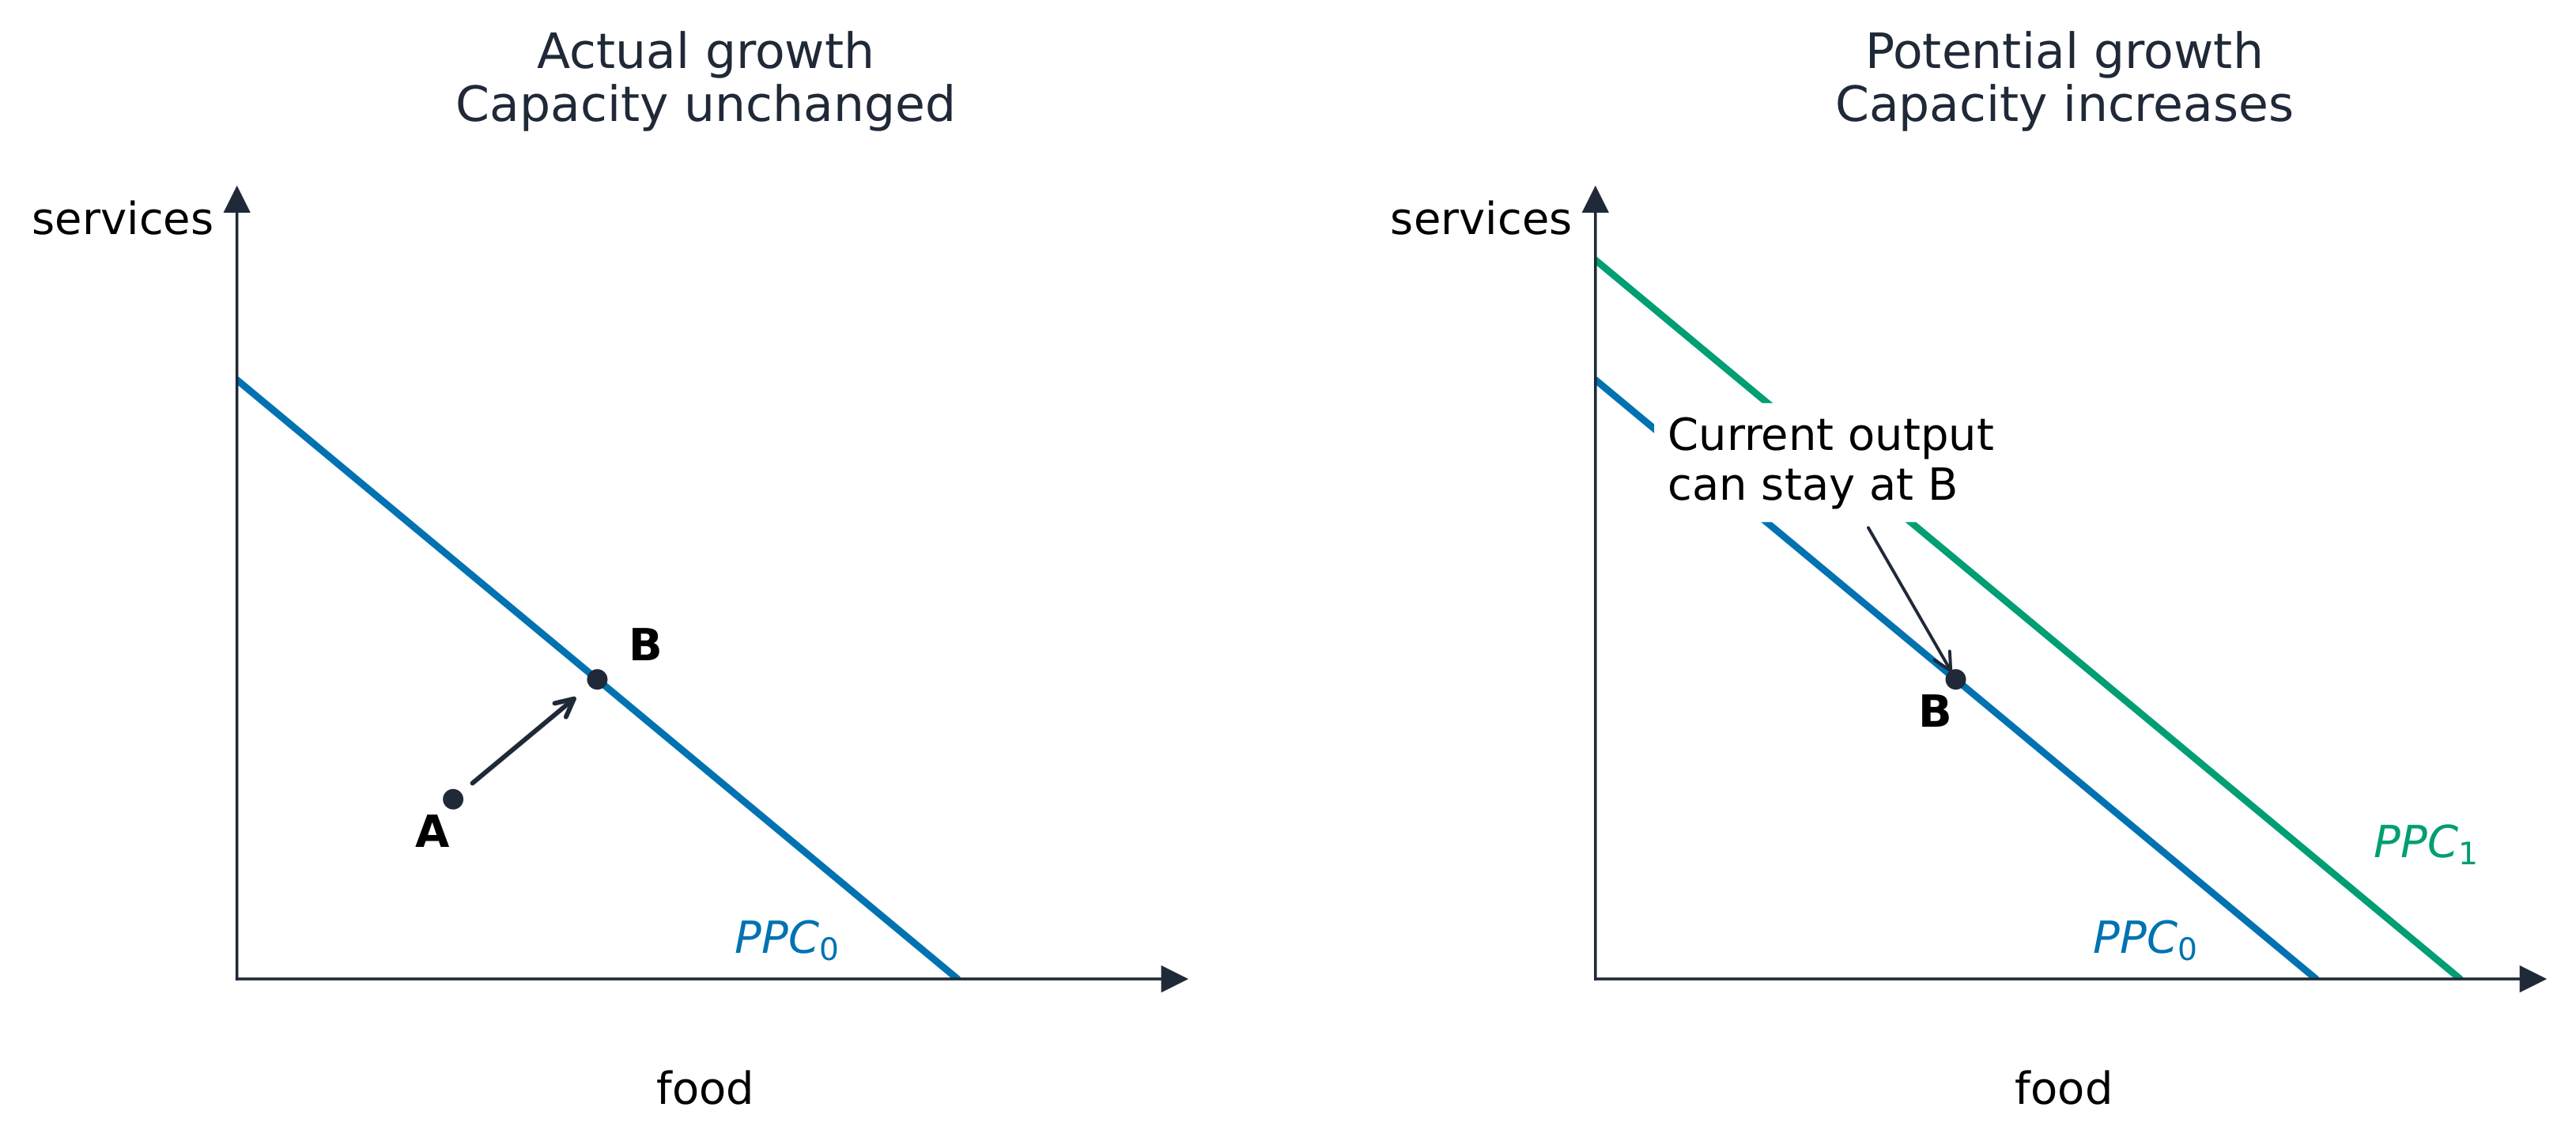
Economic growth 经济增长 is an increase in real output over time. Actual growth 实际增长 is the observed increase. Potential growth 潜在增长 expands what the economy can sustainably produce.
Compare two changes. Restarting idle factories raises current output using existing capacity. Better machinery can expand capacity and shift LRAS right, even before firms receive more orders. Actual growth can occur without new capacity; potential growth can occur before actual output rises.
A production possibility curve 生产可能性曲线 (PPC) shows feasible output combinations using available resources and technology.
Causes of growth
More working-age residents can increase labour input; training can reduce defects and raise useful output per worker. Investment can improve capital, while technology and infrastructure can increase productivity. These mechanisms require suitable resources and demand: an unused machine does not automatically increase actual output.
For real output per person to rise, real output must grow faster than population. The earlier example shows why 5% real GDP growth alongside 5% population growth leaves the average unchanged. Distribution also affects who gains.
The business cycle
Real output does not grow smoothly. The business cycle 经济周期 includes boom 繁荣, recession 衰退, slump 萧条 and recovery 复苏. A recession involves falling real output; a recovery involves rising output after a downturn. Definitions using a particular quarterly rule require suitable quarterly data.

Worked example — separate annual output series. The real-output index is 104 in Year 1, 102 in Year 2 and 103 in Year 3.
$$g_t=\frac{Y_t-Y_{t-1}}{Y_{t-1}}\times100\%$$
$$g_2=\frac{Y_2-Y_1}{Y_1}\times100\%=\frac{102-104}{104}\times100\%\approx-1.92\%$$
$$g_3=\frac{Y_3-Y_2}{Y_2}\times100\%=\frac{103-102}{102}\times100\%\approx0.98\%$$
Output falls and then rises, but 103 is still below 104. Recovery does not mean the previous output level has already been regained. A slower positive growth rate is also different from negative growth.
Costs and benefits of growth
Higher output can support incomes, jobs, tax receipts and public services. But examine employment, real output per person and distribution before assuming that everyone benefits equally or poverty falls.
Compare two illustrative paths: A reopens idle low-pollution factories; B produces more through longer working hours and more polluting activity. Both can raise GDP, but B may lose leisure and face health costs or resource depletion. Growth caused by extra demand near capacity can create inflation pressure; growth expanding supply can ease pressure. Judge the mechanism, scale, sustainability and who gains or loses.
Explore
Economic growth shifts the frontier out
Growth means the economy can produce more of BOTH goods — the whole frontier moves outward as resources or technology improve.
Vocabulary
Train
| English |
|---|
| economic growth/ˌiːkəˈnɒmɪk ɡrəʊθ/ |
| actual growth/ˈæktʃuːəl ɡrəʊθ/ |
| potential growth/pəˈtenʃl ɡrəʊθ/ |
| business cycle/ˈbɪznəs ˈsaɪkl/ |
| boom/buːm/ |
| recession/rɪˈseʃn/ |
| slump/slʌmp/ |
| recovery/rɪˈkʌvəri/ |
| production possibility curve/prəˈdʌkʃn ˌpɒsəˈbɪlɪti kɜːv/ |
4.5
Unemployment
Syllabus
- define and measure unemployment (claimant count and labour force survey)
- explain the types and causes of unemployment (frictional, structural, cyclical, seasonal) and its consequences
Source: Cambridge International syllabus
unemployment 失业 means having no job while available for work and actively seeking it. The labour force 劳动力 is employed people plus unemployed people. People neither working nor actively seeking work are outside it; they are economically inactive. Classify students and retired people by their actual work and search status, not their label alone.
Measuring unemployment
The claimant count 申领救济人数 counts people claiming specified unemployment benefits. Administrative records are relatively cheap to collect, but miss non-claimants and ineligible jobseekers. Changes in eligibility can change the count without a change in jobs.
The labour force survey 劳动力调查 asks a representative sample about work, availability and active search. A common international definition helps comparisons, but sampling error, inaccurate replies and differences in implementation affect estimates. Discouraged people who stop searching are outside measured unemployment. A person working fewer hours than they want can still be classified as employed.
Worked example: choose the denominator. An illustrative population has 1000 people: 540 employed, 60 without jobs but available and seeking work, 150 inactive working-age people and 250 children. Let employed people be $E$ and unemployed people be $U$.
$$\text{labour force}=E+U=540+60=600\text{ people}.$$
The unemployment rate measures the unemployed share of the labour force, not the whole population:
$$\text{unemployment rate}=\frac{U}{E+U}\times100\%.$$
$$\text{unemployment rate}=\frac{60}{540+60}\times100\%=10\%.$$
Dividing by 1000 would give $6\%$, the unemployed share of the total population, which is a different measure.
Worked example: a rate can fall without new jobs. Forty of these unemployed people stop seeking work; nobody gains or loses a job. Unemployment becomes 20 and the labour force becomes 560.
$$\text{unemployment rate}=\frac{U}{E+U}\times100\%.$$
$$\text{unemployment rate}=\frac{20}{540+20}\times100\%\approx3.57\%.$$
Employment stays at 540. Read employment and participation alongside the unemployment rate before concluding that jobs have improved.
Types and causes
- frictional unemployment 摩擦性失业: matching a worker to a vacancy takes time, for example while searching between jobs. It is often brief, but its duration is not fixed.
- structural unemployment 结构性失业: changes in production and demand leave workers' skills or locations mismatched with available jobs, for example after a local industry declines.
- cyclical unemployment 周期性失业: weak AD reduces sales and firms' demand for labour during a downturn. Its size and duration depend on the downturn and recovery.
- seasonal unemployment 季节性失业: predictable seasonal changes remove jobs at certain times, for example winter layoffs at a summer resort.
- technological unemployment 技术性失业: machines or software replace particular labour tasks. It overlaps with structural unemployment when displaced workers lack the skills needed for new jobs. Automation can also create jobs and reduce costs elsewhere; the displaced workers do not necessarily gain those jobs immediately. Do not count overlapping causes twice.
Consequences and comparison
Lost earnings can reduce household spending and living standards. Long spells without work can harm skills and health; savings, benefits and access to another job affect the harm. Unused willing labour means forgone output, and falling household spending can weaken firms' sales further. Production may lie inside the PPC when usable resources are idle, although jobseekers cannot necessarily fill every vacancy immediately.
Lower taxable earnings reduce government receipts; eligible benefit claims raise spending. The effect depends on tax and benefit rules, numbers affected and duration.
Worked comparison. In illustrative case A, 2000 workers lose jobs after a local industry closes and nearby vacancies need different skills. In B, 20000 workers lose jobs across industries during a demand downturn. A may cause persistent regional harm if retraining and moving are difficult. B affects ten times as many people and may cause a larger immediate loss of income and output. Neither type is always worse: compare numbers, duration, regional concentration, lost income and routes back to work. Without these data, a definite ranking is unjustified. Stronger AD helps weak sales; training helps a mismatch, but neither guarantees a suitable job. Unit 5 develops the policy analysis.
Explore
Unemployment in the labour market
If the wage is stuck ABOVE the equilibrium, more workers want jobs than firms will hire — that gap is unemployment.
Vocabulary
Train
| English |
|---|
| unemployment/ʌnemˈplɔɪmənt/ |
| claimant count/ˈkleɪmənt kaʊnt/ |
| labour force survey/ˈleɪbə fɔːs ˈsɜːveɪ/ |
| labour force/ˈleɪbə fɔːs/ |
| frictional unemployment/ˈfrɪkʃənl ʌnemˈplɔɪmənt/ |
| structural unemployment/ˈstrʌktʃərəl ʌnemˈplɔɪmənt/ |
| cyclical unemployment/ˈsaɪklɪkl ʌnemˈplɔɪmənt/ |
| seasonal unemployment/ˈsiːzənl ʌnemˈplɔɪmənt/ |
| technological unemployment/ˌteknəˈlɒdʒɪkl ʌnemˈplɔɪmənt/ |
4.6
Price stability

Syllabus
- define inflation, deflation and disinflation and explain how the price level is measured
- explain the causes (demand-pull and cost-push) and consequences of inflation and deflation
Source: Cambridge International syllabus
Inflation, deflation and disinflation
inflation 通货膨胀 is a sustained rise in the general price level. Money's purchasing power 购买力 falls: a given sum buys less. deflation 通货紧缩 is a sustained fall in the general price level. disinflation 反通货膨胀 means inflation slows while remaining positive: prices still rise, more slowly. A fall in one product's price does not establish economy-wide deflation.
Building and interpreting a CPI
The consumer price index 消费者价格指数 (CPI) tracks prices of a household consumption basket against a base period. A weight 权重 reflects a category's share of household spending, not the number of products. In this simplified calculation, category price indices use the same base year and weights sum to 1:
$$\mathrm{CPI}=\sum_i w_iP_i.$$
Worked example: a two-category basket. Food has weight $0.60$ and price index $120$; transport has weight $0.40$ and index $110$.
$$\mathrm{CPI}=(0.60\times120)+(0.40\times110)=116.$$
The simple average, 115, incorrectly gives equal weight to unequal spending shares. With a base-year index of 100, this basket costs $16\%$ more than in the base year.
Next year, food's index is 126 and transport's is 121. Keep the same weights:
$$\mathrm{CPI}_t=\sum_i w_iP_{i,t}.$$
$$\mathrm{CPI}_t=(0.60\times126)+(0.40\times121)=124.$$
The inflation rate is the percentage change from the previous index:
$$\pi_t=\frac{\mathrm{CPI}_t-\mathrm{CPI}_{t-1}}{\mathrm{CPI}_{t-1}}\times100\%.$$
$$\pi_t=\frac{124-116}{116}\times100\%\approx6.90\%.$$
The index rose 8 points, but prices rose about $6.90\%$, not $8\%$.
Worked example: disinflation. A separate annual CPI series is 100, 104, then 107.
$$\pi_1=\frac{\mathrm{CPI}_1-\mathrm{CPI}_0}{\mathrm{CPI}_0}\times100\%=\frac{104-100}{100}\times100\%=4\%.$$
$$\pi_2=\frac{\mathrm{CPI}_2-\mathrm{CPI}_1}{\mathrm{CPI}_1}\times100\%=\frac{107-104}{104}\times100\%\approx2.88\%.$$
The rate falls, but the price level still rises: disinflation, not deflation.
Difficulties in measurement
An average basket does not represent every household. Using food index 120 and transport index 110, a household spending $80\%$ on food and $20\%$ on transport has a different cost index:
$$P_H=w_fP_f+w_tP_t.$$
$$P_H=(0.80\times120)+(0.20\times110)=118.$$
Its basket costs $18\%$ more than in the common base year, compared with $16\%$ for the official example. Basket updates can lag changes in buying habits. Quality changes, new products and representative price sampling also make like-for-like measurement difficult.
Nominal and real pay
Worked example. Weekly nominal pay rises from $\text{\pounds}500$ to $\text{\pounds}520$ while the CPI rises from 100 to 104. Express real pay in base-year pounds:
$$\text{real pay}=\frac{\text{nominal pay}}{\mathrm{CPI}}\times100.$$
$$\text{real pay}_1=\frac{\text{\pounds}520/\text{week}}{104}\times100=\text{\pounds}500/\text{week}.$$
Initial real pay was also £500 per week. The pay rise buys the same basket. Wider living standards also depend on working hours, other income, household needs and public services.
Practice with solution. Pay rises from £500 to £550; CPI rises from 100 to 105. Find real pay and its percentage change before reading on.
$$W^R_1=\frac{W^N_1}{\mathrm{CPI}_1}\times100=\frac{\text{\pounds}550/\text{week}}{105}\times100\approx\text{\pounds}523.81/\text{week}.$$
$$g_R=\frac{W^R_1-W^R_0}{W^R_0}\times100\%=\frac{523.81-500}{500}\times100\%\approx4.76\%.$$
Subtracting nominal and price growth rates gives an approximation ($10\%-5\%=5\%$), not the exact change.
Causes of inflation
demand-pull inflation 需求拉动型通货膨胀 comes from stronger planned spending shifting AD right. Price pressure depends on spare capacity and the supply response; an AD increase need not cause a large price rise. Investment can raise AD now and productive capacity later.
cost-push inflation 成本推动型通货膨胀 comes from higher input costs shifting SRAS left. With AD unchanged and upward-sloping SRAS, the new equilibrium has a higher price level and lower real output.
A one-off fuel-cost increase can raise the price level without causing repeated annual price rises. Continuing inflation requires continuing pressure or further adjustments. State the time period and AS conditions rather than treating every increase in spending or costs as continuing inflation.
Consequences of inflation
For consumers, income that fails to keep pace loses purchasing power. The effect varies with spending patterns, wage adjustment and savings. High, unpredictable inflation can make planning harder and weaken confidence.
Worked example: fixed nominal debt. A debt stays at £1000 while the price index rises from 100 to 120.
$$D^R=\frac{D^N}{P}\times100.$$
$$D^R=\frac{\text{\pounds}1000}{120}\times100\approx\text{\pounds}833.33.$$
Its real value falls from £1000 in base-year pounds. Unexpected inflation can favour a fixed-rate borrower over the lender. Indexed debts or higher interest charges can offset this; repayment ability depends on income. Savers' real returns depend on the interest earned relative to inflation. Borrowers do not always gain and savers do not always lose.
For firms, higher prices do not guarantee higher profit. Demand-led inflation may support sales, whereas cost-push inflation may squeeze margins. Export competitiveness depends on foreign prices and exchange rates as well as domestic inflation.
Worked example: price, cost and sales. An illustrative firm has no other costs. Price starts at £10 per unit, unit cost £8 and sales 100 units. Later price is £12, unit cost £11 and sales 80 units.
$$\text{profit}=(p-c)Q.$$
$$\text{profit}_0=(\text{\pounds}10-\text{\pounds}8)/\text{unit}\times100\text{ units}=\text{\pounds}200.$$
$$\text{profit}_1=(\text{\pounds}12-\text{\pounds}11)/\text{unit}\times80\text{ units}=\text{\pounds}80.$$
Selling prices rise but profit falls because margins and sales fall. High inflation also makes frequent repricing costly; uncertain costs and demand can discourage investment and make price signals harder to interpret.
Assessment practice. Is high inflation always more damaging to consumers than to firms? Compare a fixed-income household buying essentials with a firm using imported inputs that cannot quickly raise selling prices. Explain each mechanism, then judge using income adjustment, debt terms, spending patterns, market power, input exposure and duration. Keep the answer about high inflation if that is the question's context. Neither group is always harmed more.
Why deflation's cause matters
A collapse in AD can lower both prices and output, increasing unemployment. Expectations of further price falls may delay some purchases, especially durable goods, weakening demand further. Fixed nominal debts become more burdensome in real terms. But productivity improvements can lower prices while raising output. Falling prices alone do not prove a demand collapse: cause, expectations and debt exposure determine the risks.
Explore
Aggregate demand and supply
The overall price level sits where aggregate demand meets aggregate supply — a shock to either moves prices and output.
Vocabulary
Train
| English |
|---|
| inflation/ɪnˈfleɪʃn/ |
| purchasing power/ˈpɜːtʃɪsɪŋ ˈpaʊə/ |
| deflation/diːˈfleɪʃn/ |
| disinflation/ˌdɪsɪnˈfleɪʃn/ |
| consumer price index/kənˈsuːmə praɪs ˈɪndeks/ |
| weight/weɪt/ |
| demand-pull inflation/dɪˈmænd pʊl ɪnˈfleɪʃn/ |
| cost-push inflation/kɒst pʊʃ ɪnˈfleɪʃn/ |
4.6
Exam practice and checks
- Nominal GDP rises $8\%$ while the GDP price index rises $10\%$. Does real output rise? Explain rather than subtracting rates as an exact calculation.
- The unemployment rate falls with employment unchanged. Explain a possible cause.
- Factories have spare capacity. Why need higher investment not cause a large immediate price rise? Name a leakage and distinguish it from an injection.
- CPI rises from 125 to 130; weekly pay rises £600 to £612. Calculate inflation and the real-pay change.
- Automation displaces packers while technician vacancies remain. Explain the unemployment type and evidence needed to compare the harm with a demand downturn.
Check after attempting. (1) Real-output factor $1.08/1.10\approx0.982$: real GDP falls about $1.82\%$. (2) Some jobseekers may leave the labour force. (3) Spare capacity allows more production with limited price pressure; later investment may expand supply. Saving, taxation and imports are leakages; investment, government spending and exports are injections. (4) Inflation is $[(130-125)/125]\times100\%=4\%$. Real-pay change is $[(612/600)/(130/125)-1]\times100\%\approx-1.92\%$. (5) Technological displacement can overlap with structural skill mismatch; compare numbers, duration, lost income and access to suitable jobs before ranking harm against cyclical unemployment.
Interactive lessons on this topic
Work through it step by step, with instant-check exercises.