- explain the determinants of demand and supply and distinguish movements along from shifts of the curves
- derive individual and market demand and supply
- explain the relationship between marginal utility and the demand curve
The price system and the microeconomy
A-Level Economics · Topic 2
 16:11
16:11
The price system and the microeconomy
Nobody in this market is in charge. No official decides what a kilo of tomatoes should cost. Yet every stall has a price, and by evening almost everything is…
English narration · English + 中文 subtitles burned in
2.1
Demand
Syllabus
Source: Cambridge International syllabus
demand 需求 is the quantity of a good that buyers are willing and able to buy at each price 价格 in a period of time. It is not just a wish — buyers must also be able to pay.
The law of demand, holding other determinants constant, says: when the price rises, the quantity demanded 需求量 falls; when the price falls, the quantity demanded rises. Price and quantity move in opposite directions.
So the demand curve 需求曲线 slopes downward, from top-left to bottom-right.
What shifts the demand curve
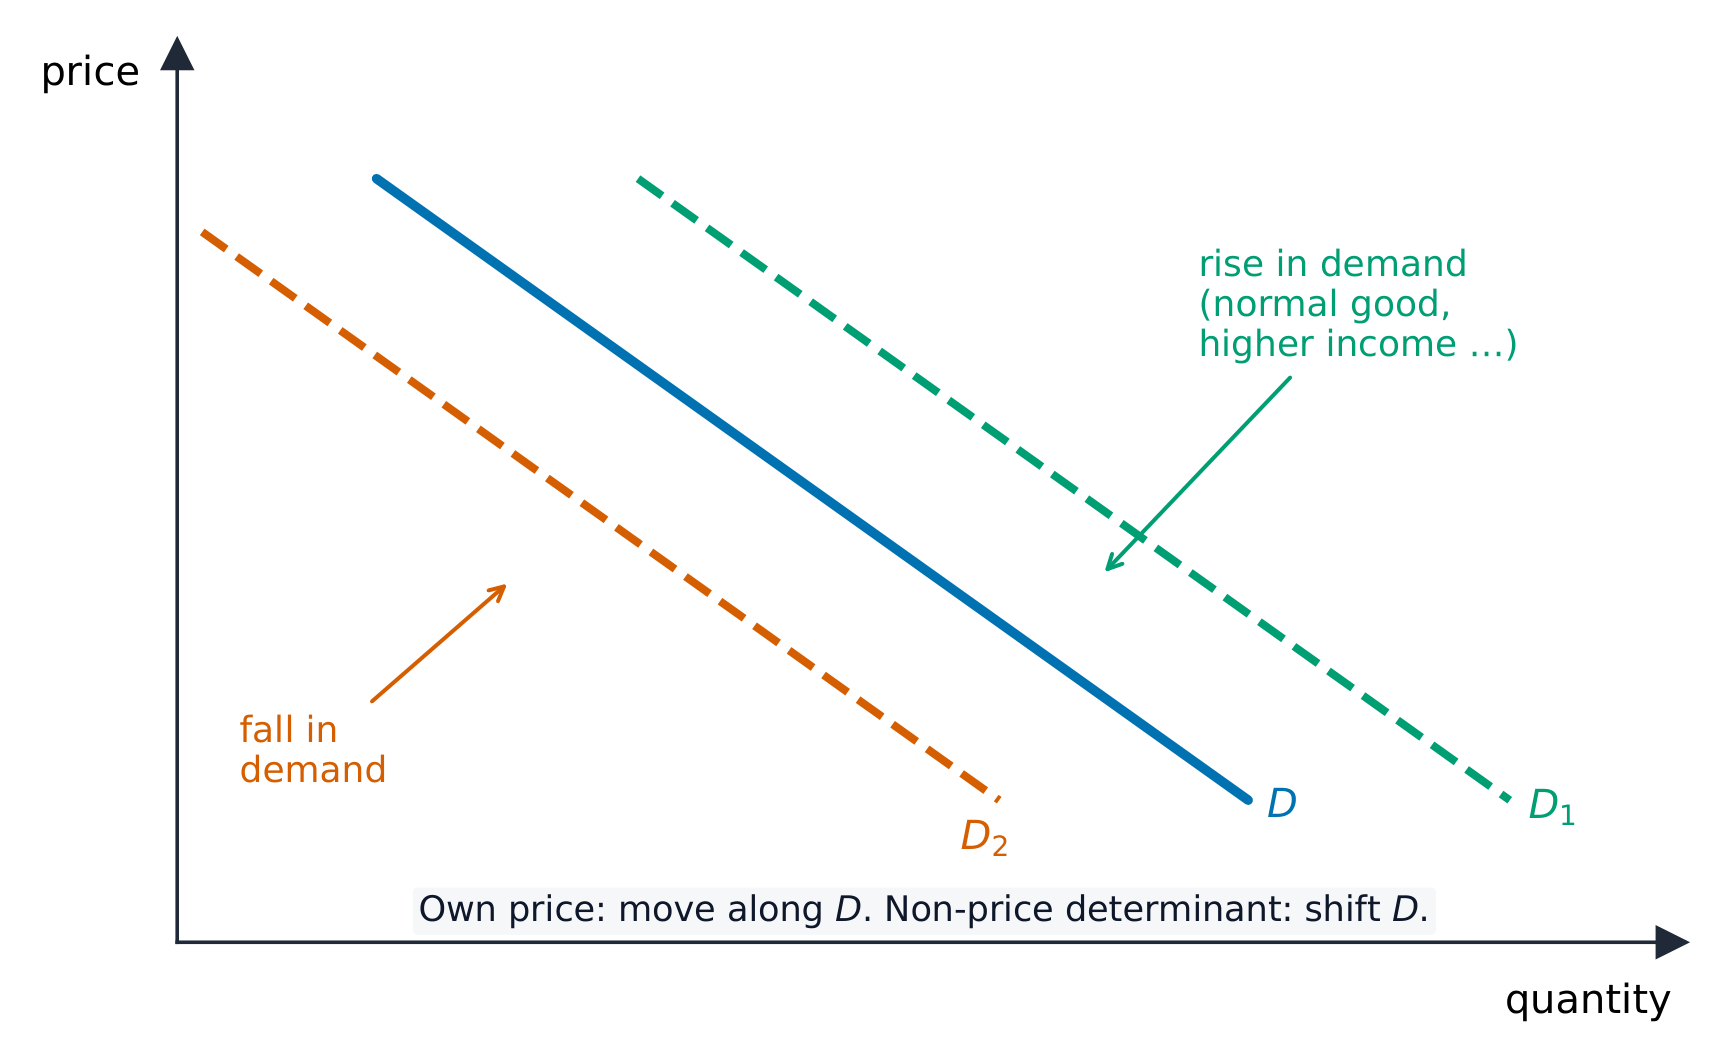
A change in the good's own price is shown as a movement along the demand curve. A change in a non-price determinant shifts the whole curve to a new position — this is a shift 移动 of demand. The main causes (the determinants 决定因素) are:
- income 收入 — for most goods, higher income raises demand.
- the price of a substitute 替代品 — a good you can use instead (tea for coffee). If the substitute's price rises, demand for this good rises.
- the price of a complement 互补品 — a good used together with this one (cars and petrol). If the complement's price rises, demand for this good falls.
- tastes and fashion, the size of the population, and advertising.
Apply movement versus shift. Consider three separate coffee-market events. (1) Coffee price falls from $\$7$ to $\$6$, all other conditions fixed: quantity demanded rises along the original curve. (2) Tea becomes dearer: coffee demand shifts right if tea is a substitute. (3) Income rises, but no income relationship is given: the direction needs a normal/inferior-good assumption. Draw the relevant change before reading each explanation.
Individual and market demand
One consumer 消费者 has an individual demand. The market demand 市场需求 is found by adding up the quantity that all consumers want at each price (adding the curves sideways).
Marginal utility and demand
utility 效用 is the satisfaction you get from consuming a good. marginal utility 边际效用 is the extra utility from one more unit.
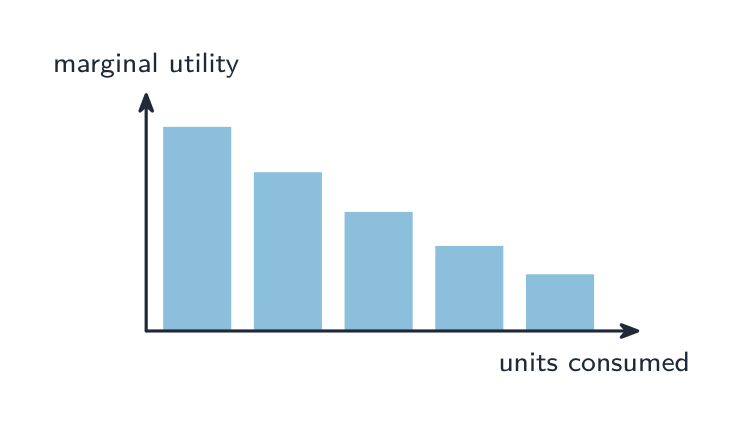
The law of diminishing marginal utility 边际效用递减 says each extra unit gives less extra satisfaction than the one before. This can help explain lower willingness to pay in a simple model, but it is not by itself a general proof of downward-sloping demand. Full utility analysis is an A-Level Topic 7 preview here. For marginal utilities $12,9,6,3$, total utility is $12,21,27,30$: total utility rises while marginal utility stays positive.
Explore
Demand & supply
Demand slopes down — a lower price, more is wanted.
Vocabulary
Train
| English |
|---|
| demand/dɪˈmænd/ |
| price/praɪs/ |
| quantity demanded/ˈkwɒntɪti dɪˈmændɪd/ |
| demand curve/dɪˈmænd kɜːv/ |
| shift/ʃɪft/ |
| determinants/dɪˈtɜːmɪnənts/ |
| income/ˈɪŋkʌm/ |
| substitute/ˈsʌbstɪtjuːt/ |
| complement/ˈkɒmplɪmənt/ |
| consumer/kənˈsuːmə/ |
| market demand/ˈmɑːkɪt dɪˈmænd/ |
| utility/juːˈtɪlɪti/ |
| marginal utility/ˈmɑːdʒɪnl juːˈtɪlɪti/ |
| diminishing marginal utility/dɪˈmɪnɪʃɪŋ ˈmɑːdʒɪnl juːˈtɪlɪti/ |
2.1
Supply
supply 供给 is the quantity of a good that producers 生产者 are willing and able to sell at each price in a period of time.
The law of supply, holding other determinants constant, says: when the price rises, the quantity supplied 供给量 rises. Higher prices can make extra output worthwhile. Total profit 利润 also depends on costs; price alone does not establish it. So the supply curve 供给曲线 slopes upward.
What shifts the supply curve
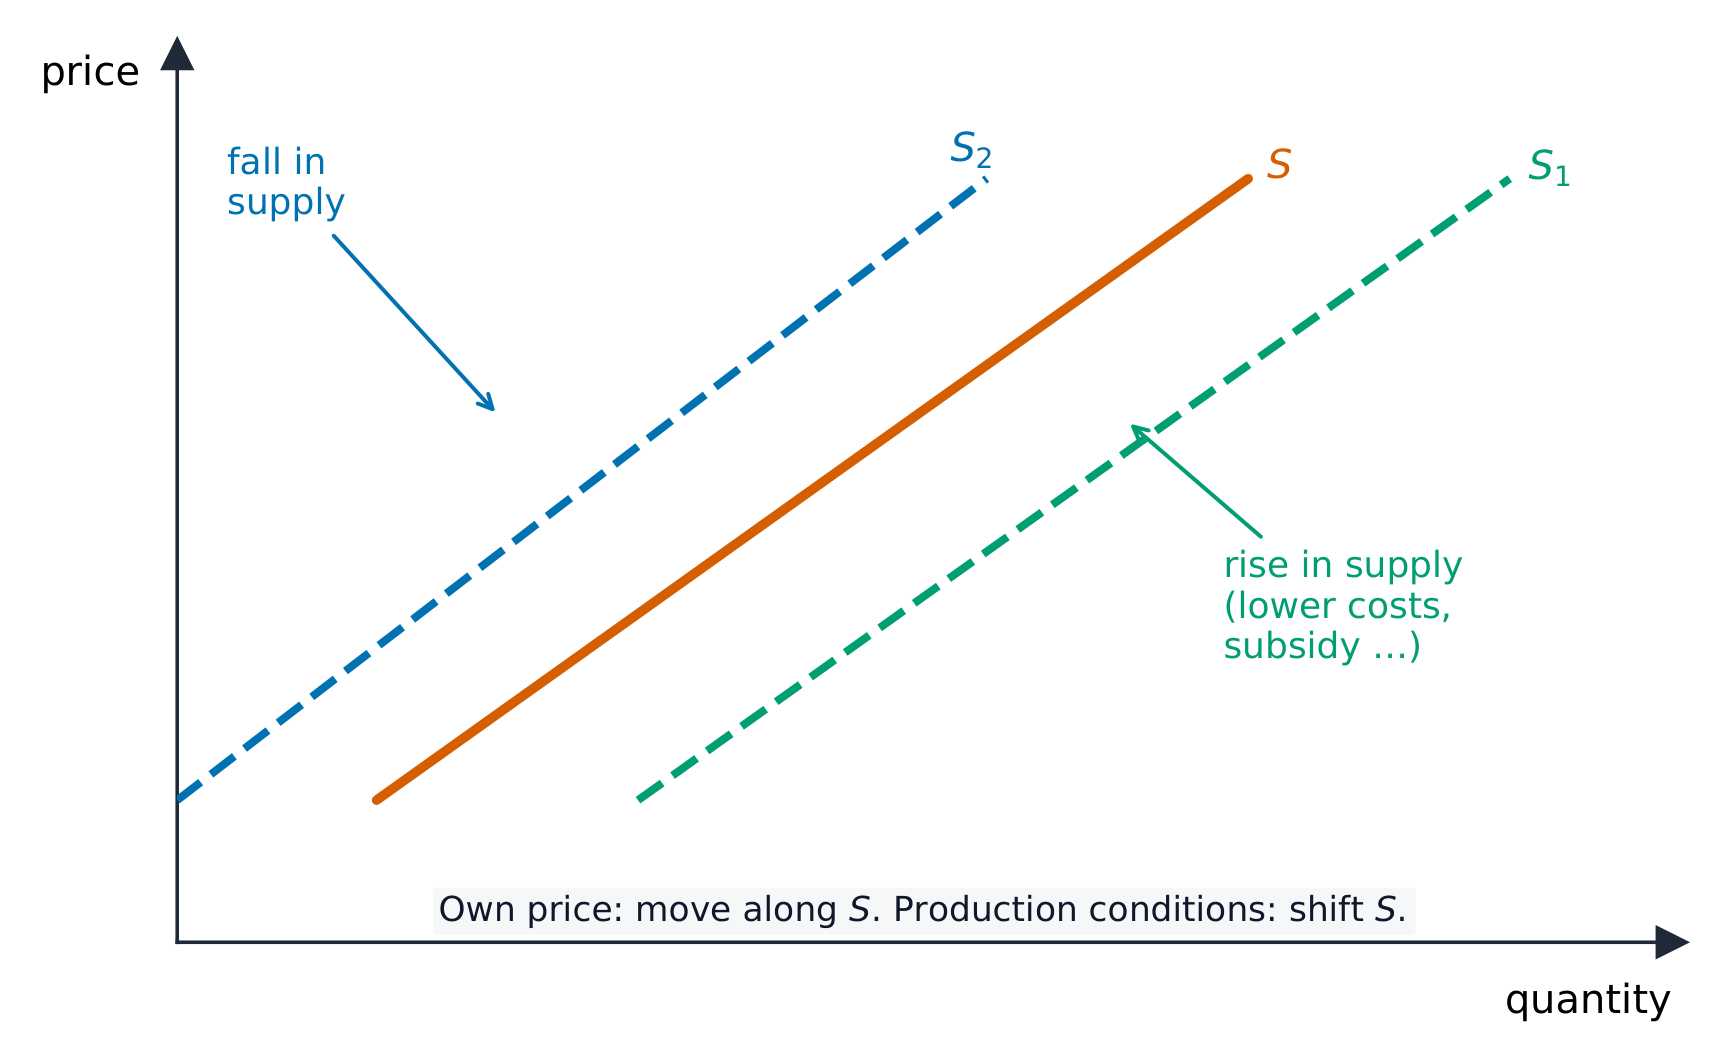
A change in the good's own price is a movement along the supply curve. Other causes shift the whole curve:
- costs of production 生产成本 — if wages, raw materials or rent get dearer, supply falls.
- technology — better machines raise supply.
- a per-unit producer subsidy 补贴 raises supply; a per-unit tax on sellers lowers it.
- the number of firms 企业 in the market, and weather (for farm goods).
Bakery application. A higher bread price, other conditions fixed, raises quantity supplied along the original curve. Cheaper flour or a more efficient oven shifts supply right: more bread can be offered at the same price. A change unrelated to willingness or ability to produce does not automatically shift supply.
Individual and market supply
The market supply 市场供给 is found by adding up the quantity all firms will sell at each price.
Explore
Demand & supply
A demand shift changes equilibrium and moves quantity supplied along the unchanged upward-sloping supply curve.
Explore
Supply shifts and equilibrium
A change in production conditions shifts supply and changes equilibrium. This activity shows a shift, not a measurement of price elasticity of supply.
Vocabulary
Train
| English |
|---|
| supply/səˈplaɪ/ |
| producer/prəˈdjuːsə/ |
| quantity supplied/ˈkwɒntɪti səˈplaɪd/ |
| profit/ˈprɒfɪt/ |
| supply curve/səˈplaɪ kɜːv/ |
| costs of production/kɒsts ɒv prəˈdʌkʃn/ |
| subsidy/ˈsʌbsɪdi/ |
| firm/fɜːm/ |
| market supply/ˈmɑːkɪt səˈplaɪ/ |
2.2
Price elasticity of demand

Syllabus
- define, calculate and interpret price elasticity of demand (PED), income elasticity (YED) and cross elasticity (XED)
- explain the determinants of each and the relationship between PED and total revenue/expenditure
- explain the usefulness of elasticities to firms and government
Source: Cambridge International syllabus
price elasticity of demand 需求价格弹性 (PED) measures how much the quantity demanded responds when the price changes.
$$\text{PED} = \frac{\%\ \text{change in quantity demanded}}{\%\ \text{change in price}}$$
PED is normally negative (because of the law of demand), but we usually look at the size and drop the minus sign.
Worked example. The price of a good rises by 10% and the quantity demanded falls by 25%. Find the PED and classify the demand.
$$\text{PED} = \frac{-25}{10} = -2.5$$
Ignoring the minus sign, $2.5 > 1$, so demand is elastic — quantity responded much more than the price did.
| PED magnitude | Name | Meaning |
|---|---|---|
| more than 1 | elastic 富有弹性 | quantity responds a lot |
| less than 1 | inelastic 缺乏弹性 | quantity responds a little |
| equal to 1 | unit elastic 单位弹性 | quantity changes by the same % as price |
| 0 | perfectly inelastic 完全无弹性 | quantity does not change at all |
| infinity | perfectly elastic 完全有弹性 | horizontal demand at a given price in the idealized model |
What makes demand elastic or inelastic
- the number and closeness of substitutes (more substitutes → more elastic).
- whether the good is a necessity 必需品 or a luxury 奢侈品; these influence responsiveness but do not guarantee a particular own-price coefficient.
- the share of income spent on the good (a large share → more elastic).
- time — more time usually lets buyers find alternatives, making demand more responsive; it does not guarantee elasticity above 1.
- habit or addiction can reduce responsiveness, alongside other determinants.
One straight-line curve. For $Q_d=10-P$, the gradient $\Delta Q_d/\Delta P=-1$ is constant. Point elasticity 点弹性 uses that gradient with the current price and quantity:
$$PED=\frac{\Delta Q_d}{\Delta P}\frac{P}{Q_d}.$$
At $(P,Q)=(8,2)$, $PED=(-1)(8/2)=-4$; at $(5,5)$, it is $-1$; at $(2,8)$, it is $-0.25$. The curve has the same slope but different percentage responsiveness. These are point values, not a claim that a large finite change has the same elasticity. Revenue $TR=PQ$ is $16,25,16$ respectively: the midpoint maximizes revenue on this straight-line curve with positive intercepts. A constant unit-elastic demand curve instead keeps revenue constant throughout its unit-elastic segment.
PED and total revenue
total revenue 总收益 is the money a firm earns: $\text{TR} = \text{price} \times \text{quantity}$. PED tells a firm what happens to revenue when it changes the price:
| If demand is… | price rises | price falls |
|---|---|---|
| inelastic | total revenue rises | total revenue falls |
| elastic | total revenue falls | total revenue rises |
| unit-elastic segment | total revenue stays the same | total revenue stays the same |
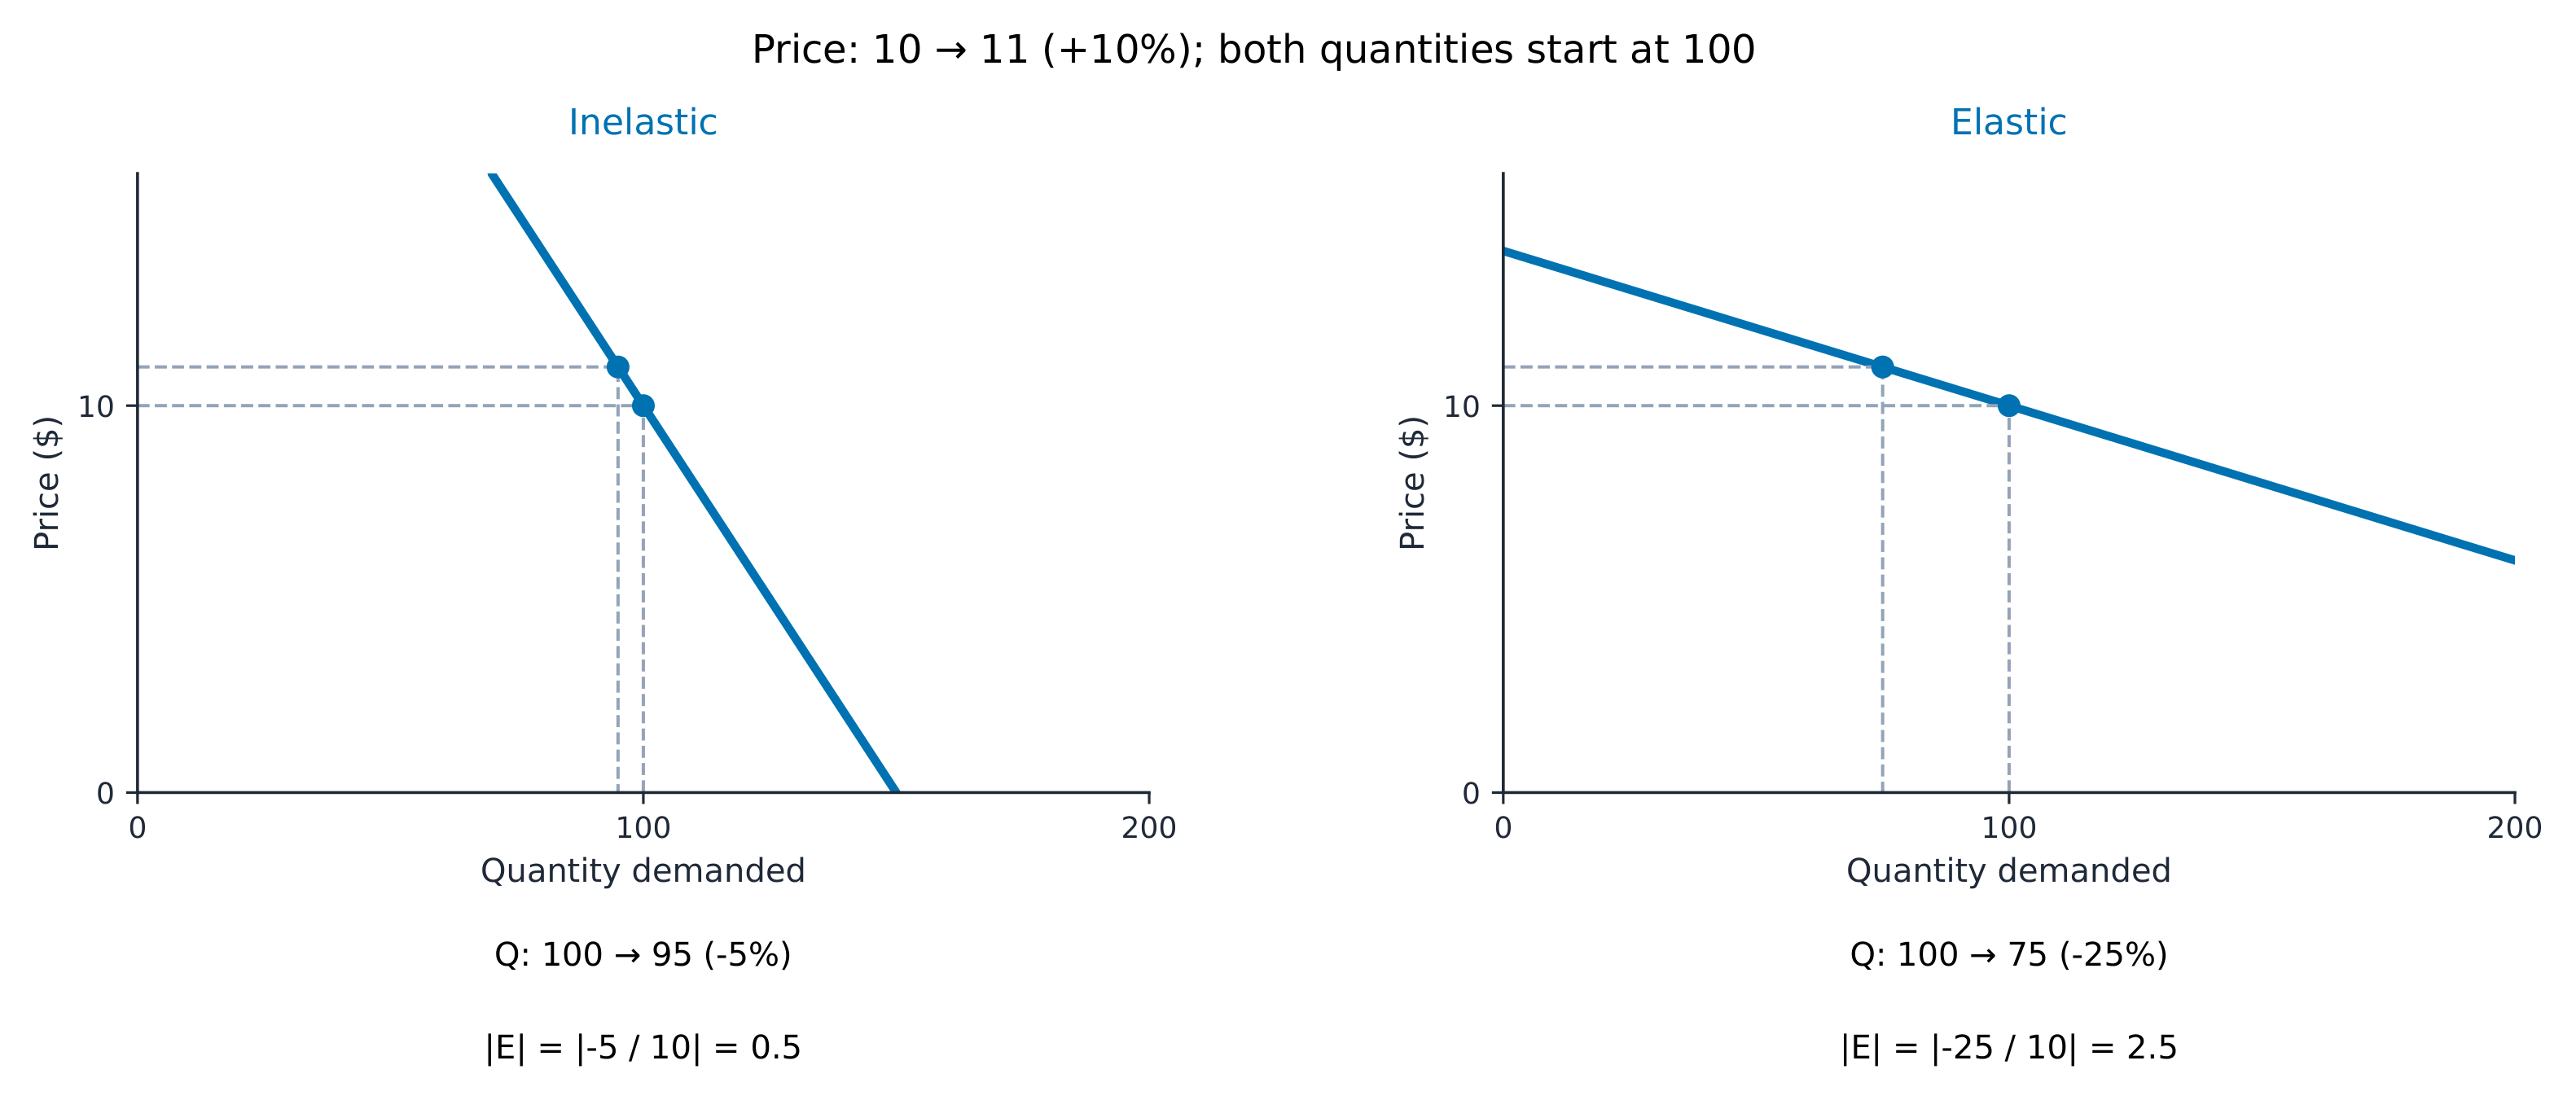
Worked revenue comparison. Both goods start at price $\$10$ and quantity $100$. Price rises to $\$11$ ($+10\%$, using the initial base). Good A sells $95$ ($-5\%$); good B sells $75$ ($-25\%$).
$$PED_A=\frac{-5}{10}=-0.5,\qquad PED_B=\frac{-25}{10}=-2.5.$$
$$TR_0=P_0Q_0=10(100)=\$1000.$$
$$TR_{A,1}=P_1Q_{A,1}=11(95)=\$1045,\qquad TR_{B,1}=11(75)=\$825.$$
Higher revenue does not establish higher profit without cost information. Governments 政府 also use responsiveness when considering taxes, but tax revenue requires the tax per unit and the taxed quantity; PED alone gives neither.
Official application: 9708/21 O/N/25 Q2(a). Explain why a commuter may keep using petrol this week but change transport or car over a year. Then judge whether time is decisive: a remote commuter with no viable alternatives may still be unresponsive later. Use the formula, explain the adjustment mechanism and reach a conditional judgement; do not just list determinants.
Vocabulary
Train
| English |
|---|
| price elasticity of demand/praɪs ɪlæˈstɪsɪti ɒv dɪˈmænd/ |
| elastic/ɪˈlæstɪk/ |
| inelastic/ɪnɪˈlæstɪk/ |
| unit elastic/ˈjuːnɪt ɪˈlæstɪk/ |
| perfectly inelastic/ˈpɜːfektlɪ ɪnɪˈlæstɪk/ |
| perfectly elastic/ˈpɜːfektlɪ ɪˈlæstɪk/ |
| necessity/nəˈsesɪti/ |
| luxury/ˈlʌkʃəri/ |
| total revenue/ˈtəʊtl ˈrevənjuː/ |
| government/ˈɡʌvənmənt/ |
| point elasticity/pɔɪnt ɪlæˈstɪsɪti/ |
2.2
Income elasticity of demand

income elasticity of demand 需求收入弹性 (YED) measures how much demand responds when income changes.
$$\text{YED} = \frac{\%\ \text{change in quantity demanded}}{\%\ \text{change in income}}$$
- a normal good 正常品 has positive YED: demand rises as income rises. Necessities have YED between 0 and 1; luxuries have YED above 1.
- an inferior good 低档品 has negative YED: demand falls as income rises (people switch to better goods). Cheap instant noodles may be inferior for some consumers over a particular income range; the label is not a judgement about quality.
Worked example. A person's income rises by 20% and their demand for restaurant meals rises by 30%. Find the YED and classify the good.
$$\text{YED} = \frac{+30}{+20} = +1.5$$
YED is positive and greater than 1, so restaurant meals are a normal good — and a luxury.
YED helps firms plan for income changes. The nature of the good, income level and whether alternatives are available can affect its value; the estimate need not remain fixed as conditions change.
Vocabulary
Train
| English |
|---|
| income elasticity of demand/ˈɪŋkʌm ɪlæˈstɪsɪti ɒv dɪˈmænd/ |
| normal good/ˈnɔːml ɡʊd/ |
| inferior good/ɪnˈfɪərɪə ɡʊd/ |
2.2
Cross elasticity of demand

cross elasticity of demand 需求交叉弹性 (XED) measures how much demand for one good responds when the price of another good changes.
$$\text{XED} = \frac{\%\ \text{change in quantity demanded of A}}{\%\ \text{change in price of B}}$$
- for substitutes, XED is positive (the price of B rises, so people buy more A).
- for complements, XED is negative (the price of B rises, so people buy less A and less B).
- for goods that are not related, XED is about zero.
Worked example. When the price of tea rises by 10%, the quantity of coffee demanded rises by 4%. Find the XED and say how the two goods are related.
$$\text{XED} = \frac{+4}{+10} = +0.4$$
XED is positive, so tea and coffee are substitutes.
XED depends on the closeness of substitutes or strength of complementary use, and on the market definition. A positive value predicts that a rival price cut reduces this good's demand, other determinants fixed.
Complement practice. Printer price rises $10\%$ and ink quantity demanded falls $6\%$: $XED_{ink,printer}=\frac{-6}{10}=-0.6$. The negative sign supports complementary use. It says nothing about whether ink is an inferior good; that needs an income change.
Decision practice for 9708/21 O/N/25 Q2(b). A fictional restaurant has YED $=1.5$ and XED with a close rival $=0.8$. In separate scenarios, income rises $2\%$ or the rival cuts price $10\%$.
$$\%\Delta Q=YED(\%\Delta Y)=1.5(2)=+3\%.$$
$$\%\Delta Q=XED(\%\Delta P_B)=0.8(-10)=-8\%.$$
YED matters for income forecasts; XED matters for rival-price changes. Use the expected changes and business decision to judge which is more useful. These are estimates holding other determinants fixed, not guaranteed exact forecasts or an unconditional ranking of the two measures.
Vocabulary
Train
| English |
|---|
| cross elasticity of demand/krɒs ɪlæˈstɪsɪti ɒv dɪˈmænd/ |
2.3
Price elasticity of supply
Syllabus
- define, calculate and interpret price elasticity of supply (PES)
- explain the determinants of PES, including time period (momentary, short run, long run)
Source: Cambridge International syllabus
price elasticity of supply 供给价格弹性 (PES) measures how much the quantity supplied responds when the price changes.
$$\text{PES} = \frac{\%\ \text{change in quantity supplied}}{\%\ \text{change in price}}$$
PES is nonnegative for an upward-sloping or vertical supply curve. A value above 1 is elastic; below 1 is inelastic. Compare percentage changes, not slope alone.
Compare two firms
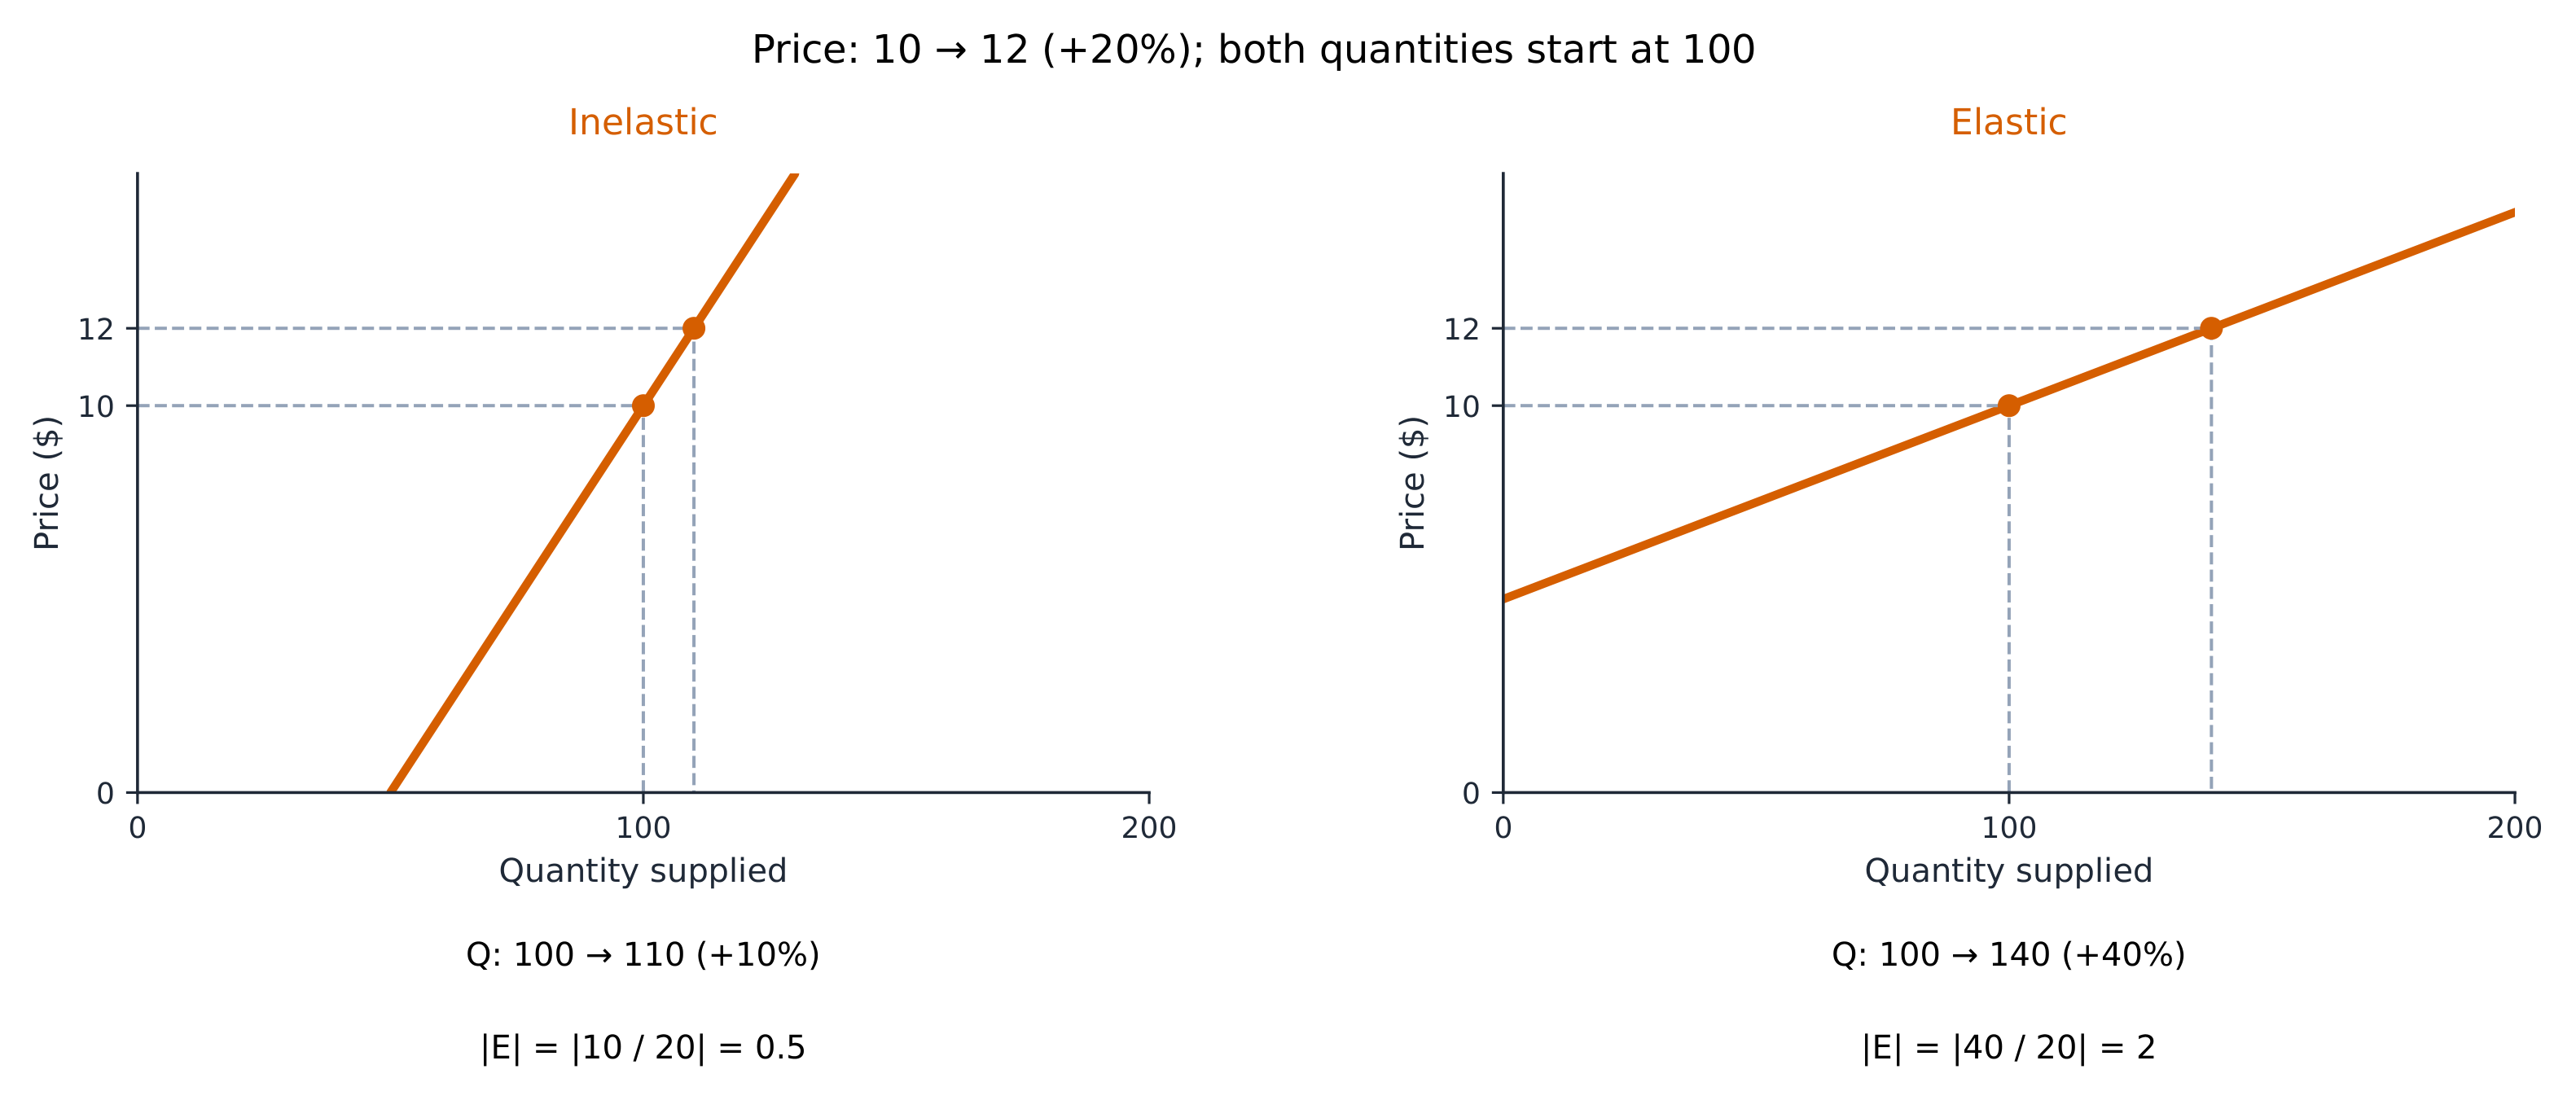
Both start at price $10$, quantity $100$. Price rises to $12$ ($+20\%$). A supplies $110$ ($+10\%$); B supplies $140$ ($+40\%$). Percentages use the initial values.
$$PES_A=\frac{\%\Delta Q_s}{\%\Delta P}=\frac{10}{20}=0.5,\qquad PES_B=\frac{40}{20}=2.$$
Firm A is inelastic and firm B elastic. The diagram uses the same initial values and scales; visual steepness alone cannot classify arbitrary supply curves.
What makes supply more elastic:
- spare capacity 闲置产能 — unused machines and workers, so firms can quickly make more.
- stocks 库存 — goods stored in a warehouse that can be sold fast.
- how easily factors of production can move into the industry.
- time. Economists split time into three periods:
- the momentary 瞬时 period — supply is fixed; PES is zero.
- the short run 短期 — at least one factor is fixed; spare capacity and stocks may still allow a substantial response.
- the long run 长期 — all factors can change, usually allowing more adjustment. This does not guarantee PES above 1.
Policy application: 9708/02/SP/23 Q3(b)
Refrigeration can preserve saleable stocks; training can ease skill constraints. Neither necessarily makes all agricultural supply elastic: perishability, costs and biological growing time differ. Explain the constraint removed, a limitation, then a product-specific judgement. A supply shift after a subsidy is not by itself evidence that PES has increased.
Vocabulary
Train
| English |
|---|
| price elasticity of supply/praɪs ɪlæˈstɪsɪti ɒv səˈplaɪ/ |
| spare capacity/speə kəˈpæsɪti/ |
| stocks/stɒks/ |
| momentary/ˈməʊməntəri/ |
| short run/ʃɔːt rʌn/ |
| long run/lɒŋ rʌn/ |
2.4
The interaction of demand and supply

Syllabus
- explain equilibrium price and quantity and how shifts in demand and supply change equilibrium
- explain disequilibrium (excess demand and excess supply) and the functions of the price mechanism
- apply demand and supply analysis to product, factor and foreign exchange markets
Source: Cambridge International syllabus
Compare the quantities demanded and supplied at the same price.
Equilibrium
The market is in equilibrium 均衡 where the demand curve crosses the supply curve. Here quantity demanded equals quantity supplied at the same price. This gives the equilibrium price 均衡价格 and the equilibrium quantity 均衡数量. There is no pressure for the price to change.
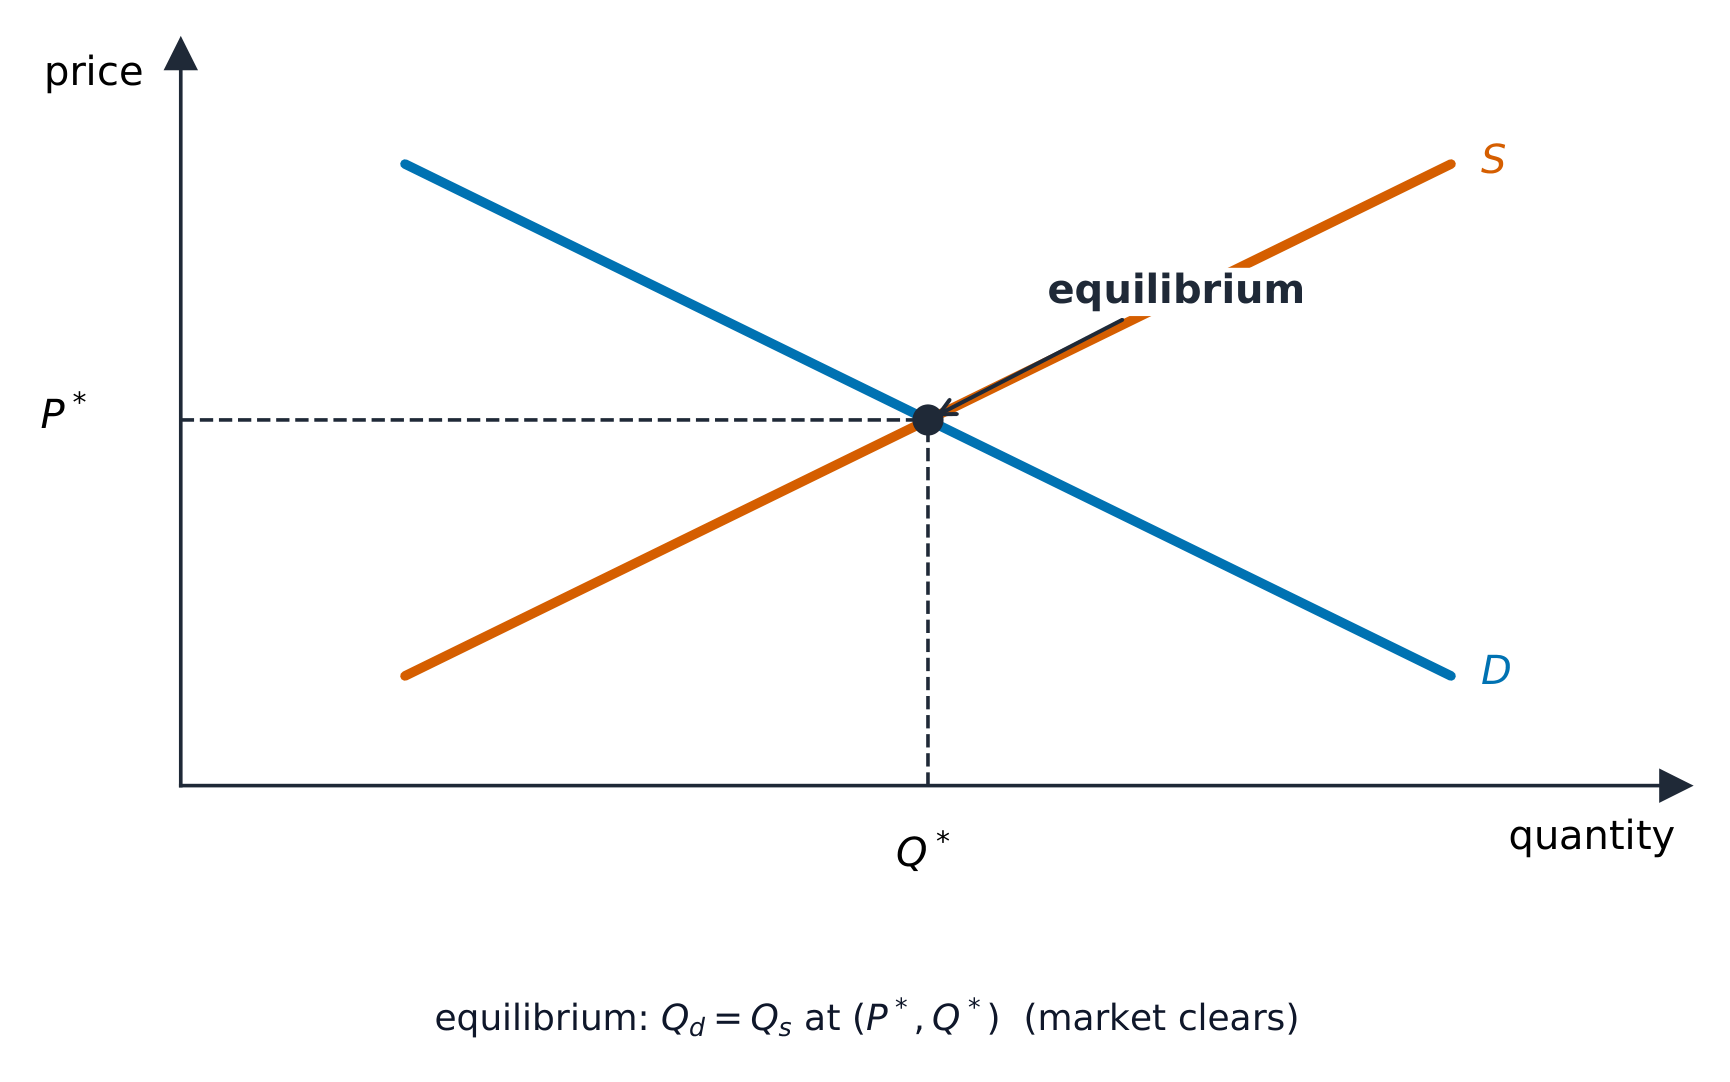
Worked market. Let $Q_d=12-P$ and $Q_s=P-2$. At prices $4,6,7,8$, the corresponding demand quantities are $8,6,5,4$ and supply quantities $2,4,5,6$. Solve the equality:
$$Q_d=Q_s,\qquad12-P=P-2,\qquad P^*=\$7,\quad Q^*=5.$$
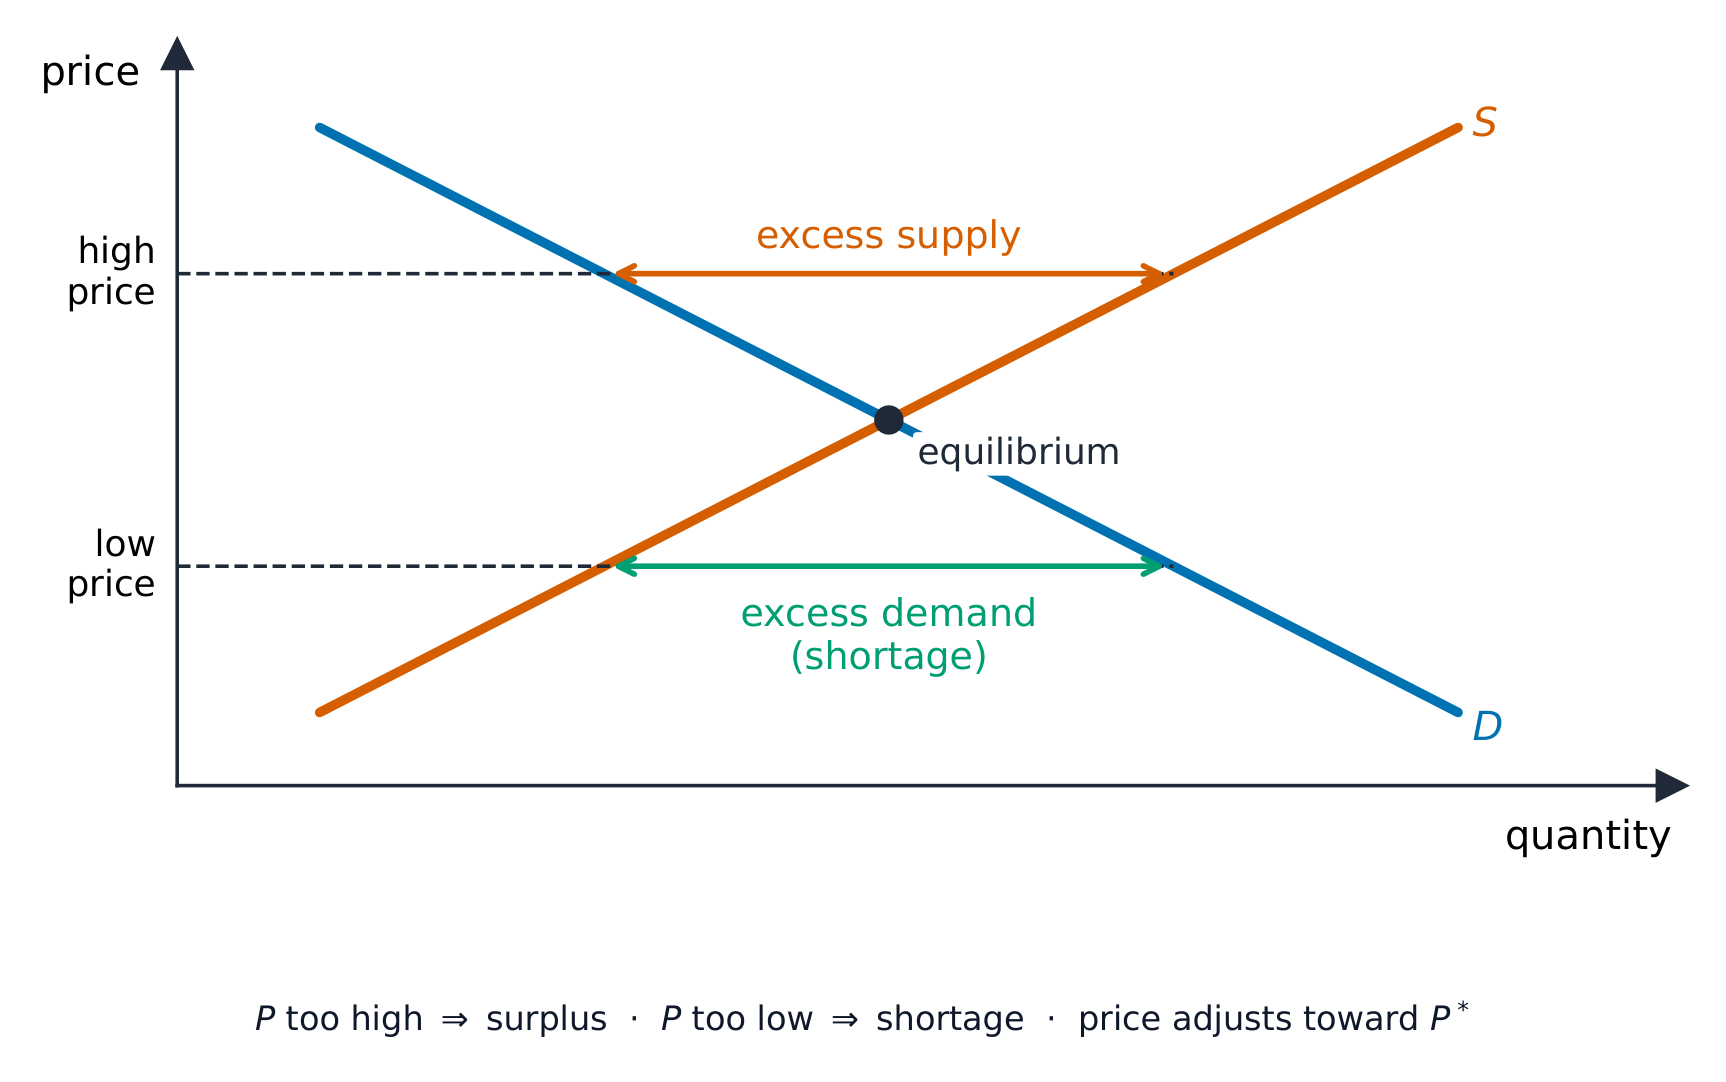
At $\$6$, excess demand is $6-4=2$ units; at $\$8$, excess supply is $6-4=2$ units. A shortage provides signalling 信号传递 of unmet demand. A higher price performs rationing 配给 through willingness and ability to pay and gives suppliers an incentive 激励 to offer more, other costs unchanged.
Disequilibrium
When the price is not at equilibrium, the market is in disequilibrium 非均衡:
- if the price is too low, there is excess demand 超额需求 (a shortage 短缺). Buyers compete, so the price is pushed up.
- if the price is too high, there is excess supply 超额供给. Sellers cannot sell everything, so the price is pushed down.
With other conditions unchanged and prices free to adjust, these imbalances create pressure towards equilibrium. Contracts, controls or new shocks can interrupt the path. This shows the price mechanism doing its jobs of signalling, rationing and giving an incentive.
How shifts change the equilibrium
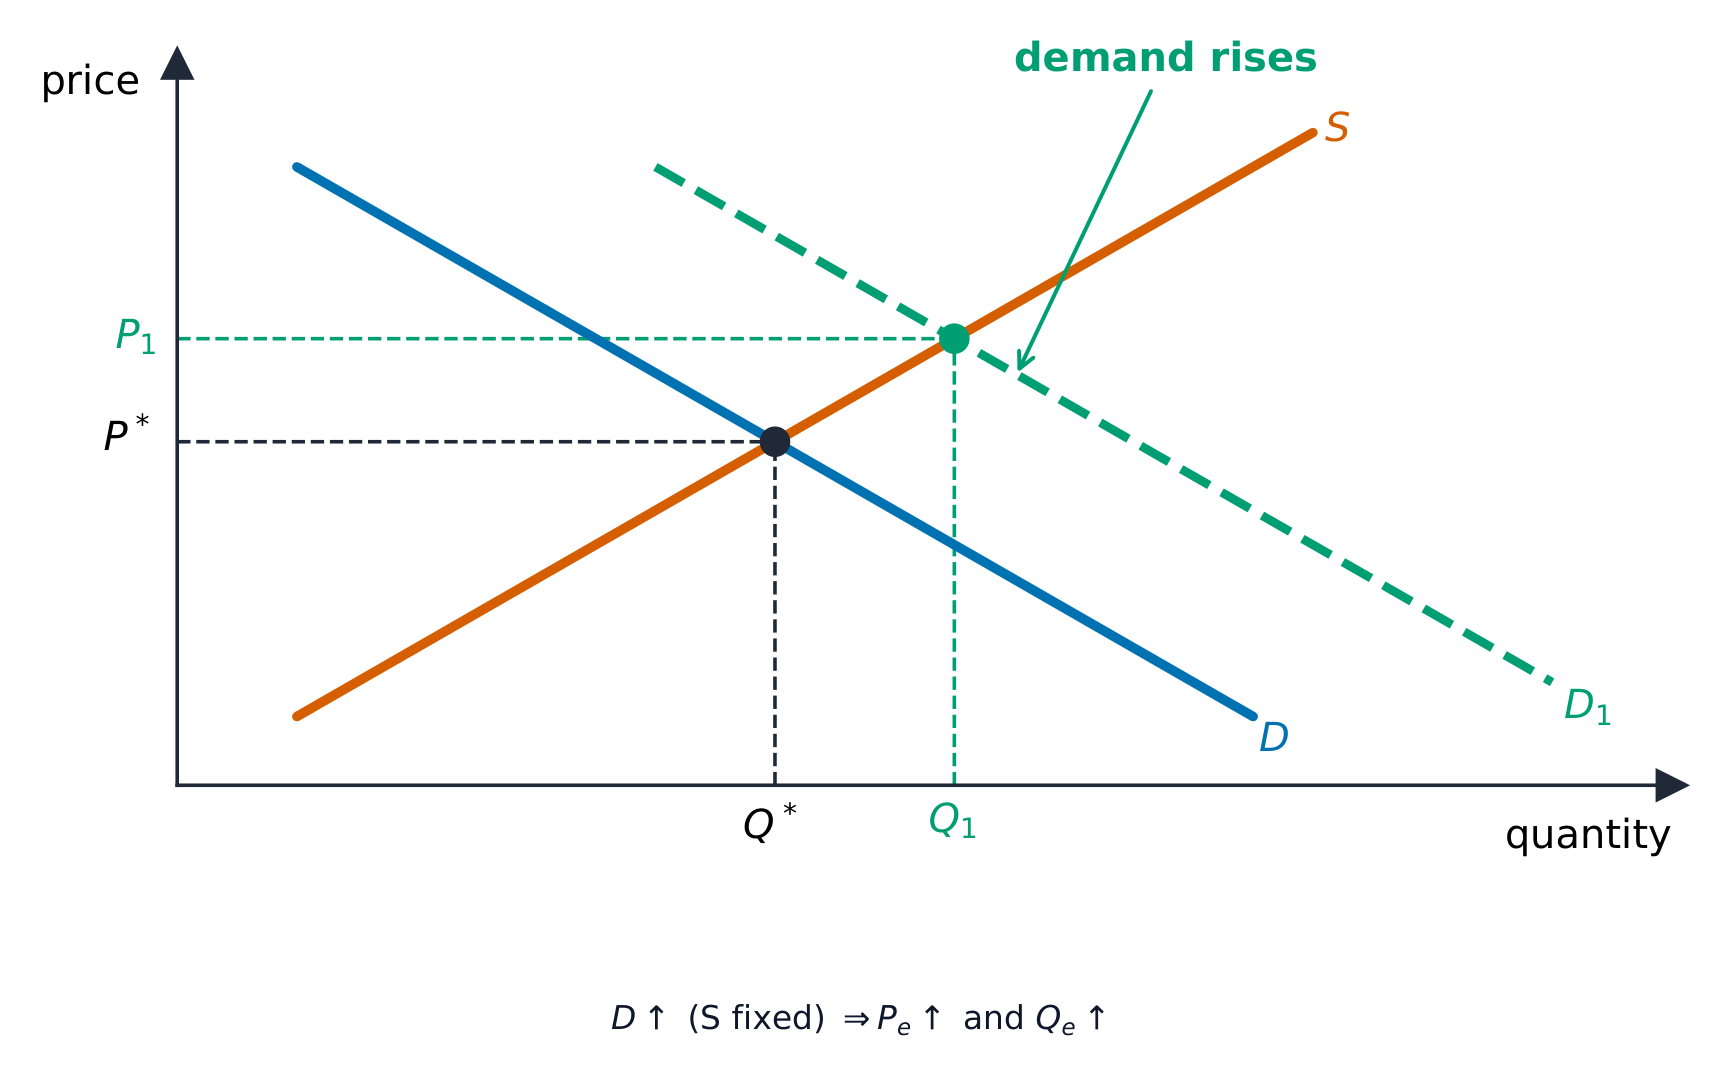
| Change | Effect on price | Effect on quantity |
|---|---|---|
| demand rises (shifts right) | rises | rises |
| demand falls (shifts left) | falls | falls |
| supply rises (shifts right) | falls | rises |
| supply falls (shifts left) | rises | falls |
Demand and supply in different markets
The same analysis works in many markets:
- in product markets 产品市场, demand and supply set the price of goods and services.
- in factor markets 要素市场, they set the price of factors — for example, the demand for and supply of labour set the wage 工资.
- in a floating foreign exchange market 外汇市场, the demand for and supply of a currency set the exchange rate 汇率 (the price of one currency in terms of another).
Relationships between markets
- Joint demand 共同需求: printers and ink are complements; more printer use can increase ink demand.
- Alternative demand 替代需求: substitutes such as tea and coffee; dearer tea can increase coffee demand.
- Derived demand 派生需求: bread demand creates demand for bakers' labor.
- Joint supply 联合供给: beef production also produces hides; more beef output can increase leather supply.
Identify the market and relevant determinant before drawing its curve.
Explore
Demand & supply
Where demand meets supply sets the equilibrium price and quantity.
Explore
Finding the equilibrium price
Shift demand or supply and watch the equilibrium price and quantity move to where the two lines cross.
Vocabulary
Train
| English |
|---|
| equilibrium/ˌiːkwɪˈlɪbrɪəm/ |
| equilibrium price/ˌiːkwɪˈlɪbrɪəm praɪs/ |
| equilibrium quantity/ˌiːkwɪˈlɪbrɪəm ˈkwɒntɪti/ |
| disequilibrium/ˌdɪˌsiːkwɪˈlɪbrɪəm/ |
| excess demand/ekˈses dɪˈmænd/ |
| shortage/ˈʃɔːtɪdʒ/ |
| excess supply/ekˈses səˈplaɪ/ |
| product market/ˈprɒdʌkt ˈmɑːkɪt/ |
| factor market/ˈfæktə ˈmɑːkɪt/ |
| wage/weɪdʒ/ |
| foreign exchange market/ˈfɒrən eksˈtʃeɪndʒ ˈmɑːkɪt/ |
| exchange rate/eksˈtʃeɪndʒ reɪt/ |
| joint demand/dʒɔɪnt dɪˈmænd/ |
| alternative demand/ɔːlˈtɜːnətɪv dɪˈmænd/ |
| derived demand/dɪˈraɪvd dɪˈmænd/ |
| joint supply/dʒɔɪnt səˈplaɪ/ |
| signalling/ˈsɪɡnəlɪŋ/ |
| rationing/ˈræʃənɪŋ/ |
| incentive/ɪnˈsentɪv/ |
2.5
Consumer and producer surplus
Syllabus
- define and identify consumer surplus and producer surplus on a diagram
- explain how changes in demand, supply and price affect consumer and producer surplus
Source: Cambridge International syllabus
consumer surplus 消费者剩余 is the gain to buyers. It is the difference between the most a consumer was willing to pay and the price actually paid. On a diagram it is the area below the demand curve and above the price line.
producer surplus 生产者剩余 is the gain to sellers. It is the difference between the price a producer receives and the lowest price the producer would have accepted. On a diagram it is the area above the supply curve and below the price line.
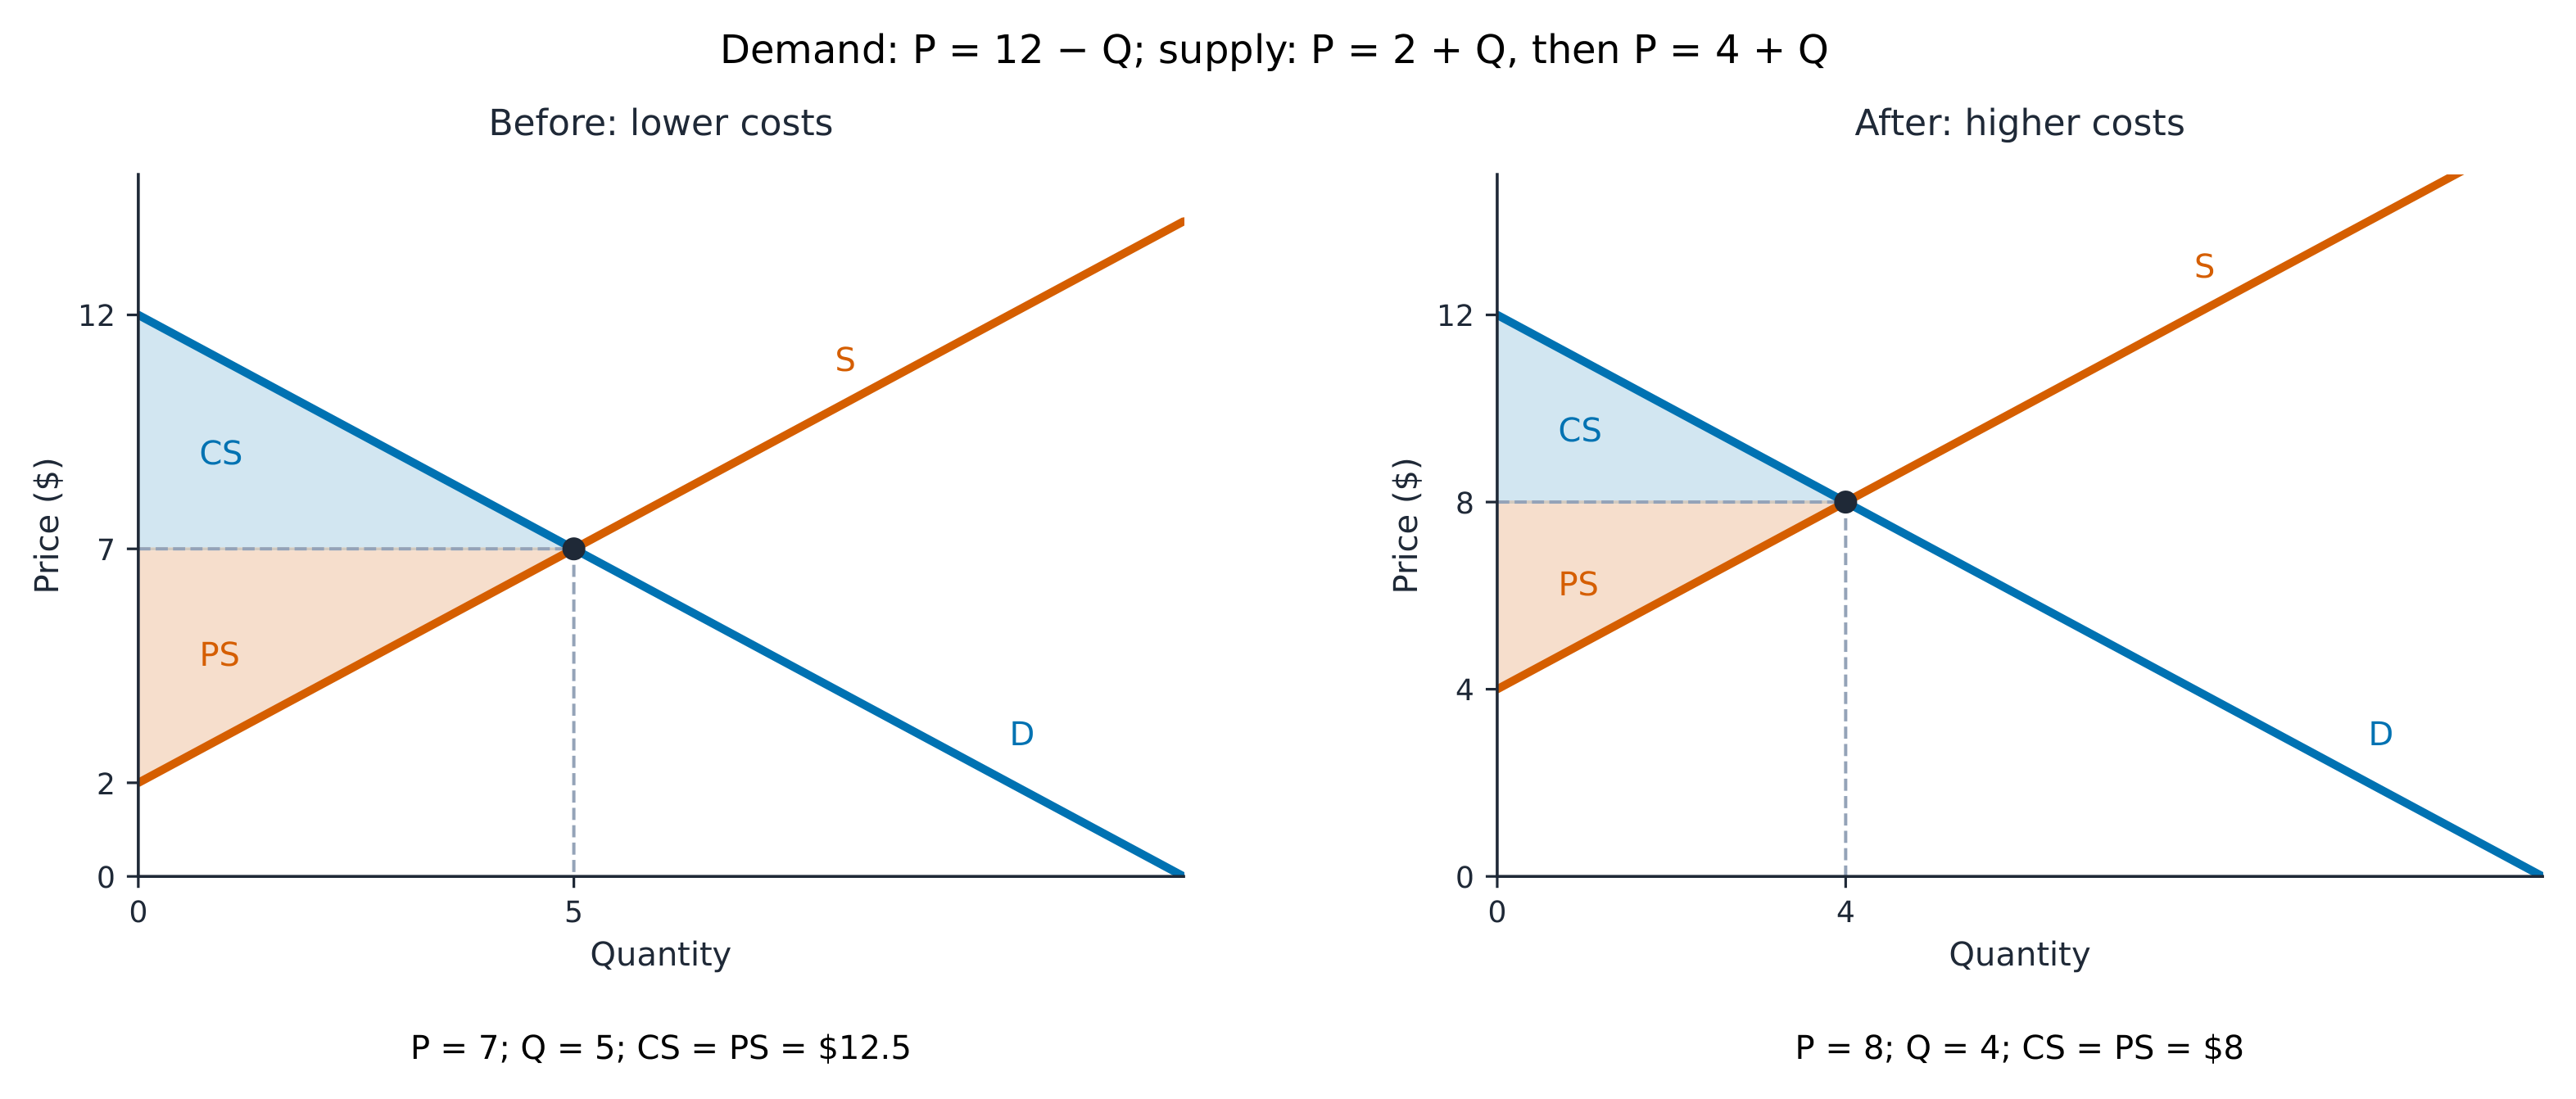
Worked surplus and cost change. Use the same fictional competitive market: inverse demand $P_D=12-Q$ and inverse supply $P_S=2+Q$. Equilibrium is $Q=5$, $P=\$7$.
$$CS=\tfrac12Q(P_{D,0}-P)=\tfrac12(5)(12-7)=\$12.50.$$
$$PS=\tfrac12Q(P-P_{S,0})=\tfrac12(5)(7-2)=\$12.50.$$
$$TS=CS+PS=\$25.$$
For 9708/22 O/N/25 Q2(a), consider the claim that producers always gain when a cost increase raises price. These are illustrative numbers, not data from that paper. Higher input costs shift supply to $P_{S,1}=4+Q$:
$$P_D=P_{S,1},\qquad12-Q=4+Q,\qquad Q_1=4,\quad P_1=\$8.$$
$$PS_1=\tfrac12Q_1(P_1-4)=\tfrac12(4)(8-4)=\$8.$$
$$CS_1=\tfrac12Q_1(12-P_1)=\tfrac12(4)(12-8)=\$8.$$
$$TR_0=P_0Q_0=7(5)=\$35,\qquad TR_1=P_1Q_1=8(4)=\$32.$$
Price rises, but producer surplus and revenue fall in this example. The new equilibrium can still be efficient: lower total surplus reflects the higher real production costs, not automatically deadweight loss. Judge the outcome using the new cost curve, quantity and demand/supply responsiveness. Producer surplus is not automatically total profit because fixed costs also matter.
A demand increase raises equilibrium price and quantity with supply fixed, but do not infer consumer surplus from price alone: both the demand curve and price have changed. A supply increase raises consumer surplus with demand fixed; producer surplus depends on the new curve and outcome. If a price is imposed away from equilibrium, specify the quantity actually traded and any rationing before measuring areas.
Consumer surplus plus producer surplus is total market welfare 福利 in this simple model. Competitive equilibrium maximizes it when private costs and benefits reflect social costs and benefits and there are no market failures. This is a conditional benchmark, not a claim about every real market.
Explore
Demand & supply
Consumer surplus is below demand and above price; producer surplus is above supply and below price. Reassess the areas after a curve shifts.
Vocabulary
Train
| English |
|---|
| consumer surplus/kənˈsuːmə ˈsɜːpləs/ |
| producer surplus/prəˈdjuːsə ˈsɜːpləs/ |
| welfare/ˈwelfeə/ |
2.5
Exam tips
- Quote the elasticity formula and interpret the value: PED magnitude inelastic ($<1$), elastic ($>1$); link PED to total revenue.
- Distinguish a movement along (a price change) from a shift (a non-price factor) of demand or supply.
- Use the sign of XED (substitutes $+$, complements $-$) and YED (normal $+$, inferior $-$).
- On a diagram, label consumer and producer surplus and show how a price change alters each.
Interactive lessons on this topic
Work through it step by step, with instant-check exercises.