Skip to content · ⁨ข้ามไปยังเนื้อหา⁩

Populations · ⁨ประชากร⁩

AP Environmental Science · Topic 3 · ⁨หัวข้อ 3⁩

Video lesson for this topic · ⁨บทเรียนวิดีโอสำหรับหัวข้อนี้⁩ Open the video page · ⁨เปิดหน้าวิดีโอ⁩
7:45

ประชากร

ในปี 1944 กวางเรนเดียร์ 29 ตัวถูกปล่อยลงบนเกาะเล็ก ไม่มีนักล่า และพื้นดินปกคลุมด้วยมอส ภายในยี่สิบปีมี…

English narration · English + 中文 subtitles burned in · ⁨การบรรยายภาษาอังกฤษ · คำบรรยายภาษาอังกฤษ + 中文 ลอยตัวบนภาพ⁩

3.1

Generalist and Specialist Species · ⁨สปีชีส์ทั่วไปและสปีชีส์เฉพาะเจาะจง⁩

Syllabus · ⁨หลักสูตร⁩
English

Enduring Understanding (ERT-3): Populations change over time in reaction to a variety of factors.

Learning Objective ERT-3.A: Identify differences between generalist and specialist species.

  • ERT-3.A.1 Specialist species tend to be advantaged in habitats that remain constant, while generalist species tend to be advantaged in habitats that are changing.
ไทย

ความเข้าใจที่ยั่งยืน (ERT-3): ประชากรมีการเปลี่ยนแปลงไปตามเวลา ตอบสนองต่อปัจจัยต่างๆ หลากหลาย

วัตถุประสงค์การเรียนรู้ ERT-3.A: ระบุความแตกต่างระหว่างสปีชีส์สายพันธุ์ทั่วไปและสปีชีส์เฉพาะทาง

  • ERT-3.A.1 สปีชีส์เฉพาะทางมักได้เปรียบในแหล่งที่อยู่อาศัยที่คงที่ ในขณะที่สปีชีส์สายพันธุ์ทั่วไปมักได้เปรียบในแหล่งที่อยู่อาศัยที่กำลังเปลี่ยนแปลง
Source: College Board AP Course and Exam Description · ⁨แหล่งที่มา: คำอธิบายหลักสูตรและข้อสอบ College Board AP⁩

English

A generalist 广适性物种 can live in many habitats and eat many foods (raccoon, cockroach) – flexible, so it copes well with change. A specialist 狭适性物种 needs specific conditions or foods (panda, koala) – efficient in a stable habitat but very vulnerable if that habitat changes.

ไทย

สปีชีส์ทั่วไป สามารถอยู่ในหลายแหล่งอาศัยและกินอาหารได้หลากหลาย (หมีราคून, แมลงสาด) – ยืดหยุ่น จึงปรับตัวกับการเปลี่ยนแปลงได้ดี สปีชีส์เฉพาะเจาะจง ต้องการสภาวะหรืออาหารเฉพาะ (แพนด้า, โคอาลา) – มีประสิทธิภาพในแหล่งอาศัยที่เสถียรแต่มีความเสี่ยงสูงมากหากแหล่งอาศัยนั้นเปลี่ยนแปลง

3.2

K-Selected and r-Selected Species · ⁨สปีชีส์ K-Selected และ r-Selected⁩

Syllabus · ⁨หลักสูตร⁩
Enduring UnderstandingLearning ObjectiveEssential Knowledge

ERT-3
Populations change over time in reaction to a variety of factors.

ERT-3.B
Identify differences between K- and r-selected species.

  • ERT-3.B.1 K-selected species tend to be large, have few offspring per reproduction event, live in stable environments, expend significant energy for each offspring, mature after many years of extended youth and parental care, have long life spans/life expectancy, and reproduce more than once in their lifetime. Competition for resources in K-selected species' habitats is usually relatively high.
  • ERT-3.B.2 r-selected species tend to be small, have many offspring, expend or invest minimal energy for each offspring, mature early, have short life spans, and may reproduce only once in their lifetime. Competition for resources in r-selected species' habitats is typically relatively low.
  • ERT-3.B.3 Biotic potential refers to the maximum reproductive rate of a population in ideal conditions.
  • ERT-3.B.4 Many species have reproductive strategies that are not uniquely r-selected or K-selected, or they change in different conditions at different times.
  • ERT-3.B.5 K-selected species are typically more adversely affected by invasive species than r-selected species, which are minimally affected by invasive species. Most invasive species are r-selected species.

Source: College Board AP Course and Exam Description · ⁨แหล่งที่มา: คำอธิบายหลักสูตรและข้อสอบ College Board AP⁩

English

Two reproductive strategies:

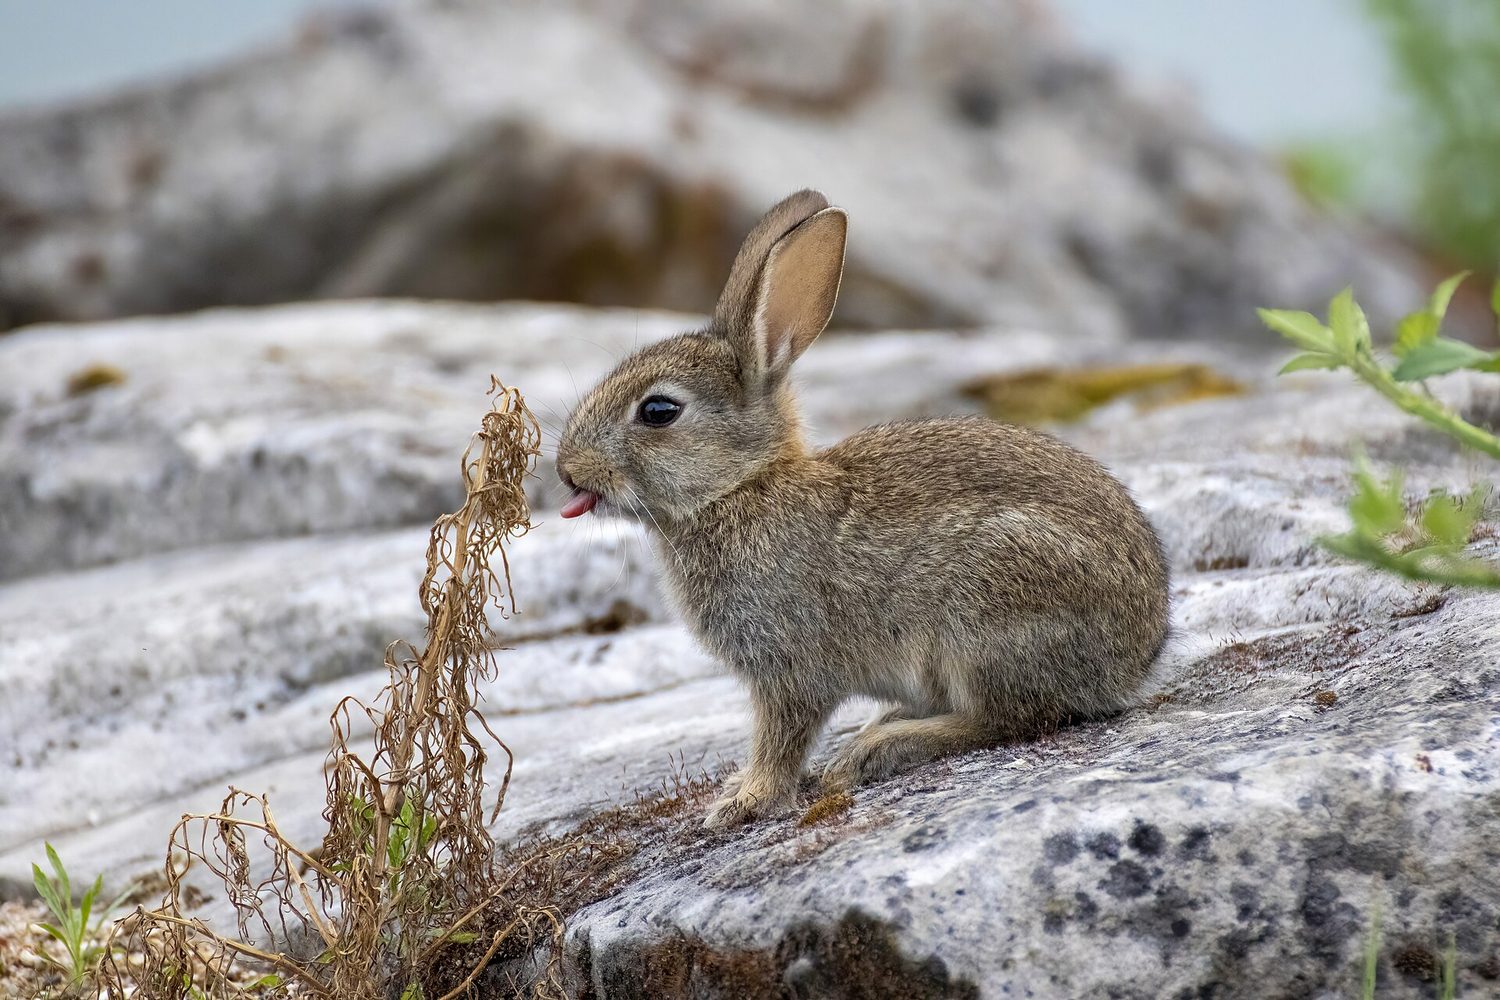
  • $r$-selected species produce many offspring with little care, mature fast, and have short lives (insects, weeds). They colonize quickly and boom-and-bust.
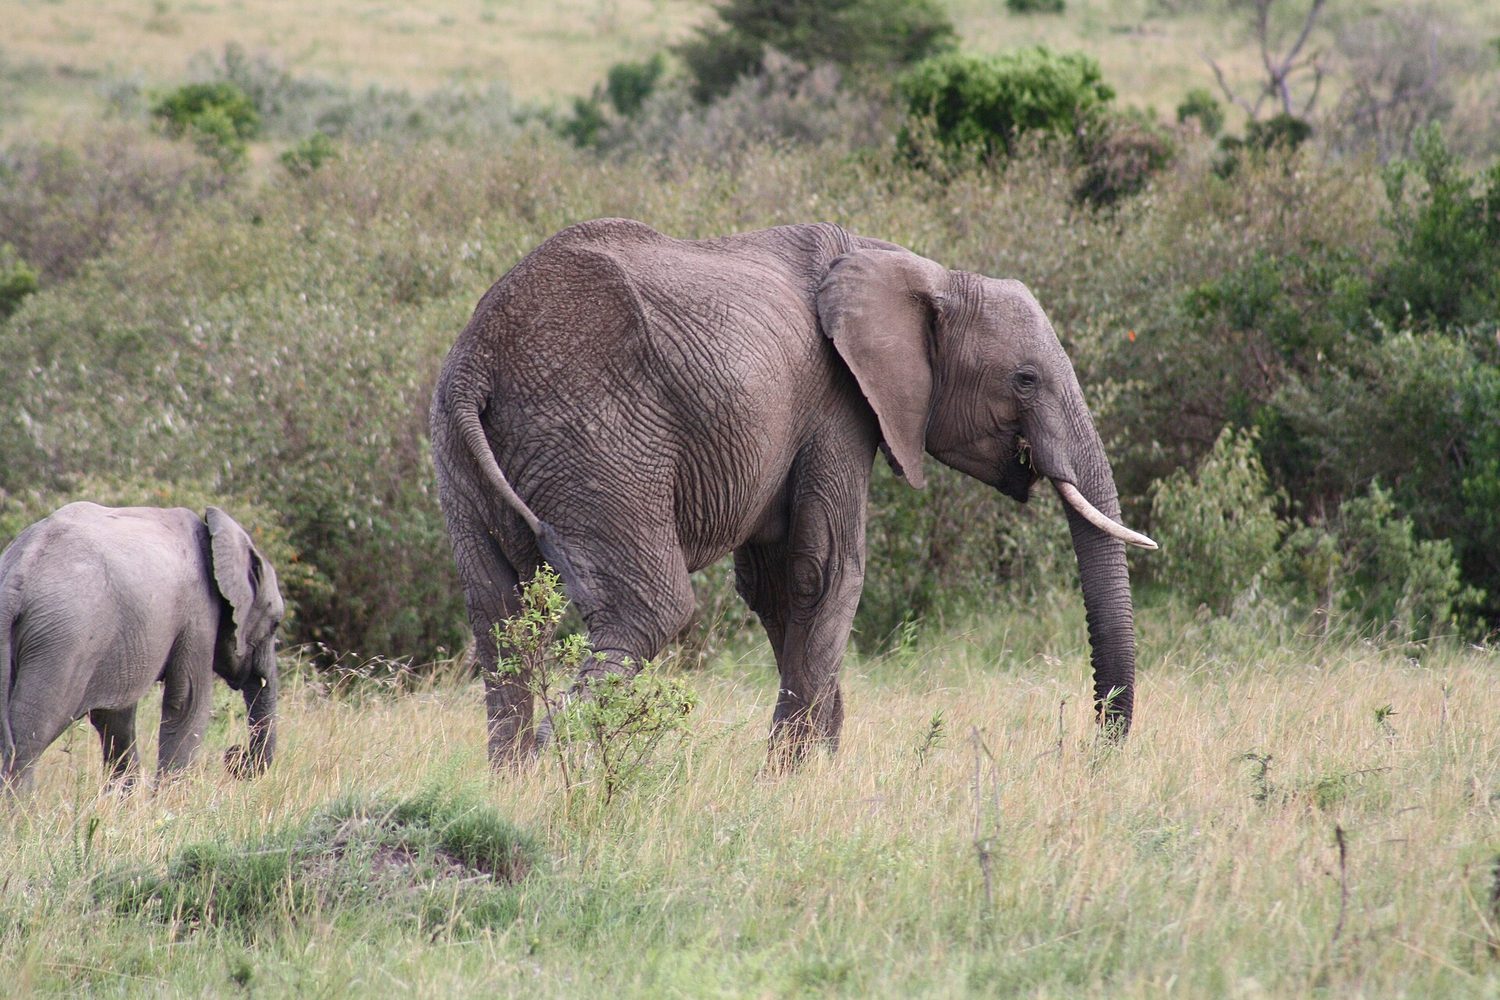
  • $K$-selected species produce few offspring with much care, mature slowly, and live long (elephants, humans). They do well near carrying capacity in stable environments but recover slowly from losses.
ไทย

สองกลยุทธ์การสืบพันธุ์:

  • $r$-selected สปีชีส์ผลิต ลูกหลานจำนวนมาก ด้วยความดูแลน้อย เติบโตเร็ว และมีอายุขัยสั้น (แมลง, ผักบุ้ง) They colonize quickly and boom-and-bust.
  • $K$-selected สปีชีส์ผลิต ลูกหลานจำนวนน้อย ด้วยความดูแลมาก เติบโตช้า และมีอายุยืน (ช้าง, มนุษย์) They do well near carrying capacity in stable environments but recover slowly from losses.
ช้างโตเต็มวัยเดินพร้อมลูกตัวเล็กตัวเดียวข้ามทุ่งหญ้า
ช้างพร้อมลูกตัวเดียว: สปีชีส์ K-selected มีลูกน้อยแต่ลงทุนกับแต่ละตัวมาก จึงฟื้นตัวช้าหากจำนวนลดลง
กระต่ายอ่อน: สปีชีส์ r-selected ผลิตลูกหลานจำนวนมากอย่างรวดเร็วด้วยการดูแลจากพ่อแม่ต่ำ
Vocabulary · ⁨คำศัพท์⁩ Train · ⁨ฝึกฝน⁩
English ไทย
carrying capacity/ˈkæriɪŋ kəˈpæsɪti/ ความจุการรองรับ
exponentially/ˌekspəˈnenʃəli/ แบบเอกซ์โพเนนเชียล
logistic/ləˈdʒɪstɪk/ โลจิสติก
Limiting factors/ˈlɪmɪtɪŋ ˈfæktəz/ ปัจจัยจำกัด (Limiting factors)
age-structure diagram/eɪdʒ ˈstrʌktʃə ˈdaɪəɡræm/ แผนภูมิโครงสร้างอายุ
total fertility rate/ˈtəʊtl fɜːˈtɪlɪti reɪt/ อัตราส่วนการเกิดรวม (total fertility rate)
3.3

Survivorship Curves · ⁨กราฟความรอดชีวิต (Survivorship Curves)⁩

Syllabus · ⁨หลักสูตร⁩
English

Enduring Understanding (ERT-3): Populations change over time in reaction to a variety of factors.

Learning Objective ERT-3.C: Explain survivorship curves.

  • ERT-3.C.1 A survivorship curve is a line that displays the relative survival rates of a cohort—a group of individuals of the same age—in a population, from birth to the maximum age reached by any one cohort member. There are Type I, Type II, and Type III curves.
  • ERT-3.C.2 Survivorship curves differ for K-selected and r-selected species, with K-selected species typically following a Type I or Type II curve and r-selected species following a Type III curve.
ไทย

ความเข้าใจที่ยั่งยืน (ERT-3): ประชากรมีการเปลี่ยนแปลงไปตามเวลา ตอบสนองต่อปัจจัยต่างๆ หลากหลาย

วัตถุประสงค์การเรียนรู้ ERT-3.C: อธิบายกราฟการอยู่รอด

  • ERT-3.C.1 กราฟการอยู่รอดคือเส้นที่แสดงอัตราการอยู่รอดสัมพัทธ์ของกลุ่มตัวอย่าง同一-age cohort - กลุ่มบุคคลที่มีอายุเดียวกัน ในประชากร ตั้งแต่เกิดจนถึงอายุสูงสุดที่สมาชิก cohort ใดคนหนึ่งถึง There are Type I, Type II, and Type III curves.
  • ERT-3.C.2 กราฟการอยู่รอดแตกต่างกันสำหรับสปีชีส์ที่เลือกแบบ K และ r-selected โดยสปีชีส์ที่เลือกแบบ K มักจะปฏิบัติตามกราฟ Type I หรือ Type II และสปีชีส์ที่เลือกแบบ r จะปฏิบัติตามกราฟ Type III

Source: College Board AP Course and Exam Description · ⁨แหล่งที่มา: คำอธิบายหลักสูตรและข้อสอบ College Board AP⁩

English

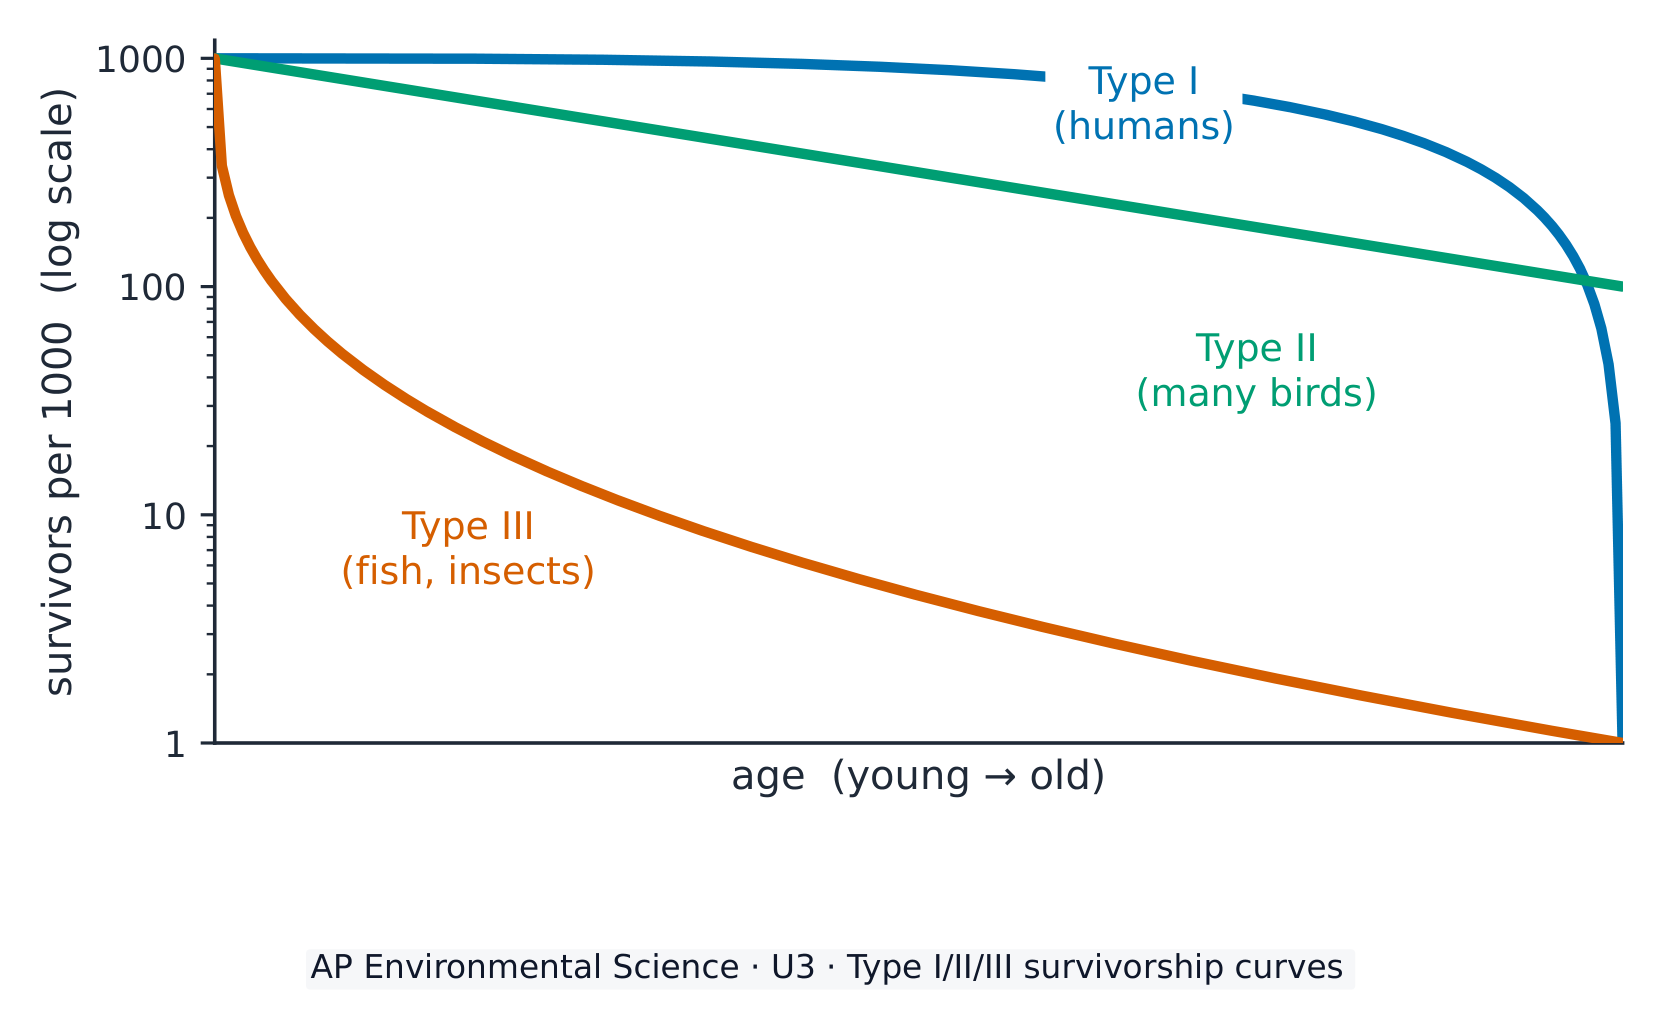
A survivorship curve 存活曲线 plots how many individuals survive at each age (on a log scale). Type I (humans): most survive to old age, then die – a convex curve. Type II (many birds): a constant death rate at all ages – a straight line. Type III ($r$-selected: fish, insects): most die young, a few survive – a concave curve.

ไทย

กราฟความรอดชีวิต แสดงจำนวน Individuals ที่รอดชีวิตในแต่ละช่วงอายุ (บนสเกลลอการิทึม) Type I (มนุษย์): ส่วนใหญ่รอดจนถึงวัยชราแล้วจึงตาย – เป็นโค้งนูน Type II (นกหลายชนิด): อัตราการตายคงที่ทุกช่วงอายุ – เป็นเส้นตรง Type III ($r$-selected: ปลา, แมลง): ส่วนใหญ่ตายตอน年幼, เล็กน้อยรอด – เป็นโค้งเว้า

กราฟความรอดชีวิต Type I, II, และ III บนสเกลลอการิทึม
Vocabulary · ⁨คำศัพท์⁩ Train · ⁨ฝึกฝน⁩
English ไทย
generalist/ˈdʒenərəlɪst/ สายพันธุ์ทั่วไป (generalist)
specialist/ˈspeʃəlɪst/ สายพันธุ์เฉพาะ
survivorship curve/səˈvaɪvəʃɪp kɜːv/ กราฟความรอดชีวิต (survivorship curve)
3.4

Carrying Capacity · ⁨ความจุรองรับ (Carrying Capacity)⁩

Syllabus · ⁨หลักสูตร⁩
English

Enduring Understanding (ERT-3): Populations change over time in reaction to a variety of factors.

Learning Objective ERT-3.D: Describe carrying capacity.

  • ERT-3.D.1 When a population exceeds its carrying capacity (carrying capacity can be denoted as K), overshoot occurs. There are environmental impacts of population overshoot, including resource depletion.

Learning Objective ERT-3.E: Describe the impact of carrying capacity on ecosystems.

  • ERT-3.E.1 A major ecological effect of population overshoot is dieback of the population (often severe to catastrophic) because the lack of available resources leads to famine, disease, and/or conflict.
ไทย

ความเข้าใจที่ยั่งยืน (ERT-3): ประชากรมีการเปลี่ยนแปลงไปตามเวลา ตอบสนองต่อปัจจัยต่างๆ หลากหลาย

วัตถุประสงค์การเรียนรู้ ERT-3.D: อธิบายความจุรองรับ

  • ERT-3.D.1 เมื่อประชากรเกินความจุรองรับ (ความจุรองรับสามารถแทนได้ด้วย K) จะเกิดการเกินขนาด overshoot There are environmental impacts of population overshoot, including resource depletion.

วัตถุประสงค์การเรียนรู้ ERT-3.E: อธิบายผลกระทบของความจุรองรับต่อระบบนิเวศ

  • ERT-3.E.1 ผลกระทบทางนิเวศวิทยาที่สำคัญของการมีประชากรเกินกว่าความจุรองรับคือ การลดลงของประชากร (มักจะเป็นไปอย่างรุนแรงหรือหายนะ) เนื่องจากขาดแคลนทรัพยากรที่จำเป็น นำไปสู่การขาดอาหาร โรคภัย และการขัดแย้ง

Source: College Board AP Course and Exam Description · ⁨แหล่งที่มา: คำอธิบายหลักสูตรและข้อสอบ College Board AP⁩

English
Predator & prey populations cycle
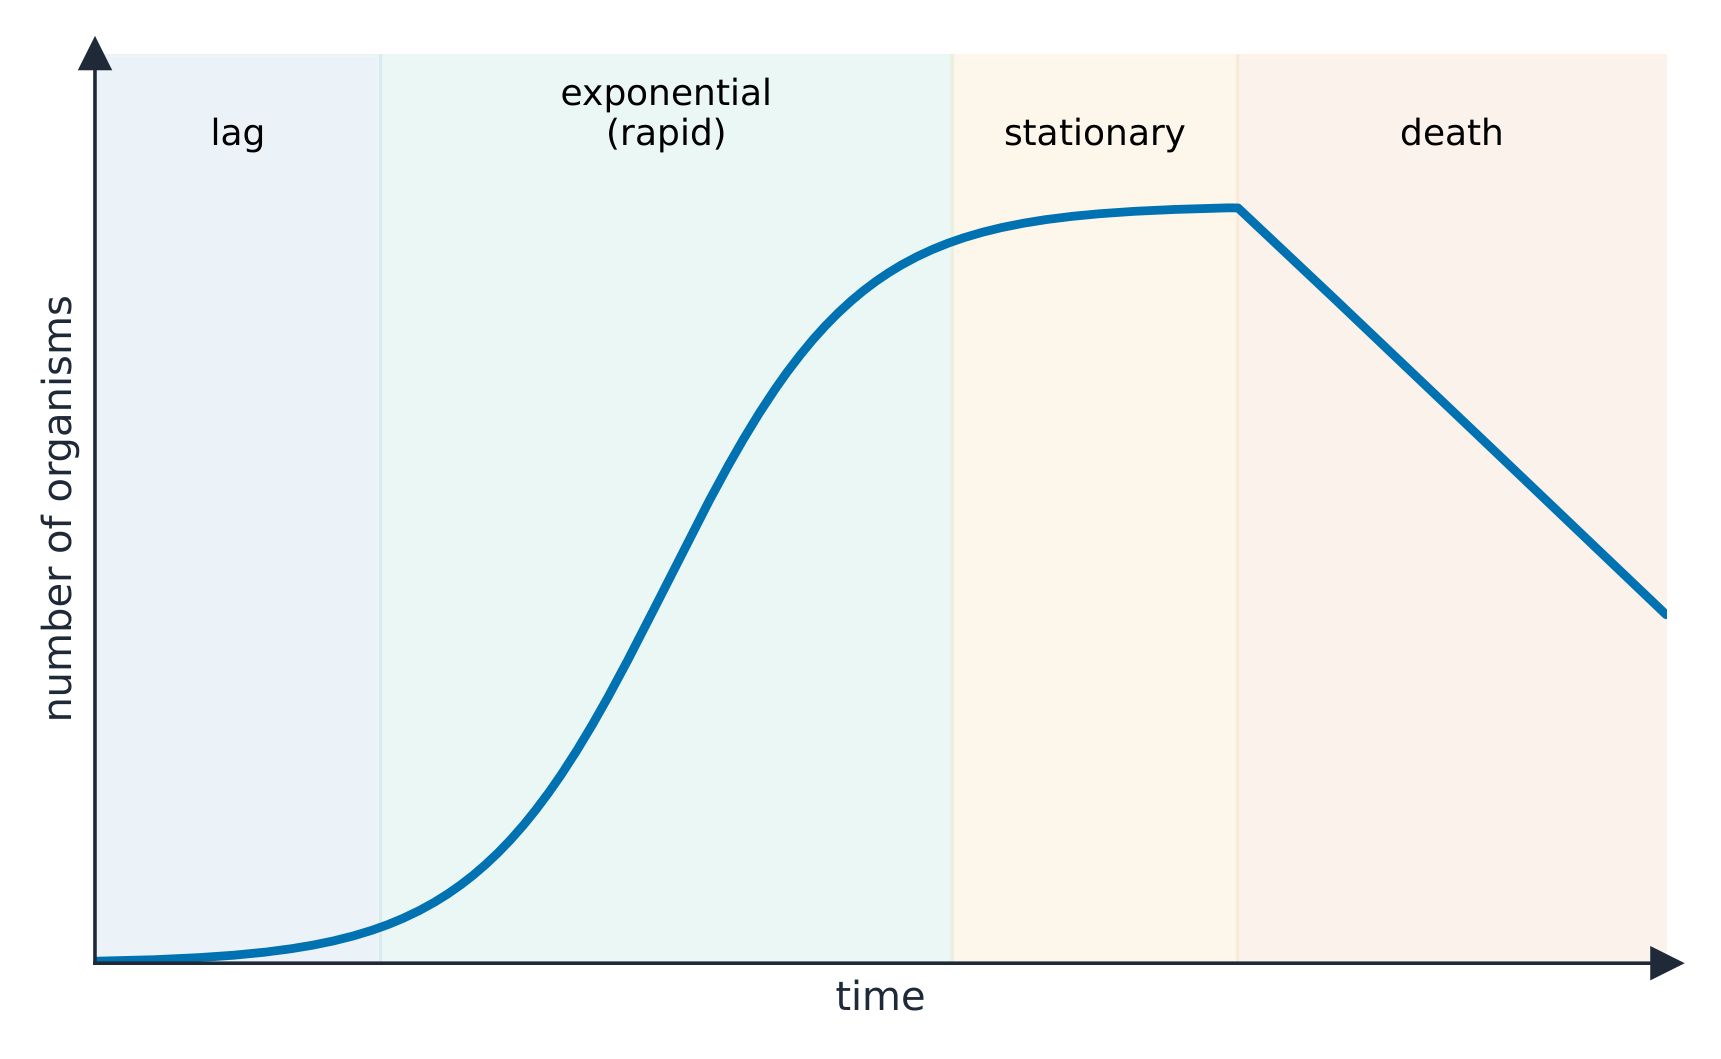
Exponential vs logistic growth

The carrying capacity 环境容纳量 ($K$) is the maximum population an environment can support long-term. A population may overshoot $K$ when resources are temporarily plentiful, then crash (dieback) as resources run out. Populations tend to fluctuate around $K$.

ไทย
จำนวนประชากรสัตว์นักล่าและเหยื่อมีการหมุนเวียน
การเจริญเติบโตแบบเอ็กซ์โพเนนเชียลเทียบกับโลจิสติกส์

ความจุรองรับ ($K$) คือจำนวนประชากรสูงสุดที่สิ่งแวดล้อมสามารถรองรับได้ระยะยาว จำนวนประชากรอาจ พุ่งเกิน (overshoot) $K$ เมื่อทรัพยากรมีเหลือเฟอชั่วคราว แล้ว พังทลาย (dieback) เมื่อทรัพยากรหมดไป จำนวนประชากรมีแนวโน้มแกว่งตัวรอบๆ $K$

การเติบโตของประชากรชะลอตัวที่ความจุรองรับของสิ่งแวดล้อม
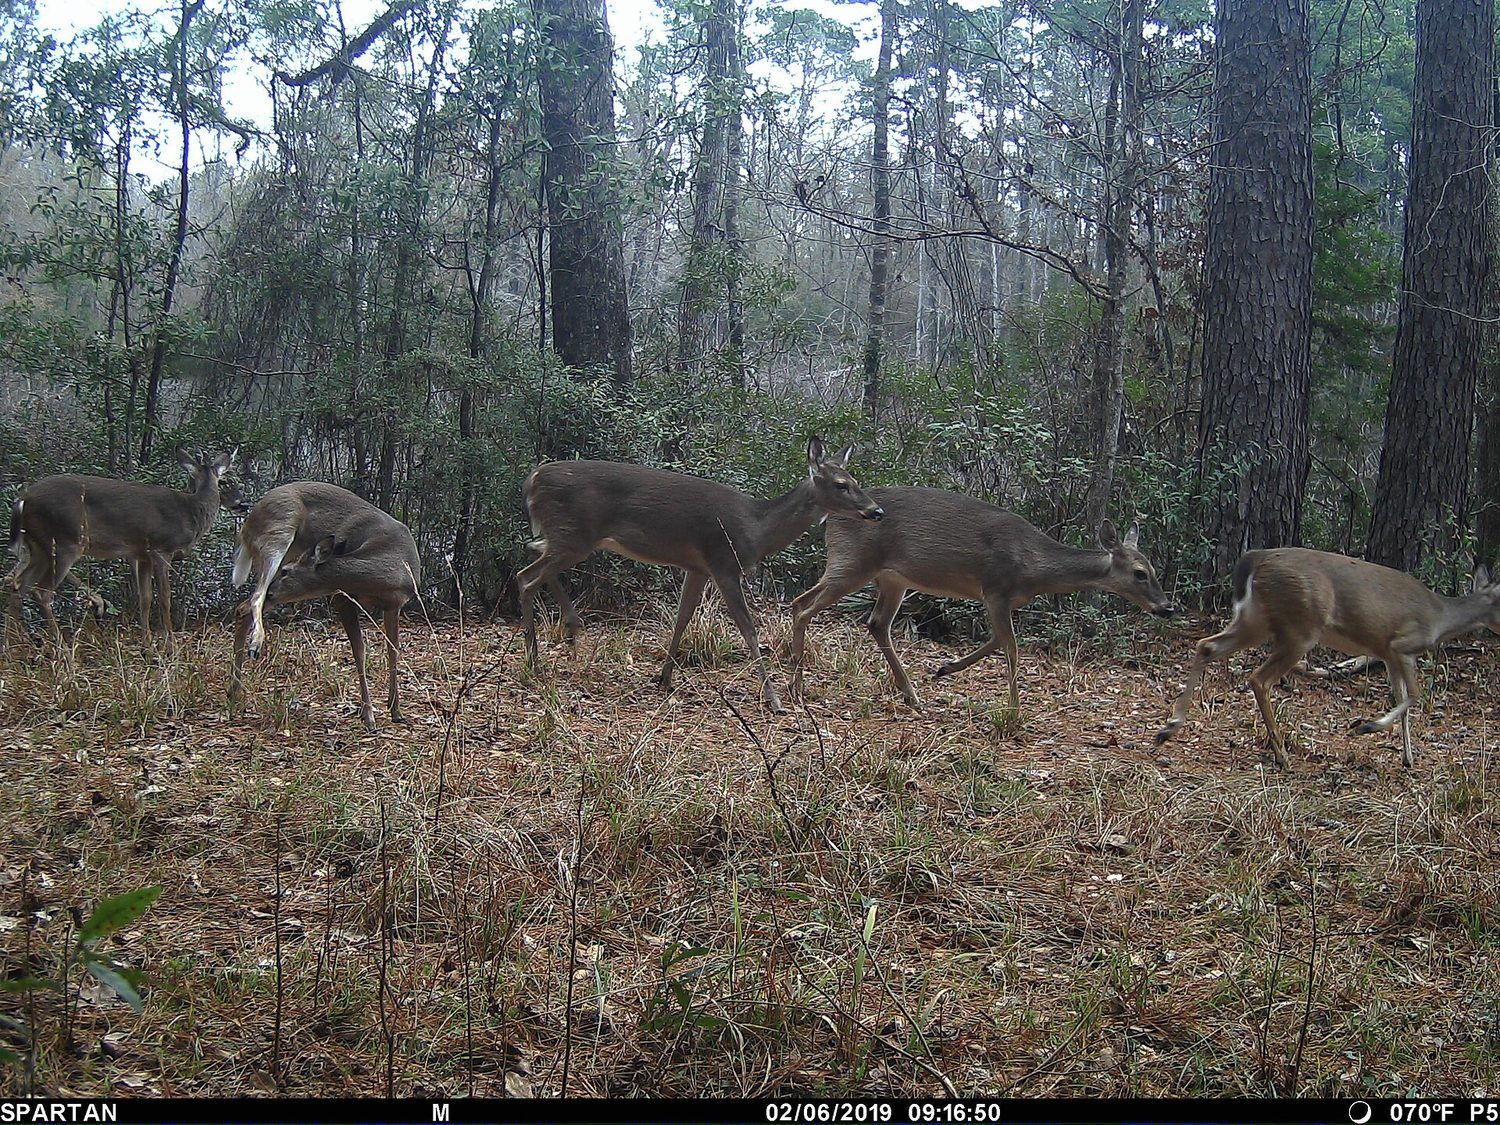
ฝูงกวาง: เมื่อประชากรเข้าใกล้ความจุรองรับ ทรัพยากรจะจำกัดการเติบโตเพิ่มเติม
Explore · ⁨สำรวจ⁩

Growth up to carrying capacity · ⁨การเติบโตจนถึง carrying capacity⁩

A population grows toward the carrying capacity $K$ its resources can support, then levels off. Push the growth rate up and watch it overshoot and settle. · ⁨Population เติบโตเข้าหา carrying capacity $K$ ที่ resources สามารถรองรับได้ แล้วจะ plateau. Push growth rate ขึ้นและดูว่ามัน overshoot และ settle ลง⁩

3.5

Population Growth and Resource Availability · ⁨การเติบโตของประชากรและความพร้อมใช้งานของทรัพยากร⁩

Syllabus · ⁨หลักสูตร⁩
Enduring UnderstandingLearning ObjectiveEssential Knowledge

ERT-3
Populations change over time in reaction to a variety of factors.

ERT-3.F
Explain how resource availability affects population growth.

  • ERT-3.F.1 Population growth is limited by environmental factors, especially by the available resources and space.
  • ERT-3.F.2 Resource availability and the total resource base are limited and finite over all scales of time.
  • ERT-3.F.3 When the resources needed by a population for growth are abundant, population growth usually accelerates.
  • ERT-3.F.4 When the resource base of a population shrinks, the increased potential for unequal distribution of resources will ultimately result in increased mortality, decreased fecundity, or both, resulting in population growth declining to, or below, carrying capacity.

Source: College Board AP Course and Exam Description · ⁨แหล่งที่มา: คำอธิบายหลักสูตรและข้อสอบ College Board AP⁩

English

With abundant resources a population grows exponentially 指数增长 ($J$-curve). As resources become limited, growth slows to logistic 逻辑斯蒂增长 ($S$-curve), leveling at $K$. Limiting factors 限制因素 (food, water, space, disease) set the ceiling.

ไทย

เมื่อทรัพยากรเพียงพอ ประชากรจะเติบโตแบบ เอ็กซ์โพเนนเชียล ($J$-curve) เมื่อทรัพยากรจำกัด การเติบโตจะชะลอตัวเป็นแบบ โลจิสติก ($S$-curve), ชะลอตัวที่ $K$. ปัจจัยจำกัด (อาหาร, น้ำ, พื้นที่, โรค) กำหนดเพดานนี้

3.6

Age Structure Diagrams · ⁨แผนภูมิโครงสร้างอายุ⁩

Syllabus · ⁨หลักสูตร⁩
English

Enduring Understanding (EIN-1): Human populations change in reaction to a variety of factors, including social and cultural factors.

Learning Objective EIN-1.A: Explain age structure diagrams.

  • EIN-1.A.1 Population growth rates can be interpreted from age structure diagrams by the shape of the structure.
  • EIN-1.A.2 A rapidly growing population will, as a rule, have a higher proportion of younger people compared to stable or declining populations.
ไทย

ความเข้าใจที่ยั่งยืน (EIN-1): ประชากรมนุษย์เปลี่ยนแปลงไปตามปฏิกิริยาต่อปัจจัยหลากหลายอย่าง รวมถึงปัจจัยทางสังคมและวัฒนธรรม

จุดประสงค์การเรียนรู้ EIN-1.A: อธิบายแผนภูมิโครงสร้างอายุ

  • EIN-1.A.1 อัตราการเติบโตของประชากรสามารถตีความได้จากแผนภูมิโครงสร้างอายุผ่านรูปร่างของโครงสร้างนั้น
  • EIN-1.A.2 ประชากรที่กำลังเติบโตอย่างรวดเร็ว โดยทั่วไปจะมีสัดส่วนของผู้คนวัยเยาว์สูงกว่าเมื่อเทียบกับประชากรที่คงที่หรือลดลง

Source: College Board AP Course and Exam Description · ⁨แหล่งที่มา: คำอธิบายหลักสูตรและข้อสอบ College Board AP⁩

English

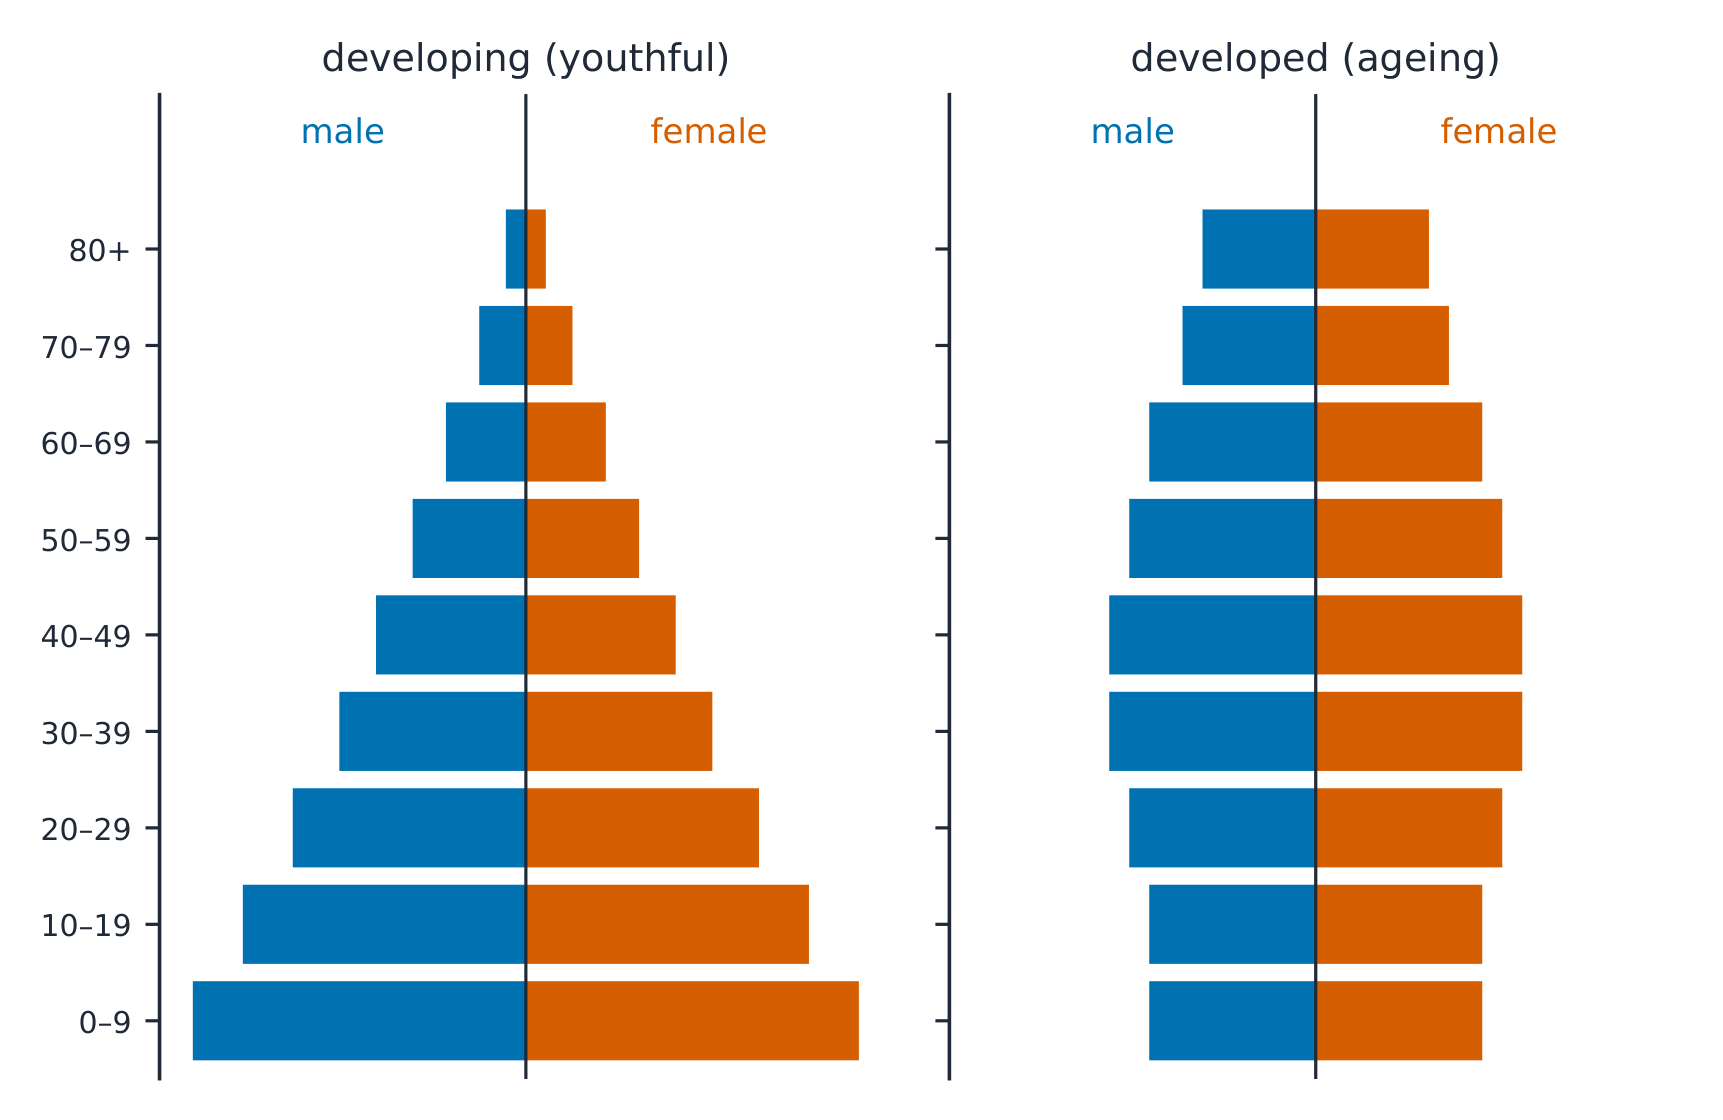
An age-structure diagram 年龄结构图 shows the proportion of a population in each age group. A wide base (many young) predicts rapid growth; even bars predict a stable population; a narrow base predicts decline. They forecast a country's future population.

ไทย

แผนภูมิโครงสร้างอายุ แสดงสัดส่วนของประชากรในแต่ละกลุ่มอายุ ฐานกว้าง (เด็กเยอะ) ทำนายการเติบโต รวดเร็ว; แท่งเท่ากันทำนายประชากร เสถียร; ฐานแคบทำนายการ ลดลง它们 forecast a country's future population.

พีระมิดประชากรของประเทศกำลังพัฒนาและประเทศพัฒนาแล้ว
3.7

Total Fertility Rate · ⁨อัตราการเจริญพันธุ์รวม⁩

Syllabus · ⁨หลักสูตร⁩
English

Enduring Understanding (EIN-1): Human populations change in reaction to a variety of factors, including social and cultural factors.

Learning Objective EIN-1.B: Explain factors that affect total fertility rate in human populations.

  • EIN-1.B.1 Total fertility rate (TFR) is affected by the age at which females have their first child, educational opportunities for females, access to family planning, and government acts and policies.
  • EIN-1.B.2 If fertility rate is at replacement levels, a population is considered relatively stable.
  • EIN-1.B.3 Factors associated with infant mortality rates include whether mothers have access to good healthcare and nutrition. Changes in these factors can lead to changes in infant mortality rates over time.
ไทย

ความเข้าใจที่ยั่งยืน (EIN-1): ประชากรมนุษย์เปลี่ยนแปลงไปตามปฏิกิริยาต่อปัจจัยหลากหลายอย่าง รวมถึงปัจจัยทางสังคมและวัฒนธรรม

จุดประสงค์การเรียนรู้ EIN-1.B: อธิบายปัจจัยที่มีผลต่ออัตราการเจริญพันธุ์รวมในประชากรมนุษย์

  • EIN-1.B.1 อัตราการเกิดรวม (TFR)受年龄影响,女性初育年龄、教育机会、计划生育服务获取以及政府法规和政策。
  • EIN-1.B.2 หากอัตราการเกิดอยู่ที่ระดับทดแทนประชากร จะถือว่าประชากรมีเสถียรภาพในระดับหนึ่ง
  • EIN-1.B.3 ปัจจัยที่เกี่ยวข้องกับอัตราตายในทารก รวมถึงการที่แม่เข้าถึงบริการสุขภาพที่ดีและการโภชนาการ การเปลี่ยนแปลงของปัจจัยเหล่านี้สามารถนำไปสู่การเปลี่ยนแปลงของอัตราตายในทารกตามเวลา

Source: College Board AP Course and Exam Description · ⁨แหล่งที่มา: คำอธิบายหลักสูตรและข้อสอบ College Board AP⁩

English

The total fertility rate 总生育率 (TFR) is the average number of children per woman. A replacement level of about 2.1 keeps a population steady; above it grows, below it shrinks. TFR falls with education, access to family planning, and lower infant mortality.

ไทย

อัตราการเจริญพันธุ์รวม (TFR) คือจำนวนเฉลี่ยของเด็กต่อผู้หญิง One replacement level of about 2.1 keeps a population steady; above it grows, below it shrinks. TFR falls with education, access to family planning, and lower infant mortality.

3.8

Human Population Dynamics

Syllabus · ⁨หลักสูตร⁩
English

Enduring Understanding (EIN-1): Human populations change in reaction to a variety of factors, including social and cultural factors.

Learning Objective EIN-1.C.1: Explain how human populations experience growth and decline.

  • EIN-1.C.1 Birth rates, infant mortality rates, and overall death rates, access to family planning, access to good nutrition, access to education, and postponement of marriage all affect whether a human population is growing or declining.
  • EIN-1.C.2 Factors limiting global human population include the Earth's carrying capacity and the basic factors that limit human population growth as set forth by Malthusian theory.
  • EIN-1.C.3 Population growth can be affected by both density-independent factors, such as major storms, fires, heat waves, or droughts, and density-dependent factors, such as access to clean water and air, food availability, disease transmission, or territory size.
  • EIN-1.C.4 The rule of 70 states that dividing the number 70 by the percentage population growth rate approximates the population's doubling time.
ไทย

ความเข้าใจที่ยั่งยืน (EIN-1): ประชากรมนุษย์เปลี่ยนแปลงไปตามปฏิกิริยาต่อปัจจัยหลากหลายอย่าง รวมถึงปัจจัยทางสังคมและวัฒนธรรม

วัตถุประสงค์การเรียนรู้ EIN-1.C.1: อธิบายว่าประชากรมนุษย์มีการเติบโตและลดลงอย่างไร

  • EIN-1.C.1 อัตราการเกิด อัตราตายในทารก และอัตราตายโดยรวม การเข้าถึงการวางแผนครอบครัว การเข้าถึงโภชนาการที่ดี การเข้าถึงการศึกษา และการเลื่อนการแต่งงาน ล้วนส่งผลต่อการที่ประชากรมนุษย์จะเติบโตหรือลดลง
  • EIN-1.C.2 ปัจจัยที่จำกัดประชากรมนุษย์ทั่วโลก ได้แก่ ความจุรองรับของโลก และปัจจัยพื้นฐานที่จำกัดการเติบโตของประชากรมนุษย์ตามที่ทฤษฎีมาลซัสกำหนดไว้
  • EIN-1.C.3 การเติบโตของประชากรอาจได้รับผลกระทบจากปัจจัยที่ไม่ขึ้นกับความหนาแน่น เช่น พายุใหญ่ไฟไหม้คลื่นความร้อนหรือภัยแล้ง และปัจจัยที่ขึ้นกับความหนาแน่น เช่น การเข้าถึงน้ำสะอาดและอากาศ การมีอาหารโรคติดต่อหรือขนาดอาณาเขต
  • EIN-1.C.4 กฎ 70 ระบุว่าเมื่อนำจำนวน 70 หารด้วยอัตราการเติบโตของประชากรเป็นเปอร์เซ็นต์ จะได้ค่าประมาณของระยะเวลาที่ประชากรจะเพิ่มขึ้นเป็นสองเท่า

Source: College Board AP Course and Exam Description · ⁨แหล่งที่มา: คำอธิบายหลักสูตรและข้อสอบ College Board AP⁩

English

Human population growth depends on birth rate, death rate, and migration. Rapid growth strains resources and increases the ecological footprint 生态足迹. Factors lowering birth rates include education (especially of women), urbanization, and economic development.

Worked example. A country has a birth rate of $30$ per $1000$ and a death rate of $10$ per $1000$. The natural growth rate is $\dfrac{30-10}{10}=2.0\%$ per year (dividing the per-thousand difference by $10$ converts it to a percent). By the rule of 70, the population doubles in about $\dfrac{70}{2.0}=35$ years. If development cut the growth rate to $1.0\%$, the doubling time would stretch to $\dfrac{70}{1.0}=70$ years.

ไทย

การเติบโตของประชากรมนุษย์ขึ้นอยู่กับ อัตราการเกิด, อัตราการตาย, และ การอพยพ. การเติบโตอย่างรวดเร็วสร้างความเครียดให้ทรัพยากรและเพิ่ม รอยเท้าเชิงนิเวศ (ecological footprint). ปัจจัยที่ลดอัตราการเกิด ได้แก่ การศึกษา (โดยเฉพาะของผู้หญิง), การเมืองเมือง, และการพัฒนาเศรษฐกิจ

ตัวอย่างทำแบบฝึกหัด. ประเทศหนึ่งมีอัตราการเกิด $30$ ต่อ $1000$ และอัตราการตาย $10$ ต่อ $1000$ อัตราการเติบโตทางธรรมชาติคือ $\dfrac{30-10}{10}=2.0\%$ ต่อปี (โดยนำผลต่างต่อพันมาหารด้วย $10$ เพื่อแปลงเป็นเปอร์เซ็นต์) ตาม กฎของ 70 ประชากรจะเพิ่มขึ้นเป็นสองเท่าในประมาณ $\dfrac{70}{2.0}=35$ ปี หากการพัฒนาประเทศลดอัตราการเติบโตลงเหลือ $1.0\%$ เวลาที่ใช้เพื่อเพิ่มเป็นสองเท่าจะยืดออกไปเป็น $\dfrac{70}{1.0}=70$ ปี

เมืองที่หนาแน่นไปด้วยผู้คน:พลวัตของประชากรมนุษย์ขึ้นอยู่กับอัตราการเกิด อัตราการตาย และการย้ายถิ่น
Vocabulary · ⁨คำศัพท์⁩ Train · ⁨ฝึกฝน⁩
English ไทย
ecological footprint/ˌekəˈlɒdʒɪkl ˈfʊtprɪnt/ รอยเท้าเชิงนิเวศวิทยา
3.9

Demographic Transition · ⁨การเปลี่ยนแปลงทางประชากรศาสตร์⁩

Syllabus · ⁨หลักสูตร⁩
English

Enduring Understanding (EIN-1): Human populations change in reaction to a variety of factors, including social and cultural factors.

Learning Objective EIN-1.D: Define the demographic transition.

  • EIN-1.D.1 The demographic transition refers to the transition from high to lower birth and death rates in a country or region as development occurs and that country moves from a pre-industrial to an industrialized economic system. This transition is typically demonstrated through a four-stage demographic transition model (DTM).
  • EIN-1.D.2 Characteristics of developing countries include higher infant mortality rates and more children in the workforce than developed countries.
ไทย

ความเข้าใจที่ยั่งยืน (EIN-1): ประชากรมนุษย์เปลี่ยนแปลงไปตามปฏิกิริยาต่อปัจจัยหลากหลายอย่าง รวมถึงปัจจัยทางสังคมและวัฒนธรรม

วัตถุประสงค์การเรียนรู้ EIN-1.D: นิยามการเปลี่ยนผ่านทางประชากรศาสตร์

  • EIN-1.D.1 การเปลี่ยนผ่านทางประชากรศาสตร์หมายถึงการเปลี่ยนผ่านจากอัตราการเกิดและอัตราการตายสูงไปสู่ระดับที่ต่ำกว่า当一个国家或地区发生发展并从前工业社会进入工业化经济体系时这一转变通常通过四阶段人口转变模型(DTM)来展示。
  • EIN-1.D.2 ลักษณะของประเทศกำลังพัฒนา ได้แก่ อัตราตายในทารกที่สูงกว่า และมีเด็กในแรงงานมากกว่าประเทศพัฒนาแล้ว

Source: College Board AP Course and Exam Description · ⁨แหล่งที่มา: คำอธิบายหลักสูตรและข้อสอบ College Board AP⁩

English

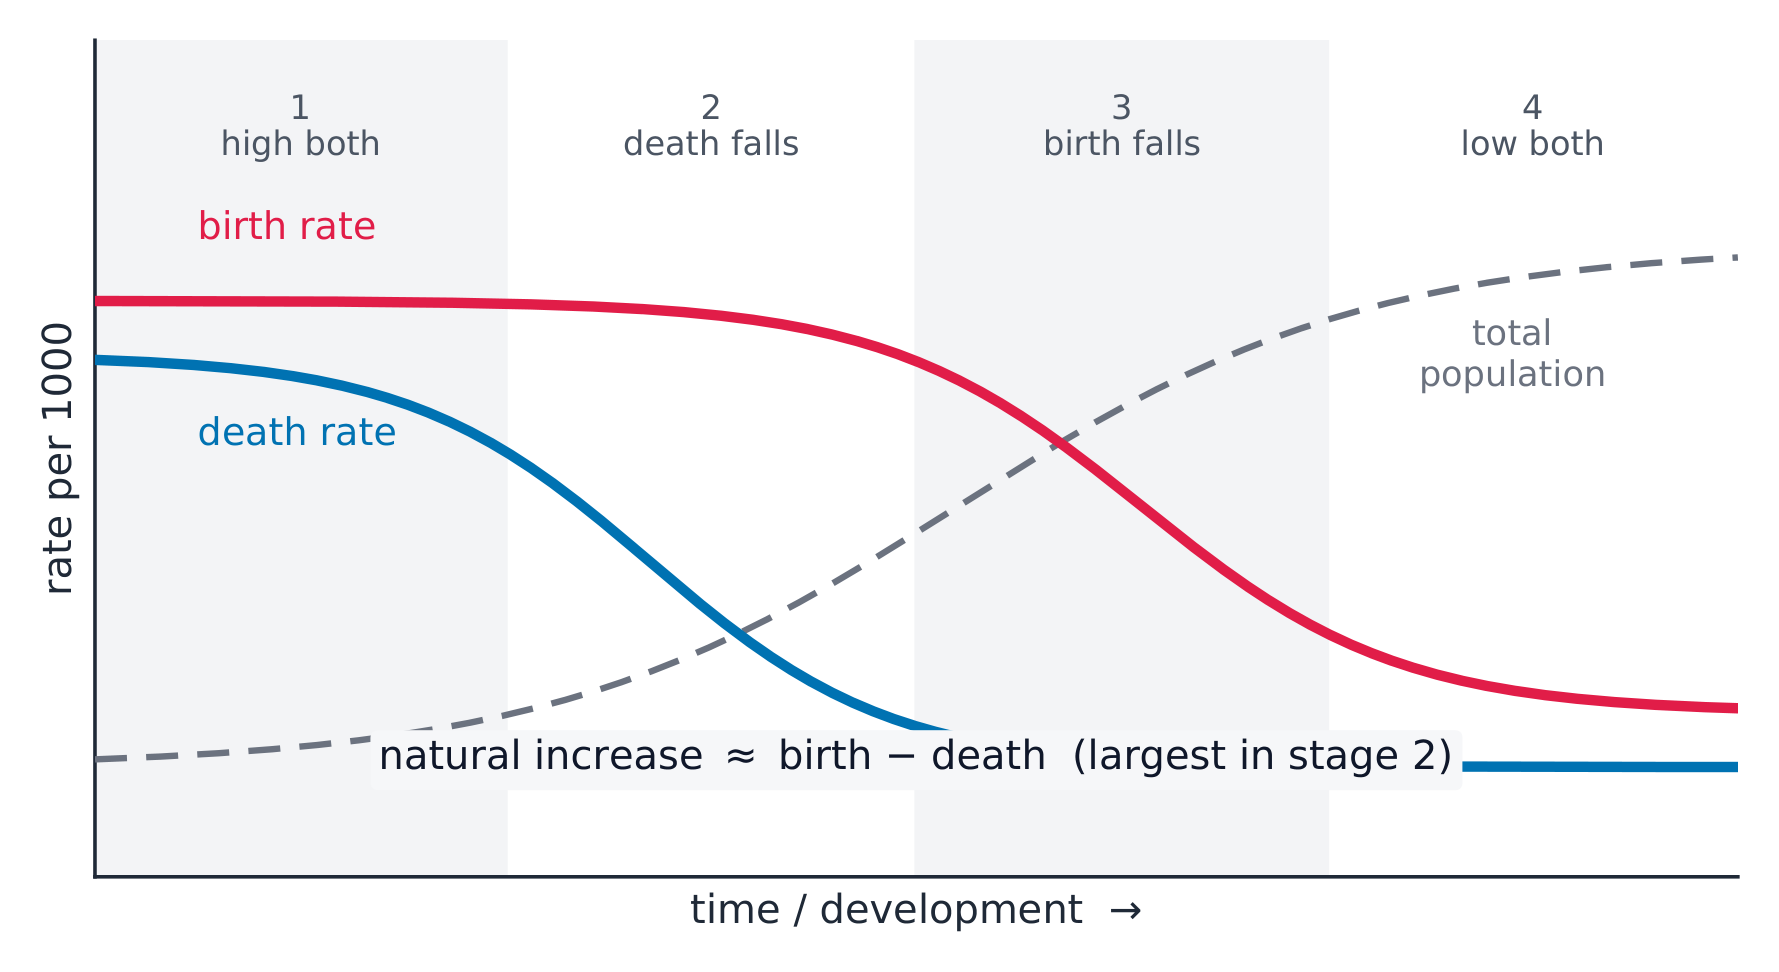
The demographic transition 人口转型 describes how a country's growth changes as it develops, in stages: (1) high birth and death rates (slow growth); (2) death rate falls (rapid growth); (3) birth rate falls (slowing growth); (4) both low (stable). Developed nations are in later stages; many developing nations are in the rapid-growth stages.

The population grows fastest in stages 2 and 3 – the gap between a still-high birth rate and an already-fallen death rate. That lag is why a country's population keeps climbing long after its death rate drops.

ไทย

การเปลี่ยนแปลงทางประชากรศาสตร์ อธิบายถึงการเปลี่ยนแปลงอัตราการเติบโตของประเทศตามระดับการพัฒนา โดยแบ่งเป็นขั้นตอน: (1) อัตราการเกิดและตายสูง (การเติบโตช้า); (2) อัตราการตายลดลง (การเติบโตเร็ว); (3) อัตราการเกิดลดลง (การเติบโตชะลอตัว); (4) ทั้งสองต่ำ (คงที่) ประเทศพัฒนาแล้วอยู่ในขั้นตอนหลัง; ประเทศกำลังพัฒนาหลายแห่งอยู่ในขั้นตอนที่การเติบโตอย่างรวดเร็ว

สี่ขั้นตอนของการเปลี่ยนแปลงทางประชากรศาสตร์

ประชากรเติบโตเร็วที่สุดในขั้นตอนที่ 2 และ 3 – ซึ่งเกิดจากช่องว่างระหว่างอัตราการเกิดที่ยังสูงกับอัตราการตายที่ลดลงไปแล้ว ความล่าช้านี้เป็นเหตุผลว่าทำไมประชากรของประเทศจึงยังคงพุ่งสูงขึ้นนานหลังจากอัตราการตายลดลง

Vocabulary · ⁨คำศัพท์⁩ Train · ⁨ฝึกฝน⁩
English ไทย
demographic transition/ˌdeməˈɡræfɪk trænˈsɪʃn/ demographic transition
3.9

Exam tips · ⁨ข้อแนะนำสำหรับการสอบ⁩

English
  • Use the rule of 70: doubling time ≈ 70 ÷ growth-rate(%); a growth rate is (births − deaths) per 1000 ÷ 10.
  • Read age-structure diagrams: a wide base predicts rapid growth, even bars a stable population.
  • Contrast r-selected (many offspring, little care) and K-selected (few, much care) strategies.
  • Know the demographic transition stages and what lowers birth rates (education, family planning, development).
  • A falling growth rate still means growth — the population only shrinks when deaths exceed births.
ไทย
  • Use the rule of 70: doubling time ≈ 70 ÷ growth-rate(%); a growth rate is (births − deaths) per 1000 ÷ 10.
  • อ่าน แผนภูมิโครงสร้างอายุ: ฐานกว้างบ่งบอกถึงการเติบโตอย่างรวดเร็ว ส่วนแท่งที่เท่ากันบ่งบอกถึงประชากรที่คงที่
  • เปรียบเทียบกลยุทธ์ r-selected (ลูกหลานจำนวนมาก ดูแลน้อย) และ K-selected (ลูกหลานน้อย ดูแลมาก)
  • รู้จักขั้นตอนของการเปลี่ยนแปลงทางประชากรศาสตร์ และปัจจัยที่ลดอัตราการเกิด (การศึกษา การวางแผนครอบครัว การพัฒนาประเทศ)
  • การลดลงของ อัตราการเติบโต ยังหมายถึงการเติบโตอยู่ดี ประชากรจะลดลงก็ต่อเมื่อมีการตายมากกว่าการเกิดเท่านั้น

Interactive lessons on this topic · ⁨บทเรียนเชิงโต้ตอบสำหรับหัวข้อนี้⁩

Work through it step by step, with instant-check exercises. · ⁨ทำทีละขั้นตอน พร้อมแบบฝึกหัดตรวจสอบผลทันที⁩

Past Papers · ⁨ข้อสอบย้อนหลัง⁩

More topics in AP Environmental Science · ⁨หัวข้อเพิ่มเติมใน AP Environmental Science⁩

Log in or create account · ⁨เข้าสู่ระบบหรือสร้างบัญชี⁩

IGCSE, A-Level & AP