跳到主要内容

定量数据的推断:均值

AP 统计学 · 第 7 主题

训练
讲义 词汇表
7.1

统计学导论:我应该担心误差吗?

大纲
Enduring UnderstandingLearning ObjectiveEssential Knowledge

VAR-1
Given that variation may be random or not, conclusions are uncertain.

VAR-1.I
Identify questions suggested by probabilities of errors in statistical inference. [Skill 1.A]

  • VAR-1.I.1 Random variation may result in errors in statistical inference.

来源:美国大学理事会 AP 课程与考试说明

第一类与第二类错误

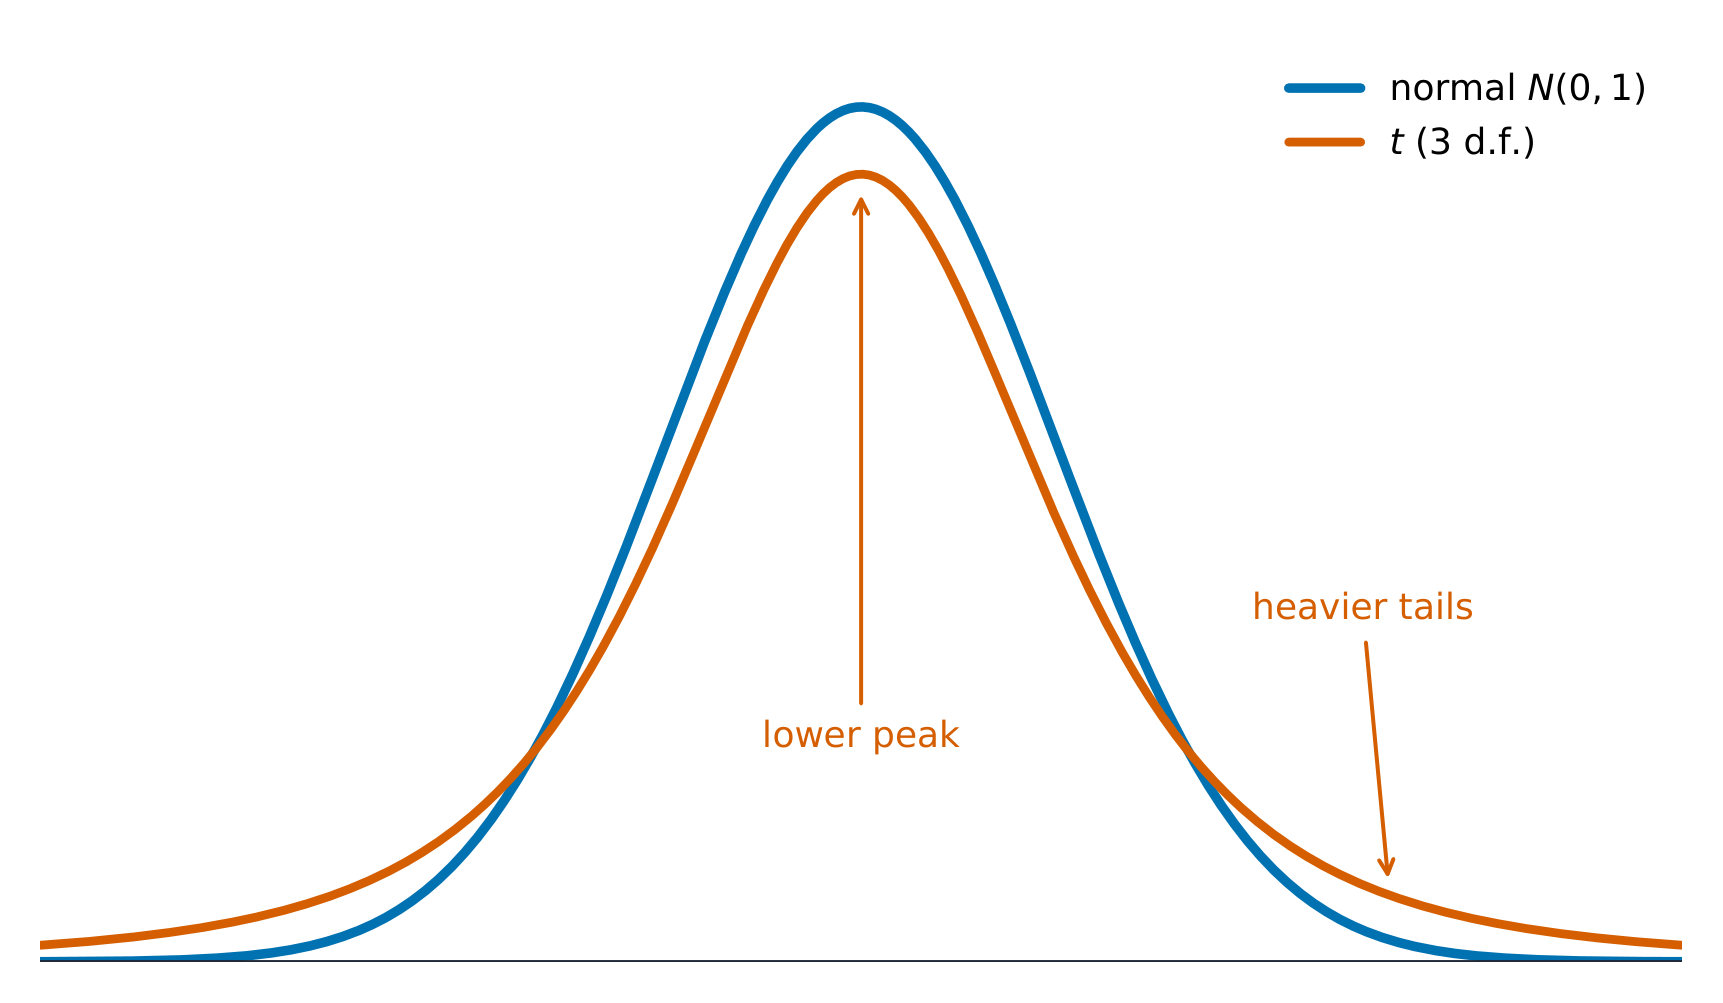
对一个均值的推断像对一个比例的推断那样工作,有一个改变:我们很少知道总体标准差 $\sigma$,所以我们用样本 $s$ 估计它。那额外的不确定性意味着我们用 $t$ 分布而不是正态——一个钟形但有更重的尾的分布(distribution),而它取决于自由度(degrees of freedom)$df=n-1$;随着 $n$ 增长它趋近正态。

词汇表 训练
英文 中文 拼音
distribution 分布 fēn bù
degrees of freedom 自由度 zì yóu dù
7.2

构建总体均值的置信区间

大纲
Enduring UnderstandingLearning ObjectiveEssential Knowledge

VAR-7
The $t$-distribution may be used to model variation.

VAR-7.A
Describe $t$-distributions. [Skill 3.C]

  • VAR-7.A.1 When $s$ is used instead of $\sigma$ to calculate a test statistic, the corresponding distribution, known as the $t$-distribution, varies from the normal distribution in shape, in that more of the area is allocated to the tails of the density curve than in a normal distribution.
  • VAR-7.A.2 As the degrees of freedom increase, the area in the tails of a $t$-distribution decreases.

UNC-4
An interval of values should be used to estimate parameters, in order to account for uncertainty.

UNC-4.O
Identify an appropriate confidence interval procedure for a population mean, including the mean difference between values in matched pairs. [Skill 1.D]

  • UNC-4.O.1 Because $\sigma$ is typically not known for distributions of quantitative variables, the appropriate confidence interval procedure for estimating the population mean of one quantitative variable for one sample is a one-sample $t$-interval for a mean.
  • UNC-4.O.2 For one quantitative variable, $X$, that is normally distributed, the distribution of $t = \dfrac{(\overline{x} - \mu)}{\frac{s}{\sqrt{n}}}$ is a $t$-distribution with $n-1$ degrees of freedom.
  • UNC-4.O.3 Matched pairs can be thought of as one sample of pairs. Once differences between pairs of values are found, inference for confidence intervals proceeds as for a population mean.

UNC-4.P
Verify the conditions for calculating confidence intervals for a population mean, including the mean difference between values in matched pairs. [Skill 4.C]

  • UNC-4.P.1 In order to calculate confidence intervals to estimate a population mean, we must check for independence and that the sampling distribution is approximately normal:
    • a. To check for independence:
      • i. Data should be collected using a random sample or a randomized experiment.
      • ii. When sampling without replacement, check that $n \leq 10\%N$, where $N$ is the size of the population.
    • b. To check that the sampling distribution of $\overline{x}$ is approximately normal (shape):
      • i. If the observed distribution is skewed, $n$ should be greater than 30.
      • ii. If the sample size is less than 30, the distribution of the sample data should be free from strong skewness and outliers.

UNC-4.Q
Determine the margin of error for a given sample size for a one-sample $t$-interval. [Skill 3.D]

  • UNC-4.Q.1 The critical value $t^*$ with $n-1$ degrees of freedom can be found using a table or computer-generated output.
  • UNC-4.Q.2 The standard error for a sample mean is given by $SE = \dfrac{s}{\sqrt{n}}$, where $s$ is the sample standard deviation.
  • UNC-4.Q.3 For a one-sample $t$-interval for a mean, the margin of error is the critical value ($t^*$) times the standard error ($SE$), which equals $t^*\left(\dfrac{s}{\sqrt{n}}\right)$.

UNC-4.R
Calculate an appropriate confidence interval for a population mean, including the mean difference between values in matched pairs. [Skill 3.D]

  • UNC-4.R.1 The point estimate for a population mean is the sample mean, $\overline{x}$.
  • UNC-4.R.2 For the population mean for one sample with unknown population standard deviation, the confidence interval is $\overline{x} \pm t^* \dfrac{s}{\sqrt{n}}$.

Boundary statement: Formulas for interval estimates do not appear explicitly on the AP Statistics Formula Sheet provided with the AP Statistics Exam. However, these formulas do not need to be memorized, as they can be constructed based on the general test statistic formula and the relevant standard error formulas that are provided on the formula sheet.

来源:美国大学理事会 AP 课程与考试说明

置信区间的含义

一个对 $\mu$ 的单样本 $t$ 区间:

$$\bar{x}\pm t^{*}\frac{s}{\sqrt{n}}.$$
$t^{*}$ 是带 $df=n-1$ 的临界值。条件:随机样本、正态/大样本(总体正态,或由 CLT 的 $n\ge 30$,或一个没有离群值的大致对称样本),以及 10% 条件。在上下文里解释这个区间和置信水平。

Worked example. 一个 $n=25$ 的随机样本有 $\bar{x}=50$$s=8$。对于一个 $95\%$ 区间,$df=24$ 给出 $t^*=2.064$:

$$50\pm2.064\cdot\frac{8}{\sqrt{25}}=50\pm2.064(1.6)=50\pm3.3=(46.7,\ 53.3).$$
The t-distribution has a lower peak and heavier tails than the normal
t 分布比正态有一个更低的峰和更重的尾
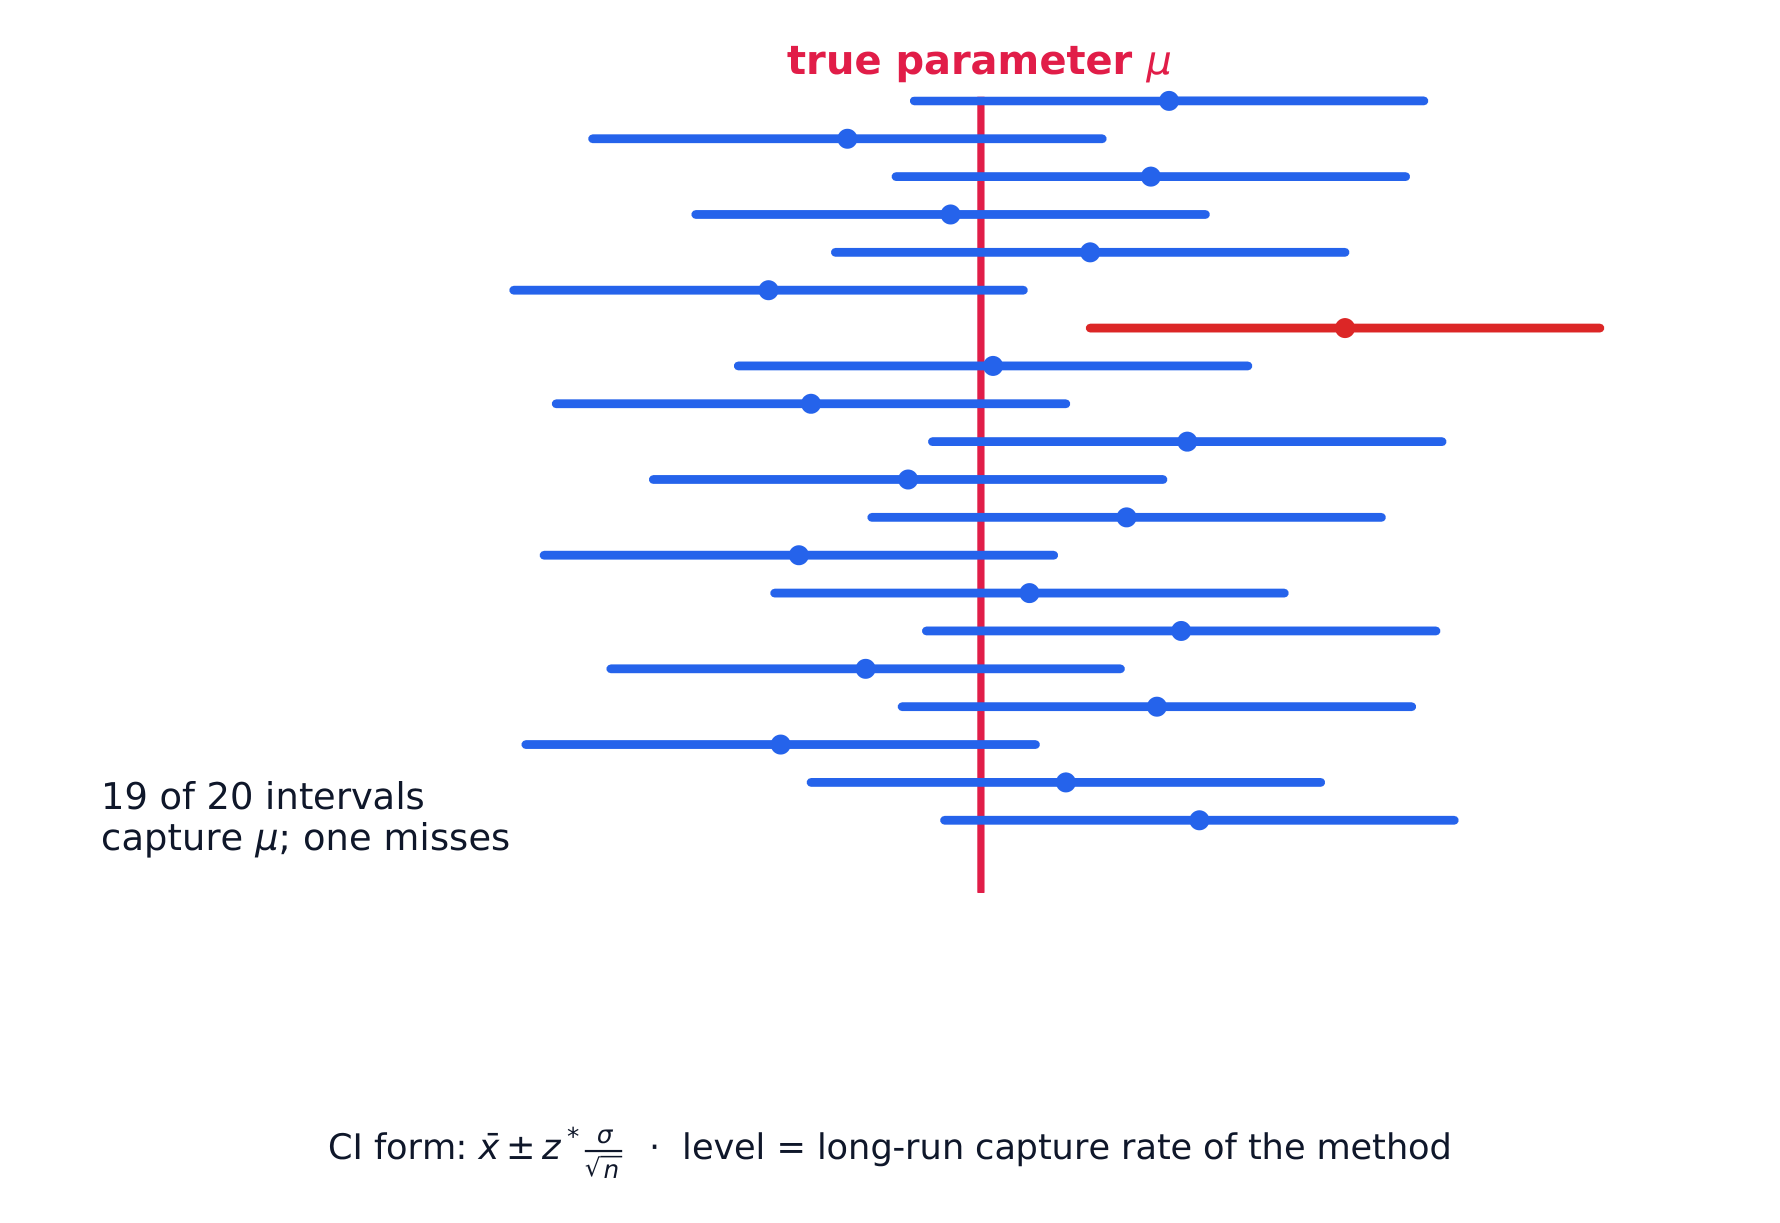
Repeated 95% confidence intervals: about 95% capture the true parameter
"95% 信心"描述这个方法,不是一个区间:在许多样本上约 95% 的区间包含 $\mu$ 而约 5% 错过它。
探索

Why a t interval is wider than a z interval

A mean interval uses $t^*$, not $1.96$, because $\sigma$ is estimated by $s$. Drag df down and watch $t^*$ grow — at $df=10$ it is $2.228$, and the interval is wider for it. Drag df up and $t^*$ falls back toward $1.96$, which is why large samples may use $z$.

7.3

基于置信区间论证关于总体均值的结论

大纲
Enduring UnderstandingLearning ObjectiveEssential Knowledge

UNC-4
An interval of values should be used to estimate parameters, in order to account for uncertainty.

UNC-4.S
Interpret a confidence interval for a population mean, including the mean difference between values in matched pairs. [Skill 4.B]

  • UNC-4.S.1 A confidence interval for a population mean either contains the population mean or it does not, because each interval is based on data from a random sample, which varies from sample to sample.
  • UNC-4.S.2 We are C% confident that the confidence interval for a population mean captures the population mean.
  • UNC-4.S.3 An interpretation of a confidence interval for a population mean includes a reference to the sample taken and details about the population it represents.
    • Illustrative examples for UNC-4.S.3: For interpreting a 96% confidence interval for mean foot length for all footprints found in a cave based on a particular randomly selected sample of footprints in the cave: "We are 96% confident that the mean foot length for all footprints found in the cave falls within the confidence interval" (based on 2000 FRQ 2).

UNC-4.T
Justify a claim based on a confidence interval for a population mean, including the mean difference between values in matched pairs. [Skill 4.D]

  • UNC-4.T.1 A confidence interval for a population mean provides an interval of values that may provide sufficient evidence to support a particular claim in context.

UNC-4.U
Identify the relationships between sample size, width of a confidence interval, confidence level, and margin of error for a population mean. [Skill 4.A]

  • UNC-4.U.1 When all other things remain the same, the width of a confidence interval for a population mean tends to decrease as the sample size increases.
  • UNC-4.U.2 For a single mean, the width of the interval is proportional to $\dfrac{1}{\sqrt{n}}$.
  • UNC-4.U.3 For a given sample, the width of the confidence interval for a population mean increases as the confidence level increases.

来源:美国大学理事会 AP 课程与考试说明

与比例一样:一个宣称的均值区间内是可信的;区间外,数据给出反对它的证据。用这个可信范围在上下文里回答。

7.4

建立总体均值的检验

大纲
Enduring UnderstandingLearning ObjectiveEssential Knowledge

VAR-7
The $t$-distribution may be used to model variation.

VAR-7.B
Identify an appropriate testing method for a population mean with unknown $\sigma$, including the mean difference between values in matched pairs. [Skill 1.E]

  • VAR-7.B.1 The appropriate test for a population mean with unknown $\sigma$ is a one-sample $t$-test for a population mean.
  • VAR-7.B.2 Matched pairs can be thought of as one sample of pairs. Once differences between pairs of values are found, inference for significance testing proceeds as for a population mean.

VAR-7.C
Identify the null and alternative hypotheses for a population mean with unknown $\sigma$, including the mean difference between values in matched pairs. [Skill 1.F]

  • VAR-7.C.1 The null hypothesis for a one-sample $t$-test for a population mean is $H_0 : \mu = \mu_0$, where $\mu_0$ is the hypothesized value. Depending upon the situation, the alternative hypothesis is $H_a : \mu < \mu_0$, or $H_a : \mu > \mu_0$, or $H_a : \mu \neq \mu_0$.
  • VAR-7.C.2 When finding the mean difference, $\mu_d$, between values in a matched pair, it is important to define the order of subtraction.

VAR-7.D
Verify the conditions for the test for a population mean, including the mean difference between values in matched pairs. [Skill 4.C]

  • VAR-7.D.1 In order to make statistical inferences when testing a population mean, we must check for independence and that the sampling distribution is approximately normal:
    • a. To check for independence:
      • i. Data should be collected using a random sample or a randomized experiment.
      • ii. When sampling without replacement, check that $n \leq 10\%N$.
    • b. To check that the sampling distribution of $\overline{x}$ is approximately normal (shape):
      • i. If the observed distribution is skewed, $n$ should be greater than 30.
      • ii. If the sample size is less than 30, the distribution of the sample data should be free from strong skewness and outliers.

来源:美国大学理事会 AP 课程与考试说明

p 值的含义

陈述关于 $\mu$ 的假设:$H_0:\mu=\mu_0$$H_a:\mu\neq\mu_0$(或 $<,>$)。检查相同的条件。单样本 $t$ 统计量:

$$t=\frac{\bar{x}-\mu_0}{s/\sqrt{n}},\qquad df=n-1.$$

Worked example. 对上面的样本($\bar{x}=50$$s=8$$n=25$)检验 $H_0:\mu=45$$H_a:\mu\neq45$:

$$t=\frac{50-45}{8/\sqrt{25}}=\frac{5}{1.6}=3.13,\qquad df=24.$$
这个 $t$ 远在尾里(双尾 $p<0.01$),所以拒绝 $H_0$ ——均值不是 $45$ 的强证据。注意 $45$ 也落在 $95\%$ 区间 $(46.7,53.3)$ 之外,由两条路径得到相同的结论。

7.5

执行总体均值的检验

大纲
Enduring UnderstandingLearning ObjectiveEssential Knowledge

VAR-7
The $t$-distribution may be used to model variation.

VAR-7.E
Calculate an appropriate test statistic for a population mean, including the mean difference between values in matched pairs. [Skill 3.E]

  • VAR-7.E.1 For a single quantitative variable when random sampling with replacement from a population that can be modeled with a normal distribution with mean $\mu$ and standard deviation $\sigma$, the sampling distribution of $t = \dfrac{\overline{x} - \mu}{\frac{s}{\sqrt{n}}}$ has a $t$-distribution with $n - 1$ degrees of freedom.

Boundary statement: The formulas for test statistics do not appear explicitly on the AP Statistics Formula Sheet provided with the AP Statistics Exam. However, these formulas do not need to be memorized, as they can be constructed based on the general test statistic formula and the relevant standard error formulas that are provided on the formula sheet.

DAT-3
Significance testing allows us to make decisions about hypotheses within a particular context.

DAT-3.E
Interpret the $p$-value of a significance test for a population mean, including the mean difference between values in matched pairs. [Skill 4.B]

  • DAT-3.E.1 An interpretation of the $p$-value of a significance test for a population mean should recognize that the $p$-value is computed by assuming that the null hypothesis is true, i.e., by assuming that the true population mean is equal to the particular value stated in the null hypothesis.

DAT-3.F
Justify a claim about the population based on the results of a significance test for a population mean. [Skill 4.E]

  • DAT-3.F.1 A formal decision explicitly compares the $p$-value to the significance $\alpha$. If the $p$-value $\leq \alpha$, then reject the null hypothesis, $H_0 : \mu = \mu_0$. If the $p$-value $> \alpha$, then fail to reject the null hypothesis.
  • DAT-3.F.2 The results of a significance test for a population mean can serve as the statistical reasoning to support the answer to a research question about the population that was sampled.

来源:美国大学理事会 AP 课程与考试说明

从带 $df=n-1$$t$ 分布求 $p$ 值、与 $\alpha$ 比较,并在上下文里得出结论——拒绝或未能拒绝 $H_0$,然后陈述那对这个宣称意味着什么。展示检验名称、统计量、$df$$p$ 值。

探索

Read a p-value off the t curve

The p-value is the shaded tail area beyond your $t$ statistic — both tails for a two-tailed $H_a$. The dashed normal curve behind $t$ shows what you would have got by wrongly using $z$: at small df the $t$ tail is visibly fatter, so the true p-value is larger than the normal would suggest.

7.6

两个均值之差的置信区间

大纲
Enduring UnderstandingLearning ObjectiveEssential Knowledge

UNC-4
An interval of values should be used to estimate parameters, in order to account for uncertainty.

UNC-4.V
Identify an appropriate confidence interval procedure for a difference of two population means. [Skill 1.D]

  • UNC-4.V.1 Consider a simple random sample from population 1 of size $n_1$, mean $\mu_1$, and standard deviation $\sigma_1$ and a second simple random sample from population 2 of size $n_2$, mean $\mu_2$, and standard deviation $\sigma_2$. If the distributions of populations 1 and 2 are normal or if both $n_1$ and $n_2$ are greater than 30, then the sampling distribution of the difference of means, $\overline{x}_1 - \overline{x}_2$ is also normal. The mean for the sampling distribution of $\overline{x}_1 - \overline{x}_2$ is $\mu_1 - \mu_2$. The standard deviation of $\overline{x}_1 - \overline{x}_2$ is $\sqrt{\dfrac{(\sigma_1)^2}{n_1} + \dfrac{(\sigma_2)^2}{n_2}}$.
  • UNC-4.V.2 The appropriate confidence interval procedure for one quantitative variable for two independent samples is a two-sample $t$-interval for a difference between population means.

UNC-4.W
Verify the conditions to calculate confidence intervals for the difference of two population means. [Skill 4.C]

  • UNC-4.W.1 In order to calculate confidence intervals to estimate a difference of population means, we must check for independence and that the sampling distribution is approximately normal:
    • a. To check for independence:
      • i. Data should be collected using two independent, random samples or a randomized experiment.
      • ii. When sampling without replacement, check that $n_1 \leq 10\%N_1$ and $n_2 \leq 10\%N_2$.
    • b. To check that the sampling distribution of $(\overline{x}_1 - \overline{x}_2)$ should be approximately normal (shape):
      • i. If the observed distributions are skewed, both $n_1$ and $n_2$ should be greater than 30.

UNC-4.X
Determine the margin of error for the difference of two population means. [Skill 3.D]

  • UNC-4.X.1 For the difference of two sample means, the margin of error is the critical value ($t^*$) times the standard error ($SE$) of the difference of two means.
  • UNC-4.X.2 The standard error for the difference in two sample means with sample standard deviations, $s_1$ and $s_2$, is $\sqrt{\dfrac{(s_1)^2}{n_1} + \dfrac{(s_2)^2}{n_2}}$.

UNC-4.Y
Calculate an appropriate confidence interval for a difference of two population means. [Skill 3.D]

  • UNC-4.Y.1 The point estimate for the difference of two population means is the difference in sample means, $\overline{x}_1 - \overline{x}_2$.
  • UNC-4.Y.2 For a difference of two population means where the population standard deviations are not known, the confidence interval is $(\overline{x}_1 - \overline{x}_2) \pm t^* \sqrt{\dfrac{s_1^2}{n_1} + \dfrac{s_2^2}{n_2}}$ where $\pm t^*$ are the critical values for the central C% of a $t$-distribution with appropriate degrees of freedom that can be found using technology.

Boundary statement: Formulas for interval estimates do not appear explicitly on the AP Statistics Formula Sheet provided with the AP Statistics Exam. However, these formulas do not need to be memorized, as they can be constructed based on the general test statistic formula and the relevant standard error formulas that are provided on the formula sheet.

来源:美国大学理事会 AP 课程与考试说明

对于独立样本,估计 $\mu_1-\mu_2$:

$$(\bar{x}_1-\bar{x}_2)\pm t^{*}\sqrt{\frac{s_1^2}{n_1}+\frac{s_2^2}{n_2}}.$$
条件必须在两个样本里成立。(用技术求 $df$;在 AP 考试上不要合并方差。)

随机化支撑两组均值差检验中的公平比较
随机化支撑两组均值差检验中的公平比较
7.7

基于置信区间论证关于两个均值之差的结论

大纲
Enduring UnderstandingLearning ObjectiveEssential Knowledge

UNC-4
An interval of values should be used to estimate parameters, in order to account for uncertainty.

UNC-4.Z
Interpret a confidence interval for a difference of population means. [Skill 4.B]

  • UNC-4.Z.1 In repeated random sampling with the same sample size, approximately C% of confidence intervals created will capture the difference of population means.
  • UNC-4.Z.2 An interpretation for a confidence interval for the difference of two population means should include a reference to the samples taken and details about the populations they represent.
    • Illustrative examples for UNC-4.Z.2: For interpreting a confidence interval for a difference between mean response times for two fire stations (northern - southern): "Based on these samples, one can be 95 percent confident that the difference in the population mean response times (northern - southern) is between -2.37 minutes and 0.37 minutes" (2009 FRQ 4).

UNC-4.AA
Justify a claim based on a confidence interval for a difference of population means. [Skill 4.D]

  • UNC-4.AA.1 A confidence interval for a difference of population means provides an interval of values that may provide sufficient evidence to support a particular claim in context.

UNC-4.AB
Identify the effects of sample size on the width of a confidence interval for the difference of two means. [Skill 4.A]

  • UNC-4.AB.1 When all other things remain the same, the width of the confidence interval for the difference of two means tends to decrease as the sample sizes increase.

来源:美国大学理事会 AP 课程与考试说明

$\mu_1-\mu_2$ 的区间包含 $0$,数据与相等的均值一致;若它排除 $0$,有一个那个方向的差异的证据。在上下文里解释。

7.8

建立两个总体均值之差的检验

大纲
Enduring UnderstandingLearning ObjectiveEssential Knowledge

VAR-7
The $t$-distribution may be used to model variation.

VAR-7.F
Identify an appropriate selection of a testing method for a difference of two population means. [Skill 1.E]

  • VAR-7.F.1 For a quantitative variable, the appropriate test for a difference of two population means is a two-sample $t$-test for a difference of two population means.

VAR-7.G
Identify the null and alternative hypotheses for a difference of two population means. [Skill 1.F]

  • VAR-7.G.1 The null hypothesis for a two-sample $t$-test for a difference of two population means, $\mu_1$ and $\mu_2$, is: $H_0 : \mu_1 - \mu_2 = 0$, or $H_0 : \mu_1 = \mu_2$. The alternative hypothesis is $H_a : \mu_1 - \mu_2 < 0$, or $H_a : \mu_1 - \mu_2 > 0$, or $H_a : \mu_1 - \mu_2 \neq 0$, or $H_a : \mu_1 > \mu_2$, or $H_a : \mu_1 < \mu_2$, or $H_a : \mu_1 \neq \mu_2$.

VAR-7.H
Verify the conditions for the significance test for the difference of two population means. [Skill 4.C]

  • VAR-7.H.1 In order to make statistical inferences when testing a difference between population means, we must check for independence and that the sampling distribution is approximately normal:
    • a. Individual observations should be independent:
      • i. Data should be collected using simple random samples or a randomized experiment.
      • ii. When sampling without replacement, check that $n_1 \leq 10\%N_1$ and $n_2 \leq 10\%N_2$.
    • b. The sampling distribution of $\overline{x}_1 - \overline{x}_2$ should be approximately normal (shape).
      • i. If the observed distribution is skewed, both $n_1$ and $n_2$ should be greater than 30.
      • ii. If the sample size is less than 30, the distribution of the sample data should be free from strong skewness and outliers. This should be checked for BOTH samples.

来源:美国大学理事会 AP 课程与考试说明

假设:$H_0:\mu_1=\mu_2$$H_a:\mu_1\neq\mu_2$(或 $<,>$)。区分两个独立样本配对数据(paired data)——对配对数据(前/后、匹配的受试者),先取并对它们运行一个单样本 $t$ 程序。

词汇表 训练
英文 中文 拼音
paired data 配对数据 pèi duì shù jù
7.9

执行两个总体均值之差的检验

大纲
Enduring UnderstandingLearning ObjectiveEssential Knowledge

VAR-7
The $t$-distribution may be used to model variation.

VAR-7.I
Calculate an appropriate test statistic for a difference of two means. [Skill 3.E]

  • VAR-7.I.1 For a single quantitative variable, data collected using independent random samples or a randomized experiment from two populations, each of which can be modeled with a normal distribution, the sampling distribution of $t = \dfrac{(\overline{x}_1 - \overline{x}_2) - (\mu_1 - \mu_2)}{\sqrt{\dfrac{s_1^2}{n_1} + \dfrac{s_2^2}{n_2}}}$ is an approximate $t$-distribution with degrees of freedom that can be found using technology. The degrees of freedom fall between the smaller of $n_1 - 1$ and $n_2 - 1$ and $n_1 + n_2 - 2$.
    • Illustrative examples for VAR-7.I.1: In a study comparing mean recovery times for two surgical procedures to repair a torn anterior cruciate ligament (ACL), the group receiving one procedure had a sample size of 110, while the group receiving the other procedure had a sample size of 100. The degrees of freedom fall between 100 (the smaller of 110 and 100) and 208 (110 + 100 - 2). The degrees of freedom may be determined using technology. If the test statistic for this study is $t \approx 7.13$, then the $p$-value is the area greater than 7.13 for a $t$-distribution with $df = 207.18$ (2018 FRQ 4).

Boundary statement: The formulas for test statistics do not appear explicitly on the AP Statistics Formula Sheet provided with the AP Statistics Exam. However, these formulas do not need to be memorized, as they can be constructed based on the general test statistic formula and the standard error formulas for each of the relevant test statistics that are provided on the formula sheet.

DAT-3
Significance testing allows us to make decisions about hypotheses within a particular context.

DAT-3.G
Interpret the $p$-value of a significance test for a difference of population means. [Skill 4.B]

  • DAT-3.G.1 An interpretation of the $p$-value of a significance test for a two-sample difference of population means should recognize that the $p$-value is computed by assuming that the null hypothesis is true, i.e., by assuming that the true population means are equal to each other.

DAT-3.H
Justify a claim about the population based on the results of a significance test for a difference of two population means in context. [Skill 4.E]

  • DAT-3.H.1 A formal decision explicitly compares the $p$-value to the significance $\alpha$. If the $p$-value $\leq \alpha$, then reject the null hypothesis, $H_0 : \mu_1 - \mu_2 = 0$, or $H_0 : \mu_1 = \mu_2$. If the $p$-value $> \alpha$, then fail to reject the null hypothesis.
  • DAT-3.H.2 The results of a significance test for a two-sample test for a difference between two population means can serve as the statistical reasoning to support the answer to a research question about the populations that were sampled.

来源:美国大学理事会 AP 课程与考试说明

两样本 $t$ 统计量:

$$t=\frac{(\bar{x}_1-\bar{x}_2)-0}{\sqrt{\frac{s_1^2}{n_1}+\frac{s_2^2}{n_2}}}.$$
得到 $p$ 值(用技术求 $df$)、与 $\alpha$ 比较,在上下文里得出结论。

7.10

技能聚焦:选择、实施与表达推断方法

大纲

This topic is intended to focus on the skill of selecting an appropriate inference procedure, now that students have a range of options. Students should be given opportunities to practice when and how to apply all learning objectives relating to inference involving proportions or means.

来源:美国大学理事会 AP 课程与考试说明

最难的考试技能是选择正确的程序:一个还是两个样本?比例还是均值?配对还是独立?置信区间还是检验?读题弄清什么被估计或宣称,然后命名程序、检查它的条件、执行它,并用数字和上下文清楚地传达结论。

7.10

考试技巧

  • 对均值用 t 程序(总体 $\sigma$ 未知)——t 分布比正态有更重的尾。
  • 检查条件:随机、独立,以及大致正态(或大的 $n$)。
  • 在上下文里解释一个区间和一个检验,总是系于参数(真均值)。
  • 匹配正确的程序:单样本、两样本,或配对(寻找一个自然的配对)。
  • 陈述自由度;对一个双样本 $t$ 检验用技术给出的值(或手算时用保守的较小的 $n-1$)。

本主题的互动课程

逐步学习,并即时检测练习。

AP 统计学历年真题

AP 统计学的更多主题

登录或创建账号

IGCSE, A-Level & AP