跳到主要内容

抽样分布

AP 统计学 · 第 5 主题

训练
讲义 词汇表
5.1

统计学导论:为什么我的样本与你的不同?

大纲
Enduring UnderstandingLearning ObjectiveEssential Knowledge

VAR-1
Given that variation may be random or not, conclusions are uncertain.

VAR-1.G
Identify questions suggested by variation in statistics for samples collected from the same population. [Skill 1.A]

  • VAR-1.G.1 Variation in statistics for samples taken from the same population may be random or not.

来源:美国大学理事会 AP 课程与考试说明

一个统计量(statistic)(像一个样本均值 $\bar{x}$ 或样本比例 $\hat{p}$)从一个样本计算并变化——样本到样本——这是抽样变异(sampling variability)。一个参数(parameter)($\mu$$p$)是关于总体的固定真相。抽样分布(sampling distribution)是一个统计量在一个给定大小的所有可能样本上的分布——它是从一个样本到推断的桥梁。

词汇表 训练
英文 中文 拼音
statistic 统计量 tǒng jì liàng
sampling variability 抽样变异 chōu yàng biàn yì
parameter 参数 cān shù
sampling distribution 抽样分布 chōu yàng fēn bù
5.2

再探正态分布

大纲
Enduring UnderstandingLearning ObjectiveEssential Knowledge

VAR-6
The normal distribution may be used to model variation.

VAR-6.A
Calculate the probability that a particular value lies in a given interval of a normal distribution. [Skill 3.A]

  • VAR-6.A.1 A continuous random variable is a variable that can take on any value within a specified domain. Every interval within the domain has a probability associated with it.
  • VAR-6.A.2 A continuous random variable with a normal distribution is commonly used to describe populations. The distribution of a normal random variable can be described by a normal, or "bell-shaped," curve.
  • VAR-6.A.3 The area under a normal curve over a given interval represents the probability that a particular value lies in that interval.
    • Illustrative examples for VAR-6.A: Continuous random variable: If one looks at a clock at a random time, the probability that the minute hand is between the 3 and the 6 is one fourth.

VAR-6.B
Determine the interval associated with a given area in a normal distribution. [Skill 3.A]

  • VAR-6.B.1 The boundaries of an interval associated with a given area in a normal distribution can be determined using $z$-scores or technology, such as a calculator, a standard normal table, or computer-generated output.
  • VAR-6.B.2 Intervals associated with a given area in a normal distribution can be determined by assigning appropriate inequalities to the boundaries of the intervals:
    • a. $P(X < x_a) = \dfrac{p}{100}$ means that the lowest $p\%$ of values lie to the left of $x_a$.
    • b. $P(x_a < X < x_b) = \dfrac{p}{100}$ means that $p\%$ of values lie between $x_a$ and $x_b$.
    • c. $P(X > x_b) = \dfrac{p}{100}$ means that the highest $p\%$ of values lie to the right of $x_b$.
    • d. To determine the most extreme $p\%$ of values requires dividing the area associated with $p\%$ into two equal areas on either extreme of the distribution: $P(X < x_a) = \dfrac{1}{2}\dfrac{p}{100}$ and $P(X > x_b) = \dfrac{1}{2}\dfrac{p}{100}$ means that half of the $p\%$ most extreme values lie to the left of $x_a$ and half of the $p\%$ most extreme values lie to the right of $x_b$.

VAR-6.C
Determine the appropriateness of using the normal distribution to approximate probabilities for unknown distributions. [Skill 3.C]

  • VAR-6.C.1 Normal distributions are symmetrical and "bell-shaped." As a result, normal distributions can be used to approximate distributions with similar characteristics.

来源:美国大学理事会 AP 课程与考试说明

正态分布

对于足够大的样本,许多抽样分布近似正态。那让我们能用一个中心(它的均值)、一个散布(它的标准误(standard error))和一个正态形状描述一个统计量——然后计算一个给定的样本结果有多可能。

探索

Use the normal curve to find a proportion

A normal model turns a range of values into an area = a proportion. Shade a band to read off the fraction of samples falling within it (the 68-95-99.7 rule).

词汇表 训练
英文 中文 拼音
standard error 标准误 biāo zhǔn wù
5.3

中心极限定理

大纲
Enduring UnderstandingLearning ObjectiveEssential Knowledge

UNC-3
Probabilistic reasoning allows us to anticipate patterns in data.

UNC-3.H
Estimate sampling distributions using simulation. [Skill 3.C]

  • UNC-3.H.1 A sampling distribution of a statistic is the distribution of values for the statistic for all possible samples of a given size from a given population.
  • UNC-3.H.2 The central limit theorem (CLT) states that when the sample size is sufficiently large, a sampling distribution of the mean of a random variable will be approximately normally distributed.
  • UNC-3.H.3 The central limit theorem requires that the sample values are independent of each other and that $n$ is sufficiently large.
  • UNC-3.H.4 A randomization distribution is a collection of statistics generated by simulation assuming known values for the parameters. For a randomized experiment, this means repeatedly randomly reallocating/reassigning the response values to treatment groups.
  • UNC-3.H.5 The sampling distribution of a statistic can be simulated by generating repeated random samples from a population.

来源:美国大学理事会 AP 课程与考试说明

中心极限定理

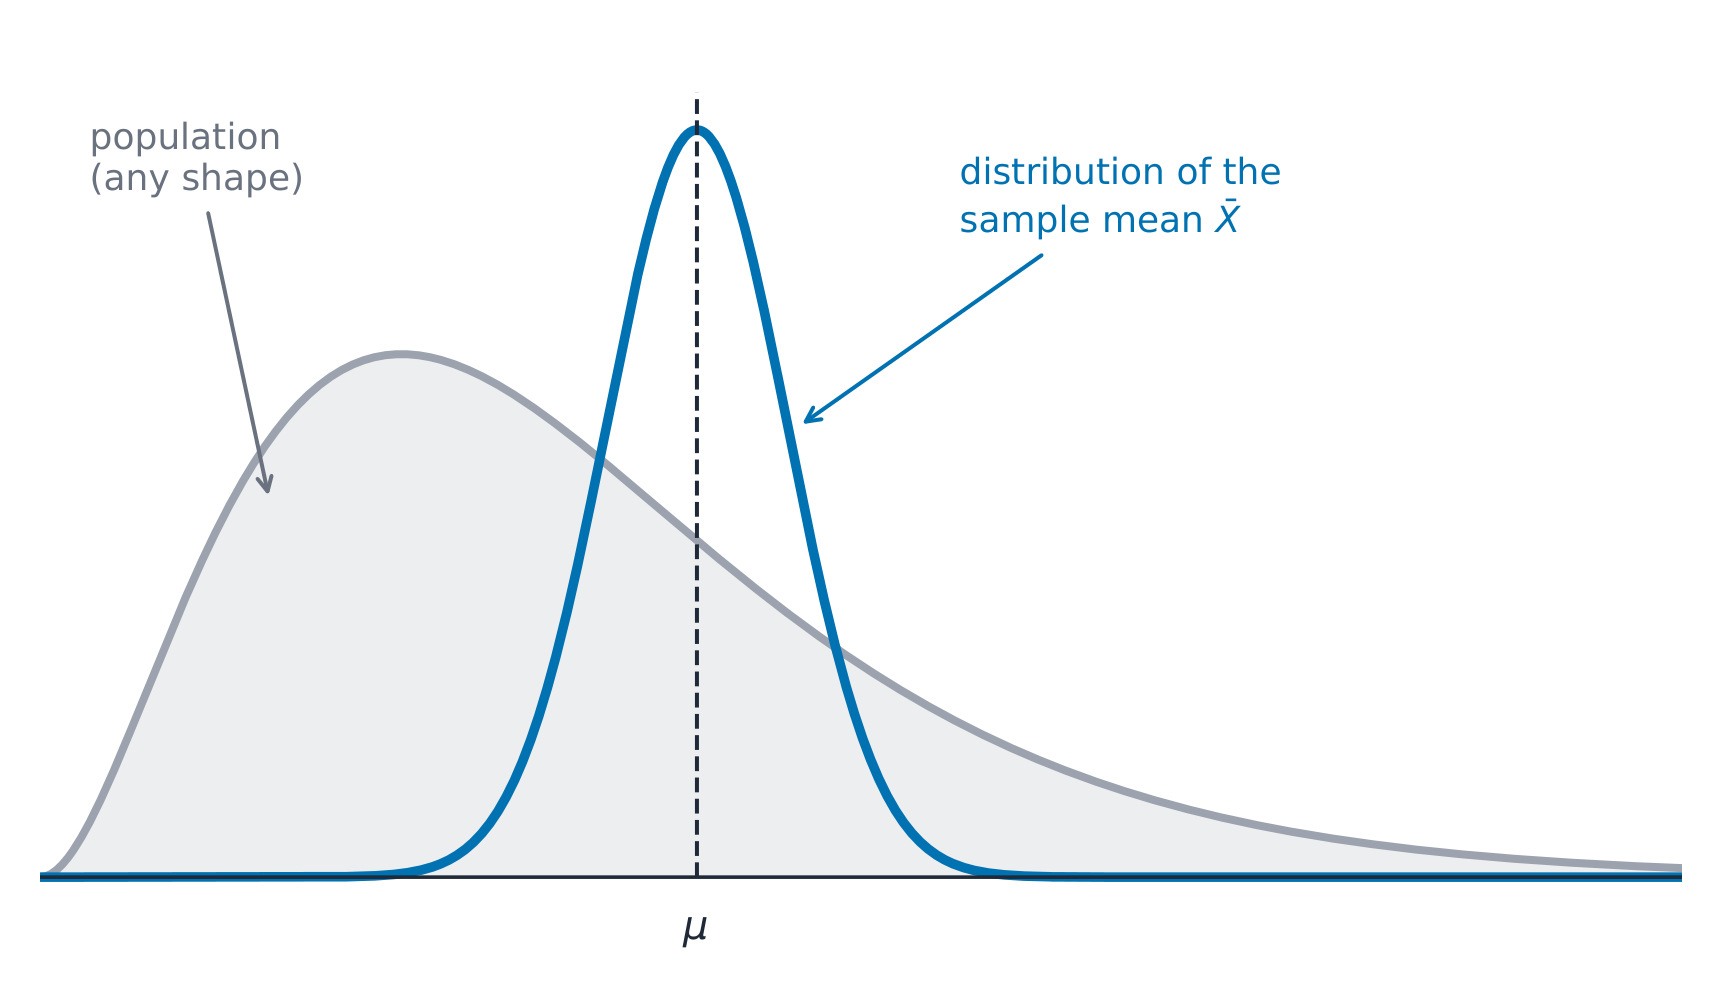
中心极限定理(Central Limit Theorem,CLT):对于一个样本均值,若样本量 $n$ 足够大(一个常见规则是 $n\ge 30$),$\bar{x}$ 的抽样分布近似正态,无论总体的形状。$n$ 越大,越正态而分布越紧。

The sample mean is nearly normal whatever the shape of the population
无论总体的形状如何样本均值都几乎正态
探索

Watch a sampling distribution turn normal

The Central Limit Theorem: for a large enough sample, the distribution of the sample mean is approximately normal — whatever the shape of the population.

词汇表 训练
英文 中文 拼音
Central Limit Theorem 中心极限定理 zhōng xīn jí xiàn dìng lǐ
练习卷
5.4

有偏与无偏点估计

大纲
Enduring UnderstandingLearning ObjectiveEssential Knowledge

UNC-3
Probabilistic reasoning allows us to anticipate patterns in data.

UNC-3.I
Explain why an estimator is or is not unbiased. [Skill 4.B]

  • UNC-3.I.1 When estimating a population parameter, an estimator is unbiased if, on average, the value of the estimator is equal to the population parameter.

UNC-3.J
Calculate estimates for a population parameter. [Skill 3.B]

  • UNC-3.J.1 When estimating a population parameter, an estimator exhibits variability that can be modeled using probability.
  • UNC-3.J.2 A sample statistic is a point estimator of the corresponding population parameter.

来源:美国大学理事会 AP 课程与考试说明

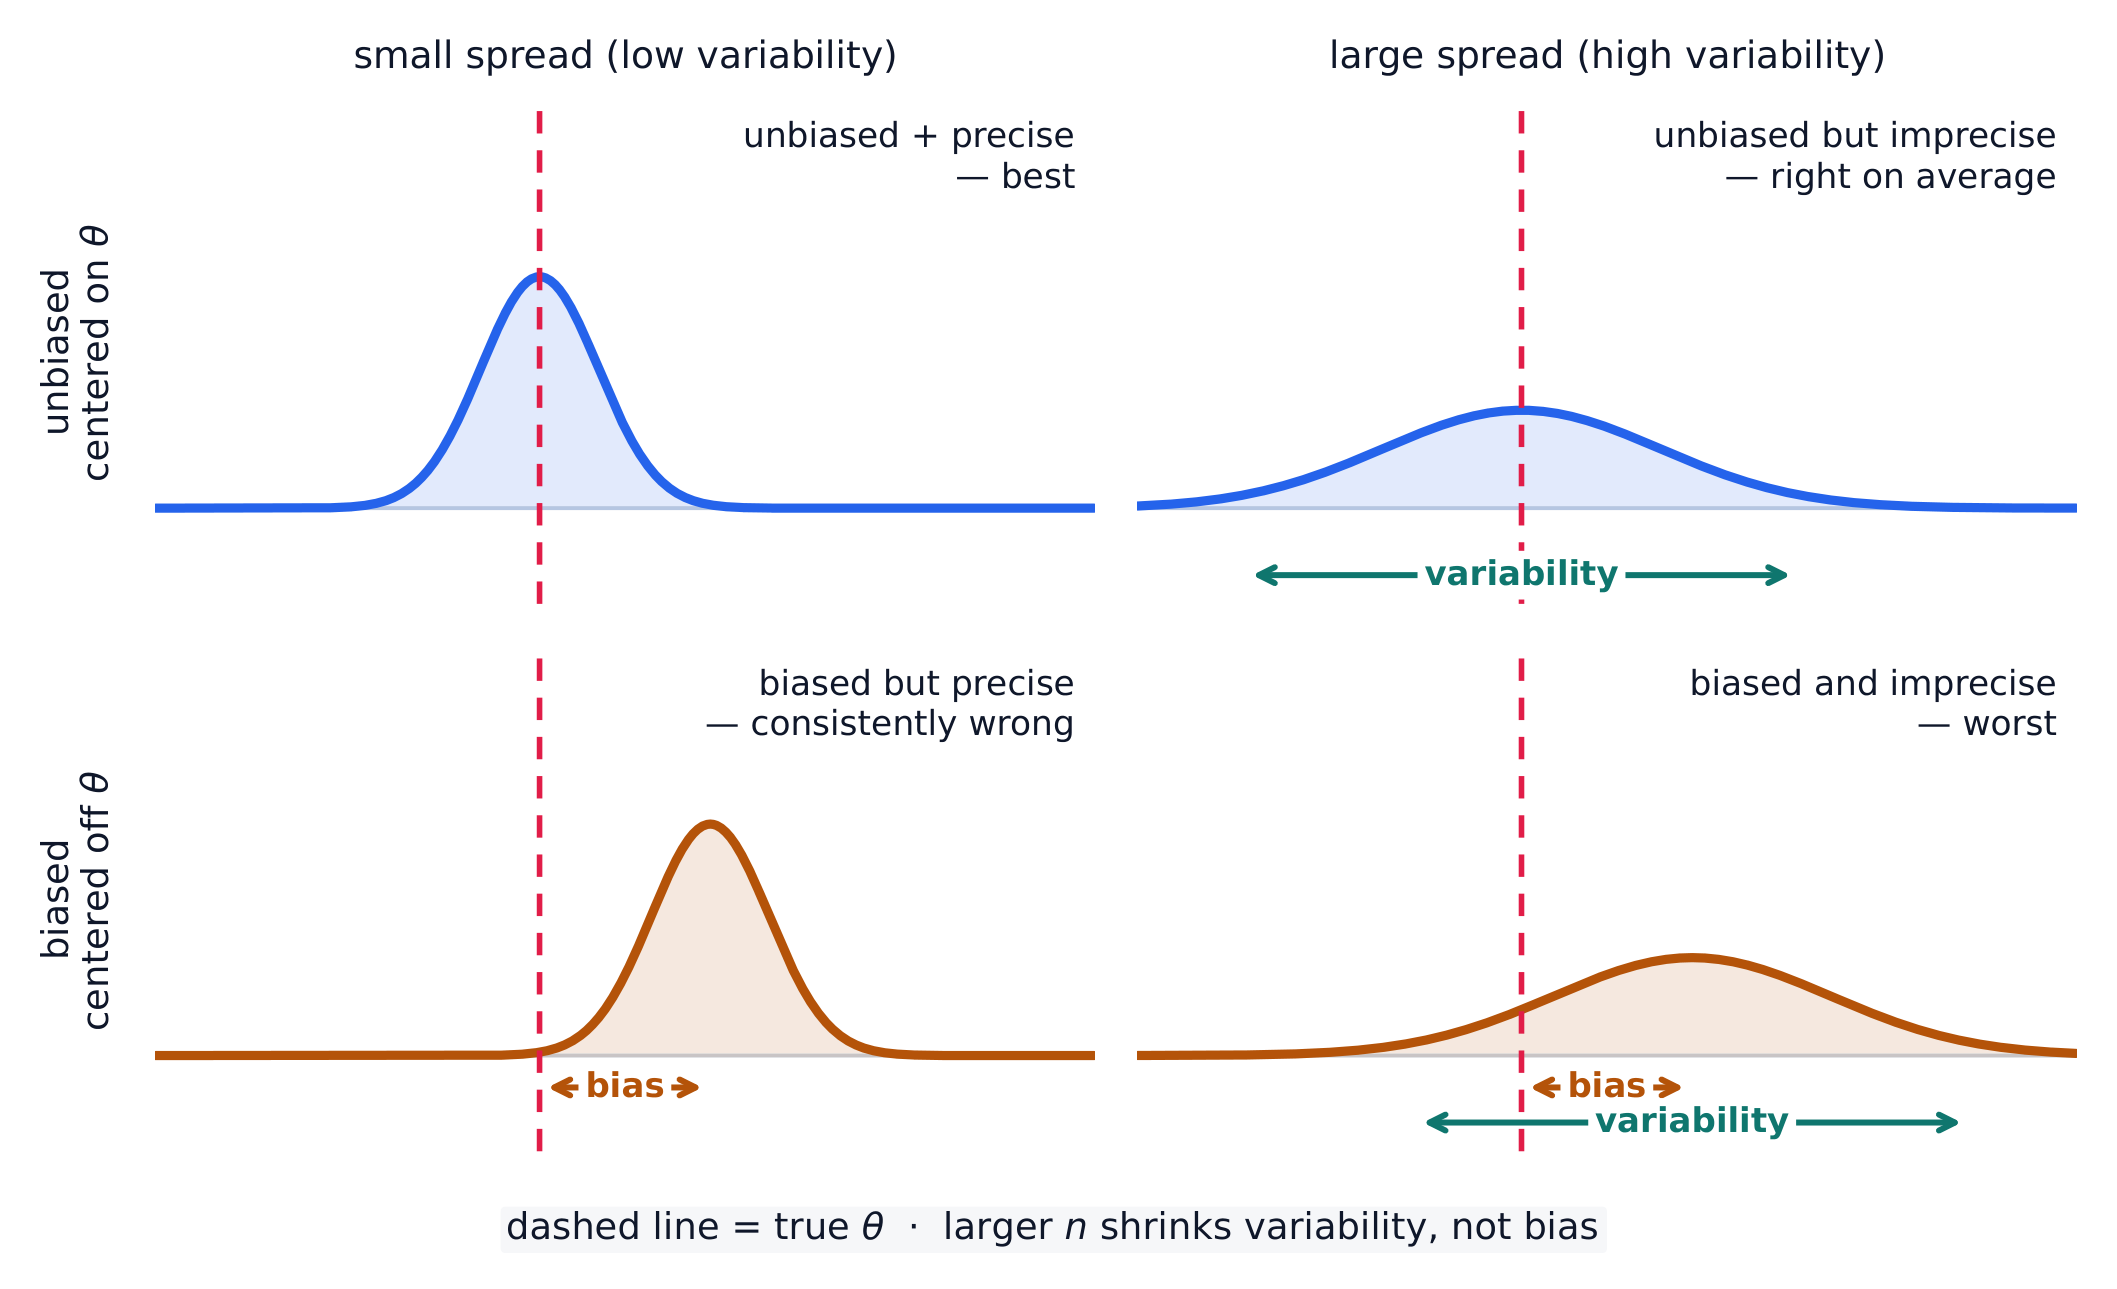
一个统计量是无偏(unbiased)的,若它的抽样分布的均值等于这个参数——它平均而言正确。偏差是关于中心偏了;变异性(variability)是关于散布。一个好的估计量既无偏(中心正确)又低变异性(精确);更大的样本减少变异性但不修复来自差劲抽样的偏差。

Four sampling distributions crossing bias with variability, against the true parameter
偏差和变异性是两种不同的毛病。只有左上的估计量既以 $\theta$ 为中心又很集中;左下的那个虽然精确却一贯错误,再多的数据也修复不了。
词汇表 训练
英文 中文 拼音
unbiased 无偏 wú piān
5.5

样本比例的抽样分布

大纲
Enduring UnderstandingLearning ObjectiveEssential Knowledge

UNC-3
Probabilistic reasoning allows us to anticipate patterns in data.

UNC-3.K
Determine parameters of a sampling distribution for sample proportions. [Skill 3.B]

  • UNC-3.K.1 For independent samples (sampling with replacement) of a categorical variable from a population with population proportion, $p$, the sampling distribution of the sample proportion, $\hat{p}$, has a mean, $\mu_{\hat{p}} = p$ and a standard deviation, $\sigma_{\hat{p}} = \sqrt{\dfrac{p(1-p)}{n}}$.
  • UNC-3.K.2 If sampling without replacement, the standard deviation of the sample proportion is smaller than what is given by the formula above. If the sample size is less than 10% of the population size, the difference is negligible.

UNC-3.L
Determine whether a sampling distribution for a sample proportion can be described as approximately normal. [Skill 3.C]

  • UNC-3.L.1 For a categorical variable, the sampling distribution of the sample proportion, $\hat{p}$, will have an approximate normal distribution, provided the sample size is large enough: $np \geq 10$ and $n(1-p) \geq 10$

UNC-3.M
Interpret probabilities and parameters for a sampling distribution for a sample proportion. [Skill 4.B]

  • UNC-3.M.1 Probabilities and parameters for a sampling distribution for a sample proportion should be interpreted using appropriate units and within the context of a specific population.

来源:美国大学理事会 AP 课程与考试说明

对于来自一个 SRS 的样本比例 $\hat{p}$:均值是 $p$(无偏),而标准差是

$$\sigma_{\hat p}=\sqrt{\frac{p(1-p)}{n}}.$$
这个散布有两个名字:它是抽样分布的标准差;一旦你必须从样本估计它(用 $\hat p$ 代替 $p$),它就叫标准误——这正是后面的推断单元所做的。 它在 $np\ge 10$$n(1-p)\ge 10$(大计数(Large Counts)条件)时近似正态,而 $10\%$ 条件($n\le 0.10N$)使观测保持近独立。

Worked example. 假设 $40\%$ 的选民赞成一项措施($p=0.4$)而你抽样 $n=100$。标准误是 $\sigma_{\hat p}=\sqrt{\dfrac{0.4(0.6)}{100}}=0.049$。一个样本给出 $\hat{p}>0.5$ 的机会是 $z=\dfrac{0.5-0.4}{0.049}=2.04$,所以 $P(\hat p>0.5)\approx0.02$ ——样本里的一个多数会令人惊讶。

5.6

样本比例之差的抽样分布

大纲
Enduring UnderstandingLearning ObjectiveEssential Knowledge

UNC-3
Probabilistic reasoning allows us to anticipate patterns in data.

UNC-3.N
Determine parameters of a sampling distribution for a difference in sample proportions. [Skill 3.B]

  • UNC-3.N.1 For a categorical variable, when randomly sampling with replacement from two independent populations with population proportions $p_1$ and $p_2$, the sampling distribution of the difference in sample proportions $\hat{p}_1 - \hat{p}_2$ has mean, $\mu_{\hat{p}_1 - \hat{p}_2} = p_1 - p_2$ and standard deviation, $\sigma_{\hat{p}_1 - \hat{p}_2} = \sqrt{\dfrac{p_1(1-p_1)}{n_1} + \dfrac{p_2(1-p_2)}{n_2}}$.
  • UNC-3.N.2 If sampling without replacement, the standard deviation of the difference in sample proportions is smaller than what is given by the formula above. If the sample sizes are less than 10% of the population sizes, the difference is negligible.

UNC-3.O
Determine whether a sampling distribution for a difference of sample proportions can be described as approximately normal. [Skill 3.C]

  • UNC-3.O.1 The sampling distribution of the difference in sample proportions $\hat{p}_1 - \hat{p}_2$ will have an approximate normal distribution provided the sample sizes are large enough: $n_1 p_1 \geq 10, n_1(1-p_1) \geq 10, n_2 p_2 \geq 10, n_2(1-p_2) \geq 10$.

UNC-3.P
Interpret probabilities and parameters for a sampling distribution for a difference in proportions. [Skill 4.B]

  • UNC-3.P.1 Parameters for a sampling distribution for a difference of proportions should be interpreted using appropriate units and within the context of a specific populations.

来源:美国大学理事会 AP 课程与考试说明

对于来自两个独立样本的 $\hat{p}_1-\hat{p}_2$:均值是 $p_1-p_2$,而因为样本独立方差相加:

$$\sigma_{\hat p_1-\hat p_2}=\sqrt{\frac{p_1(1-p_1)}{n_1}+\frac{p_2(1-p_2)}{n_2}}.$$
它在大计数条件在两个样本里都成立时近似正态。

5.7

样本均值的抽样分布
大纲
Enduring UnderstandingLearning ObjectiveEssential Knowledge

UNC-3
Probabilistic reasoning allows us to anticipate patterns in data.

UNC-3.Q
Determine parameters for a sampling distribution for sample means. [Skill 3.B]

  • UNC-3.Q.1 For a numerical variable, when random sampling with replacement from a population with mean $\mu$ and standard deviation, $\sigma$, the sampling distribution of the sample mean has mean $\mu_{\bar{x}} = \mu$ and standard deviation $\sigma_{\bar{x}} = \dfrac{\sigma}{\sqrt{n}}$.
  • UNC-3.Q.2 If sampling without replacement, the standard deviation of the sample mean is smaller than what is given by the formula above. If the sample size is less than 10% of the population size, the difference is negligible.

UNC-3.R
Determine whether a sampling distribution of a sample mean can be described as approximately normal. [Skill 3.C]

  • UNC-3.R.1 For a numerical variable, if the population distribution can be modeled with a normal distribution, the sampling distribution of the sample mean, $\bar{x}$, can be modeled with a normal distribution.
  • UNC-3.R.2 For a numerical variable, if the population distribution cannot be modeled with a normal distribution, the sampling distribution of the sample mean, $\bar{x}$, can be modeled approximately by a normal distribution, provided the sample size is large enough, e.g., greater than or equal to 30.

UNC-3.S
Interpret probabilities and parameters for a sampling distribution for a sample mean. [Skill 4.B]

  • UNC-3.S.1 Probabilities and parameters for a sampling distribution for a sample mean should be interpreted using appropriate units and within the context of a specific population.

来源:美国大学理事会 AP 课程与考试说明

对于来自一个 SRS 的样本均值 $\bar{x}$:均值是 $\mu$(无偏),而标准差是

$$\sigma_{\bar x}=\frac{\sigma}{\sqrt{n}}.$$
它的形状是正态的,若总体是正态的,或对大的 $n$ 由 CLT 近似正态。注意散布像 $\sqrt{n}$ 那样缩小——把样本变四倍使标准误减半。

Worked example. 一个总体有 $\mu=70$$\sigma=12$。对于 $n=36$ 的样本,$\bar{x}$ 的抽样分布以 $70$ 为中心带标准误 $\dfrac{12}{\sqrt{36}}=2$。一个样本均值超过 $73$ 的机会是 $z=\dfrac{73-70}{2}=1.5$,所以 $P(\bar x>73)\approx0.067$

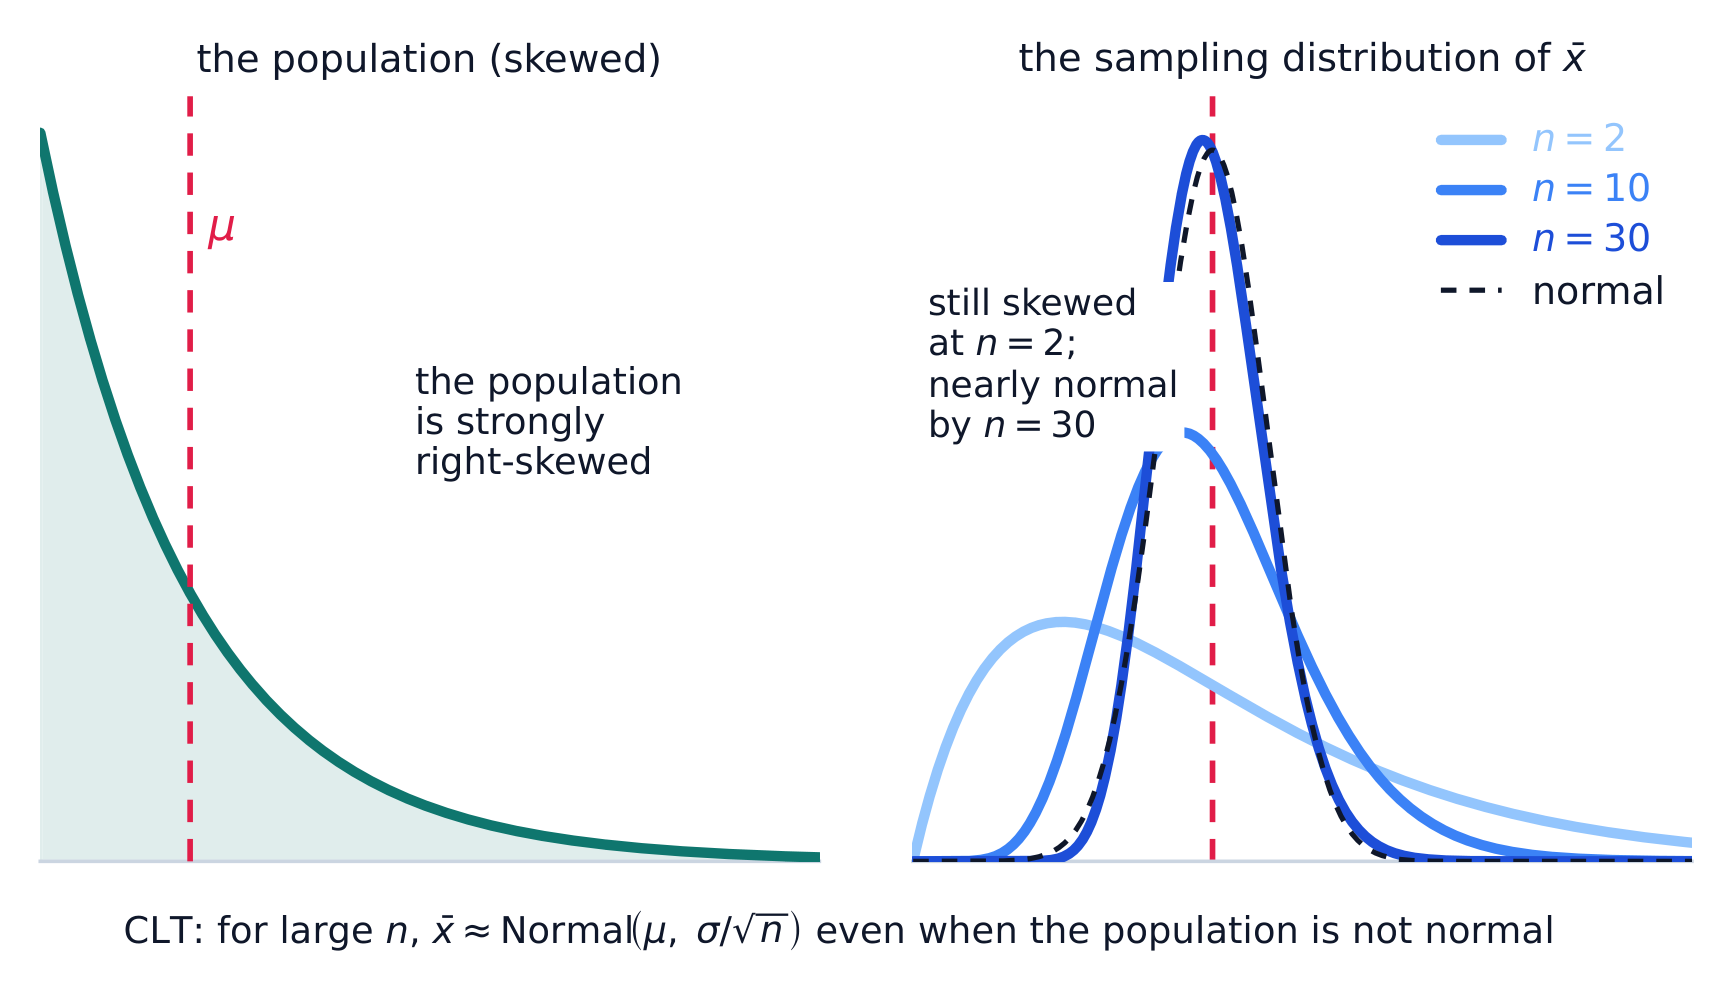
The sampling distribution of the mean narrows and becomes more normal as n grows
左边的总体强烈偏斜,但 $\bar{x}$ 的每个抽样分布都以 $\mu$ 为中心。更大的 $n$ 使标准误 $\sigma/\sqrt{n}$ 更小,所以曲线更高更窄——而且也更对称:在 $n=2$ 时仍明显偏斜,到 $n=30$ 时几乎正好是正态(虚线)。
练习卷
5.8

样本均值之差的抽样分布

大纲
Enduring UnderstandingLearning ObjectiveEssential Knowledge

UNC-3
Probabilistic reasoning allows us to anticipate patterns in data.

UNC-3.T
Determine parameters of a sampling distribution for a difference in sample means. [Skill 3.B]

  • UNC-3.T.1 For a numerical variable, when randomly sampling with replacement from two independent populations with population means $\mu_1$ and $\mu_2$ and population standard deviations $\sigma_1$ and $\sigma_2$, the sampling distribution of the difference in sample means $\bar{x}_1 - \bar{x}_2$ has mean $\mu_{(\bar{x}_1 - \bar{x}_2)} = \mu_1 - \mu_2$ and standard deviation, $\sigma_{(\bar{x}_1 - \bar{x}_2)} = \sqrt{\dfrac{\sigma_1^2}{n_1} + \dfrac{\sigma_2^2}{n_2}}$.
  • UNC-3.T.2 If sampling without replacement, the standard deviation of the difference in sample means is smaller than what is given by the formula above. If the sample sizes are less than 10% of the population sizes, the difference is negligible.

UNC-3.U
Determine whether a sampling distribution of a difference in sample means can be described as approximately normal. [Skill 3.C]

  • UNC-3.U.1 The sampling distribution of the difference in sample means $\bar{x}_1 - \bar{x}_2$ can be modeled with a normal distribution if the two population distributions can be modeled with a normal distribution.
  • UNC-3.U.2 The sampling distribution of the difference in sample means $\bar{x}_1 - \bar{x}_2$ can be modeled approximately by a normal distribution if the two population distributions cannot be modeled with a normal distribution but both sample sizes are greater than or equal to 30.

UNC-3.V
Interpret probabilities and parameters for a sampling distribution for a difference in sample means. [Skill 4.B]

  • UNC-3.V.1 Probabilities and parameters for a sampling distribution for a difference of sample means should be interpreted using appropriate units and within the context of a specific populations.

来源:美国大学理事会 AP 课程与考试说明

对于来自两个独立样本的 $\bar{x}_1-\bar{x}_2$:均值是 $\mu_1-\mu_2$,而(独立,所以方差相加)

$$\sigma_{\bar x_1-\bar x_2}=\sqrt{\frac{\sigma_1^2}{n_1}+\frac{\sigma_2^2}{n_2}}.$$
这是下面几个单元里两样本推断的基础。

5.8

考试技巧

  • 一个抽样分布是一个统计量在许多样本上的分布,以真参数为中心
  • 中心极限定理:对于一个足够大的样本样本均值近似正态,即使总体不是。
  • 更大的样本给更少的变异性(一个更小的标准误)。
  • 在用一个正态模型前检查条件(随机、独立/10%、足够大)。
  • 弄清什么变化——统计量——对固定参数。

本主题的互动课程

逐步学习,并即时检测练习。

AP 统计学历年真题

AP 统计学的更多主题

登录或创建账号

IGCSE, A-Level & AP