| Enduring Understanding | Learning Objective | Essential Knowledge |
|---|---|---|
VAR-1 | VAR-1.J |
|
Inference for Categorical Data: Chi-Square
AP Statistics · Topic 8
 7:49
7:49
Inference for Categorical Data: Chi-Square
Roll a fair die sixty times. Every face should come up ten times. But it never does — eight here, thirteen there. The gaps are always there. So roll another…
English narration · English + 中文 subtitles burned in
8.1
Are My Results Unexpected?
Syllabus
Source: College Board AP Course and Exam Description
When data are counts spread across several categories, we test whether the observed counts differ from what a claim predicts. The tool is the chi-square 卡方 ($\chi^2$) statistic, which adds up the standardized gaps between observed and expected counts:
$$\chi^2=\sum \frac{(\text{observed}-\text{expected})^2}{\text{expected}}.$$
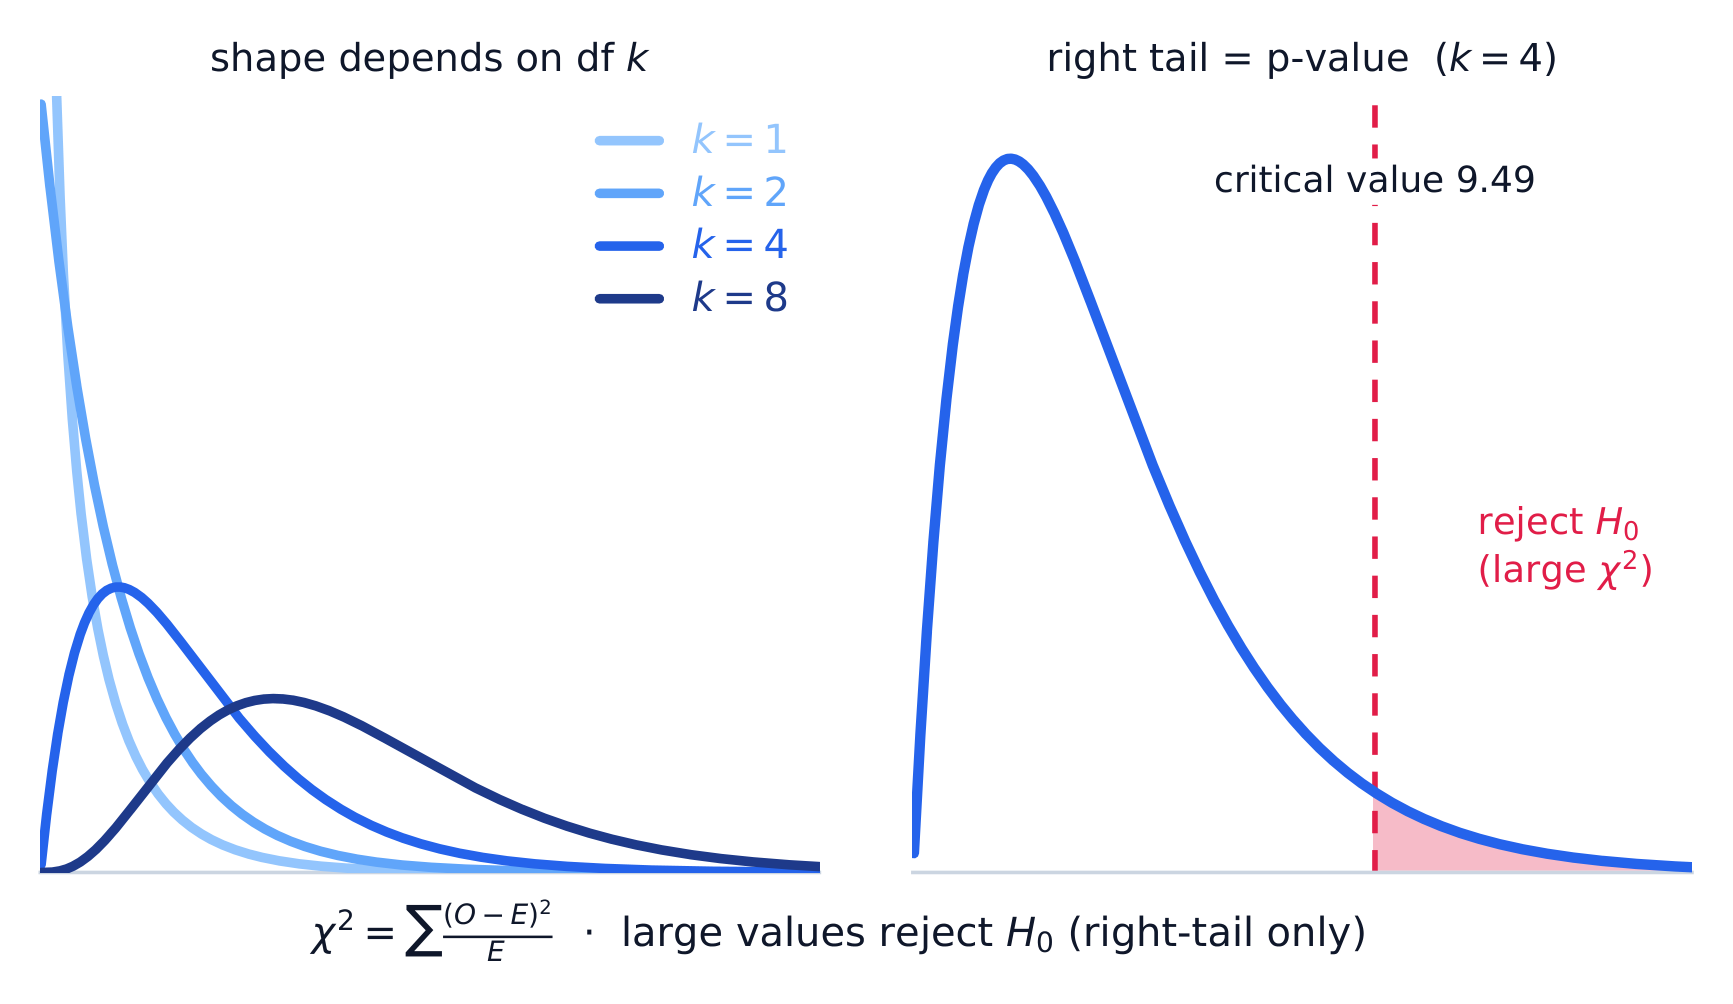
A large $\chi^2$ means the observed counts are far from expected – evidence against the claim. The chi-square distribution is right-skewed and depends on its degrees of freedom 自由度.
Vocabulary
Train
| English |
|---|
| chi-square/kaɪ skweə/ |
| degrees of freedom/dɪˈɡriːz ɒv ˈfriːdəm/ |
8.2
Setting Up a Goodness-of-Fit Test
Syllabus
| Enduring Understanding | Learning Objective | Essential Knowledge |
|---|---|---|
VAR-8 | VAR-8.A |
|
VAR-8.B |
| |
VAR-8.C |
| |
VAR-8.D |
| |
VAR-8.E |
|
Source: College Board AP Course and Exam Description
A goodness-of-fit (GOF) 拟合优度 test checks whether one categorical variable follows a claimed distribution (e.g. "the die is fair"). Hypotheses:
$$H_0:\text{the distribution is as claimed}\qquad H_a:\text{at least one proportion differs}.$$
Expected count for each category $=n\times(\text{claimed proportion})$. Conditions: random sample, all expected counts $\ge 5$, and the 10% condition.
Vocabulary
Train
| English |
|---|
| goodness-of-fit (GOF)/ˈɡʊdnəs ɒv fɪt/ |
8.3
Carrying Out a Goodness-of-Fit Test
Syllabus
| Enduring Understanding | Learning Objective | Essential Knowledge |
|---|---|---|
VAR-8 | VAR-8.F |
|
VAR-8.G |
| |
DAT-3 | DAT-3.I |
|
DAT-3.J |
|
Source: College Board AP Course and Exam Description
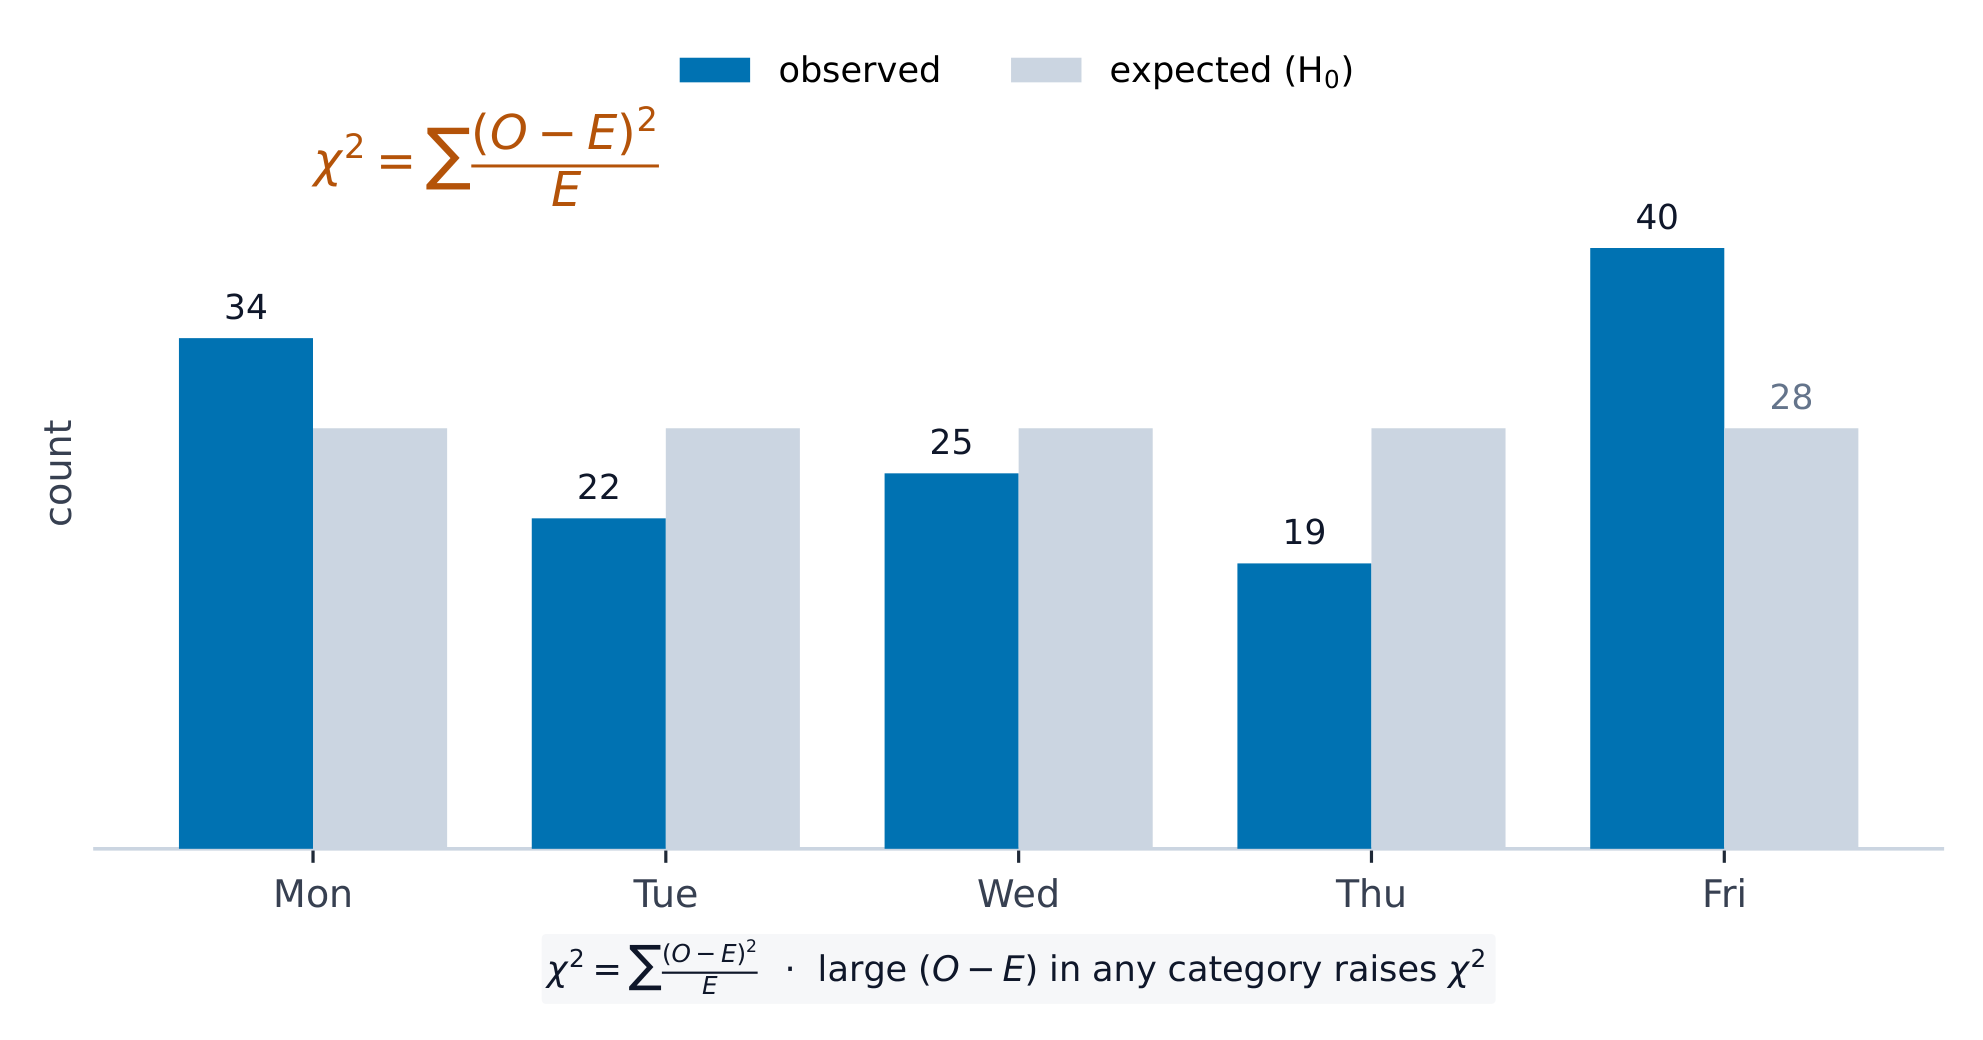
Compute $\chi^2=\sum\dfrac{(O-E)^2}{E}$ with $df=(\text{number of categories})-1$. Find the $p$-value from the chi-square distribution (upper tail), compare to $\alpha$, and conclude in context. A large component of the sum points to the category that deviates most.
Worked example. A die rolled $60$ times gives counts $8,10,12,9,11,10$. If it is fair, each expected count is $60/6=10$, so
$$\chi^2=\frac{(8-10)^2}{10}+\frac{(10-10)^2}{10}+\frac{(12-10)^2}{10}+\frac{(9-10)^2}{10}+\frac{(11-10)^2}{10}+\frac{(10-10)^2}{10}=0.4+0+0.4+0.1+0.1+0=1.0,$$
with $df=6-1=5$. Write out every category, including the two that match their expected count exactly and so add $0$ – the sum runs over all six categories, and $df$ counts categories, not just the ones that differ. This $\chi^2$ is small (a large $p$-value), so we fail to reject $H_0$ – no evidence the die is unfair.
Explore
Explore the chi-square distribution and its p-value
The p-value is the area in the right tail beyond your test statistic, so a larger $\chi^2$ means a smaller p-value. Drag $\chi^2$ to watch that area shrink, and drag df to see the whole family change shape — strongly right-skewed at small df, more symmetric as df grows.
8.4
Expected Counts in Two-Way Tables
Syllabus
| Enduring Understanding | Learning Objective | Essential Knowledge |
|---|---|---|
VAR-8 | VAR-8.H |
|
Source: College Board AP Course and Exam Description
For a two-way table, the expected count in a cell (under "no association") is
$$E=\frac{(\text{row total})\times(\text{column total})}{\text{grand total}}.$$
This is the count you would see if the row and column variables were unrelated.
Worked example. In a two-way table a cell's row total is $40$, its column total is $50$, and the grand total is $200$. Its expected count is $E=\dfrac{40\times50}{200}=10$. Repeating for every cell gives the expected table to compare against the observed one.
8.5
Homogeneity or Independence?
Syllabus
| Enduring Understanding | Learning Objective | Essential Knowledge |
|---|---|---|
VAR-8 | VAR-8.I |
|
VAR-8.J |
| |
VAR-8.K |
|
Source: College Board AP Course and Exam Description
Two tests use the same $\chi^2$ math but answer different questions:
- Test for homogeneity 同质性: are the distributions of one categorical variable the same across several populations or groups (separate samples/treatments)?
- Test for independence 独立性: are two categorical variables associated within a single population (one sample, two variables measured)?
The design (several samples vs one sample) decides which name and hypotheses to use.
Vocabulary
Train
| English |
|---|
| Test for homogeneity/test fɔː ˈhɒməʊdʒneɪti/ |
| Test for independence/test fɔː ˌɪndɪˈpendəns/ |
8.6
Carrying Out a Test for Homogeneity or Independence
Syllabus
| Enduring Understanding | Learning Objective | Essential Knowledge |
|---|---|---|
VAR-8 | VAR-8.L |
|
VAR-8.M |
| |
DAT-3 | DAT-3.K |
|
DAT-3.L |
|
Source: College Board AP Course and Exam Description
Compute expected counts, then $\chi^2=\sum\dfrac{(O-E)^2}{E}$ over all cells, with
$$df=(\text{rows}-1)(\text{columns}-1).$$
Conditions: random data, all expected counts $\ge 5$, 10% condition. Find the $p$-value, compare to $\alpha$, and conclude in context – evidence of a difference between groups (homogeneity) or of an association (independence).
8.7
Choosing the Right Categorical Procedure
Syllabus
This topic is intended to focus on the skill of selecting an appropriate inference procedure now that students have a range of options. Students should be given opportunities to practice when and how to apply all learning objectives relating to inference for categorical data.
Source: College Board AP Course and Exam Description
Decide by the setup: one categorical variable against a claimed distribution $\Rightarrow$ goodness-of-fit; one sample cross-classified by two variables $\Rightarrow$ independence; several samples/groups compared $\Rightarrow$ homogeneity. Comparing just two proportions can use either a two-proportion $z$-test or a chi-square test, but only for a two-tailed alternative, where they agree exactly ($\chi^2=z^2$). A chi-square test is always two-tailed, so it cannot give a directional conclusion: if $H_a$ is one-tailed (say $p_1>p_2$), use the $z$-test.
Explore
Which chi-square test is this?
All three tests use the same $\chi^2$ arithmetic, so the marks are won by naming the right one. The design decides — how many samples were taken, and how many variables were measured on each unit.
8.7
Exam tips
- Use $\chi^2=\sum\tfrac{(O-E)^2}{E}$ for categorical data; always divide by the expected count.
- Pick the right test: goodness-of-fit (one variable), independence, or homogeneity (two-way table).
- Compute expected counts as $\tfrac{\text{row total}\times\text{column total}}{\text{grand total}}$ and check each is $\ge5$.
- A large $\chi^2$ (small p-value) means observed counts differ from expected by more than chance.
- State degrees of freedom correctly (categories $-1$, or $(r-1)(c-1)$).
Interactive lessons on this topic
Work through it step by step, with instant-check exercises.