| Enduring Understanding | Learning Objective | Essential Knowledge |
|---|---|---|
VAR-1 | VAR-1.K |
|
Inference for Quantitative Data: Slopes
AP Statistics · Topic 9
 7:59
7:59
Inference for Quantitative Data: Slopes
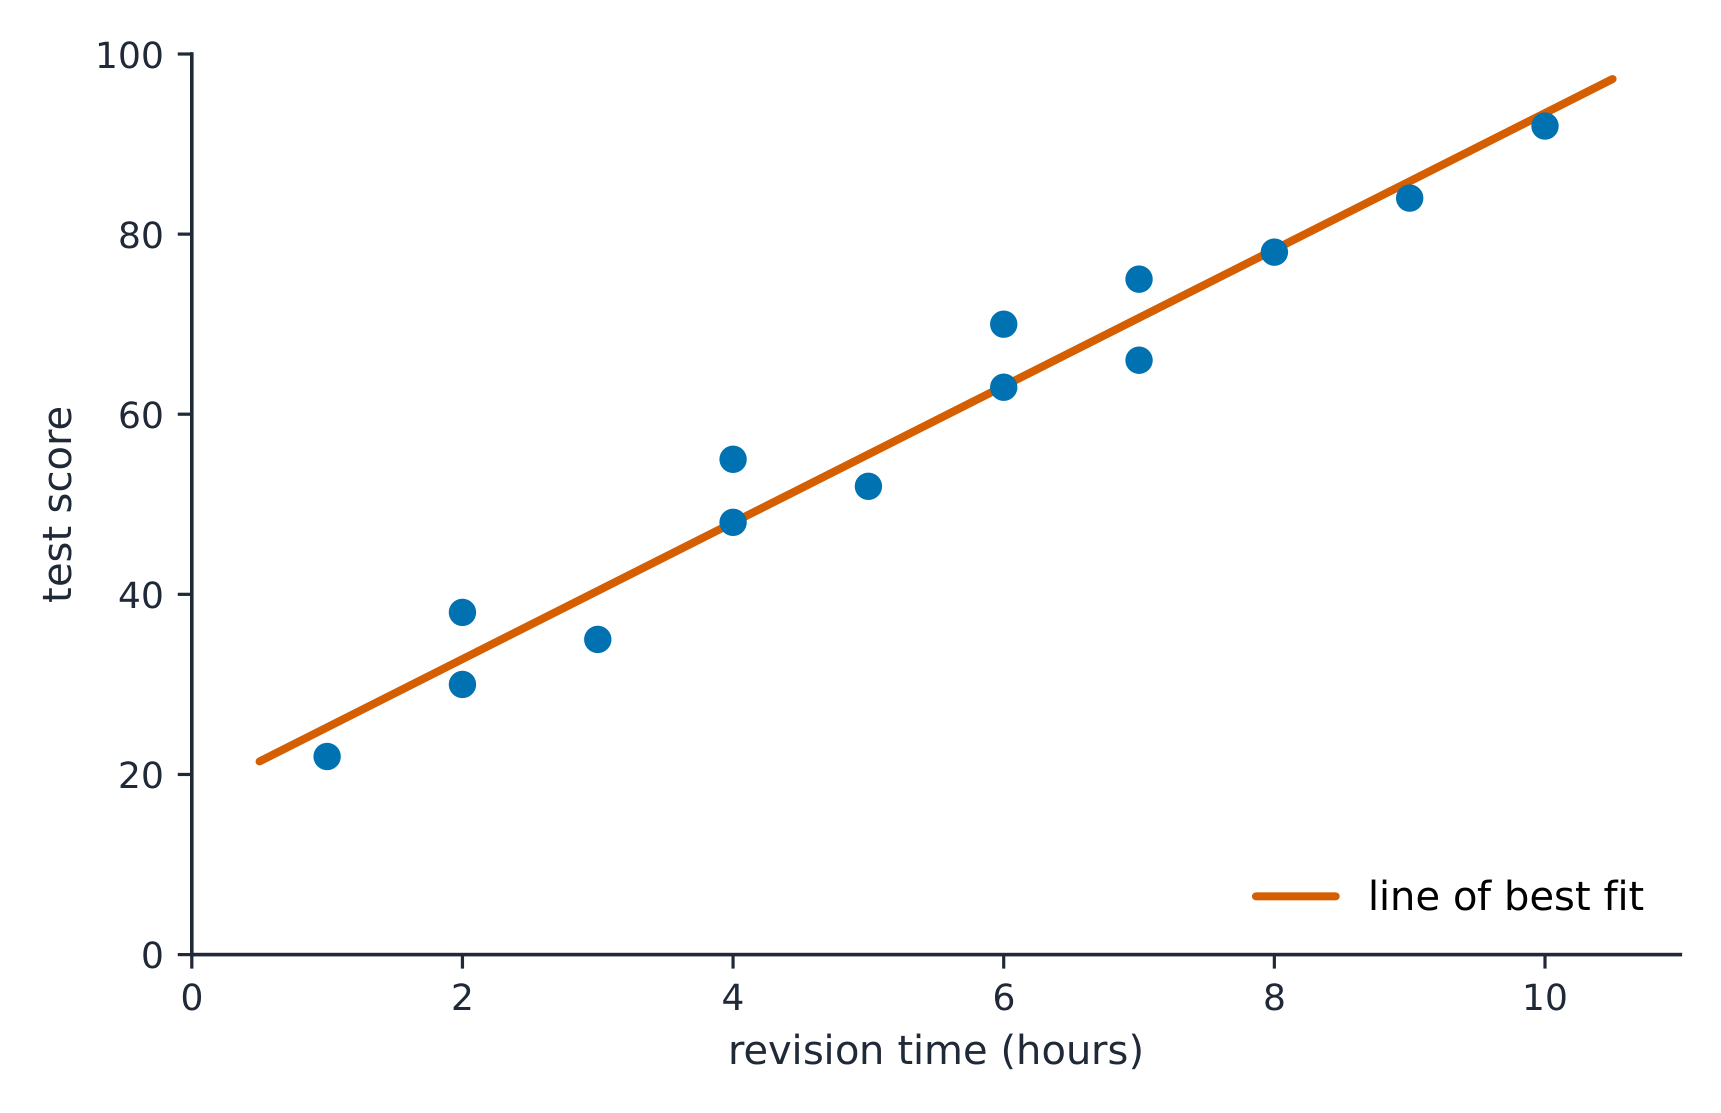
Here is one class on a scatterplot: hours of revision along the bottom, test score up the side. The line of best fit climbs. But this is only one class. Take a…
English narration · English + 中文 subtitles burned in
9.1
Do Those Points Align?
Syllabus
Source: College Board AP Course and Exam Description
A sample scatterplot 散点图 gives a sample slope 样本斜率 $b$ for the least-squares regression 回归 line – but a different sample would give a slightly different slope. So $b$ is a statistic with sampling variability 抽样变异性, estimating the true (population) slope 总体斜率 $\beta$. This unit does inference 推断 for $\beta$: is there a real linear 线性 relationship, and how strong is it?
Vocabulary
Train
| English |
|---|
| scatterplot/ˈskætəplɒt/ |
| sample slope/ˈsæmpl sləʊp/ |
| regression/rɪˈɡreʃn/ |
| sampling variability/ˈsæmplɪŋ ˌveərɪəˈbɪlɪti/ |
| true (population) slope/truː sləʊp/ |
| inference/ˈɪnfərəns/ |
| linear/ˈlɪnɪə/ |
9.2
Confidence Interval for a Slope
Syllabus
| Enduring Understanding | Learning Objective | Essential Knowledge |
|---|---|---|
UNC-4 | UNC-4.AC |
|
UNC-4.AD |
| |
UNC-4.AE |
| |
UNC-4.AF |
|
Source: College Board AP Course and Exam Description
A $t$ interval for the true slope $\beta$:
$$b\pm t^{*}\,SE_b,\qquad df=n-2,$$
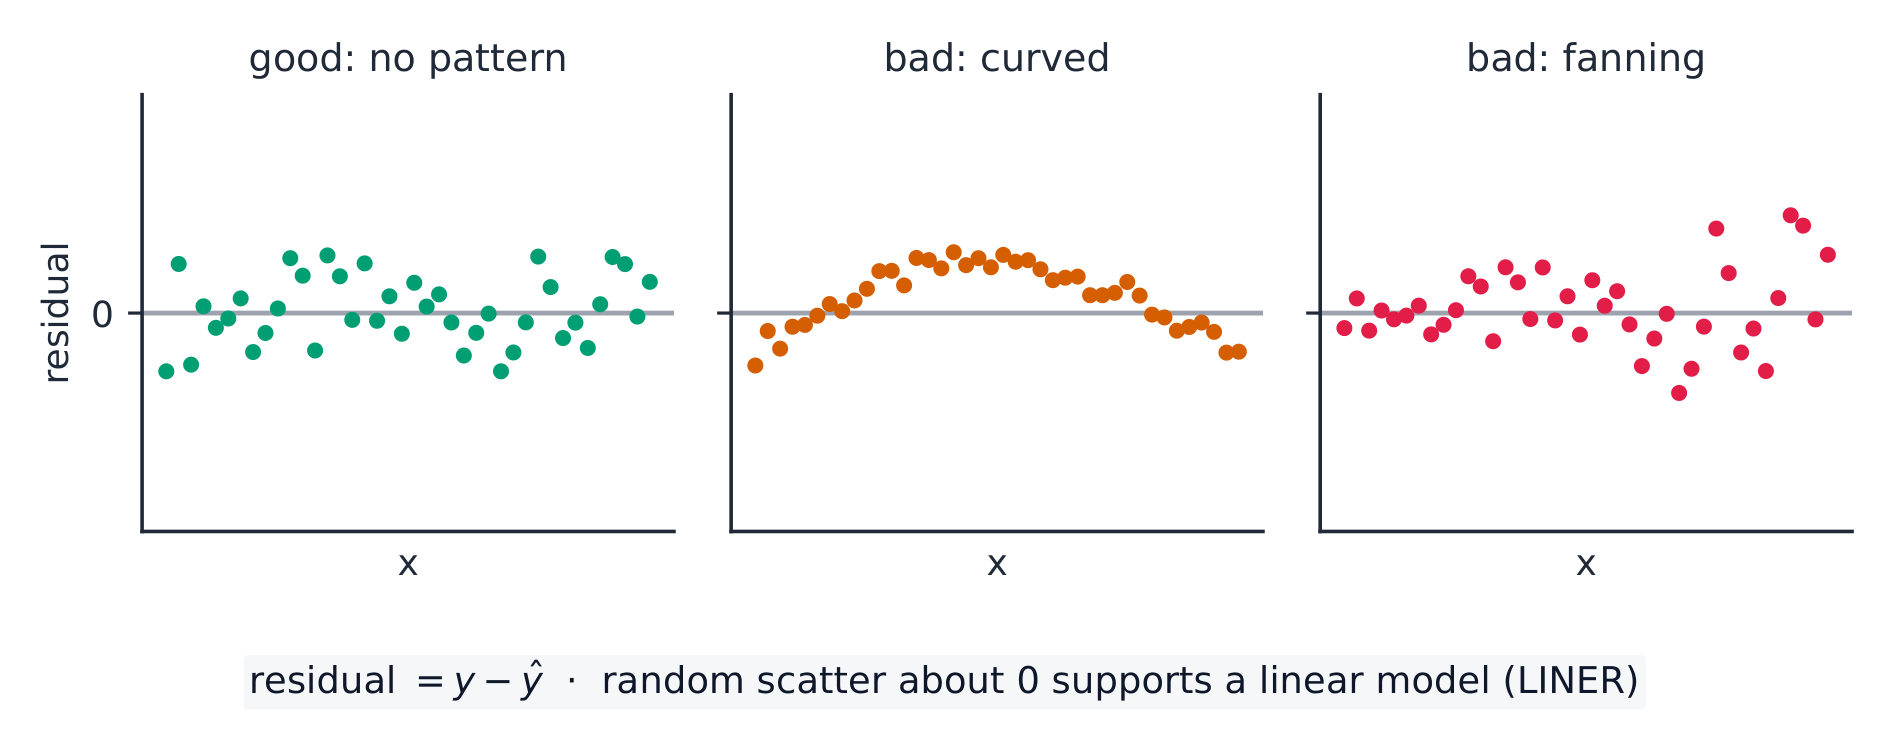
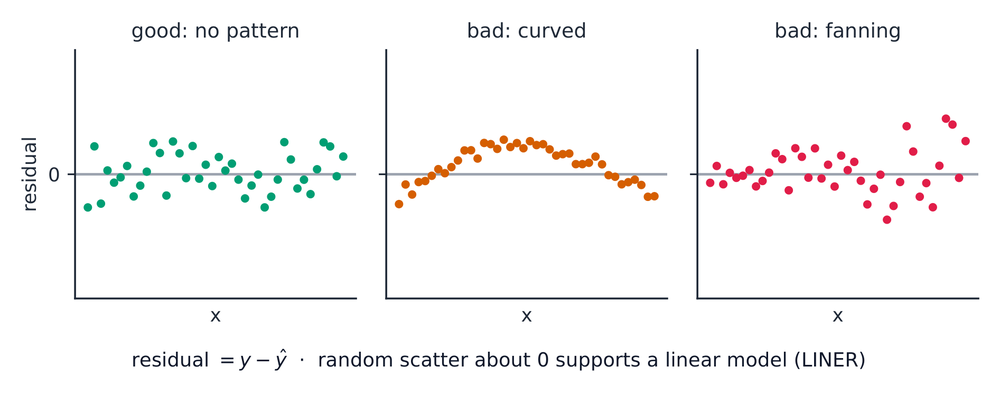
where $b$ is the sample slope and $SE_b$ its standard error (read from computer output). Conditions (LINER): the true relationship is Linear, observations Independent, residuals Normal, and residuals have Equal spread (check the residual plot and a histogram of residuals), from Random data. Interpret the interval for $\beta$ in context, with units of $y$ per unit of $x$.
The residual plot 残差图 is where you check Linear and Equal-spread: you want a formless cloud around zero. A curve means the relationship is not linear; a fan (spread growing with $x$) means the residuals do not have equal spread – both break a condition.
Worked example. Regression output gives slope $b=2.5$ with $SE_b=0.8$ from $n=20$ points. For a $95\%$ interval, $df=18$ gives $t^*=2.101$:
$$2.5\pm2.101(0.8)=2.5\pm1.68=(0.82,\ 4.18).$$
Because $0$ is not in the interval, there is evidence of a positive linear relationship.

Explore
Inference for a regression slope
The sample slope varies from sample to sample; a confidence interval and t-test ask whether the true slope could be zero (no linear relationship).
Vocabulary
Train
| English |
|---|
| residual plot/rɪˈsɪdʒuːəl plɒt/ |
9.3
Justifying a Claim About a Slope
Syllabus
| Enduring Understanding | Learning Objective | Essential Knowledge |
|---|---|---|
UNC-4 | UNC-4.AG |
|
UNC-4.AH |
| |
UNC-4.AI |
|
Source: College Board AP Course and Exam Description
If the confidence interval for $\beta$ contains $0$, a slope of zero is plausible – no evidence of a linear relationship. If the interval is entirely positive or negative, there is evidence of a real (positive or negative) linear relationship. State the direction in context.
9.4
Setting Up a Test for a Slope
Syllabus
| Enduring Understanding | Learning Objective | Essential Knowledge |
|---|---|---|
VAR-7 | VAR-7.J |
|
VAR-7.K |
| |
VAR-7.L |
|
Source: College Board AP Course and Exam Description
The usual test asks whether there is any linear relationship:
$$H_0:\beta=0 \quad(\text{no linear relationship})\qquad H_a:\beta\neq 0 \ (\text{or } <,\,>).$$
Check the LINER conditions. This is a $t$-test on the slope.
9.5
Carrying Out a Test for a Slope
Syllabus
| Enduring Understanding | Learning Objective | Essential Knowledge |
|---|---|---|
VAR-7 | VAR-7.M |
|
DAT-3 | DAT-3.M |
|
DAT-3.N |
|
Source: College Board AP Course and Exam Description
The slope $t$ statistic:
$$t=\frac{b-0}{SE_b},\qquad df=n-2.$$
Both $b$ and $SE_b$ come straight from the regression output. Find the $p$-value from the $t$-distribution, compare to $\alpha$, and conclude in context – evidence (or not) of a linear relationship between the two variables.
Watch the tails. Regression output always prints the two-tailed $p$-value (for $H_a:\beta\neq 0$). If your $H_a$ is one-tailed, halve it – and first check the sample slope really points the way $H_a$ claims; if it points the other way, the one-tailed $p$-value is above $0.5$ and you cannot reject $H_0$.
Worked example. For the same output ($b=2.5$, $SE_b=0.8$, $n=20$), test $H_0:\beta=0$:
$$t=\frac{2.5-0}{0.8}=3.13,\qquad df=18,$$
a small $p$-value ($<0.01$), so reject $H_0$ – convincing evidence of a linear relationship. This matches the interval, which excluded $0$.
9.6
Selecting the Right Procedure
Syllabus
This topic is intended to focus on the skill of selecting an appropriate inference procedure now that students have a range of options. Students should be given opportunities to practice when and how to apply all learning objectives relating to inference.
Source: College Board AP Course and Exam Description
Across all of inference, identify: what is estimated or claimed (a proportion, a mean, a difference, a distribution of counts, or a slope), how many samples, and which design (independent or paired; sample or experiment). Then name the procedure, verify its conditions, carry it out, and communicate the conclusion with the statistic, the $p$-value or interval, and a plain-language answer in context. This selecting-and-communicating skill is what the investigative-task question rewards most.
9.6
Exam tips
- Inference for a slope tests whether the true slope is $0$ (no linear relationship).
- If a slope's confidence interval includes 0, you cannot conclude a real linear relationship – the variables may still be related in a curved way.
- Read the slope, standard error, t-statistic, and p-value straight from computer output – but the printed p-value is two-tailed, so halve it for a one-tailed $H_a$.
- Check the regression conditions (linearity, independence, roughly normal residuals, equal spread) via the residual plot.
- Interpret the interval and test in context, tied to the true slope.
Interactive lessons on this topic
Work through it step by step, with instant-check exercises.