跳到主要内容

分类数据的推断:比例

AP 统计学 · 知识点 6

本主题的视频课程 打开视频页面
7:52

分类数据的推断:比例

某市想了解有多少人支持新政策。我们无法询问所有人,于是随机询问二百人。一百二十人说赞成——即百分之六十…

英语旁白 · 英中内嵌字幕

6.1

统计学导论:为什么要用正态?

教学大纲

持久理解 (VAR-1): 由于变异可能是随机的,也可能不是随机的,因此结论具有不确定性。

学习目标 VAR-1.H: 识别由从同一总体中抽取的样本分布形状差异所提出的问题。[技能 1.A]

  • VAR-1.H.1 数据分布形状的变异可能是随机的,也可能不是随机的。

来源:College Board AP 课程与考试说明

English

Because a sample proportion 样本比例 $\hat{p}$ is approximately normally distributed 正态分布的 (when the conditions 条件 hold), we can measure how far a sample result is from a claimed value in standard errors 标准误, and turn that into a probability. This is what makes inference 推断 – drawing conclusions about a population 总体 from a sample – possible.

词汇 训练
English 中文 拼音
sample proportion/ˈsæmpl prəˈpɔːʃn/ 样本比例 yàng běn bǐ lì
normally distributed 正态分布的 zhèng tài fēn bù de
conditions/kənˈdɪʃnz/ 条件 tiáo jiàn
standard errors 标准误 biāo zhǔn wù
inference/ˈɪnfərəns/ 推断 tuī duàn
population/ˌpɒpjʊˈleɪʃn/ 总体 zǒng tǐ
6.2

构建总体比例的置信区间

教学大纲

持久理解 (UNC-4): 应使用数值区间来估计参数,以考虑不确定性。

学习目标 UNC-4.A: 识别适用于总体比例的适当置信区间程序。[技能 1.D]

  • UNC-4.A.1 针对单个分类变量的单样本比例,适当的置信区间程序是单样本 $z$ 比例区间。

学习目标 UNC-4.B: 验证计算总体比例置信区间的条件。[技能 4.C]

  • UNC-4.B.1 为了对总体比例、均值和斜率进行推断所需的假设成立,我们必须检查数据收集方法中的独立性以及是否选择了合适的抽样分布。
  • UNC-4.B.2 为了计算用于估计总体比例 $p$ 的置信区间,我们必须检查独立性并确认抽样分布近似正态。
    • a. 检查独立性:
      • i. 数据应通过随机样本或随机实验收集。
      • ii. 在不放回抽样时,检查是否满足 $n \leq 10\%N$,其中 $N$ 为总体大小。
    • b. 检查 $\hat{p}$ 的抽样分布是否近似正态(形状):
      • i. 对于分类变量,检查成功次数 $n\hat{p}$ 和失败次数 $n(1-\hat{p})$ 均至少为 10,以确保样本量足够大以支持正态性假设。

学习目标 UNC-4.C: 确定给定样本量的边际误差,并估算能产生给定边际误差所需的样本量。[技能 3.D]

  • UNC-4.C.1 基于样本数据,统计量的标准误是该统计量标准差的估计值。$\hat{p}$ 的标准误为 $SE_{\hat{p}} = \sqrt{\dfrac{\hat{p}(1-\hat{p})}{n}}$。
  • UNC-4.C.2 边际误差表示样本统计量的值可能偏离相应总体参数值的程度。
  • UNC-4.C.3 对于分类变量,边际误差等于临界值 ($z^*$) 乘以相关统计量的标准误 (SE),对于单样本比例而言即等于 $z^* \sqrt{\dfrac{\hat{p}(1-\hat{p})}{n}}$。
  • UNC-4.C.4 边际误差公式可以重新排列以解出 $n$,即达到给定边际误差所需的最小样本量。为此,可使用 $\hat{p}$ 的估计值或使用 $\hat{p} = 0.5$ 来找到会导致给定边际误差的样本量的上限。

学习目标 UNC-4.D: 计算适用于总体比例的适当置信区间。[技能 3.D]

  • UNC-4.D.1 一般来说,区间估计可构造为点估计 ± (边际误差)。对于单样本比例,区间估计为 $\hat{p} \pm z^* \sqrt{\dfrac{\hat{p}(1-\hat{p})}{n}}$。
    • 澄清说明: AP Statistics 考试提供的公式表上不会显式列出区间估计公式。但是,这些公式不需要记忆,因为它们可以根据公式表上提供的通用检验统计量公式和相关标准误公式推导得出。
  • UNC-4.D.2 临界值代表包含标准正态分布中间 C% 区域的边界,其中 C% 是比例的大致置信水平。

学习目标 UNC-4.E: 基于总体比例的置信区间计算区间估计。[技能 3.D]

  • UNC-4.E.1 总体比例的置信区间可用于计算具有指定单位的区间估计。

来源:College Board AP 课程与考试说明

English
What a confidence interval means

A confidence interval 置信区间 estimates the parameter 参数 as a range: statistic $\pm$ margin of error 误差幅度.

$$\hat{p}\pm z^{*}\sqrt{\frac{\hat{p}(1-\hat{p})}{n}}.$$
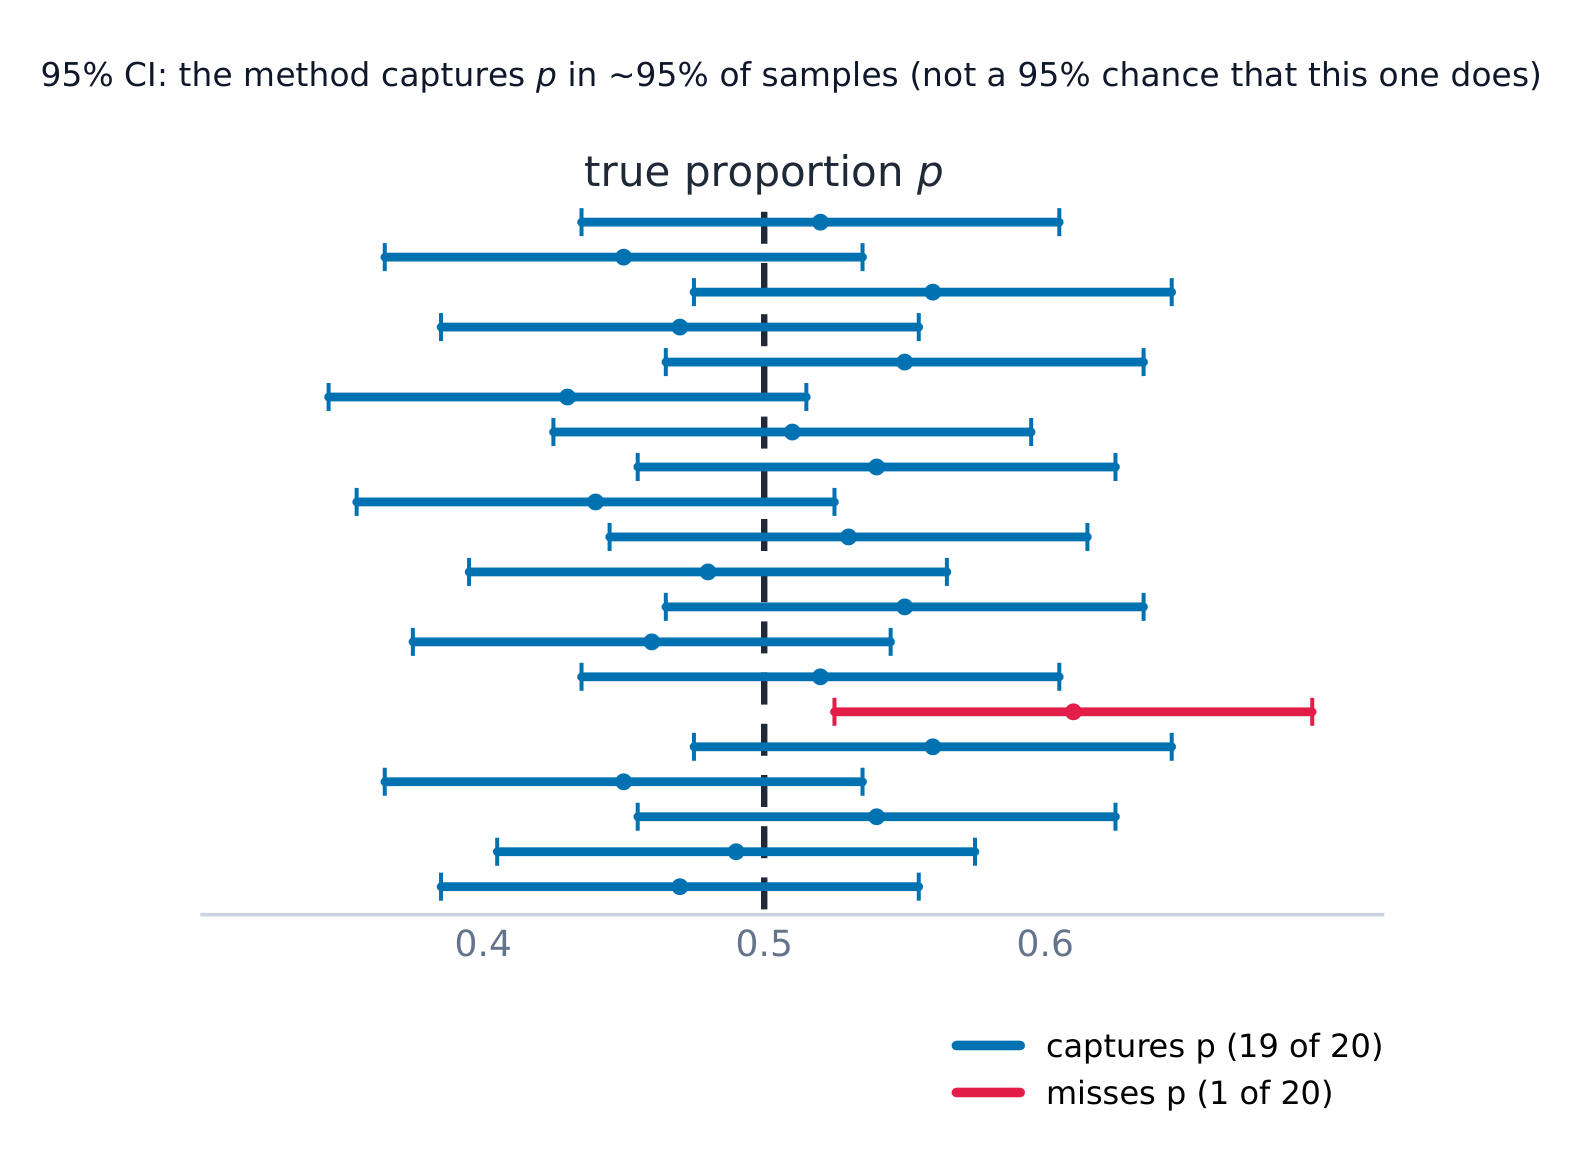
$z^{*}$ is the critical value 临界值 for the confidence level 置信水平 (e.g. $1.96$ for 95%). Conditions: random sample 随机样本, Large Counts condition 大计数条件 ($n\hat p\ge 10$ and $n(1-\hat p)\ge 10$), and the 10% condition. Interpret it: “We are 95% confident the true proportion of... is between... and...”. Interpret the level: “In 95% of samples, this method produces an interval that captures the true proportion.”

Over many samples, about 95% of 95% confidence intervals capture the true proportion

Worked example. In a random sample of $200$ people, $120$ support a policy, so $\hat{p}=0.60$. A $95\%$ interval uses $z^*=1.96$:

$$0.60\pm1.96\sqrt{\frac{0.60(0.40)}{200}}=0.60\pm0.068=(0.532,\ 0.668).$$
We are $95\%$ confident the true proportion of supporters is between $53.2\%$ and $66.8\%$.

Common mistakes. Saying “there is a $95\%$ chance that $p$ is between $0.532$ and $0.668$”: $p$ is fixed, and this interval either contains it or does not; the $95\%$ describes the method. Describing individuals or the sample instead of the population proportion. Skipping the Large Counts check: here $n\hat p=120$ and $n(1-\hat p)=80$, both at least $10$.
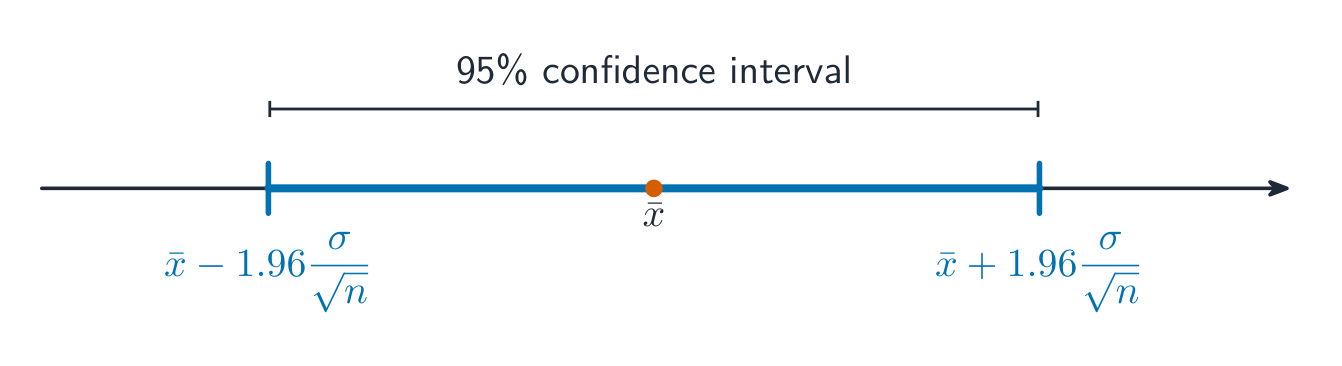
A 95% confidence interval reaches 1.96 standard errors each side of the estimate

Choosing the sample size. To keep the margin of error no larger than a target $m$, set $z^{*}\sqrt{\dfrac{\hat p(1-\hat p)}{n}}\le m$ and solve for $n$. When you have no estimate of $\hat p$, use $\hat p=0.5$: it makes $\hat p(1-\hat p)$ as large as possible, giving the safe (largest) required sample size. Always round the result up to the next whole person.

Worked example. How many people must you survey for a $95\%$ interval with margin of error at most $0.03$? Using $\hat p=0.5$ and $z^*=1.96$:

$$n=\frac{(z^*)^2\,\hat p(1-\hat p)}{m^2}=\frac{1.96^2(0.5)(0.5)}{0.03^2}=\frac{0.9604}{0.0009}\approx1067.1,$$
so you survey $1068$ people (always round up, since $1067$ would leave the margin a shade too big).

词汇 训练
English 中文 拼音
confidence interval/ˈkɒnfɪdəns ˈɪntəvl/ 置信区间 zhì xìn qū jiān
parameter/pəˈræmɪtə/ 参数 cān shù
margin of error/ˈmɑːdʒɪn ɒv ˈerə/ 误差幅度 wù chā fú dù
critical value/ˈkrɪtɪkl ˈvæljuː/ 临界值 lín jiè zhí
confidence level/ˈkɒnfɪdəns ˈlevl/ 置信水平 zhì xìn shuǐ píng
random sample/ˈrændəm ˈsæmpl/ 随机样本 suí jī yàng běn
Large Counts condition/lɑːdʒ kaʊnts kənˈdɪʃn/ 大计数条件 dà jì shù tiáo jiàn
6.3

基于总体比例置信区间论证结论

教学大纲

持久理解 (UNC-4): 应使用值区间来估计参数,以考虑不确定性。

学习目标 UNC-4.F: 解释总体比例的置信区间。[技能 4.B]

  • UNC-4.F.1 总体比例的置信区间要么包含总体比例,要么不包含,因为每个区间都是基于随机样本数据构建的,而样本数据随样本不同而变化。
  • UNC-4.F.2 我们有 C% 的把握认为总体比例的置信区间包含了总体比例。
  • UNC-4.F.3 在重复进行相同样本大小的随机抽样时,大约 C% 的置信区间将包含总体比例。
  • UNC-4.F.4 解释单一样本比例的置信区间时,应提及所取的样本及其所代表的总体详情。
    • UNC-4.F.4 示例: 对于基于全国代表性十二年级学生样本中回答某道多项选择题正确这一比例构建的 99% 置信区间 (0.268, 0.292),其解释为:“我们有 99% 的把握认为从 0.268 到 0.292 的区间包含了所有美国十二年级学生回答此题正确的总体比例”(2011年自由回答题第6(a)题)。

学习目标 UNC-4.G: 基于总体比例的置信区间论证主张。[技能 4.D]

  • UNC-4.G.1 总体比例的置信区间提供了一个值区间,该区间可能提供充分证据以支持特定情境下的某一主张。

学习目标 UNC-4.H: 识别总体比例的样本量、置信区间宽度、置信水平及误差边际之间的关系。[技能 4.A]

  • UNC-4.H.1 在其他条件保持不变的情况下,随着样本量的增加,总体比例的置信区间宽度倾向于减小。对于总体比例,区间的宽度与 $\dfrac{1}{\sqrt{n}}$ 成正比。
  • UNC-4.H.2 对于给定的样本,随着置信水平的提高,总体比例的置信区间宽度会增加。
  • UNC-4.H.3 总体比例的置信区间宽度恰好等于误差边际的两倍。

来源:College Board AP 课程与考试说明

English

To judge a claimed value: if it lies inside the interval, the data are consistent with it; if it lies outside, the data give evidence against it. Base the conclusion on whether the plausible 可信 values include the claim, in context 结合情境.

词汇 训练
English 中文 拼音
plausible/ˈplɔːzɪbl/ 可信 kě xìn
in context 结合情境 jié hé qíng jìng
6.4

建立总体比例的检验

教学大纲

持久理解 (VAR-6): 正态分布可用于模拟变异。

学习目标 VAR-6.D: 识别总体比例的原假设和备择假设。[技能 1.F]

  • VAR-6.D.1 原假设是除非有证据表明其不正确,否则被假定为正确的情况;备择假设是正在收集证据以支持的情况。
  • VAR-6.D.2 对于关于参数的假设,原假设包含等式参考(=, ≥, 或 ≤),而备择假设包含严格不等式(<, >, 或 ≠)。备择假设中的不等式类型取决于所关注的问题。备择假设为 < 或 > 的称为单侧检验,备择假设为 ≠ 的称为双侧检验。虽然单侧检验的原假设可能包含不等式符号,但它仍然在等式的边界处进行检验。
  • VAR-6.D.3 总体比例的原假设为:$H_0 : p = p_0$,其中 $p_0$ 是总体比例的原假设值。
  • VAR-6.D.4 比例的单侧备择假设为 $H_a : p < p_0$ 或 $H_a : p > p_0$。双侧备择假设为 $H_a : p_1 \neq p_2$。
  • VAR-6.D.5 对于总体比例的单个样本 $z$-检验,原假设指定了总体比例的某个值,通常是一个表示无差异或无效应的值。

学习目标 VAR-6.E: 识别适用于总体比例的适当检验方法。[技能 1.E]

  • VAR-6.E.1 对于单个分类变量,适用于总体比例的适当检验方法是总体比例的单个样本 $z$-检验。

学习目标 VAR-6.F: 验证在检验总体比例时进行统计推断的条件。[技能 4.C]

  • VAR-6.F.1 为了在检验总体比例时进行统计推断,我们必须检查独立性和抽样分布是否近似正态:
    • a. 检查独立性:
      • i. 数据应通过随机样本或随机实验收集。
      • ii. 在不放回抽样时,检查 $n \leq 10\%N$。
    • b. 检查 $\hat{p}$ 的抽样分布是否近似正态(形状):
      • i. 假设 $H_0$ 为真 $(p = p_0)$,验证成功次数 $np_0$ 和失败次数 $n(1-p_0)$ 均至少为 10,以确保样本量足够大以支持正态性假设。

来源:College Board AP 课程与考试说明

English

A significance test 显著性检验 weighs evidence against a claim. State a null hypothesis 原假设 $H_0$ and an alternative hypothesis 备择假设 $H_a$ about the parameter $p$:

$$H_0: p=p_0 \qquad H_a: p\neq p_0 \ (\text{or } <,\, >).$$
Check the same conditions (random, Large Counts using $p_0$, 10%). The test statistic 检验统计量 counts standard errors from $p_0$:
$$z=\frac{\hat p-p_0}{\sqrt{p_0(1-p_0)/n}}.$$

Worked example. A company claims $90\%$ satisfaction ($p_0=0.90$); a sample of $100$ finds $84$ satisfied ($\hat{p}=0.84$). Test $H_0:p=0.90$ vs $H_a:p\neq0.90$ at $\alpha=0.05$:

$$z=\frac{0.84-0.90}{\sqrt{0.90(0.10)/100}}=\frac{-0.06}{0.03}=-2.0,$$
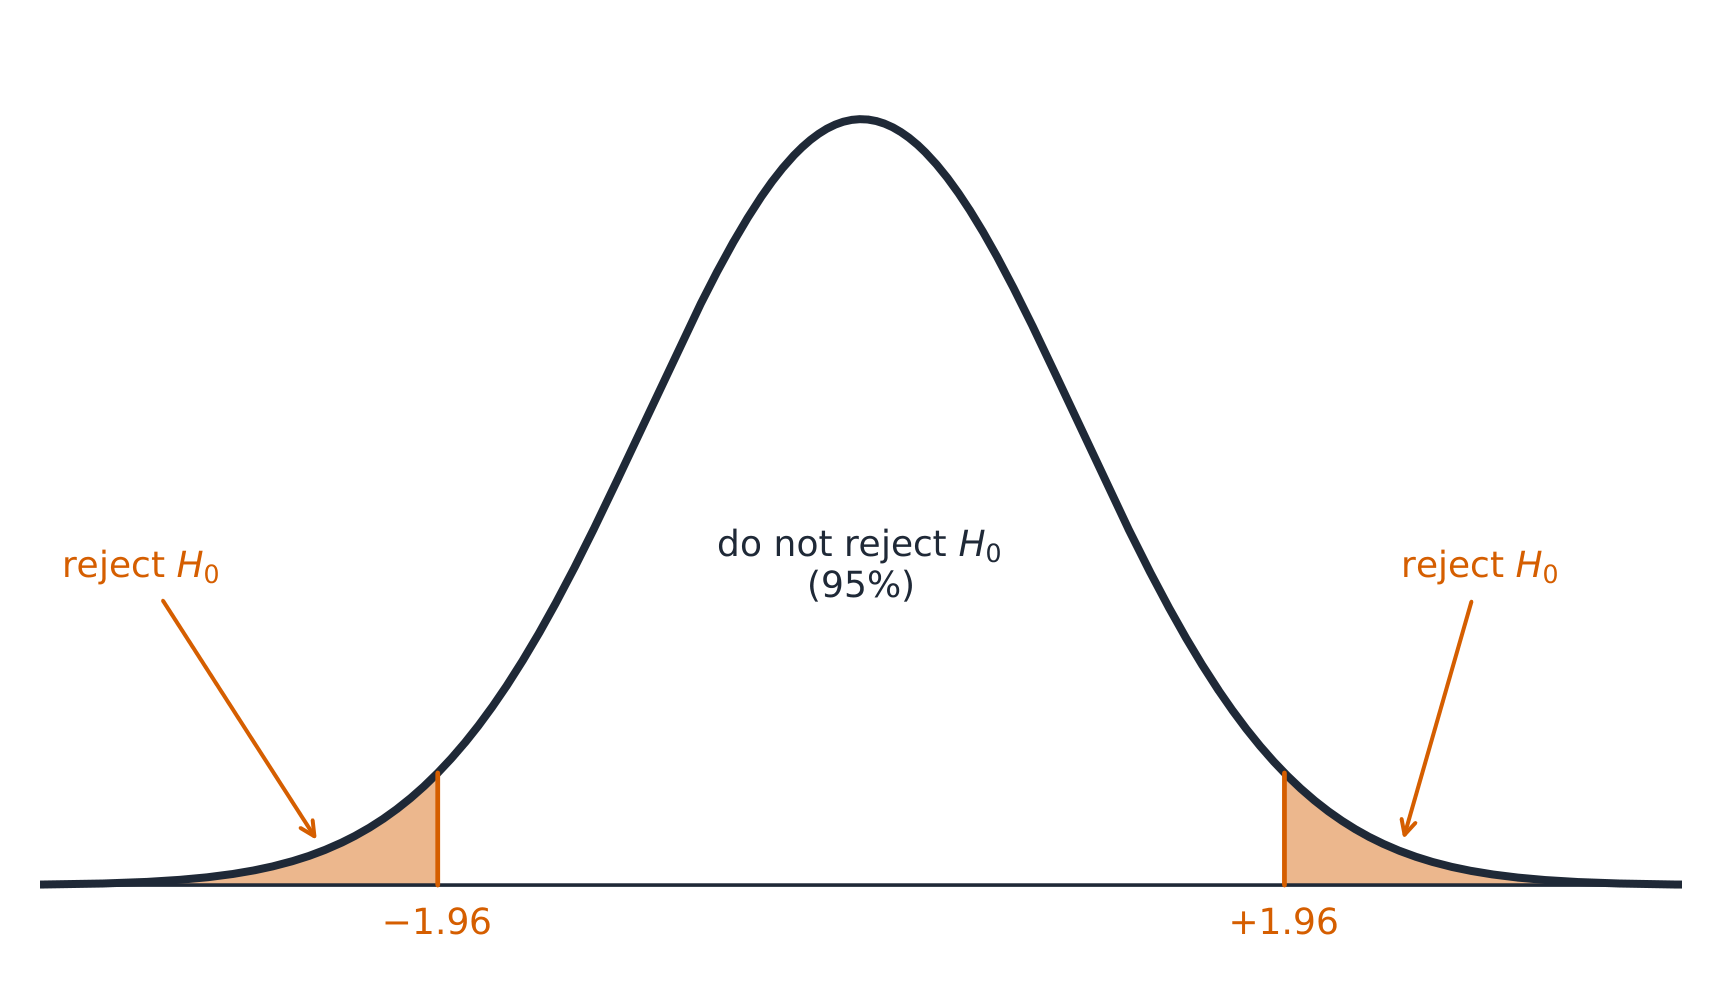
giving a two-tailed 双尾 $p$-value of about $2(0.023)=0.046$. Since $0.046<0.05$, we reject 拒绝 $H_0$ – there is evidence the true satisfaction rate differs from (is below) $90\%$.

A two-tailed 5% test rejects the null hypothesis in the shaded tails
词汇 训练
English 中文 拼音
significance test/sɪɡˈnɪfɪkəns test/ 显著性检验 xiǎn zhù xìng jiǎn yàn
null hypothesis/nʌl haɪˈpɒθəsɪs/ 原假设 yuán jiǎ shè
alternative hypothesis/ɔːlˈtɜːnətɪv haɪˈpɒθəsɪs/ 备择假设 bèi zé jiǎ shè
test statistic/test stəˈtɪstɪk/ 检验统计量 jiǎn yàn tǒng jì liàng
two-tailed/tuː teɪld/ 双尾 shuāng wěi
reject/rɪˈdʒekt/ 拒绝 jù jué
6.5

解释 p 值

教学大纲

持久性理解 (VAR-6): 正态分布可用于模拟变异。

学习目标 VAR-6.G: 计算总体比例的适当检验统计量和 $p$ 值。[技能 3.E]

  • VAR-6.G.1 假设原假设为真时检验统计量的分布(零分布)可以是随机化分布,或者在假定概率模型为真时是理论分布($z$)。
  • VAR-6.G.2 当使用 $z$ 检验时,标准化检验统计量可以表示为:$\text{test statistic} = \dfrac{\text{sample statistic} - \text{null value of the parameter}}{\text{standard deviation of the statistic}}$。这被称为比例的 $z$ 统计量。
  • VAR-6.G.3 总体比例的检验统计量为:$z = \dfrac{\hat{p} - p_0}{\sqrt{\dfrac{p_0(1-p_0)}{n}}}$。
    • 澄清说明: AP 统计学考试提供的公式表中没有明确列出检验统计量的公式。但是,这些公式不需要死记硬背,因为它们可以根据通用的检验统计量公式以及公式表中提供的相关标准误公式构建出来。
  • VAR-6.G.4 $p$ 值是在假定原假设和概率模型为真的情况下,获得与观察到的检验统计量一样极端或更极端的检验统计量的概率。显著性水平可以给定或由研究者确定。

持久性理解 (DAT-3): 显著性检验使我们能够在特定背景下对假设做出决策。

学习目标 DAT-3.A: 解释总体比例显著性检验的 $p$ 值。[技能 4.B]

  • DAT-3.A.1 $p$ 值是零分布中与观察到的检验统计量一样极端或更极端的值的比例。这是:
    • a. 如果备择假设为 >,则为大于或等于观察到的检验统计量的比例。
    • b. 如果备择假设为 <,则为小于或等于观察到的检验统计量的比例。
    • c. 如果备择假设为 ≠,则为小于或等于检验统计量绝对值的负值的比例加上大于或等于检验统计量绝对值的比例。
  • DAT-3.A.2 对一个样本比例的显著性检验的 $p$ 值的解释应认识到,$p$ 值是通过假定概率模型和原假设为真来计算的,即通过假定真实的总体比例等于原假设中陈述的特定值来计算的。

来源:College Board AP 课程与考试说明

English
What a p-value means

The $p$-value P值 is the probability of getting a sample result as extreme or more extreme than the observed 观测到的 one, assuming $H_0$ is true. A small $p$-value means the data would be surprising if $H_0$ held – evidence against $H_0$. It is not the probability that $H_0$ is true.

Common mistakes. Writing hypotheses about the statistic ($H_0:\hat p=0.90$): hypotheses are always about the parameter $p$. Using $\hat p$ in the test's standard error: the test assumes $H_0$, so it uses $p_0$ (the interval uses $\hat p$). Reading $p=0.046$ as “a $4.6\%$ chance that $H_0$ is true”.

探索

p 值作为尾部面积

P值是在原假设为真的情况下,得到至少如此极端的结果的概率——即阴影部分的尾部面积。较小的P值会对原假设提出质疑。

词汇 训练
English 中文 拼音
p-value/piː ˈvæljuː/ P值 P zhí
observed/ɒbˈzɜːvd/ 观测到的 guān cè dào de
6.6

得出总体比例检验的结论

教学大纲

持久理解 (DAT-3): 显著性检验使我们能够在特定情境下对假设做出判断。

学习目标 DAT-3.B: 基于总体比例显著性检验的结果,论证关于总体的主张。[技能 4.E]

  • DAT-3.B.1 显著性水平 $\alpha$ 是在原假设为真时拒绝原假设的预设概率。
  • DAT-3.B.2 正式决策明确将 $p$ 值与显著性水平 $\alpha$ 进行比较。如果 $p$ 值 $\leq \alpha$,则拒绝原假设;如果 $p$ 值 $> \alpha$,则不拒绝原假设。
  • DAT-3.B.3 拒绝原假设意味着有充分的统计证据支持备择假设;不拒绝原假设意味着缺乏支持备择假设的充分统计证据。
  • DAT-3.B.4 关于备择假设的结论必须在具体情境中表述。
  • DAT-3.B.5 显著性检验可能导致拒绝或不拒绝原假设,但绝不能得出或证明原假设为真的结论。缺乏支持备择假设的统计证据并不等同于支持原假设的证据。
  • DAT-3.B.6 较小的 $p$ 值表明,若原假设和概率模型为真,则观测到的检验统计量值将是异常的,因此为备择假设提供了证据。$p$ 值越小,支持备择假设的统计证据越令人信服。
  • DAT-3.B.7 非小值的 $p$ 值表明,若原假设和概率模型为真,则观测到的检验统计量值并不异常,因此既未提供令人信服的支持备择假设的统计证据,也未提供原假设为真的证据。
  • DAT-3.B.8 正式决策明确将 $p$ 值与显著性水平 $\alpha$ 进行比较。如果 $p$ 值 $\leq \alpha$,则拒绝原假设 $H_0 : p = p_0$;如果 $p$ 值 $> \alpha$,则不拒绝原假设。
  • DAT-3.B.9 总体比例显著性检验的结果可作为统计推理依据,以支持针对所抽样总体的研究问题的答案。

来源:College Board AP 课程与考试说明

English

Compare the $p$-value to the significance level 显著性水平 $\alpha$ (often $0.05$):

  • $p\le\alpha$: reject $H_0$ – there is convincing evidence 有力证据 for $H_a$.
  • $p>\alpha$: fail to reject 不拒绝 $H_0$ – not enough evidence for $H_a$ (never “accept $H_0$”).

Always write the conclusion in context, linking back to the claim.

Common mistakes. Writing “accept $H_0$” or “this proves $p=0.90$” after a large $p$-value: failing to reject only means the evidence is not strong enough. Concluding without the comparison of the $p$-value with $\alpha$, or without context.

探索

该示例检验的下侧证据。

该练习中的单侧检验 z ≈ -1.67。使用此四舍五入后的统计量,左侧阴影尾部约为 0.0475。

词汇 训练
English 中文 拼音
significance level/sɪɡˈnɪfɪkəns ˈlevl/ 显著性水平 xiǎn zhù xìng shuǐ píng
convincing evidence 有力证据 yǒu lì zhèng jù
fail to reject/feɪl tə rɪˈdʒekt/ 不拒绝 bù jù jué
6.7

进行检验时的潜在错误

教学大纲

持久性理解 (UNC-5): I 类和 II 类错误的概率影响统计推断。

学习目标 UNC-5.A: 识别 I 类和 II 类错误。[技能 1.B]

  • UNC-5.A.1 当原假设为真却被拒绝时,发生 I 类错误(假阳性)。
  • UNC-5.A.2 当原假设为假却未被拒绝时,发生 II 类错误(假阴性)。
    • 错误汇总表: 顶行为实际总体参数值($H_0$ 为真;$H_a$ 为真),侧列为决策(拒绝 $H_0$;未能拒绝 $H_0$):当 $H_0$ 为真时拒绝 $H_0$ = I 类错误;当 $H_a$ 为真时拒绝 $H_0$ = 正确决策;当 $H_0$ 为真时未能拒绝 $H_0$ = 正确决策;当 $H_a$ 为真时未能拒绝 $H_0$ = II 类错误。

学习目标 UNC-5.B: 计算 I 类和 II 类错误的概率。[技能 3.A]

  • UNC-5.B.1 显著性水平 $\alpha$ 是在原假设为真的情况下犯 I 类错误的概率。
  • UNC-5.B.2 检验的功效是指检验正确拒绝一个错误的原假设的概率。
  • UNC-5.B.3 犯 II 类错误的概率为 $= 1 - power$。

学习目标 UNC-5.C: 识别影响显著性检验中错误概率的因素。[技能 4.A]

  • UNC-5.C.1 在保持其他因素不变的情况下,当发生以下任一情况时,II 类错误的概率会降低:
    • i. 样本量增加。
    • ii. 检验的显著性水平 ($\alpha$) 增加。
    • iii. 标准误减小。
    • iv. 真实参数值离原假设更远。

学习目标 UNC-5.D: 解释 I 类和 II 类错误。[技能 4.B]

  • UNC-5.D.1 I 类错误或 II 类错误哪一个更具后果严重性取决于具体情况。
  • UNC-5.D.2 由于显著性水平 $\alpha$ 是 I 类错误的概率,I 类错误的后果会影响对显著性水平的决策。

来源:College Board AP 课程与考试说明

English
Type I and Type II errors
  • A Type I error 第一类错误: rejecting a true $H_0$ (a false alarm 误报). Its probability is $\alpha$.
  • A Type II error 第二类错误: failing to reject a false $H_0$ (a missed detection 漏检). Its probability is $\beta$.
  • The power 检验效能 $=1-\beta$ is the chance of correctly detecting a real effect 效应. Power rises with a larger sample, a larger effect, or a larger $\alpha$.

Describe each error and its consequence 后果 in the problem's context.

Worked example. In the satisfaction test above ($H_0:p=0.90$):

  • Type I error: concluding that the satisfaction rate is not $90\%$ when it really is $90\%$. Consequence: the company is wrongly accused of overstating its rate.
  • Type II error: failing to find evidence against $90\%$ when the true rate is different (say $85\%$). Consequence: customers keep trusting a rate that is too high.

A good answer names the error and says what happens because of it, in the words of the problem.

探索

检验可能犯错的两种方式

第一类错误拒绝真实的零假设(误报);第二类错误保留虚假的零假设(漏报)。降低一种通常会增加另一种。

词汇 训练
English 中文 拼音
Type I error/taɪp aɪ ˈerə/ 第一类错误 dì yī lèi cuò wù
false alarm 误报 wù bào
Type II error/taɪp ˈtuː ˈerə/ 第二类错误 dì èr lèi cuò wù
missed detection 漏检 lòu jiǎn
power/ˈpaʊə/ 检验效能 jiǎn yàn xiào néng
effect 效应 xiào yìng
consequence/ˈkɒnsɪkwəns/ 后果 hòu guǒ
6.8

两个比例之差的置信区间

教学大纲

持久性理解 (UNC-4): 应使用数值区间来估计参数,以考虑不确定性。

学习目标 UNC-4.I: 识别用于比较总体比例的适当置信区间程序。[技能 1.D]

  • UNC-4.I.1 对于单分类变量的两样本比例比较,适当的置信区间程序是两个独立样本 $z$ 区间,用于估计总体比例之差。

学习目标 UNC-4.J: 验证计算总体比例之差的置信区间的条件。[技能 4.C]

  • UNC-4.J.1 为了计算估计比例之差的置信区间,我们必须检查独立性以及抽样分布是否近似正态:
    • a. 为了检查独立性:
      • i. 数据应通过两个独立的随机样本或随机实验收集。
      • ii. 当无放回抽样时,检查 $n_1 \leq 10\%N_1$ 和 $n_2 \leq 10\%N_2$。
    • b. 为了检查 $\hat{p}_1 - \hat{p}_2$ 的抽样分布(形状)近似正态。
      • i. 对于分类变量,检查 $n_1\hat{p}_1$、$n_1(1-\hat{p}_1)$、$n_2\hat{p}_2$ 和 $n_2\left(1-\hat{p}_2\right)$ 均大于或等于某个预定值,通常为 5 或 10。

学习目标 UNC-4.K: 计算用于比较总体比例的适当置信区间。[技能 3.D]

  • UNC-4.K.1 对于比例的比较,区间估计为 $(\hat{p}_1 - \hat{p}_2) \pm z^* \sqrt{\dfrac{\hat{p}_1(1-\hat{p}_1)}{n_1} + \dfrac{\hat{p}_2(1-\hat{p}_2)}{n_2}}$。
    • 澄清说明: AP 统计学考试提供的公式表上未明确列出区间估计的公式。然而,这些公式不需要死记硬背,因为它们可以根据通用检验统计量公式和公式表上提供的相关标准误公式构建而成。

学习目标 UNC-4.L: 基于比例的差值的置信区间计算区间估计。[技能 3.D]

  • UNC-4.L.1 比例的差值的置信区间可用于计算具有指定单位的区间估计。

来源:College Board AP 课程与考试说明

English

To compare two proportions, estimate $p_1-p_2$:

$$(\hat p_1-\hat p_2)\pm z^{*}\sqrt{\frac{\hat p_1(1-\hat p_1)}{n_1}+\frac{\hat p_2(1-\hat p_2)}{n_2}}.$$
Conditions must hold in both samples, and the samples must be independent.

Worked example. For the two teaching methods below ($\hat p_1=\tfrac{45}{75}=0.60$, $\hat p_2=\tfrac{32}{80}=0.40$), a $95\%$ interval for $p_1-p_2$ is

$$(0.60-0.40)\pm1.96\sqrt{\frac{0.60(0.40)}{75}+\frac{0.40(0.60)}{80}}=0.20\pm1.96(0.0787)=0.20\pm0.154,$$

which is $(0.046,\ 0.354)$. We are $95\%$ confident that method 1's true pass rate is between $4.6$ and $35.4$ percentage points 百分点 higher than method 2's. The interval uses the separate $\hat p$ values; the pooled $\hat p_c$ belongs only to the test.

词汇 训练
English 中文 拼音
percentage points/pəˈsentɪdʒ pɔɪnts/ 百分点 bǎi fēn diǎn
6.9

基于两个总体比例之差的置信区间论证结论

教学大纲

持久理解 (UNC-4): 应使用数值区间来估计参数,以考虑不确定性。

学习目标 UNC-4.M: 解释总体比例之差的置信区间。[技能 4.B]

  • UNC-4.M.1 在样本量相同的重复随机抽样中,大约 C% 的置信区间将包含总体比例之差。
  • UNC-4.M.2 解释总体比例之差的置信区间时,应提及所抽取的样本及其所代表的总体的相关细节。

学习目标 UNC-4.N: 基于总体比例之差的置信区间论证主张。[技能 4.D]

  • UNC-4.N.1 总体比例之差的置信区间提供了一个数值区间,该区间可能为支持特定情境下的主张提供充分证据。

来源:College Board AP 课程与考试说明

English

If the interval for $p_1-p_2$ contains $0$, the data are consistent with no difference; if it lies entirely above or below $0$, there is evidence of a difference (in that direction). State the direction and context.

6.10

建立两个总体比例之差的检验

教学大纲

持久理解 (VAR-6): 正态分布可用于对变异进行建模。

学习目标 VAR-6.H: 识别两个总体比例之差的零假设和备择假设。[技能 1.F]

  • VAR-6.H.1 对于两个样本比例的差异检验,零假设指定总体比例之差为 $0$ 的值,表明无差异或无影响。
  • VAR-6.H.2 比例之差的零假设为:$H_0 : p_1 = p_2$,或 $H_0 : p_1 - p_2 = 0$。
  • VAR-6.H.3 比例之差的双侧备择假设为 $H_a : p_1 < p_2$,或 $H_a : p_1 > p_2$。比例之差的双侧备择假设为 $H_a : p_1 \neq p_2$。

学习目标 VAR-6.I: 识别两个总体比例之差的适当检验方法。[技能 1.E]

  • VAR-6.I.1 对于单个分类变量,两个总体比例之差的适当检验方法是两个总体比例之差的两样本 $z$-检验。

学习目标 VAR-6.J: 验证在检验两个总体比例之差时进行统计推断的条件。[技能 4.C]

  • VAR-6.J.1 为了在检验总体比例之差时进行统计推断,我们必须检查独立性和抽样分布是否近似正态:
    • a. 检查独立性:
      • i. 数据应通过两个独立的随机样本或随机实验收集。
      • ii. 在不放回抽样时,检查 $n_1 \leq 10\%N_1$ 且 $n_2 \leq 10\%N_2$。
    • b. 检查 $\hat{p}_1 - \hat{p}_2$ 的抽样分布是否近似正态(形状):
      • i. 对于合并样本,定义合并(或混合)比例 $\hat{p}_c = \dfrac{n_1\hat{p}_1 + n_2\hat{p}_2}{n_1 + n_2}$。假设 $H_0$ 成立 $(p_1 - p_2 = 0$ 或 $p_1 = p_2)$,检查 $n_1\hat{p}_c$、$n_1\left(1-\hat{p}_c\right)$、$n_2\hat{p}_c$ 和 $n_2\left(1-\hat{p}_c\right)$ 均大于或等于某个预先确定的值,通常为 5 或 10。

来源:College Board AP 课程与考试说明

English

Hypotheses compare the two proportions: $H_0: p_1=p_2$ versus $H_a: p_1\neq p_2$ (or $<,>$). Because $H_0$ says the proportions are equal, use a combined (pooled) 合并 sample proportion $\hat p_c=\dfrac{\text{total successes}}{\text{total sample size}}$ to estimate the common $p$.

词汇 训练
English 中文 拼音
combined (pooled)/kəmˈbaɪnd/ 合并 hé bìng
6.11

执行两个总体比例之差的检验

教学大纲

持久理解 (VAR-6): 正态分布可用于对变异进行建模。

学习目标 VAR-6.K: 计算两个总体比例之差的适当检验统计量。[技能 3.E]

  • VAR-6.K.1 比例之差的检验统计量为:$z = \dfrac{(\hat{p}_1 - \hat{p}_2) - 0}{\sqrt{\hat{p}_c(1-\hat{p}_c)}\sqrt{\dfrac{1}{n_1} + \dfrac{1}{n_2}}}$,其中 $\hat{p}_c = \dfrac{n_1\hat{p}_1 + n_2\hat{p}_2}{n_1 + n_2}$。
    • 澄清说明: AP 统计学公式表上并未显式列出检验统计量的公式。然而,这些公式无需背诵,因为它们可以根据通用的检验统计量公式以及公式表上提供的每个相关检验统计量的标准误公式来构建。

持久理解 (DAT-3): 显著性检验使我们能够在特定背景下针对假设做出决策。

学习目标 DAT-3.C: 解释两个总体比例之差显著性检验的 $p$ 值。[技能 4.B]

  • DAT-3.C.1 对两个总体比例之差显著性检验的 $p$ 值的解释应认识到,$p$ 值是在假设原假设为真的前提下计算得出的,即假设真实的总体比例彼此相等。

学习目标 DAT-3.D: 根据两个总体比例之差的显著性检验结果,就总体主张提供依据。[技能 4.E]

  • DAT-3.D.1 正式决策会明确将 $p$ 值与显著性水平 $\alpha$ 进行比较。如果 $p\text{-value} \leq \alpha$,则拒绝原假设 $H_0 : p_1 = p_2$(或 $H_0 : p_1 - p_2 = 0$)。如果 $p$ 值 $> \alpha$,则不拒绝原假设。
  • DAT-3.D.2 两个总体比例之差的显著性检验结果可作为统计推理依据,以支持关于所抽取的两个总体的研究问题的答案。

来源:College Board AP 课程与考试说明

English

The pooled two-proportion $z$ statistic:

$$z=\frac{\hat p_1-\hat p_2}{\sqrt{\hat p_c(1-\hat p_c)\left(\frac{1}{n_1}+\frac{1}{n_2}\right)}}.$$
Find the $p$-value from the normal model, compare to $\alpha$, and conclude in context – the same four-step logic as the one-proportion test.

Worked example: a two-proportion test. Two teaching methods are compared with random samples of students. Method 1: 45 of 75 pass. Method 2: 32 of 80 pass. Is there convincing evidence, at $\alpha=0.05$, of a difference in pass rates?

  • State. $H_0:p_1=p_2$ and $H_a:p_1\neq p_2$, where $p_1,p_2$ are the true pass rates under each method.
  • Plan. Two-sample $z$-test for a difference of proportions. Independent random samples; each is less than 10% of its population; the counts $45,\ 30,\ 32,\ 48$ are all at least 10.
  • Do. $\hat p_1=0.60$, $\hat p_2=0.40$, pooled $\hat p_c=\dfrac{77}{155}=0.497$.
    $$z=\frac{0.60-0.40}{\sqrt{0.497(0.503)\left(\frac{1}{75}+\frac{1}{80}\right)}}=\frac{0.20}{0.0804}=2.49,\qquad p\approx0.013.$$
  • Conclude. Because $0.013<0.05$, reject $H_0$. There is convincing evidence that the true pass rates under the two methods differ; method 1's is higher.
6.11

Practice

English

Answer each before reading the answers below.

  1. In a random sample of 160 students, 64 walk to school. Construct a $95\%$ confidence interval for the true proportion who walk.
  2. How large a sample gives a $95\%$ margin of error of at most $0.04$, with no prior estimate of $p$?
  3. A coin is tossed 400 times and lands heads 220 times. Test $H_0:p=0.5$ against $H_a:p\neq0.5$.
  4. Which is the correct meaning of “$95\%$ confident” for the interval in question 1? (a) $95\%$ of students walk between $32\%$ and $48\%$ of the time. (b) The method used captures the true proportion in about $95\%$ of samples.
  5. A student says: “My interval $(0.532,\ 0.668)$ has a $95\%$ chance of containing $p$.” Correct the student.
6.11

答案

English
  1. $\hat p=0.40$, $SE=\sqrt{0.40(0.60)/160}=0.0387$, so $0.40\pm1.96(0.0387)=0.40\pm0.076$, giving $(0.324,\ 0.476)$.
  2. $n=\dfrac{1.96^2(0.5)(0.5)}{0.04^2}=600.25$, so survey 601 people.
  3. $\hat p=0.55$, $z=\dfrac{0.55-0.50}{\sqrt{0.25/400}}=\dfrac{0.05}{0.025}=2.0$, two-sided $p\approx0.046$. At $\alpha=0.05$, reject $H_0$: convincing evidence that the coin is not fair.
  4. (b). The confidence level describes the method's long-run success rate.
  5. Once computed, the interval either contains $p$ or it does not. The $95\%$ describes the method: about $95\%$ of intervals made this way capture $p$. Say “we are $95\%$ confident”, not “a $95\%$ probability”.
6.11

考试技巧

English
  • State the conditions (random, 10%, large counts $np,\,nq\ge10$) before any proportion inference.
  • A confidence interval = estimate $\pm$ margin of error; “95% confident” refers to the method's long-run capture rate.
  • For a test, write $H_0$ and $H_a$, compute the test statistic, find the p-value, and compare to $\alpha$.
  • A small p-value is evidence against $H_0$; failing to reject does not prove $H_0$.
  • Larger samples shrink the margin of error; a higher confidence level widens it.

该知识点的互动课程

逐步完成,配合即时检查练习。

历年真题

更多 AP 统计学 知识点

登录或创建账户

IGCSE, A-Level & AP