跳到主要内容

探索双变量数据

AP 统计学 · 第 2 主题

训练
讲义 词汇表
2.1

统计学导论:变量之间有关联吗?

大纲
Enduring UnderstandingLearning ObjectiveEssential Knowledge

VAR-1
Given that variation may be random or not, conclusions are uncertain.

VAR-1.D
Identify questions to be answered about possible relationships in data. [Skill 1.A]

  • VAR-1.D.1 Apparent patterns and associations in data may be random or not.

来源:美国大学理事会 AP 课程与考试说明

双变量数据让我们能问两个特征是否关联(associated)——知道一个是否告诉你关于另一个的一些东西。一个解释变量(explanatory variable)("输入")可能帮助预测一个响应变量(response variable)("输出")。关联不等同于因果。

词汇表 训练
英文 中文 拼音
associated 关联 guān lián
explanatory variable 解释变量 jiě shì biàn liàng
response variable 响应变量 xiǎng yìng biàn liàng
2.2

表示两个分类变量

大纲
Enduring UnderstandingLearning ObjectiveEssential Knowledge

UNC-1
Graphical representations and statistics allow us to identify and represent key features of data.

UNC-1.P
Compare numerical and graphical representations for two categorical variables. [Skill 2.D]

  • UNC-1.P.1 Side-by-side bar graphs, segmented bar graphs, and mosaic plots are examples of bar graphs for one categorical variable, broken down by categories of another categorical variable.
  • UNC-1.P.2 Graphical representations of two categorical variables can be used to compare distributions and/or determine if variables are associated.
  • UNC-1.P.3 A two-way table, also called a contingency table, is used to summarize two categorical variables. The entries in the cells can be frequency counts or relative frequencies.
  • UNC-1.P.4 A joint relative frequency is a cell frequency divided by the total for the entire table.

来源:美国大学理事会 AP 课程与考试说明

一个双向表(two-way table)(列联表)一次按两个分类变量对个体计数。一个边缘分布(marginal distribution)是把行或列的总计写成占总计的比例(总计本身只是计数)。比较内部单元格显示这些变量是否相关。

词汇表 训练
英文 中文 拼音
two-way table 双向表 shuāng xiàng biǎo
marginal distributions 边缘分布 biān yuán fēn bù
2.3

两个分类变量的统计量

大纲
Enduring UnderstandingLearning ObjectiveEssential Knowledge

UNC-1
Graphical representations and statistics allow us to identify and represent key features of data.

UNC-1.Q
Calculate statistics for two categorical variables. [Skill 2.C]

  • UNC-1.Q.1 The marginal relative frequencies are the row and column totals in a two-way table divided by the total for the entire table.
  • UNC-1.Q.2 A conditional relative frequency is a relative frequency for a specific part of the contingency table (e.g., cell frequencies in a row divided by the total for that row).

UNC-1.R
Compare statistics for two categorical variables. [Skill 2.D]

  • UNC-1.R.1 Summary statistics for two categorical variables can be used to compare distributions and/or determine if variables are associated.

来源:美国大学理事会 AP 课程与考试说明

一个条件分布(conditional distribution)是一个变量在另一个的一个固定类别的分布(通过把每个单元格除以它的行或列总计求得)。若条件分布跨组不同,这两个变量关联;若它们相同,没有关联。分段条形图(segmented bar charts)或马赛克图显示它们。

词汇表 训练
英文 中文 拼音
conditional distribution 条件分布 tiáo jiàn fēn bù
Segmented bar charts 分段条形图 fēn duàn tiáo xíng tú
2.4

表示两个定量变量之间的关系

大纲
Enduring UnderstandingLearning ObjectiveEssential Knowledge

UNC-1
Graphical representations and statistics allow us to identify and represent key features of data.

UNC-1.S
Represent bivariate quantitative data using scatterplots. [Skill 2.B]

  • UNC-1.S.1 A bivariate quantitative data set consists of observations of two different quantitative variables made on individuals in a sample or population.
  • UNC-1.S.2 A scatterplot shows two numeric values for each observation, one corresponding to the value on the $x$-axis and one corresponding to the value on the $y$-axis.
  • UNC-1.S.3 An explanatory variable is a variable whose values are used to explain or predict corresponding values for the response variable.

DAT-1
Regression models may allow us to predict responses to changes in an explanatory variable.

DAT-1.A
Describe the characteristics of a scatter plot. [Skill 2.A]

  • DAT-1.A.1 A description of a scatter plot includes form, direction, strength, and unusual features.
  • DAT-1.A.2 The direction of the association shown in a scatterplot, if any, can be described as positive or negative.
  • DAT-1.A.3 A positive association means that as values of one variable increase, the values of the other variable tend to increase. A negative association means that as values of one variable increase, values of the other variable tend to decrease.
  • DAT-1.A.4 The form of the association shown in a scatterplot, if any, can be described as linear or non-linear to varying degrees.
  • DAT-1.A.5 The strength of the association is how closely the individual points follow a specific pattern, e.g., linear, and can be shown in a scatterplot. Strength can be described as strong, moderate, or weak.
  • DAT-1.A.6 Unusual features of a scatter plot include clusters of points or points with relatively large discrepancies between the value of the response variable and a predicted value for the response variable.

来源:美国大学理事会 AP 课程与考试说明

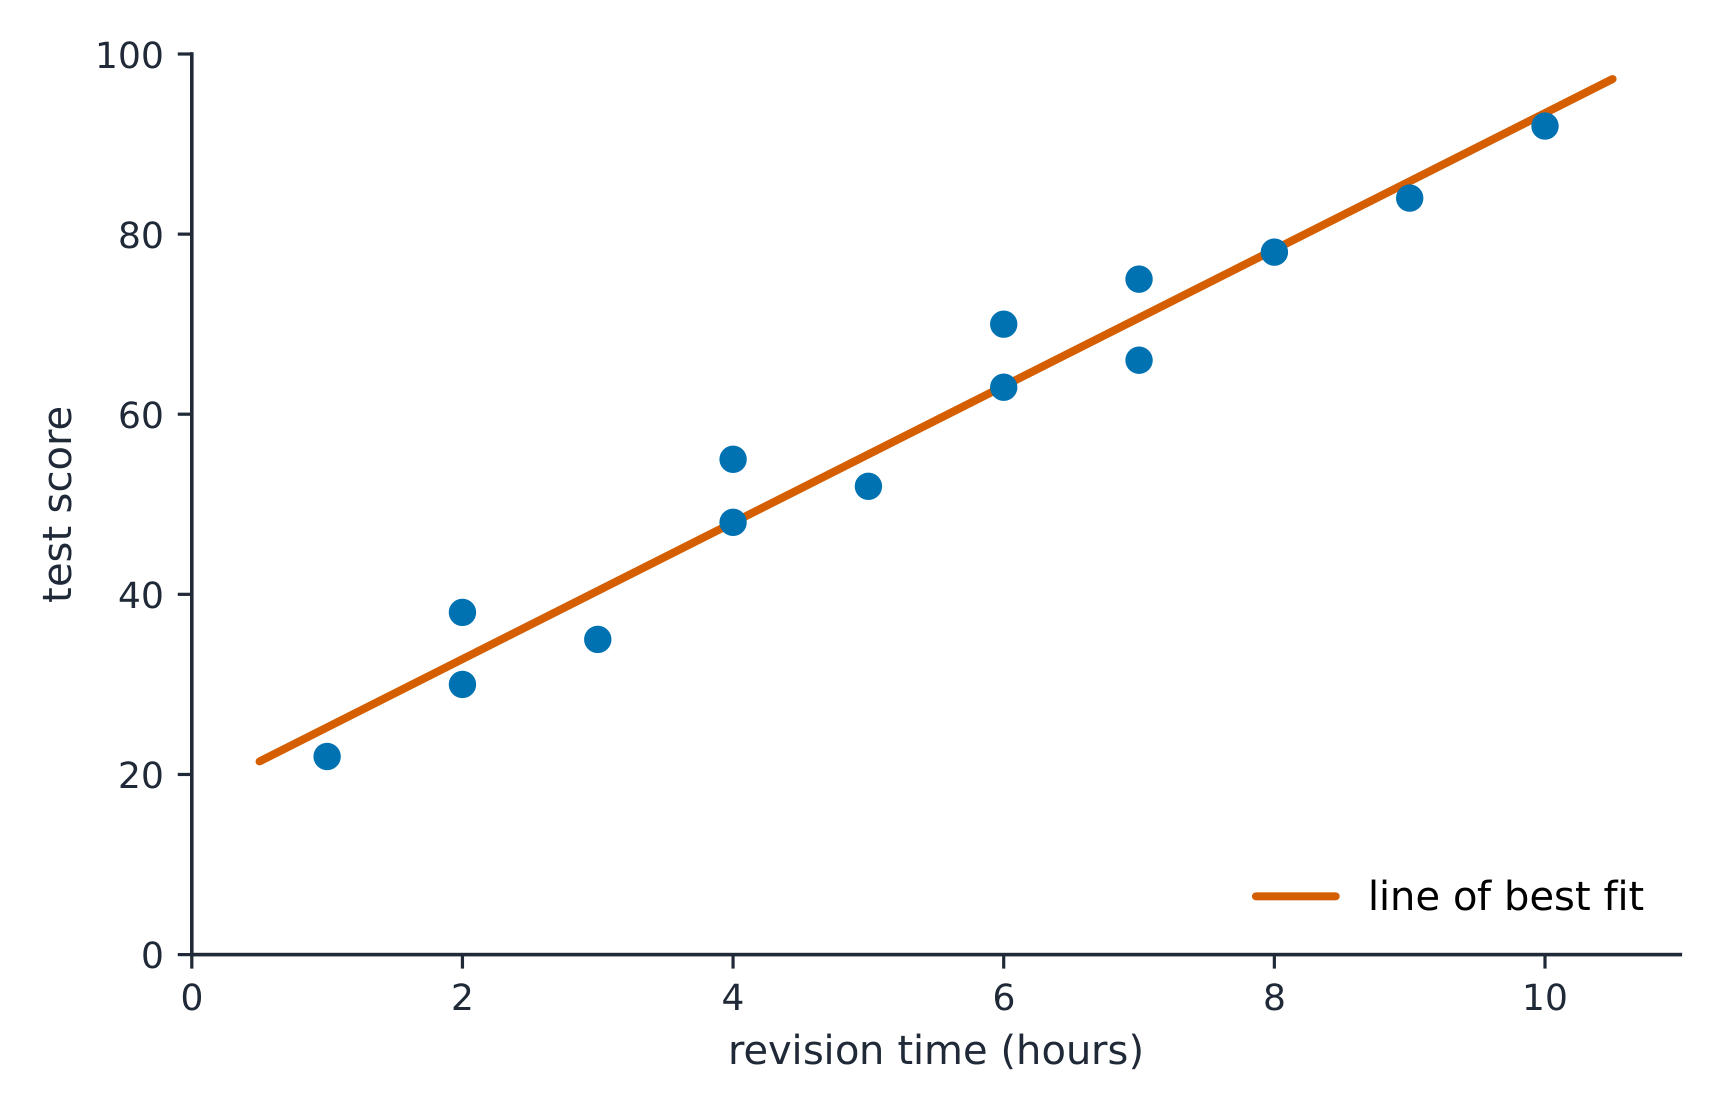
一个散点图(scatterplot)把每个个体画为一个点,解释变量在 $x$ 轴上而响应在 $y$ 轴上。用 DUFS 描述它:方向(Direction)(正/负)、不寻常(Unusual)特征(离群值、聚类)、形式(Form)(线性或曲线),以及强度(Strength)(点多紧地跟随模式)——总是在上下文里。

A line of best fit runs through the middle of the scattered points
一条最佳拟合线穿过散布的点的中间
词汇表 训练
英文 中文 拼音
scatterplot 散点图 sàn diǎn tú
2.5

相关性

大纲
Enduring UnderstandingLearning ObjectiveEssential Knowledge

DAT-1
Regression models may allow us to predict responses to changes in an explanatory variable.

DAT-1.B
Determine the correlation for a linear relationship. [Skill 2.C]

  • DAT-1.B.1 The correlation, $r$, gives the direction and quantifies the strength of the linear association between two quantitative variables.
  • DAT-1.B.2 The correlation coefficient can be calculated by: $r = \dfrac{1}{n-1} \sum \left( \dfrac{x_i - \bar{x}}{s_x} \right) \left( \dfrac{y_i - \bar{y}}{s_y} \right)$. However, the most common way to determine $r$ is by using technology.
  • DAT-1.B.3 A correlation coefficient close to 1 or $-1$ does not necessarily mean that a linear model is appropriate.

DAT-1.C
Interpret the correlation for a linear relationship. [Skill 4.B]

  • DAT-1.C.1 The correlation, $r$, is unit-free, and always between $-1$ and 1, inclusive. A value of $r = 0$ indicates that there is no linear association. A value of $r = 1$ or $r = -1$ indicates that there is a perfect linear association.
  • DAT-1.C.2 A perceived or real relationship between two variables does not mean that changes in one variable cause changes in the other. That is, correlation does not necessarily imply causation.

来源:美国大学理事会 AP 课程与考试说明

相关系数 r 的含义

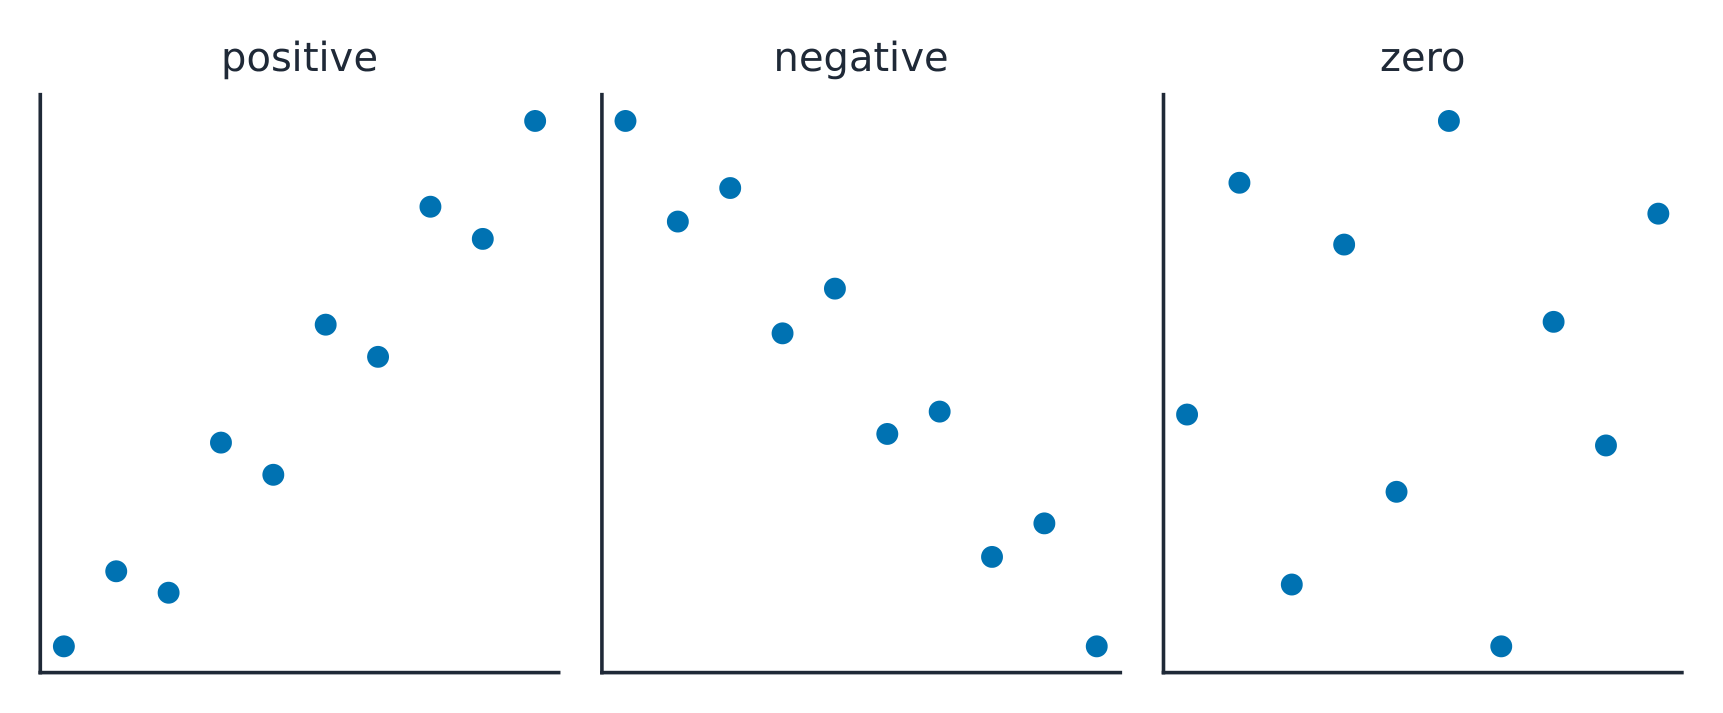
相关系数(correlation coefficient)$r$ 测量一个线性关系的强度和方向。它从 $-1$$1$:接近 $\pm 1$ 是强线性、接近 $0$ 是弱线性。$r$ 没有单位,而且若你交换变量它不改变。警告:$r$ 只测量线性强度、它对离群值不抵抗,而一个强的 $r$证明因果。

Positive correlation rises together; negative correlation moves in opposite directions
正相关一起上升;负相关朝相反方向移动
探索

Strength of a linear relationship

Correlation $r$ runs from $-1$ to $1$: near $\pm1$ the points hug a line, near 0 they scatter. Change it and watch the cloud tighten or spread.

词汇表 训练
英文 中文 拼音
correlation coefficient 相关系数 xiāng guān xì shù
2.6

线性回归模型

大纲
Enduring UnderstandingLearning ObjectiveEssential Knowledge

DAT-1
Regression models may allow us to predict responses to changes in an explanatory variable.

DAT-1.D
Calculate a predicted response value using a linear regression model. [Skill 2.C]

  • DAT-1.D.1 A simple linear regression model is an equation that uses an explanatory variable, $x$, to predict the response variable, $y$.
  • DAT-1.D.2 The predicted response value, denoted by $\hat{y}$, is calculated as $\hat{y} = a + bx$, where $a$ is the $y$-intercept and $b$ is the slope of the regression line, and $x$ is the value of the explanatory variable.
  • DAT-1.D.3 Extrapolation is predicting a response value using a value for the explanatory variable that is beyond the interval of $x$-values used to determine the regression line. The predicted value is less reliable as an estimate the further we extrapolate.

来源:美国大学理事会 AP 课程与考试说明

最小二乘回归线(least-squares regression line)预测响应:$\hat{y}=a+bx$,其中 $\hat{y}$预测的响应。斜率(slope)$b$$x$ 每增加一个单位 $y$ 的预测变化;$y$ 截距(y-intercept)$a$ 是当 $x=0$ 时预测的 $y$在上下文里并带单位解释两者——一个评分技能。避免外推(extrapolation)(在数据之外很远地预测)。

Worked example. 一个关于学习小时数($x$)和测验分数($y$)的研究给出 $\hat{y}=20+3x$。斜率意味着每额外一小时学习与一个预测的 $3$ 分增长关联。一个学习 $5$ 小时的学生被预测得 $\hat{y}=20+3(5)=35$ 分。

探索

Fit a least-squares line

A regression line is the best straight-line fit, minimising the squared vertical distances. Its slope predicts how $y$ changes per unit of $x$.

词汇表 训练
英文 中文 拼音
least-squares regression line 最小二乘回归线 zuì xiǎo èr chéng huí guī xiàn
slope 斜率 xié lǜ
y-intercept 截距 jié jù
extrapolation 外推 wài tuī
2.7

残差

大纲
Enduring UnderstandingLearning ObjectiveEssential Knowledge

DAT-1
Regression models may allow us to predict responses to changes in an explanatory variable.

DAT-1.E
Represent differences between measured and predicted responses using residual plots. [Skill 2.B]

  • DAT-1.E.1 The residual is the difference between the actual value and the predicted value: $\text{residual} = y - \hat{y}$.
  • DAT-1.E.2 A residual plot is a plot of residuals versus explanatory variable values or predicted response values.

DAT-1.F
Describe the form of association of bivariate data using residual plots. [Skill 2.A]

  • DAT-1.F.1 Apparent randomness in a residual plot for a linear model is evidence of a linear form to the association between the variables.
  • DAT-1.F.2 Residual plots can be used to investigate the appropriateness of a selected model.

来源:美国大学理事会 AP 课程与考试说明

最小二乘回归

一个残差(residual)是实际减预测,$y-\hat{y}$:一个点坐在线以上(+)还是以下(−)多远。一个残差图(residual plot)把残差对 $x$ 作图。若它显示没有模式(随机散布),一个线性模型是合适的;一个曲线或扇形模式意味着线性模型是一个差的拟合。

Worked example. 继续上面的研究,一个学习了 $5$ 小时的学生实际得 $40$ 分。残差是 $y-\hat{y}=40-35=+5$:线低估$5$ 分,所以这个点坐在线以上。

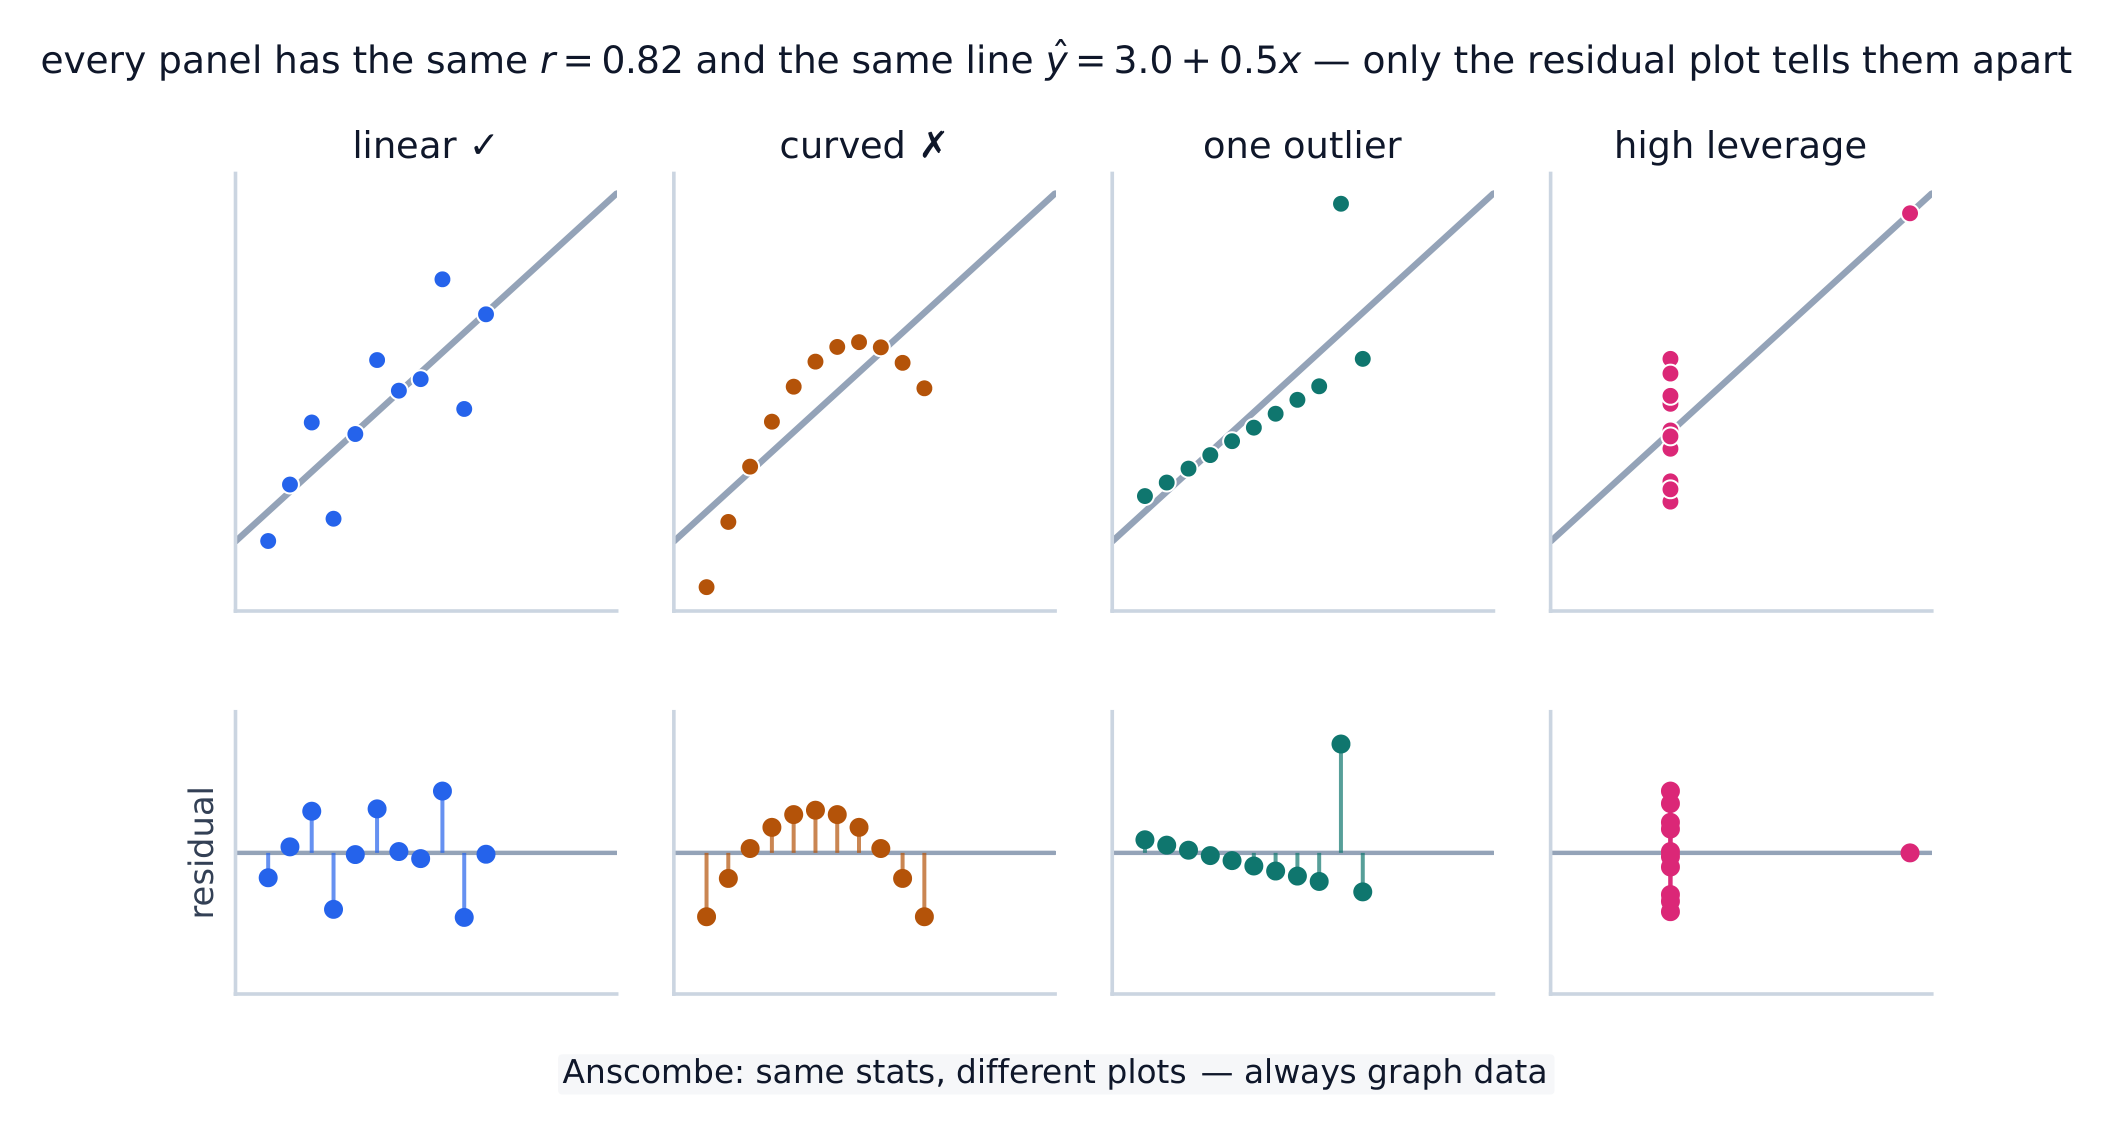
Four datasets with identical r and regression line but four different shapes
关于 $r$ 和这条线的一个警示:四个数据集都有相同的 $r=0.82$ 和相同的 $\hat{y}=3.0+0.5x$,但只有第一个真正是线性的。散点图几乎没有区别——每个下面的残差图才揭示出曲线、离群值和高杠杆点。
词汇表 训练
英文 中文 拼音
residual 残差 cán chà
residual plot 残差图 cán chà tú
2.8

最小二乘回归

大纲
Enduring UnderstandingLearning ObjectiveEssential Knowledge

DAT-1
Regression models may allow us to predict responses to changes in an explanatory variable.

DAT-1.G
Estimate parameters for the least-squares regression line model. [Skill 2.C]

  • DAT-1.G.1 The least-squares regression model minimizes the sum of the squares of the residuals and contains the point $(\bar{x}, \bar{y})$.
  • DAT-1.G.2 The slope, $b$, of the regression line can be calculated as $b = r \left( \dfrac{s_y}{s_x} \right)$ where $r$ is the correlation between $x$ and $y$, $s_y$ is the sample standard deviation of the response variable, $y$, and $s_x$ is the sample standard deviation of the explanatory variable, $x$.
  • DAT-1.G.3 Sometimes, the $y$-intercept of the line does not have a logical interpretation in context.
  • DAT-1.G.4 In simple linear regression, $r^2$ is the square of the correlation, $r$. It is also called the coefficient of determination. $r^2$ is the proportion of variation in the response variable that is explained by the explanatory variable in the model.

DAT-1.H
Interpret coefficients for the least-squares regression line model. [Skill 4.B]

  • DAT-1.H.1 The coefficients of the least-squares regression model are the estimated slope and $y$-intercept.
  • DAT-1.H.2 The slope is the amount that the predicted $y$-value changes for every unit increase in $x$.
  • DAT-1.H.3 The $y$-intercept value is the predicted value of the response variable when the explanatory variable is equal to $0$. The formula for the $y$-intercept, $a$, is $a = \bar{y} - b\bar{x}$.

来源:美国大学理事会 AP 课程与考试说明

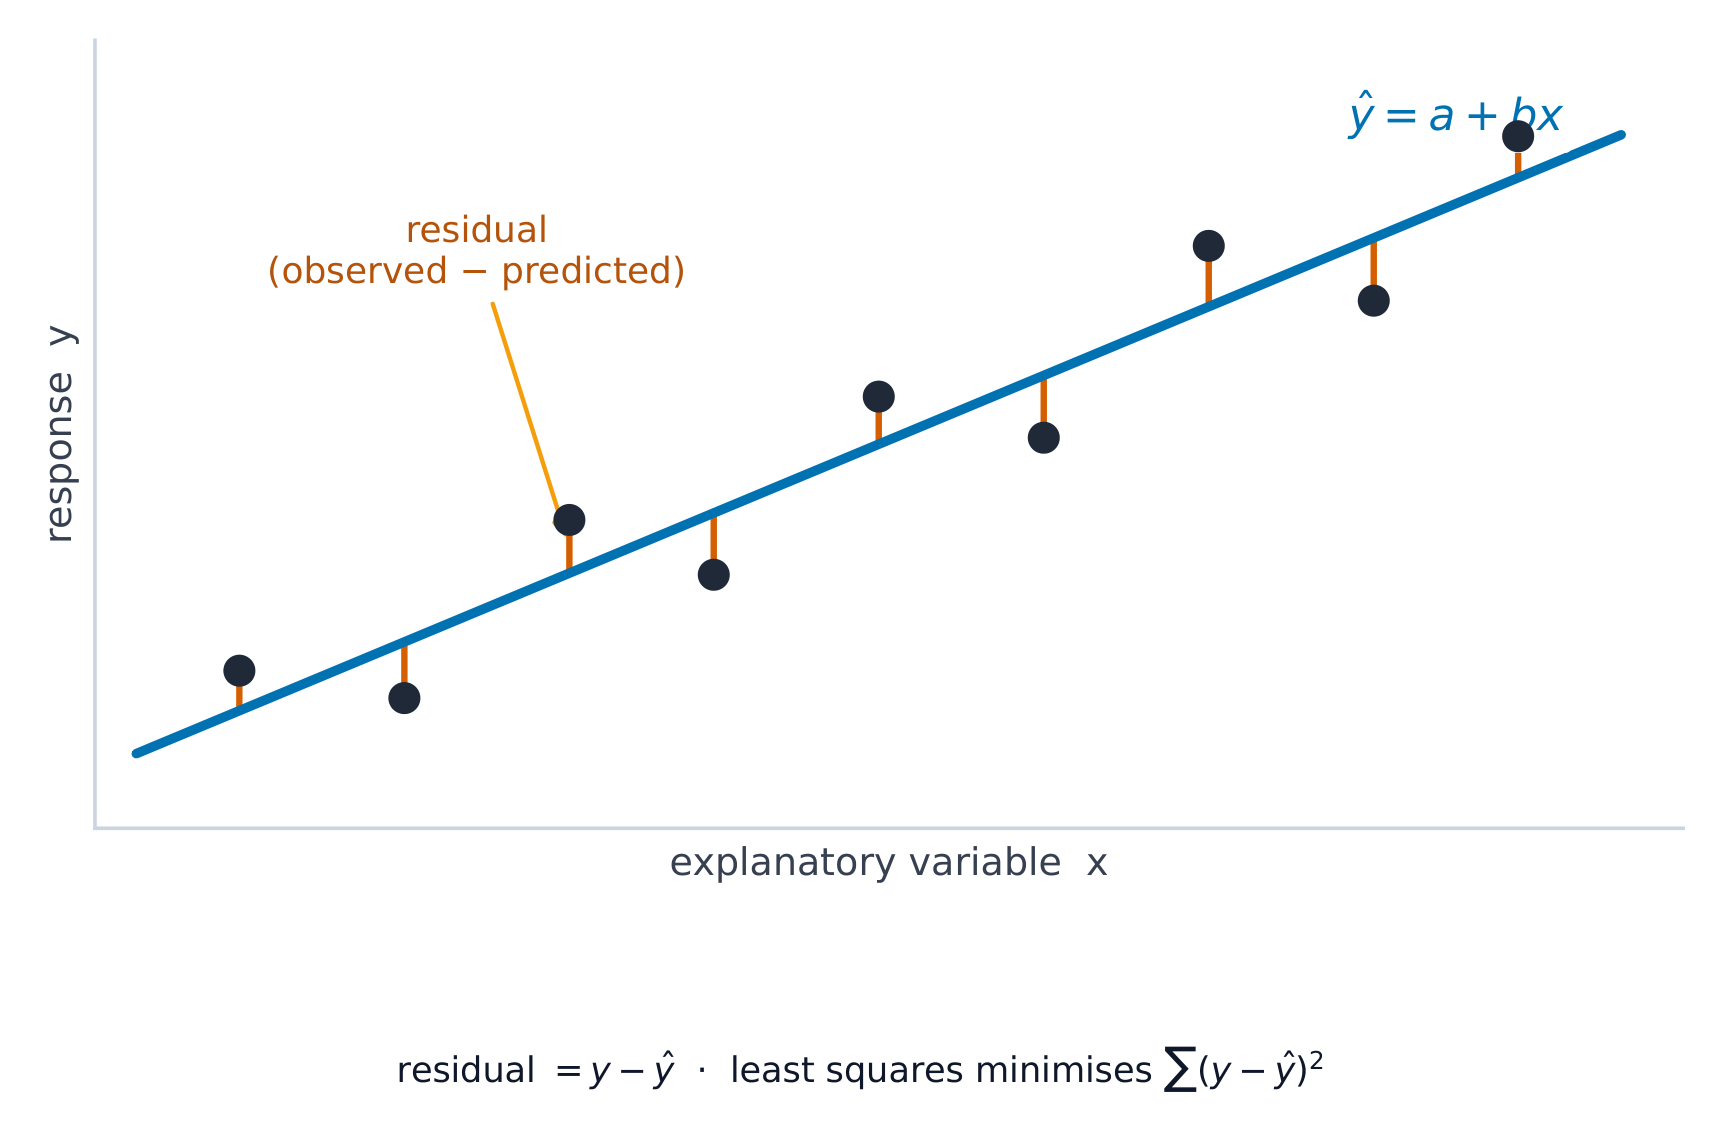
The least-squares line minimizes the sum of squared residuals
最小二乘线最小化残差平方的和

这条线最小化残差平方的和。它的拟合由以下测量:

  • $s$,残差的标准差——典型的预测误差,以响应的单位。
  • $r^2$,决定系数(coefficient of determination)——线性模型解释的 $y$ 的变异的比例(一个 $0$$1$ 之间的值;乘以 $100$ 得到百分数)。在上下文里报告它:"$r^2 = 0.81$ 意味着 $y$ 的变异的 81% 被与 $x$ 的线性关系解释。"
词汇表 训练
英文 中文 拼音
coefficient of determination 决定系数 jué dìng xì shù
2.9

分析偏离线性的情况

大纲
Enduring UnderstandingLearning ObjectiveEssential Knowledge

DAT-1
Regression models may allow us to predict responses to changes in an explanatory variable.

DAT-1.I
Identify influential points in regression. [Skill 2.A]

  • DAT-1.I.1 An outlier in regression is a point that does not follow the general trend shown in the rest of the data and has a large residual when the Least Squares Regression Line (LSRL) is calculated.
  • DAT-1.I.2 A high-leverage point in regression has a substantially larger or smaller $x$-value than the other observations have.
  • DAT-1.I.3 An influential point in regression is any point that, if removed, changes the relationship substantially. Examples include much different slope, $y$-intercept, and/or correlation. Outliers and high leverage points are often influential.

DAT-1.J
Calculate a predicted response using a least-squares regression line for a transformed data set. [Skill 2.C]

  • DAT-1.J.1 Transformations of variables, such as evaluating the natural logarithm of each value of the response variable or squaring each value of the explanatory variable, can be used to create transformed data sets, which may be more linear in form than the untransformed data.
  • DAT-1.J.2 Increased randomness in residual plots after transformation of data and/or movement of $r^2$ to a value closer to 1 offers evidence that the least-squares regression line for the transformed data is a more appropriate model to use to predict responses to the explanatory variable than the regression line for the untransformed data.

来源:美国大学理事会 AP 课程与考试说明

一些点强烈地影响这条线。一个高杠杆(high-leverage)点有一个极端的 $x$ 值;一个有影响的(influential)点在被移除时明显地改变斜率或 $r$;这里一个离群值(outlier)是一个有大残差的点。当模式是曲线的,变换(transform)一个变量(例如取一个对数)以把它拉直,然后对变换后的数据拟合一条线。

词汇表 训练
英文 中文 拼音
high-leverage 高杠杆 gāo gàng gǎn
influential 有影响的 yǒu yǐng xiǎng de
2.9

考试技巧

  • 在一个散点图上描述方向、形式、强度和离群值;$r$$-1$$1$
  • 相关不是因果——一个潜伏变量能驱动两者。
  • 在上下文里解释最小二乘线的斜率("$x$ 每一个单位,预测的 $y$ 改变 $b$")。
  • 检查一个残差图:没有模式意味着一条线拟合;一条曲线意味着它不。避免外推。
  • $r^2$ 是模型解释的 $y$ 的变异的分数。

本主题的互动课程

逐步学习,并即时检测练习。

AP 统计学历年真题

AP 统计学的更多主题

登录或创建账号

IGCSE, A-Level & AP