跳到主要内容

分类数据的推断:卡方

AP 统计学 · 第 8 主题

训练
讲义 词汇表
8.1

统计学导论:我的结果出乎意料吗?

大纲
Enduring UnderstandingLearning ObjectiveEssential Knowledge

VAR-1
Given that variation may be random or not, conclusions are uncertain.

VAR-1.J
Identify questions suggested by variation between observed and expected counts in categorical data. [Skill 1.A]

  • VAR-1.J.1 Variation between what we find and what we expect to find may be random or not.

来源:美国大学理事会 AP 课程与考试说明

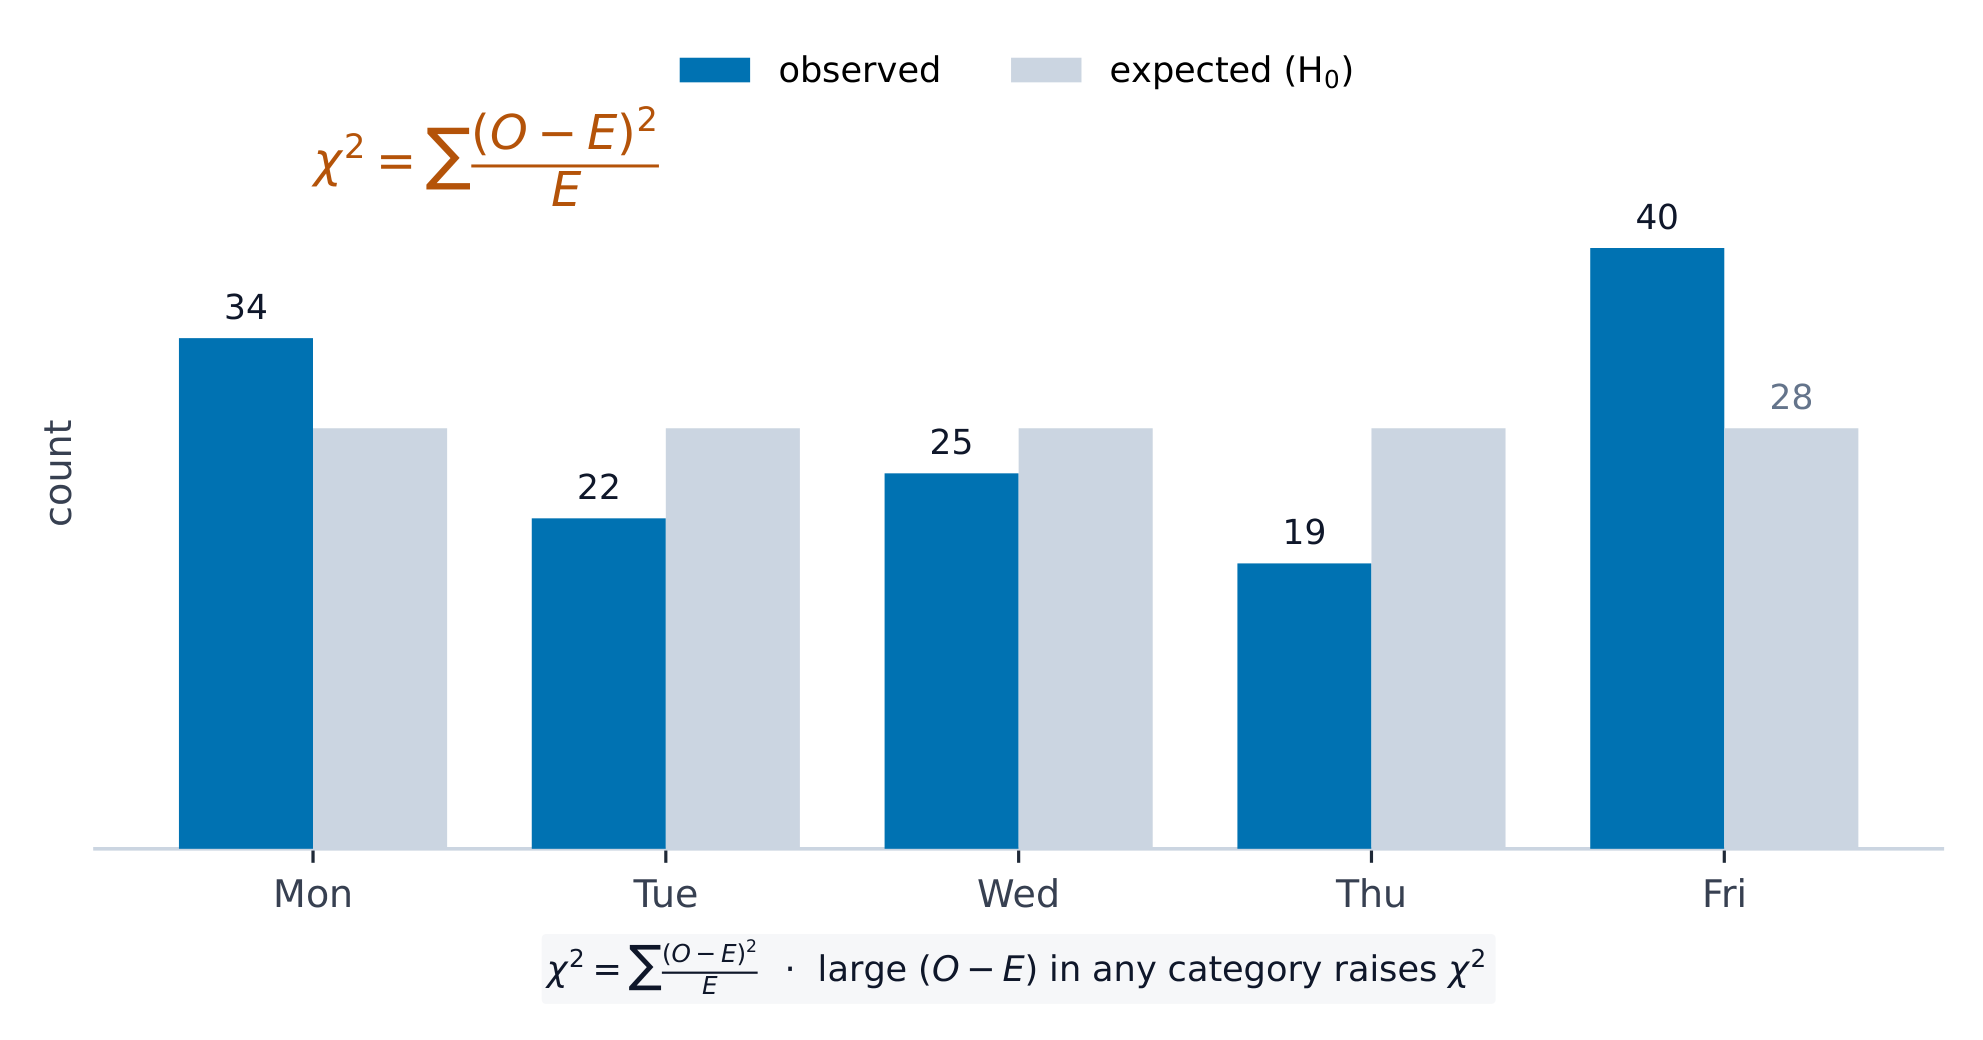
当数据是散布在几个类别上的计数(counts)时,我们检验观测计数是否不同于一个宣称预测的。工具是卡方(chi-square)($\chi^2$)统计量,它把观测和期望计数之间的标准化差加起来:

$$\chi^2=\sum \frac{(\text{observed}-\text{expected})^2}{\text{expected}}.$$
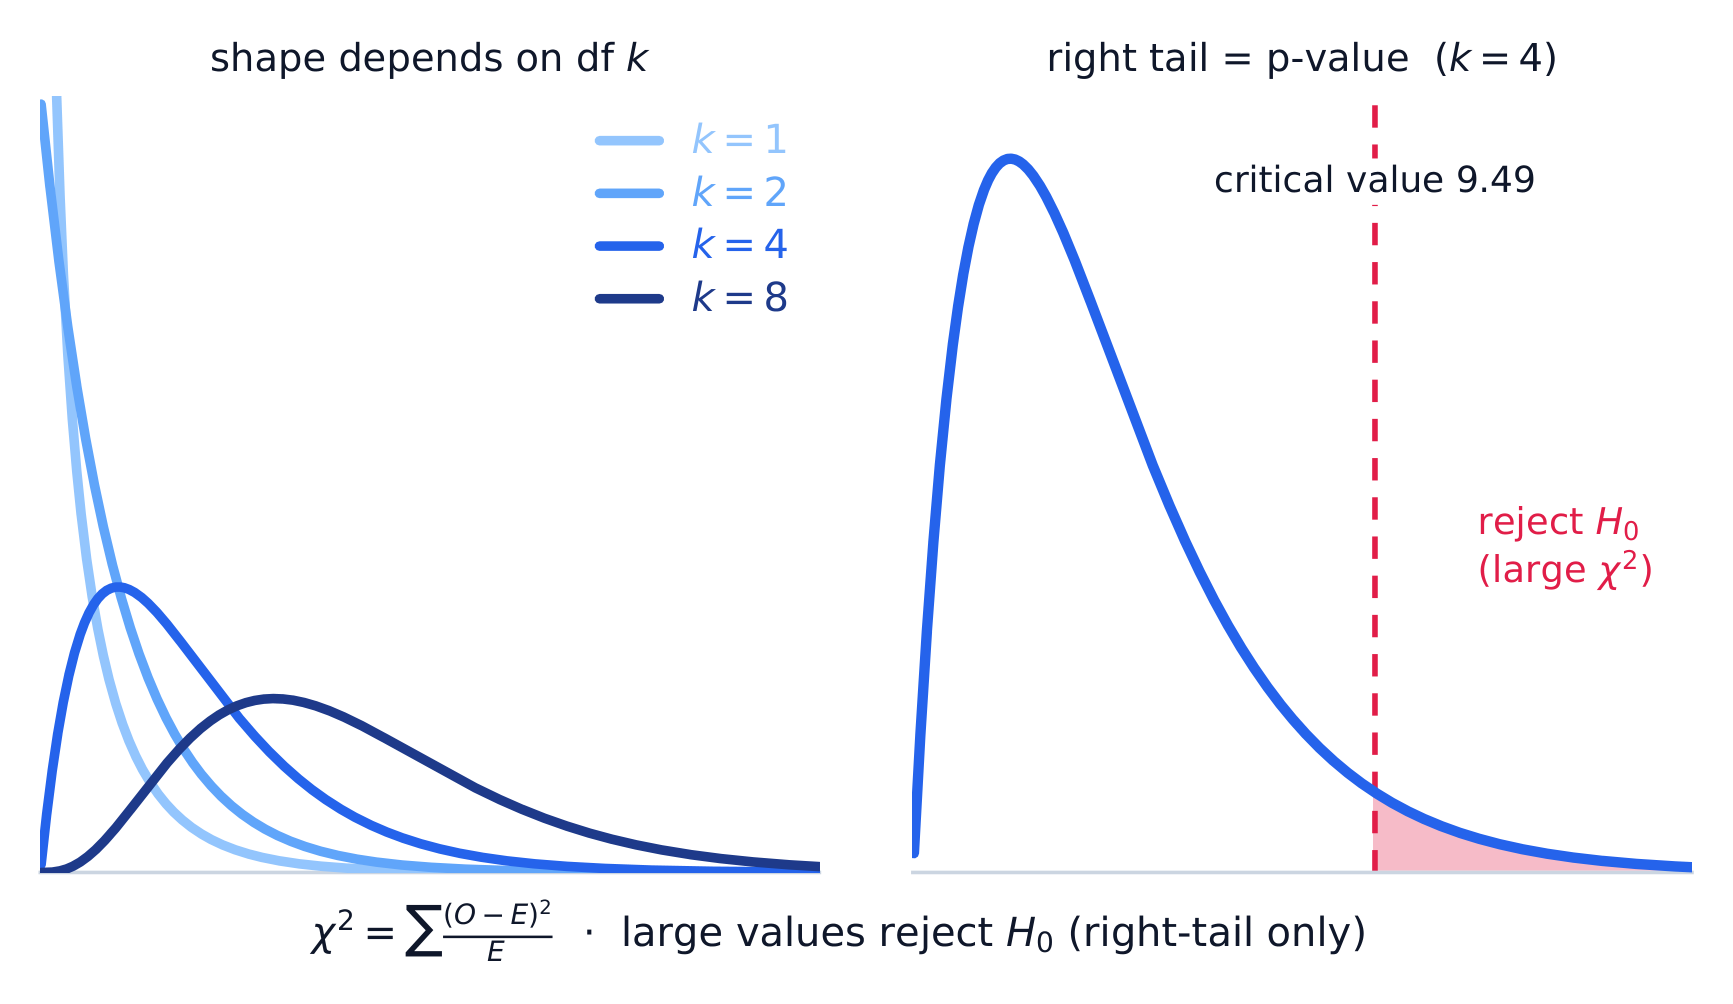
一个大的 $\chi^2$ 意味着观测计数远离期望——反对这个宣称的证据。卡方分布(chi-square distribution)右偏而取决于它的自由度(degrees of freedom)。

词汇表 训练
英文 中文 拼音
chi-square 卡方 kǎ fāng
degrees of freedom 自由度 zì yóu dù
8.2

建立卡方拟合优度检验

大纲
Enduring UnderstandingLearning ObjectiveEssential Knowledge

VAR-8
The chi-square distribution may be used to model variation.

VAR-8.A
Describe chi-square distributions. [Skill 3.C]

  • VAR-8.A.1 Expected counts of categorical data are counts consistent with the null hypothesis. In general, an expected count is a sample size times a probability.

    The chi-square statistic measures the distance between observed and expected counts relative to expected counts.

    Chi-square distributions have positive values and are skewed right. Within a family of density curves, the skew becomes less pronounced with increasing degrees of freedom.

VAR-8.B
Identify the null and alternative hypotheses in a test for a distribution of proportions in a set of categorical data. [Skill 1.F]

  • VAR-8.B.1 For a chi-square goodness-of-fit test, the null hypothesis specifies null proportions for each category, and the alternative hypothesis is that at least one of these proportions is not as specified in the null hypothesis.

VAR-8.C
Identify an appropriate testing method for a distribution of proportions in a set of categorical data. [Skill 1.E]

  • VAR-8.C.1 When considering a distribution of proportions for one categorical variable, the appropriate test is the chi-square test for goodness of fit.

VAR-8.D
Calculate expected counts for the chi-square test for goodness of fit. [Skill 3.A]

  • VAR-8.D.1 Expected counts for a chi-square goodness-of-fit test are (sample size)(null proportion).

VAR-8.E
Verify the conditions for making statistical inferences when testing goodness of fit for a chi-square distribution. [Skill 4.C]

  • VAR-8.E.1 In order to make statistical inferences for a chi-square test for goodness of fit we must check the following:
    • a. To check for independence:
      • i. Data should be collected using a random sample or randomized experiment.
      • ii. When sampling without replacement, check that $n \leq 10\%N$.
    • b. The chi-square test for goodness of fit becomes more accurate with more observations, so large counts should be used (shape).
      • i. A conservative check for large counts is that all expected counts should be greater than 5.

来源:美国大学理事会 AP 课程与考试说明

卡方检验

一个拟合优度(goodness-of-fit,GOF)检验检查一个分类变量是否遵循一个宣称的分布(例如"这个骰子是公平的")。假设:

$$H_0:\text{the distribution is as claimed}\qquad H_a:\text{at least one proportion differs}.$$
每个类别的期望计数(expected count)$=n\times(\text{claimed proportion})$。条件:随机样本、所有期望计数 $\ge 5$,以及 10% 条件。

The chi-square distribution and its right-tail rejection region
卡方分布右偏。一个大的统计量落在临界值之外的阴影右尾里——那是你拒绝这个模型的地方。
词汇表 训练
英文 中文 拼音
goodness-of-fit (GOF) 拟合优度 nǐ hé yōu dù
8.3

执行卡方拟合优度检验

大纲
Enduring UnderstandingLearning ObjectiveEssential Knowledge

VAR-8
The chi-square distribution may be used to model variation.

VAR-8.F
Calculate the appropriate statistic for the chi-square test for goodness of fit. [Skill 3.E]

  • VAR-8.F.1 The test statistic for the chi-square test for goodness of fit is
    • Equation: $\chi^2 = \sum \dfrac{(Observed\ count - Expected\ count)^2}{Expected\ count}$, with $degrees\ of\ freedom = number\ of\ categories - 1$.
  • VAR-8.F.2 The distribution of the test statistic assuming the null hypothesis is true (null distribution) can be either a randomization distribution or, when a probability model is assumed to be true, a theoretical distribution (chi-square).

VAR-8.G
Determine the $p$-value for chi-square test for goodness of fit significance test. [Skill 3.E]

  • VAR-8.G.1 The $p$-value for a chi-square test for goodness of fit for a number of degrees of freedom is found using the appropriate table or computer generated output.

DAT-3
Significance testing allows us to make decisions about hypotheses within a particular context.

DAT-3.I
Interpret the $p$-value for the chi-square test for goodness of fit. [Skill 4.B]

  • DAT-3.I.1 An interpretation of the $p$-value for the chi-square test for goodness of fit is the probability, given the null hypothesis and probability model are true, of obtaining a test statistic as, or more, extreme than the observed value.

DAT-3.J
Justify a claim about the population based on the results of a chi-square test for goodness of fit. [Skill 4.E]

  • DAT-3.J.1 A decision to either reject or fail to reject the null hypothesis is based on comparison of the $p$-value to the significance level, $\alpha$.
  • DAT-3.J.2 The results of a chi-square test for goodness of fit can serve as the statistical reasoning to support the answer to a research question about the population that was sampled.

来源:美国大学理事会 AP 课程与考试说明

计算 $\chi^2=\sum\dfrac{(O-E)^2}{E}$$df=(\text{number of categories})-1$。从卡方分布(上尾)求 $p$ 值、与 $\alpha$ 比较,并在上下文里得出结论。这个和的一个大分量指向偏离最多的类别。

Chi-square compares observed counts with those expected under the null hypothesis
卡方把观测计数与在原假设下期望的那些比较

Worked example. 一个骰子掷 $60$ 次给出计数 $8,10,12,9,11,10$。若它公平,每个期望计数是 $60/6=10$,所以

$$\chi^2=\frac{(8-10)^2}{10}+\frac{(10-10)^2}{10}+\frac{(12-10)^2}{10}+\frac{(9-10)^2}{10}+\frac{(11-10)^2}{10}+\frac{(10-10)^2}{10}=0.4+0+0.4+0.1+0.1+0=1.0,$$
$df=6-1=5$。要写出每一个类别,包括两个正好等于期望计数、因而加 $0$ 的类别——求和跑遍全部六个类别,而 $df$ 数的是类别数,不是只数有差异的那些。这个 $\chi^2$ 很小(一个大的 $p$ 值),所以我们未能拒绝 $H_0$ ——没有骰子不公平的证据。

探索

Explore the chi-square distribution and its p-value

The p-value is the area in the right tail beyond your test statistic, so a larger $\chi^2$ means a smaller p-value. Drag $\chi^2$ to watch that area shrink, and drag df to see the whole family change shape — strongly right-skewed at small df, more symmetric as df grows.

8.4

双向表中的期望频数
大纲
Enduring UnderstandingLearning ObjectiveEssential Knowledge

VAR-8
The chi-square distribution may be used to model variation.

VAR-8.H
Calculate expected counts for two-way tables of categorical data. [Skill 3.A]

  • VAR-8.H.1 The expected count in a particular cell of a two-way table of categorical data can be calculated using the formula:
    • Equation: $expected\ count = \dfrac{(row\ total)(column\ total)}{table\ total}$.

来源:美国大学理事会 AP 课程与考试说明

对于一个双向表,一个单元格里的期望计数(在"没有关联"下)是

$$E=\frac{(\text{row total})\times(\text{column total})}{\text{grand total}}.$$
这是若行和列变量无关你会看到的计数。

Worked example. 在一个双向表里一个单元格的行总计是 $40$、它的列总计是 $50$,而总计是 $200$。它的期望计数是 $E=\dfrac{40\times50}{200}=10$。对每个单元格重复给出期望表以对照观测的那个比较。

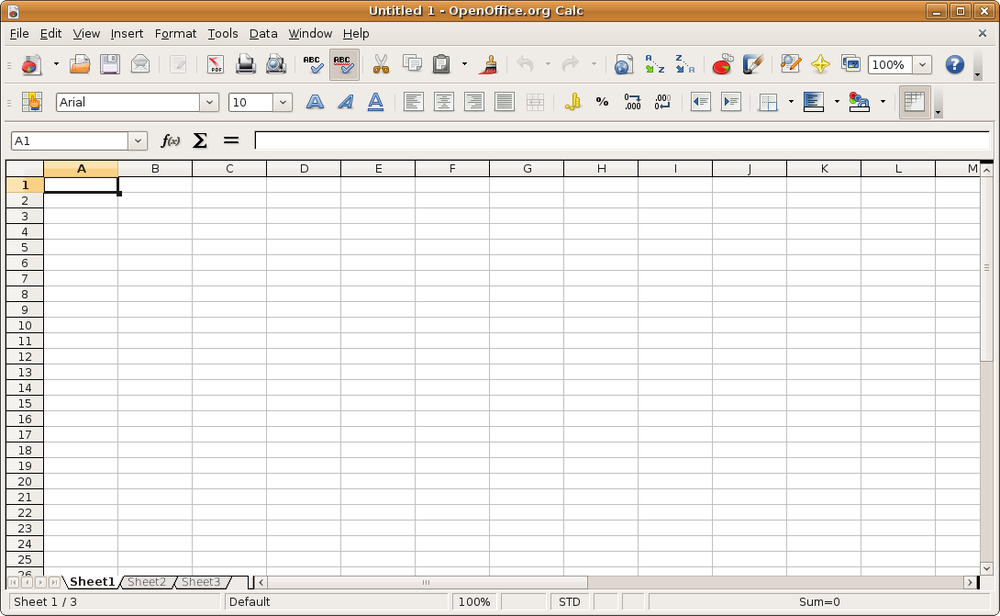
电子表格在卡方检验前整理分类计数
电子表格在卡方检验前整理分类计数
8.5

建立卡方齐性或独立性检验

大纲
Enduring UnderstandingLearning ObjectiveEssential Knowledge

VAR-8
The chi-square distribution may be used to model variation.

VAR-8.I
Identify the null and alternative hypotheses for a chi-square test for homogeneity or independence. [Skill 1.F]

  • VAR-8.I.1 The appropriate hypotheses for a chi-square test for homogeneity are:

    $H_0$: There is no difference in distributions of a categorical variable across populations or treatments.

    $H_a$: There is a difference in distributions of a categorical variable across populations or treatments.

  • VAR-8.I.2 The appropriate hypotheses for a chi-square test for independence are:

    $H_0$: There is no association between two categorical variables in a given population or the two categorical variables are independent.

    $H_a$: Two categorical variables in a population are associated or dependent.

VAR-8.J
Identify an appropriate testing method for comparing distributions in two-way tables of categorical data. [Skill 1.E]

  • VAR-8.J.1 When comparing distributions to determine whether proportions in each category for categorical data collected from different populations are the same, the appropriate test is the chi-square test for homogeneity.
  • VAR-8.J.2 To determine whether row and column variables in a two-way table of categorical data might be associated in the population from which the data were sampled, the appropriate test is the chi-square test for independence.

VAR-8.K
Verify the conditions for making statistical inferences when testing a chi-square distribution for independence or homogeneity. [Skill 4.C]

  • VAR-8.K.1 In order to make statistical inferences for a chi-square test for two-way tables (homogeneity or independence), we must verify the following:
    • a. To check for independence:
      • i. For a test for independence: Data should be collected using a simple random sample.
      • ii. For a test for homogeneity: Data should be collected using a stratified random sample or randomized experiment.
      • iii. When sampling without replacement, check that $n \leq 10\%N$.
    • b. The chi-square tests for independence and homogeneity become more accurate with more observations, so large counts should be used (shape).
      • i. A conservative check for large counts is that all expected counts should be greater than 5.

来源:美国大学理事会 AP 课程与考试说明

两个检验用相同的 $\chi^2$ 数学但回答不同的问题:

  • 同质性检验(test for homogeneity):一个分类变量的分布是否跨几个总体或组相同(分开的样本/处理)?
  • 独立性检验(test for independence):两个分类变量是否在单个总体内关联(一个样本、测量两个变量)?

设计(几个样本对一个样本)决定用哪个名称和假设。

词汇表 训练
英文 中文 拼音
Test for homogeneity 同质性 tóng zhì xìng
Test for independence 独立性 dú lì xìng
8.6

执行卡方齐性或独立性检验

大纲
Enduring UnderstandingLearning ObjectiveEssential Knowledge

VAR-8
The chi-square distribution may be used to model variation.

VAR-8.L
Calculate the appropriate statistic for a chi-square test for homogeneity or independence. [Skill 3.E]

  • VAR-8.L.1 The appropriate test statistic for a chi-square test for homogeneity or independence is the chi-square statistic:
    • Equation: $\chi^2 = \sum \dfrac{(Observed\ count - Expected\ count)^2}{Expected\ count}$, with degrees of freedom equal to: $(number\ of\ rows - 1)(number\ of\ columns - 1)$.

VAR-8.M
Determine the $p$-value for a chi-square significance test for independence or homogeneity. [Skill 3.E]

  • VAR-8.M.1 The $p$-value for a chi-square test for independence or homogeneity for a number of degrees of freedom is found using the appropriate table or technology.
  • VAR-8.M.2 For a test of independence or homogeneity for a two-way table, the $p$-value is the proportion of values in a chi-square distribution with appropriate degrees of freedom that are equal to or larger than the test statistic.

DAT-3
Significance testing allows us to make decisions about hypotheses within a particular context.

DAT-3.K
Interpret the $p$-value for the chi-square test for homogeneity or independence. [Skill 4.B]

  • DAT-3.K.1 An interpretation of the $p$-value for the chi-square test for homogeneity or independence is the probability, given the null hypothesis and probability model are true, of obtaining a test statistic as, or more, extreme than the observed value.

DAT-3.L
Justify a claim about the population based on the results of a chi-square test for homogeneity or independence. [Skill 4.E]

  • DAT-3.L.1 A decision to either reject or fail to reject the null hypothesis for a chi-square test for homogeneity or independence is based on comparison of the $p$-value to the significance level, $\alpha$.
  • DAT-3.L.2 The results of a chi-square test for homogeneity or independence can serve as the statistical reasoning to support the answer to a research question about the population that was sampled (independence) or the populations that were sampled (homogeneity).

来源:美国大学理事会 AP 课程与考试说明

计算期望计数,然后在所有单元格上 $\chi^2=\sum\dfrac{(O-E)^2}{E}$,带

$$df=(\text{rows}-1)(\text{columns}-1).$$
条件:随机数据、所有期望计数 $\ge 5$、10% 条件。求 $p$ 值、与 $\alpha$ 比较,并在上下文里得出结论——组之间一个差异(同质性)或一个关联(独立性)的证据。

8.7

技能聚焦:为分类数据选择合适的推断方法

大纲

This topic is intended to focus on the skill of selecting an appropriate inference procedure now that students have a range of options. Students should be given opportunities to practice when and how to apply all learning objectives relating to inference for categorical data.

来源:美国大学理事会 AP 课程与考试说明

按设置决定:一个分类变量对照一个宣称的分布 $\Rightarrow$ 拟合优度;一个样本按两个变量交叉分类 $\Rightarrow$ 独立性;比较几个样本/组 $\Rightarrow$ 同质性。只比较两个比例能用一个两比例 $z$ 检验或一个卡方检验,但仅限双尾备择假设,此时两者完全一致($\chi^2=z^2$)。卡方检验总是双尾的,所以它给不出有方向的结论:若 $H_a$ 是单尾的(比如 $p_1>p_2$),要用 $z$ 检验。

探索

Which chi-square test is this?

All three tests use the same $\chi^2$ arithmetic, so the marks are won by naming the right one. The design decides — how many samples were taken, and how many variables were measured on each unit.

8.7

考试技巧

  • 分类数据用 $\chi^2=\sum\tfrac{(O-E)^2}{E}$;总是除以期望计数。
  • 挑正确的检验:拟合优度(一个变量)、独立性,或同质性(双向表)。
  • 把期望计数算作 $\tfrac{\text{row total}\times\text{column total}}{\text{grand total}}$ 并检查每个 $\ge5$
  • 一个大的 $\chi^2$(小 p 值)意味着观测计数比机会更多地不同于期望。
  • 正确地陈述自由度(类别 $-1$,或 $(r-1)(c-1)$)。

本主题的互动课程

逐步学习,并即时检测练习。

AP 统计学历年真题

AP 统计学的更多主题

登录或创建账号

IGCSE, A-Level & AP