Skip to content · ⁨ข้ามไปยังเนื้อหา⁩

Inference for Quantitative Data: Means · ⁨การอนุมานสำหรับข้อมูลเชิงปริมาณ: ค่าเฉลี่ย⁩

AP Statistics · Topic 7 · ⁨หัวข้อ 7⁩

Video lesson for this topic · ⁨บทเรียนวิดีโอสำหรับหัวข้อนี้⁩ Open the video page · ⁨เปิดหน้าวิดีโอ⁩
7:38

การอนุมานสำหรับข้อมูลเชิงปริมาณ: ค่าเฉลี่ย

คุณรู้จักแก่นแท้ของการสรุปอยู่แล้ว นำตัวอย่างมาหาค่าเฉลี่ย แล้วทำซ้ำไปเรื่อยๆ แม้ประชากรจะเอียง ค่าเฉลี่ยของตัวอย่างเหล่านี้...

English narration · English + 中文 subtitles burned in · ⁨การบรรยายภาษาอังกฤษ · คำบรรยายภาษาอังกฤษ + 中文 ลอยตัวบนภาพ⁩

7.1

Should I Worry About Error? · ⁨ฉันควรกังวลเรื่องความผิดพลาดไหม?⁩

Syllabus · ⁨หลักสูตร⁩
English

Enduring Understanding (VAR-1): Given that variation may be random or not, conclusions are uncertain.

Learning Objective VAR-1.I: Identify questions suggested by probabilities of errors in statistical inference. [Skill 1.A]

  • VAR-1.I.1 Random variation may result in errors in statistical inference.
ไทย

ความเข้าใจที่ยั่งยืน (VAR-1): เนื่องจากความแปรปรวนอาจเป็นแบบสุ่มหรือไม่ ดังนั้นข้อสรุปจึงมีความไม่แน่นอน

วัตถุประสงค์การเรียนรู้ VAR-1.I: ระบุคำถามที่อาจเกิดขึ้นจากความน่าจะเป็นของข้อผิดพลาดในการสรุปผลทางสถิติ [ทักษะ 1.A]

  • VAR-1.I.1 ความแปรปรวนแบบสุ่มอาจนำไปสู่ข้อผิดพลาดในการสรุปผลทางสถิติ

Source: College Board AP Course and Exam Description · ⁨แหล่งที่มา: คำอธิบายหลักสูตรและข้อสอบ College Board AP⁩

English
Type I and Type II errors

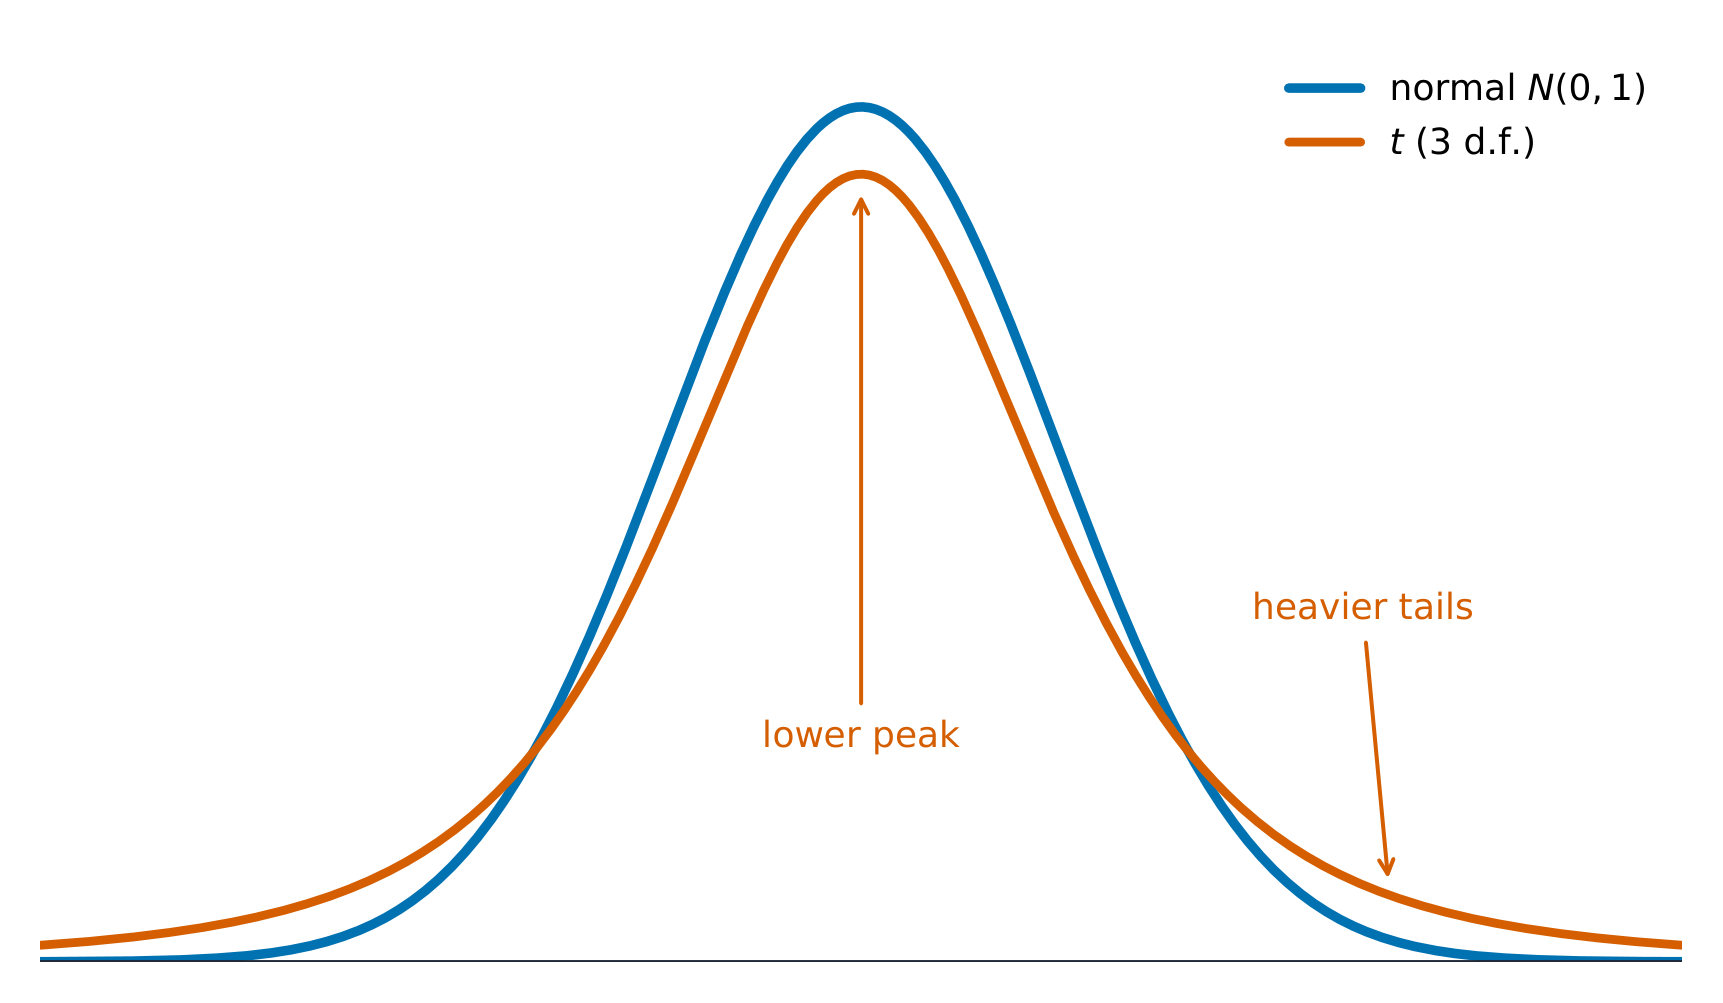
Inference for a mean works like inference for a proportion, with one change: we rarely know the population standard deviation $\sigma$, so we estimate it with the sample $s$. That extra uncertainty means we use the $t$-distribution instead of the normal – a distribution 分布 that is bell-shaped but with heavier tails, and it depends on the degrees of freedom 自由度 $df=n-1$; as $n$ grows it approaches the normal.

ไทย
ความผิดพลาดประเภทที่ I และ Type II

Inference สำหรับ ค่าเฉลี่ย ทำงานคล้ายกับ Inference สำหรับสัดส่วน แต่มีการเปลี่ยนแปลงเล็กน้อย: เรามักจะไม่ทราบค่าเบี่ยงเบนมาตรฐานประชากร $\sigma$ ดังนั้นเราจึงประมาณค่า它以ด้วยค่า $s$ จากตัวอย่าง. ความไม่แน่นอนเพิ่มเติมนี้ทำให้เราต้องใช้ การกระจายตัว $t$ แทนการกระจายตัวปกติ – ซึ่งเป็นการกระจายตัวที่มีรูปทรงกระดิ่งแต่มีส่วนหางหนากว่า และขึ้นอยู่กับ ดีกรีของอิสรภาพ (degrees of freedom) $df=n-1$; เมื่อ $n$ มีขนาดใหญ่ขึ้น จะเข้าใกล้การกระจายตัวปกติ.

Vocabulary · ⁨คำศัพท์⁩ Train · ⁨ฝึกฝน⁩
English ไทย
degrees of freedom/dɪˈɡriːz ɒv ˈfriːdəm/ ระดับอิสระ
paired data/peəd ˈdeɪtə/ ข้อมูลคู่ (paired data)
7.2

Confidence Interval for a Mean · ⁨ช่วงความเชื่อมั่นสำหรับค่าเฉลี่ย⁩

Syllabus · ⁨หลักสูตร⁩
English

Enduring Understanding (VAR-7): The $t$-distribution may be used to model variation.

Learning Objective VAR-7.A: Describe $t$-distributions. [Skill 3.C]

  • VAR-7.A.1 When $s$ is used instead of $\sigma$ to calculate a test statistic, the corresponding distribution, known as the $t$-distribution, varies from the normal distribution in shape, in that more of the area is allocated to the tails of the density curve than in a normal distribution.
  • VAR-7.A.2 As the degrees of freedom increase, the area in the tails of a $t$-distribution decreases.

Enduring Understanding (UNC-4): An interval of values should be used to estimate parameters, in order to account for uncertainty.

Learning Objective UNC-4.O: Identify an appropriate confidence interval procedure for a population mean, including the mean difference between values in matched pairs. [Skill 1.D]

  • UNC-4.O.1 Because $\sigma$ is typically not known for distributions of quantitative variables, the appropriate confidence interval procedure for estimating the population mean of one quantitative variable for one sample is a one-sample $t$-interval for a mean.
  • UNC-4.O.2 For one quantitative variable, $X$, that is normally distributed, the distribution of $t = \dfrac{(\overline{x} - \mu)}{\frac{s}{\sqrt{n}}}$ is a $t$-distribution with $n-1$ degrees of freedom.
  • UNC-4.O.3 Matched pairs can be thought of as one sample of pairs. Once differences between pairs of values are found, inference for confidence intervals proceeds as for a population mean.

Learning Objective UNC-4.P: Verify the conditions for calculating confidence intervals for a population mean, including the mean difference between values in matched pairs. [Skill 4.C]

  • UNC-4.P.1 In order to calculate confidence intervals to estimate a population mean, we must check for independence and that the sampling distribution is approximately normal:
    • a. To check for independence:
      • i. Data should be collected using a random sample or a randomized experiment.
      • ii. When sampling without replacement, check that $n \leq 10\%N$, where $N$ is the size of the population.
    • b. To check that the sampling distribution of $\overline{x}$ is approximately normal (shape):
      • i. If the observed distribution is skewed, $n$ should be greater than 30.
      • ii. If the sample size is less than 30, the distribution of the sample data should be free from strong skewness and outliers.

Learning Objective UNC-4.Q: Determine the margin of error for a given sample size for a one-sample $t$-interval. [Skill 3.D]

  • UNC-4.Q.1 The critical value $t^*$ with $n-1$ degrees of freedom can be found using a table or computer-generated output.
  • UNC-4.Q.2 The standard error for a sample mean is given by $SE = \dfrac{s}{\sqrt{n}}$, where $s$ is the sample standard deviation.
  • UNC-4.Q.3 For a one-sample $t$-interval for a mean, the margin of error is the critical value ($t^*$) times the standard error ($SE$), which equals $t^*\left(\dfrac{s}{\sqrt{n}}\right)$.

Learning Objective UNC-4.R: Calculate an appropriate confidence interval for a population mean, including the mean difference between values in matched pairs. [Skill 3.D]

  • UNC-4.R.1 The point estimate for a population mean is the sample mean, $\overline{x}$.
  • UNC-4.R.2 For the population mean for one sample with unknown population standard deviation, the confidence interval is $\overline{x} \pm t^* \dfrac{s}{\sqrt{n}}$.

Boundary statement: Formulas for interval estimates do not appear explicitly on the AP Statistics Formula Sheet provided with the AP Statistics Exam. However, these formulas do not need to be memorized, as they can be constructed based on the general test statistic formula and the relevant standard error formulas that are provided on the formula sheet.

ไทย

ความเข้าใจที่ยั่งยืน (VAR-7): การแจกแจง $t$ สามารถUsed用来 model ความแปรปรวนได้

วัตถุประสงค์การเรียนรู้ VAR-7.A: อธิบายการแจกแจง $t$ [ทักษะ 3.C]

  • VAR-7.A.1 เมื่อใช้ $s$ แทน $\sigma$ ในการคำนวณค่าทดสอบ การแจกแจงที่เกี่ยวข้อง ซึ่งเรียกว่า การแจกแจง $t$ จะแตกต่างจากการแจกแจงปกติทั้งในแง่รูปร่าง โดยมีการจัดสรรพื้นที่มากกว่าไปยังส่วนปลายของเส้นโค้งความหนาแน่นเมื่อเทียบกับการแจกแจงปกติ
  • VAR-7.A.2 เมื่อองศาอิสระเพิ่มขึ้น พื้นที่บริเวณส่วนปลายของการแจกแจง $t$ จะลดลง

ความเข้าใจที่ยั่งยืน (UNC-4): ควรใช้ช่วงของค่าเพื่อประมาณพารามิเตอร์ เพื่อคำนึงถึงความไม่แน่นอน

วัตถุประสงค์การเรียนรู้ UNC-4.O: ระบุขั้นตอนการสร้างช่วงความเชื่อมั่นที่เหมาะสมสำหรับค่าเฉลี่ยประชากร รวมถึงผลต่างของค่าเฉลี่ยระหว่างคู่ข้อมูล yang匹配的 [ทักษะ 1.D]

  • UNC-4.O.1 เนื่องจาก $\sigma$ มักไม่ทราบสำหรับการแจกแจงของตัวแปรเชิงปริมาณ ขั้นตอนการสร้างช่วงความเชื่อมั่นที่เหมาะสมสำหรับการประมาณค่าเฉลี่ยประชากรของตัวแปรเชิงปริมาณหนึ่งจากตัวอย่างเดียวคือ ช่วง $t$ สำหรับค่าเฉลี่ยแบบตัวอย่างเดียว
  • UNC-4.O.2 สำหรับตัวแปรเชิงปริมาณหนึ่งตัว $X$ ที่มีการแจกแจงแบบปกติ การแจกแจงของ $t = \dfrac{(\overline{x} - \mu)}{\frac{s}{\sqrt{n}}}$ คือ การแจกแจง $t$ โดยมี $n-1$ องศาอิสระ
  • UNC-4.O.3 คู่ข้อมูล matched pairs สามารถคิดว่าเป็นตัวอย่างหนึ่งของคู่ข้อมูล เมื่อหาผลต่างระหว่างคู่ของค่าได้แล้ว การสรุปผลเพื่อสร้างช่วงความเชื่อมั่นจะดำเนินการเหมือนกับการสรุปผลสำหรับค่าเฉลี่ยประชากร

วัตถุประสงค์การเรียนรู้ UNC-4.P: ตรวจสอบเงื่อนไขสำหรับการคำนวณช่วงความเชื่อมั่นสำหรับค่าเฉลี่ยประชากร รวมถึงผลต่างของค่าเฉลี่ยระหว่างคู่ข้อมูล which匹配 [ทักษะ 4.C]

  • UNC-4.P.1 เพื่อคำนวณช่วงความเชื่อมั่นเพื่อประมาณค่าเฉลี่ยประชากร เราต้องตรวจสอบความเป็นอิสระและตรวจสอบว่าการแจกแจงตัวอย่างมีความใกล้เคียงกับความเป็นปกติ:
    • ก. ในการตรวจสอบความเป็นอิสระ:
      • i. ข้อมูลควรเก็บด้วยวิธีสุ่มตัวอย่างหรือการทดลองแบบสุ่ม
      • ii. เมื่อสุ่มโดยไม่แทนที่ ตรวจสอบให้แน่ใจว่า $n \leq 10\%N$ โดยที่ $N$ คือขนาดของประชากร
    • ง. เพื่อตรวจสอบว่าการแจกแจงของตัวอย่างของ $\overline{x}$ เป็นแบบปกติโดยประมาณ (รูปร่าง):
      • i. หากการแจกแจงที่สังเกตเห็นมีความเบ้ $n$ ควรมากกว่า 30
      • ii. หากขนาดตัวอย่างน้อยกว่า 30 การแจกแจงของข้อมูลตัวอย่างควรปราศจากความเบ้อย่างรุนแรงและค่าผิดปกติ

วัตถุประสงค์การเรียนรู้ UNC-4.Q: หาขอบเขตความคลาดเคลื่อนสำหรับขนาดตัวอย่างที่กำหนดสำหรับช่วง $t$ แบบตัวอย่างเดียว [ทักษะ 3.D]

  • UNC-4.Q.1 ค่าวิกฤต $t^*$ ที่มี $n-1$ องศาอิสระสามารถหาได้จากตารางหรือผลลัพธ์ที่ผลิตโดยคอมพิวเตอร์
  • UNC-4.Q.2 ความคลาดเคลื่อนมาตรฐานสำหรับค่าเฉลี่ยตัวอย่างกำหนดโดย $SE = \dfrac{s}{\sqrt{n}}$ โดยที่ $s$ คือส่วนเบี่ยงเบนมาตรฐานของตัวอย่าง
  • UNC-4.Q.3 สำหรับช่วง $t$ แบบตัวอย่างเดียวสำหรับค่าเฉลี่ย ขอบเขตความคลาดเคลื่อนคือ ค่าวิกฤต ($t^*$) คูณด้วยความคลาดเคลื่อนมาตรฐาน ($SE$) ซึ่งเท่ากับ $t^*\left(\dfrac{s}{\sqrt{n}}\right)$

วัตถุประสงค์การเรียนรู้ UNC-4.R: คำนวณช่วงความเชื่อมั่นที่เหมาะสมสำหรับค่าเฉลี่ยประชากร รวมถึงผลต่างของค่าเฉลี่ยระหว่างคู่ข้อมูล whichmatch [ทักษะ 3.D]

  • UNC-4.R.1 จุดประมาณค่าสำหรับค่าเฉลี่ยประชากรคือค่าเฉลี่ยของตัวอย่าง $\overline{x}$
  • UNC-4.R.2 สำหรับค่าเฉลี่ยประชากรจากตัวอย่างเดียวที่มีความคลาดเคลื่อนมาตรฐานประชากรไม่ทราบ ช่วงความเชื่อมั่นคือ $\overline{x} \pm t^* \dfrac{s}{\sqrt{n}}$

คำอธิบายขอบเขต: สูตรสำหรับการประมาณช่วงไม่ได้ปรากฏอย่างชัดเจนในแผ่นสูตร AP Statistics ที่ให้มาพร้อมกับข้อสอบ AP Statistics อย่างไรก็ตาม สูตรเหล่านี้ไม่จำเป็นต้องจดจำ เพราะสามารถสร้างได้จากรูปค่าทดสอบทั่วไปและสูตรความคลาดเคลื่อนมาตรฐานที่เกี่ยวข้องซึ่งมีอยู่ในแผ่นสูตร

Source: College Board AP Course and Exam Description · ⁨แหล่งที่มา: คำอธิบายหลักสูตรและข้อสอบ College Board AP⁩

English
What a confidence interval means

A one-sample $t$ interval for $\mu$:

$$\bar{x}\pm t^{*}\frac{s}{\sqrt{n}}.$$
$t^{*}$ is the critical value with $df=n-1$. Conditions: random sample, Normal/Large Sample (population normal, or $n\ge 30$ by the CLT, or a roughly symmetric sample with no outliers), and the 10% condition. Interpret the interval and the confidence level in context.

Worked example. A random sample of $n=25$ has $\bar{x}=50$ and $s=8$. For a $95\%$ interval, $df=24$ gives $t^*=2.064$:

$$50\pm2.064\cdot\frac{8}{\sqrt{25}}=50\pm2.064(1.6)=50\pm3.3=(46.7,\ 53.3).$$

ไทย
ความหมายของช่วงความเชื่อมั่น

ช่วง $t$ ตัวอย่างเดียวสำหรับ $\mu$:

$$\bar{x}\pm t^{*}\frac{s}{\sqrt{n}}.$$
$t^{*}$ คือค่าวิกฤตที่มี $df=n-1$. เงื่อนไข: ตัวอย่าง สุ่ม, Normal/Large Sample (ประชากรเป็นปกติ, หรือ $n\ge 30$ ตาม CLT, หรือตัวอย่างที่มีรูปทรงสมมาตรโดยประมาณโดยไม่มีความผิดปกติ), และเงื่อนไข 10%. ตีความช่วงและความเชื่อมั่นในบริบท.

ตัวอย่างวิธีทำ. ตัวอย่างสุ่มขนาด $n=25$ มีค่าเฉลี่ย $\bar{x}=50$ และส่วนเบี่ยงเบนมาตรฐาน $s=8$. สำหรับช่วง $95\%$, $df=24$ ให้ผลลัพธ์ $t^*=2.064$:

$$50\pm2.064\cdot\frac{8}{\sqrt{25}}=50\pm2.064(1.6)=50\pm3.3=(46.7,\ 53.3).$$

การแจกแจง t มียอดต่ำกว่าและหางหนากว่าการแจกแจงปกติ
การแจกแจง t มียอดต่ำกว่าและมีหางหนากว่าการแจกแจงปกติ
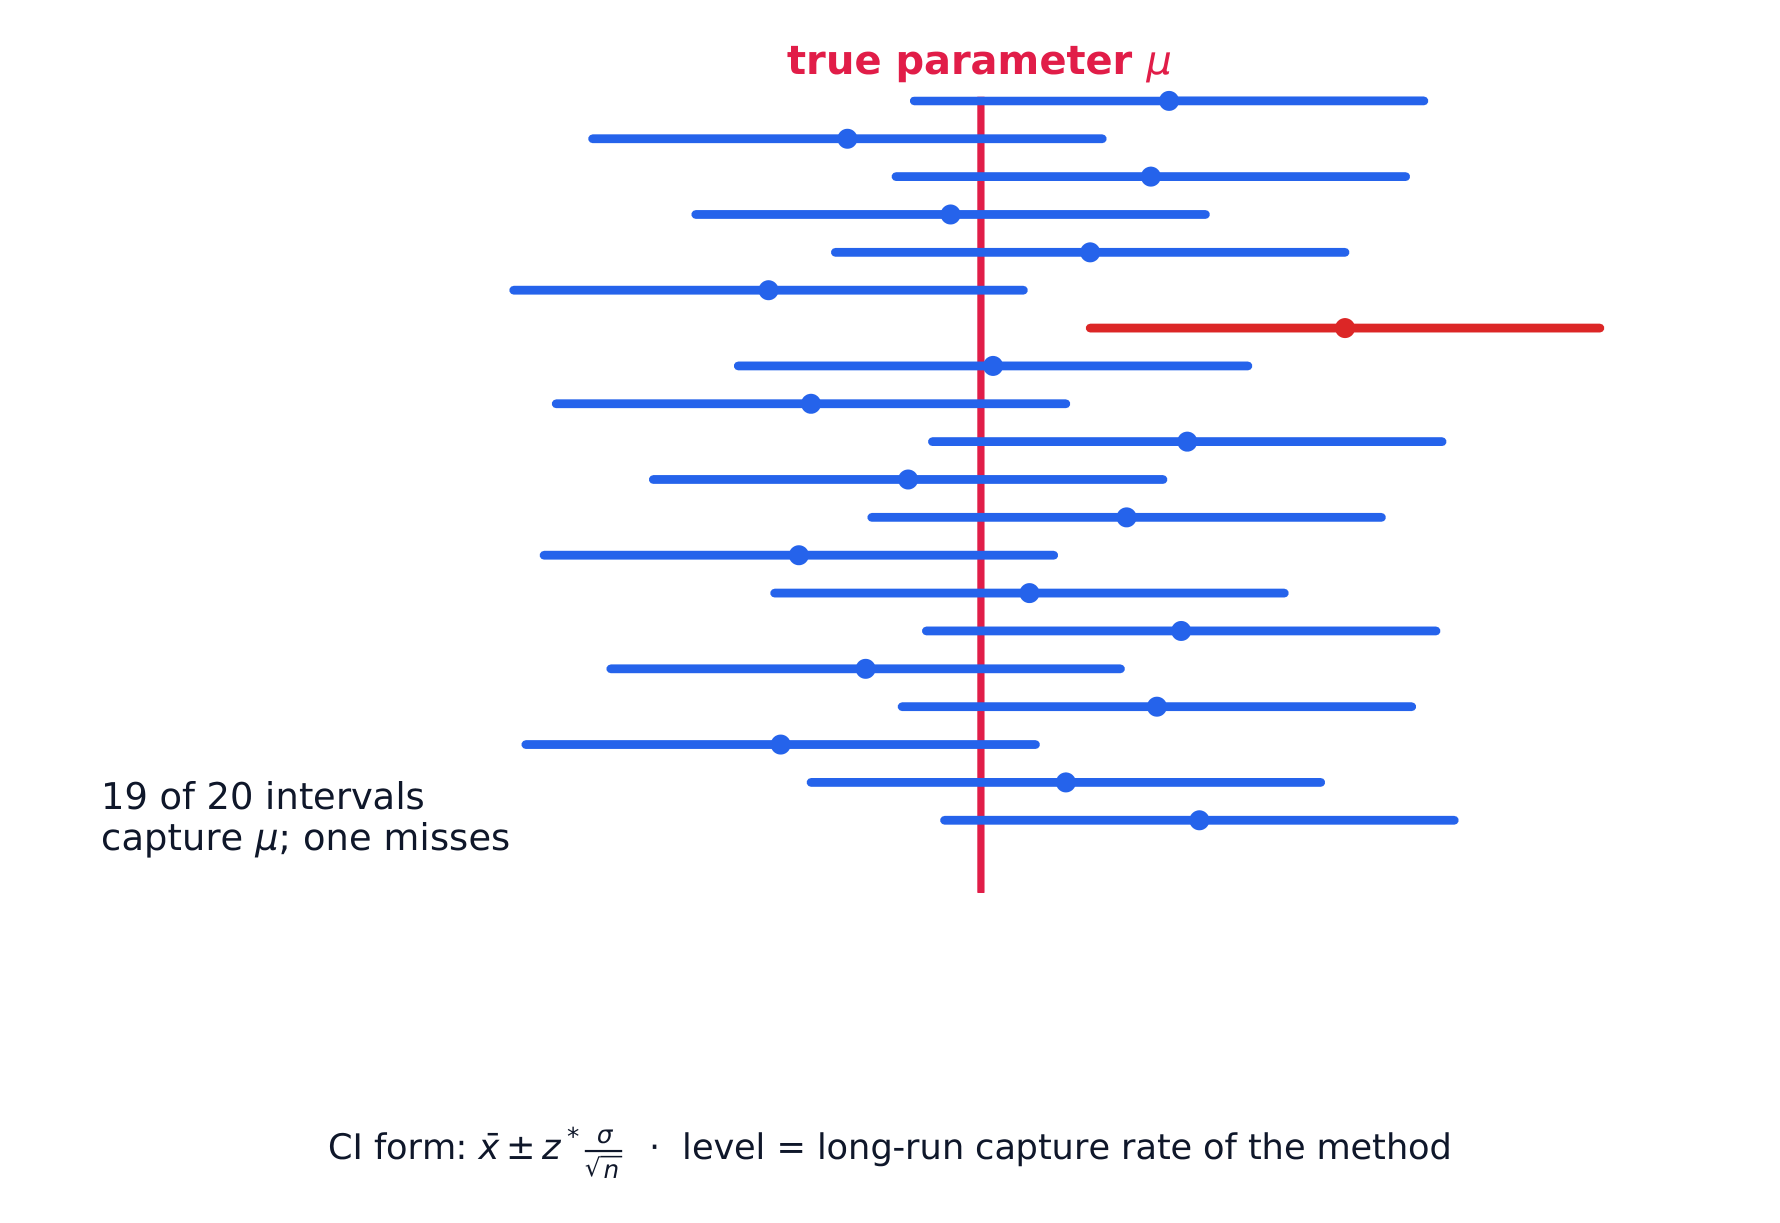
ช่วงความเชื่อมั่น 95% ซ้ำๆ: ประมาณ 95% จะครอบคลุมพารามิเตอร์ที่แท้จริง
"มั่นใจ 95%" อธิบายวิธีการ ไม่ใช่ช่วงใดช่วงหนึ่ง: ในหลายตัวอย่าง ประมาณ 95% ของช่วงจะcontains $\mu$ และประมาณ 5% จะmiss它.
Explore · ⁨สำรวจ⁩

Why a t interval is wider than a z interval · ⁨เหตุผลที่ช่วง t กว้างกว่าช่วง z⁩

A mean interval uses $t^*$, not $1.96$, because $\sigma$ is estimated by $s$. Drag df down and watch $t^*$ grow — at $df=10$ it is $2.228$, and the interval is wider for it. Drag df up and $t^*$ falls back toward $1.96$, which is why large samples may use $z$. · ⁨ช่วงเฉลี่ยใช้ $t^*$ ไม่ใช่ $1.96$ เพราะ $\sigma$ ถูกประมาณโดย $s$ ลาก df ลงไปและดู $t^*$ ที่เพิ่มขึ้น — ที่ $df=10$ มันมีค่า $2.228$ และช่วงจะกว้างขึ้นสำหรับค่านี้ ลาก df ขึ้นไปและ $t^*$ จะลดลงกลับเข้าใกล้ $1.96$ นี่คือเหตุผลว่าทำไมตัวอย่างขนาดใหญ่จึงอาจใช้ $z$⁩

7.3

Justifying a Claim About a Mean · ⁨การพิสูจน์ข้ออ้างเกี่ยวกับค่าเฉลี่ย⁩

Syllabus · ⁨หลักสูตร⁩
English

Enduring Understanding (UNC-4): An interval of values should be used to estimate parameters, in order to account for uncertainty.

Learning Objective UNC-4.S: Interpret a confidence interval for a population mean, including the mean difference between values in matched pairs. [Skill 4.B]

  • UNC-4.S.1 A confidence interval for a population mean either contains the population mean or it does not, because each interval is based on data from a random sample, which varies from sample to sample.
  • UNC-4.S.2 We are C% confident that the confidence interval for a population mean captures the population mean.
  • UNC-4.S.3 An interpretation of a confidence interval for a population mean includes a reference to the sample taken and details about the population it represents.
    • Illustrative examples for UNC-4.S.3: For interpreting a 96% confidence interval for mean foot length for all footprints found in a cave based on a particular randomly selected sample of footprints in the cave: "We are 96% confident that the mean foot length for all footprints found in the cave falls within the confidence interval" (based on 2000 FRQ 2).

Learning Objective UNC-4.T: Justify a claim based on a confidence interval for a population mean, including the mean difference between values in matched pairs. [Skill 4.D]

  • UNC-4.T.1 A confidence interval for a population mean provides an interval of values that may provide sufficient evidence to support a particular claim in context.

Learning Objective UNC-4.U: Identify the relationships between sample size, width of a confidence interval, confidence level, and margin of error for a population mean. [Skill 4.A]

  • UNC-4.U.1 When all other things remain the same, the width of a confidence interval for a population mean tends to decrease as the sample size increases.
  • UNC-4.U.2 For a single mean, the width of the interval is proportional to $\dfrac{1}{\sqrt{n}}$.
  • UNC-4.U.3 For a given sample, the width of the confidence interval for a population mean increases as the confidence level increases.
ไทย

ความเข้าใจที่ยั่งยืน (UNC-4): ควรใช้ช่วงของค่าเพื่อประมาณพารามิเตอร์ เพื่อคำนึงถึงความไม่แน่นอน

วัตถุประสงค์การเรียนรู้ UNC-4.S: ตีความช่วงความเชื่อมั่นสำหรับค่าเฉลี่ยประชากร รวมถึงผลต่างของค่าเฉลี่ยระหว่างคู่ข้อมูล whichmatch [ทักษะ 4.B]

  • UNC-4.S.1 ช่วงความเชื่อมั่นสำหรับค่าเฉลี่ยประชากรอาจมีค่าเฉลี่ยประชากรอยู่ภายในหรือไม่ก็ได้ เนื่องจากแต่ละช่วงนั้นสร้างจากข้อมูลจากตัวอย่างสุ่ม ซึ่งมีการเปลี่ยนแปลงจากตัวอย่างไปอีกตัวอย่าง
  • UNC-4.S.2 เรามีความมั่นใจ C% ว่าช่วงความเชื่อมั่นสำหรับค่าเฉลี่ยประชากรจะครอบคลุมค่าเฉลี่ยประชากร
  • UNC-4.S.3 การตีความช่วงความเชื่อมั่นสำหรับค่าเฉลี่ยประชากรควรรวมถึงการอ้างอิงถึงตัวอย่างที่ถูกเก็บรวบรวมและรายละเอียดเกี่ยวกับประชากรที่มันแทน
    • ตัวอย่างสำหรับ UNC-4.S.3: ในการตีความช่วงความเชื่อมั่น 96% สำหรับความยาวเท้าเฉลี่ยของรอยเท้าทั้งหมดในถ้ำ โดยอ้างอิงจากตัวอย่างรอยเท้าที่สุ่มมาแบบเฉพาะเจาะจงในถ้ำ: "เรามีความมั่นใจ 96% ว่าความยาวเท้าเฉลี่ยของรอยเท้าทั้งหมดในถ้ำจะอยู่ในช่วงความเชื่อมั่น" (อ้างอิงจาก FRQ 2000 2)

วัตถุประสงค์การเรียนรู้ UNC-4.T: ให้เหตุผลสนับสนุนข้ออ้างโดยอ้างอิงจากช่วงความเชื่อมั่นสำหรับค่าเฉลี่ยประชากร รวมถึงผลต่างของค่าเฉลี่ยระหว่างคู่ข้อมูล whichmatch [ทักษะ 4.D]

  • UNC-4.T.1 ช่วงความเชื่อมั่นสำหรับค่าเฉลี่ยประชากรให้ช่วงของค่าที่เป็นไปได้ที่จะให้หลักฐานเพียงพอเพื่อสนับสนุนข้ออ้างเฉพาะ在某context中

วัตถุประสงค์การเรียนรู้ UNC-4.U: ระบุความสัมพันธ์ระหว่างขนาดตัวอย่าง, ความกว้างของช่วงความเชื่อมั่น, ระดับความเชื่อมั่น และขอบเขตความคลาดเคลื่อนสำหรับค่าเฉลี่ยประชากร [ทักษะ 4.A]

  • UNC-4.U.1 เมื่อปัจจัยอื่นๆ คงที่ ความกว้างของช่วงความเชื่อมั่นสำหรับค่าเฉลี่ยประชากรมีแนวโน้มจะลดลงเมื่อขนาดตัวอย่างเพิ่มขึ้น
  • UNC-4.U.2 สำหรับค่าเฉลี่ยเดี่ยว ความกว้างของช่วงนั้นแปรผันตรงกับ $\dfrac{1}{\sqrt{n}}$
  • UNC-4.U.3 สำหรับตัวอย่างที่กำหนดไว้ ความกว้างของช่วงความเชื่อมั่นสำหรับค่าเฉลี่ยประชากรจะเพิ่มขึ้นเมื่อระดับความเชื่อมั่นสูงขึ้น

Source: College Board AP Course and Exam Description · ⁨แหล่งที่มา: คำอธิบายหลักสูตรและข้อสอบ College Board AP⁩

English

As with proportions: a claimed mean inside the interval is plausible; outside the interval, the data give evidence against it. Answer in context using the plausible range.

ไทย

เช่นเดียวกับสัดส่วน: ค่าเฉลี่ยที่ถูกอ้างถึง ภายใน ช่วงนั้นLogs plausible; ภายนอก ช่วงนั้น ข้อมูลให้หลักฐาน against它. ตอบในบริบทโดยใช้ช่วงLogs plausible.

7.4

Setting Up a Test for a Mean · ⁨การตั้งการทดสอบสำหรับค่าเฉลี่ย⁩

Syllabus · ⁨หลักสูตร⁩
English

Enduring Understanding (VAR-7): The $t$-distribution may be used to model variation.

Learning Objective VAR-7.B: Identify an appropriate testing method for a population mean with unknown $\sigma$, including the mean difference between values in matched pairs. [Skill 1.E]

  • VAR-7.B.1 The appropriate test for a population mean with unknown $\sigma$ is a one-sample $t$-test for a population mean.
  • VAR-7.B.2 Matched pairs can be thought of as one sample of pairs. Once differences between pairs of values are found, inference for significance testing proceeds as for a population mean.

Learning Objective VAR-7.C: Identify the null and alternative hypotheses for a population mean with unknown $\sigma$, including the mean difference between values in matched pairs. [Skill 1.F]

  • VAR-7.C.1 The null hypothesis for a one-sample $t$-test for a population mean is $H_0 : \mu = \mu_0$, where $\mu_0$ is the hypothesized value. Depending upon the situation, the alternative hypothesis is $H_a : \mu < \mu_0$, or $H_a : \mu > \mu_0$, or $H_a : \mu \neq \mu_0$.
  • VAR-7.C.2 When finding the mean difference, $\mu_d$, between values in a matched pair, it is important to define the order of subtraction.

Learning Objective VAR-7.D: Verify the conditions for the test for a population mean, including the mean difference between values in matched pairs. [Skill 4.C]

  • VAR-7.D.1 In order to make statistical inferences when testing a population mean, we must check for independence and that the sampling distribution is approximately normal:
    • a. To check for independence:
      • i. Data should be collected using a random sample or a randomized experiment.
      • ii. When sampling without replacement, check that $n \leq 10\%N$.
    • b. To check that the sampling distribution of $\overline{x}$ is approximately normal (shape):
      • i. If the observed distribution is skewed, $n$ should be greater than 30.
      • ii. If the sample size is less than 30, the distribution of the sample data should be free from strong skewness and outliers.
ไทย

ความเข้าใจที่ยั่งยืน (VAR-7): การแจกแจง $t$ สามารถUsed用来 model ความแปรปรวนได้

จุดประสงค์การเรียนรู้ VAR-7.B: ระบุวิธีการทดสอบที่เหมาะสมสำหรับค่าเฉลี่ยประชากรที่มี $\sigma$ ไม่ทราบ รวมถึงผลต่างเฉลี่ยระหว่างค่าในคู่จับคู่ [ทักษะ 1.E]

  • VAR-7.B.1 การทดสอบที่เหมาะสมสำหรับค่าเฉลี่ยประชากรที่มี $\sigma$ ไม่ทราบ คือการทดสอบ t แบบหนึ่งตัวอย่าง (one-sample $t$-test) สำหรับค่าเฉลี่ยประชากร
  • VAR-7.B.2 คู่จับคู่สามารถมองว่าเป็นตัวอย่างเดียวของคู่ค่า เมื่อหาผลต่างระหว่างคู่ค่าแล้ว การสรุปผลสำหรับการทดสอบนัยสำคัญจะเป็นไปเหมือนกับการทดสอบค่าเฉลี่ยประชากร

จุดประสงค์การเรียนรู้ VAR-7.C: ระบุสมมติฐานศูนย์และสมมติฐานทางเลือกสำหรับค่าเฉลี่ยประชากรที่มี $\sigma$ ไม่ทราบ รวมถึงผลต่างเฉลี่ยระหว่างค่าในคู่จับคู่ [ทักษะ 1.F]

  • VAR-7.C.1 สมมติฐานศูนย์สำหรับการทดสอบ t แบบหนึ่งตัวอย่าง (one-sample $t$-test) สำหรับค่าเฉลี่ยประชากรคือ $H_0 : \mu = \mu_0$ โดยที่ $\mu_0$ เป็นค่าที่สมมติขึ้น ขึ้นอยู่กับสถานการณ์ สมมติฐานทางเลือกอาจเป็น $H_a : \mu < \mu_0$, หรือ $H_a : \mu > \mu_0$, หรือ $H_a : \mu \neq \mu_0$
  • VAR-7.C.2 ในการหาผลต่างเฉลี่ย $\mu_d$ ระหว่างค่าในคู่จับคู่ สิ่งสำคัญคือการกำหนดลำดับการลบ

จุดประสงค์การเรียนรู้ VAR-7.D: ตรวจสอบเงื่อนไขสำหรับการทดสอบค่าเฉลี่ยประชากร รวมถึงผลต่างเฉลี่ยระหว่างค่าในคู่จับคู่ [ทักษะ 4.C]

  • VAR-7.D.1 เพื่อทำการสรุปผลทางสถิติในการทดสอบค่าเฉลี่ยประชากร เราต้องตรวจสอบความเป็นอิสระและการกระจายตัวของตัวอย่างมีความใกล้เคียงปกติ:
    • ก. ในการตรวจสอบความเป็นอิสระ:
      • i. ข้อมูลควรเก็บด้วยวิธีสุ่มตัวอย่างหรือการทดลองแบบสุ่ม
      • ii. เมื่อสุ่มโดยไม่มีการแทนที่ ตรวจสอบว่า $n \leq 10\%N$
    • ง. เพื่อตรวจสอบว่าการแจกแจงของตัวอย่างของ $\overline{x}$ เป็นแบบปกติโดยประมาณ (รูปร่าง):
      • i. หากการแจกแจงที่สังเกตเห็นมีความเบ้ $n$ ควรมากกว่า 30
      • ii. หากขนาดตัวอย่างน้อยกว่า 30 การแจกแจงของข้อมูลตัวอย่างควรปราศจากความเบ้อย่างรุนแรงและค่าผิดปกติ

Source: College Board AP Course and Exam Description · ⁨แหล่งที่มา: คำอธิบายหลักสูตรและข้อสอบ College Board AP⁩

English
What a p-value means

State hypotheses about $\mu$: $H_0:\mu=\mu_0$ versus $H_a:\mu\neq\mu_0$ (or $<,>$). Check the same conditions. The one-sample $t$ statistic:

$$t=\frac{\bar{x}-\mu_0}{s/\sqrt{n}},\qquad df=n-1.$$

Worked example. Test $H_0:\mu=45$ against $H_a:\mu\neq45$ for the sample above ($\bar{x}=50$, $s=8$, $n=25$):

$$t=\frac{50-45}{8/\sqrt{25}}=\frac{5}{1.6}=3.13,\qquad df=24.$$
This $t$ is far out in the tail (two-tailed $p<0.01$), so reject $H_0$ – strong evidence the mean is not $45$. Notice $45$ also falls outside the $95\%$ interval $(46.7,53.3)$, the same conclusion by two routes.

ไทย
ความหมายของ p-value

ระบุสมมติฐานเกี่ยวกับ $\mu$: $H_0:\mu=\mu_0$ เทียบกับ $H_a:\mu\neq\mu_0$ (หรือ $<,>$). ตรวจสอบเงื่อนไขเดียวกัน. สถิติone-sample $t$:

$$t=\frac{\bar{x}-\mu_0}{s/\sqrt{n}},\qquad df=n-1.$$

ตัวอย่างวิธีทำ. ทดสอบ $H_0:\mu=45$ เทียบกับ $H_a:\mu\neq45$ สำหรับตัวอย่างข้างต้น ($\bar{x}=50$, $s=8$, $n=25$):

$$t=\frac{50-45}{8/\sqrt{25}}=\frac{5}{1.6}=3.13,\qquad df=24.$$
ค่านี้ $t$ อยู่ลึกในหาง Distribution (สองด้าน $p<0.01$), ดังนั้น ปฏิเสธ $H_0$ – มีพยานแรงว่าค่าเฉลี่ยไม่เท่ากับ $45$ หมายเหตุว่า $45$ ก็อยู่นอกช่วง $95\%$ $(46.7,53.3)$ เช่นกัน ซึ่งให้ข้อสรุปเดียวกันด้วยวิธีการอื่น

Vocabulary · ⁨คำศัพท์⁩ Train · ⁨ฝึกฝน⁩
English ไทย
distribution/ˌdɪstrɪˈbjuːʃn/ การกระจาย
7.5

Carrying Out a Test for a Mean · ⁨การดำเนินการทดสอบสำหรับค่าเฉลี่ย⁩

Syllabus · ⁨หลักสูตร⁩
English

Enduring Understanding (VAR-7): The $t$-distribution may be used to model variation.

Learning Objective VAR-7.E: Calculate an appropriate test statistic for a population mean, including the mean difference between values in matched pairs. [Skill 3.E]

  • VAR-7.E.1 For a single quantitative variable when random sampling with replacement from a population that can be modeled with a normal distribution with mean $\mu$ and standard deviation $\sigma$, the sampling distribution of $t = \dfrac{\overline{x} - \mu}{\frac{s}{\sqrt{n}}}$ has a $t$-distribution with $n - 1$ degrees of freedom.

Boundary statement: The formulas for test statistics do not appear explicitly on the AP Statistics Formula Sheet provided with the AP Statistics Exam. However, these formulas do not need to be memorized, as they can be constructed based on the general test statistic formula and the relevant standard error formulas that are provided on the formula sheet.

Enduring Understanding (DAT-3): Significance testing allows us to make decisions about hypotheses within a particular context.

Learning Objective DAT-3.E: Interpret the $p$-value of a significance test for a population mean, including the mean difference between values in matched pairs. [Skill 4.B]

  • DAT-3.E.1 An interpretation of the $p$-value of a significance test for a population mean should recognize that the $p$-value is computed by assuming that the null hypothesis is true, i.e., by assuming that the true population mean is equal to the particular value stated in the null hypothesis.

Learning Objective DAT-3.F: Justify a claim about the population based on the results of a significance test for a population mean. [Skill 4.E]

  • DAT-3.F.1 A formal decision explicitly compares the $p$-value to the significance $\alpha$. If the $p$-value $\leq \alpha$, then reject the null hypothesis, $H_0 : \mu = \mu_0$. If the $p$-value $> \alpha$, then fail to reject the null hypothesis.
  • DAT-3.F.2 The results of a significance test for a population mean can serve as the statistical reasoning to support the answer to a research question about the population that was sampled.
ไทย

ความเข้าใจที่ยั่งยืน (VAR-7): การแจกแจง $t$ สามารถUsed用来 model ความแปรปรวนได้

จุดประสงค์การเรียนรู้ VAR-7.E: คำนวณค่าสถิติทดสอบที่เหมาะสมสำหรับค่าเฉลี่ยประชากร รวมถึงผลต่างเฉลี่ยระหว่างค่าในคู่จับคู่ [ทักษะ 3.E]

  • VAR-7.E.1 สำหรับตัวแปรเชิงปริมาณเดียวเมื่อสุ่มตัวอย่างแบบแทนที่จากประชากรที่จำลองด้วยการแจกแจงปกติที่มีค่าเฉลี่ย $\mu$ และส่วนเบี่ยงเบนมาตรฐาน $\sigma$, การแจกแจงของ $t = \dfrac{\overline{x} - \mu}{\frac{s}{\sqrt{n}}}$ จะมี $t$-การแจกแจงกับ $n - 1$ องศาอิสระ

ข้อความขอบเขต: สูตรสำหรับค่าสถิติทดสอบไม่ได้ปรากฏอย่างชัดเจนในตารางสูตร AP Statistics ที่ให้มาในการสอบ AP Statistics อย่างไรก็ตาม สูตรเหล่านี้ไม่จำเป็นต้องจดจำ เพราะสามารถสร้างได้โดยอิงจากสูตรค่าสถิติทดสอบทั่วไปและสูตรค่าความคลาดเคลื่อนมาตรฐานที่เกี่ยวข้องที่ปรากฏในตารางสูตร

ความเข้าใจที่ยั่งยืน (DAT-3): การทดสอบความสำคัญช่วยให้เราตัดสินใจเกี่ยวกับสมมติฐานภายในบริบทหนึ่งๆ ได้

วัตถุประสงค์การเรียนรู้ DAT-3.E: ตีความค่า $p$ ของการทดสอบนัยสำคัญสำหรับค่าเฉลี่ยประชากร รวมถึงผลต่างของค่าเฉลี่ยระหว่างคู่ข้อมูลจับคู่ [ทักษะ 4.B]

  • DAT-3.E.1 การตีความค่า $p$ ของการทดสอบนัยสำคัญสำหรับค่าเฉลี่ยประชากรควรตระหนักว่าค่า $p$ คำนวณโดยสมมติให้สมมติฐานศูนย์เป็นจริง นั่นคือสมมติว่าค่าเฉลี่ยประชากรจริงเท่ากับค่าเฉพาะที่ระบุในสมมติฐานศูนย์

จุดประสงค์การเรียนรู้ DAT-3.F: อธิบายเหตุผลสนับสนุนข้ออ้างเกี่ยวกับประชากรโดยอ้างอิงผลลัพธ์จากการทดสอบนัยสำคัญสำหรับค่าเฉลี่ยประชากร [ทักษะ 4.E]

  • DAT-3.F.1 การตัดสินใจอย่างเป็นทางการเปรียบเทียบค่า $p$ กับระดับนัยสำคัญ $\alpha$ ถ้าค่า $p$ $\leq \alpha$ แล้วปฏิเสธสมมติฐานศูนย์, $H_0 : \mu = \mu_0$. ถ้าค่า $p$ $> \alpha$ แล้วไม่ปฏิเสธสมมติฐานศูนย์
  • DAT-3.F.2 ผลลัพธ์จากการทดสอบนัยสำคัญสำหรับค่าเฉลี่ยประชากรสามารถใช้เป็นเหตุผลทางสถิติเพื่อรองรับคำตอบสำหรับคำถามวิจัยเกี่ยวกับประชากรที่ถูกสุ่มตัวอย่าง

Source: College Board AP Course and Exam Description · ⁨แหล่งที่มา: คำอธิบายหลักสูตรและข้อสอบ College Board AP⁩

English

Find the $p$-value from the $t$-distribution with $df=n-1$, compare to $\alpha$, and conclude in context – reject or fail to reject $H_0$, then state what that means for the claim. Show the test name, statistic, $df$, and $p$-value.

ไทย

หาค่า $p$ จาก distribution $t$ ด้วย $df=n-1$, เปรียบเทียบกับ $\alpha$, และสรุปผลในบริบท – ปฏิเสธหรือไม่ปฏิเสธ $H_0$, จากนั้นอธิบายความหมายต่อข้ออ้าง แสดงชื่อการทดสอบ สถิติ, $df$, และค่า $p$-value

Explore · ⁨สำรวจ⁩

Read a p-value off the t curve · ⁨อ่าน p-value จากกราฟ t⁩

The p-value is the shaded tail area beyond your $t$ statistic — both tails for a two-tailed $H_a$. The dashed normal curve behind $t$ shows what you would have got by wrongly using $z$: at small df the $t$ tail is visibly fatter, so the true p-value is larger than the normal would suggest. · ⁨p-value คือพื้นที่หางที่ถูกทาสีBeyond $t$ statistic ของคุณ — ทั้งสองหางสำหรับการ $H_a$ แบบสองหาง กราฟปกติประปรายอยู่หลัง $t$ แสดงสิ่งที่คุณจะได้หากใช้ $z$ ผิด: ที่ df เล็ก หาง $t$ หนาอย่างเห็นได้ชัด ดังนั้น p-value จริงจึง มากกว่า ที่กราฟปกติจะบ่งบอก⁩

7.6

Confidence Interval for a Difference of Two Means · ⁨ช่วงความเชื่อมั่นสำหรับผลต่างของค่าเฉลี่ยสองกลุ่ม⁩

Syllabus · ⁨หลักสูตร⁩
English

Enduring Understanding (UNC-4): An interval of values should be used to estimate parameters, in order to account for uncertainty.

Learning Objective UNC-4.V: Identify an appropriate confidence interval procedure for a difference of two population means. [Skill 1.D]

  • UNC-4.V.1 Consider a simple random sample from population 1 of size $n_1$, mean $\mu_1$, and standard deviation $\sigma_1$ and a second simple random sample from population 2 of size $n_2$, mean $\mu_2$, and standard deviation $\sigma_2$. If the distributions of populations 1 and 2 are normal or if both $n_1$ and $n_2$ are greater than 30, then the sampling distribution of the difference of means, $\overline{x}_1 - \overline{x}_2$ is also normal. The mean for the sampling distribution of $\overline{x}_1 - \overline{x}_2$ is $\mu_1 - \mu_2$. The standard deviation of $\overline{x}_1 - \overline{x}_2$ is $\sqrt{\dfrac{(\sigma_1)^2}{n_1} + \dfrac{(\sigma_2)^2}{n_2}}$.
  • UNC-4.V.2 The appropriate confidence interval procedure for one quantitative variable for two independent samples is a two-sample $t$-interval for a difference between population means.

Learning Objective UNC-4.W: Verify the conditions to calculate confidence intervals for the difference of two population means. [Skill 4.C]

  • UNC-4.W.1 In order to calculate confidence intervals to estimate a difference of population means, we must check for independence and that the sampling distribution is approximately normal:
    • a. To check for independence:
      • i. Data should be collected using two independent, random samples or a randomized experiment.
      • ii. When sampling without replacement, check that $n_1 \leq 10\%N_1$ and $n_2 \leq 10\%N_2$.
    • b. To check that the sampling distribution of $(\overline{x}_1 - \overline{x}_2)$ should be approximately normal (shape):
      • i. If the observed distributions are skewed, both $n_1$ and $n_2$ should be greater than 30.

Learning Objective UNC-4.X: Determine the margin of error for the difference of two population means. [Skill 3.D]

  • UNC-4.X.1 For the difference of two sample means, the margin of error is the critical value ($t^*$) times the standard error ($SE$) of the difference of two means.
  • UNC-4.X.2 The standard error for the difference in two sample means with sample standard deviations, $s_1$ and $s_2$, is $\sqrt{\dfrac{(s_1)^2}{n_1} + \dfrac{(s_2)^2}{n_2}}$.

Learning Objective UNC-4.Y: Calculate an appropriate confidence interval for a difference of two population means. [Skill 3.D]

  • UNC-4.Y.1 The point estimate for the difference of two population means is the difference in sample means, $\overline{x}_1 - \overline{x}_2$.
  • UNC-4.Y.2 For a difference of two population means where the population standard deviations are not known, the confidence interval is $(\overline{x}_1 - \overline{x}_2) \pm t^* \sqrt{\dfrac{s_1^2}{n_1} + \dfrac{s_2^2}{n_2}}$ where $\pm t^*$ are the critical values for the central C% of a $t$-distribution with appropriate degrees of freedom that can be found using technology.

Boundary statement: Formulas for interval estimates do not appear explicitly on the AP Statistics Formula Sheet provided with the AP Statistics Exam. However, these formulas do not need to be memorized, as they can be constructed based on the general test statistic formula and the relevant standard error formulas that are provided on the formula sheet.

ไทย

ความเข้าใจที่ยั่งยืน (UNC-4): ควรใช้ช่วงของค่าเพื่อประมาณพารามิเตอร์ เพื่อคำนึงถึงความไม่แน่นอน

จุดประสงค์การเรียนรู้ UNC-4.V: ระบุขั้นตอนการสร้างช่วงความเชื่อมั่นที่เหมาะสมสำหรับผลต่างของค่าเฉลี่ยประชากรสองกลุ่ม [ทักษะ 1.D]

  • UNC-4.V.1 พิจารณาตัวอย่างสุ่มง่ายจากประชากรที่ 1 ขนาด $n_1$, ค่าเฉลี่ย $\mu_1$, และส่วนเบี่ยงเบนมาตรฐาน $\sigma_1$ และตัวอย่างสุ่มง่ายที่สองจากประชากรที่ 2 ขนาด $n_2$, ค่าเฉลี่ย $\mu_2$, และส่วนเบี่ยงเบนมาตรฐาน $\sigma_2$ หากการกระจายตัวของประชากรที่ 1 และ 2 เป็นปกติหรือหากทั้ง $n_1$ และ $n_2$ มีค่ามากกว่า 30, การกระจายตัวของผลต่างของค่าเฉลี่ย, $\overline{x}_1 - \overline{x}_2$ ก็จะเป็นปกติเช่นกัน ค่าเฉลี่ยของการกระจายตัวของ $\overline{x}_1 - \overline{x}_2$ คือ $\mu_1 - \mu_2$ ส่วนเบี่ยงเบนมาตรฐานของ $\overline{x}_1 - \overline{x}_2$ คือ $\sqrt{\dfrac{(\sigma_1)^2}{n_1} + \dfrac{(\sigma_2)^2}{n_2}}$
  • UNC-4.V.2 ขั้นตอนการสร้างช่วงความเชื่อมั่นที่เหมาะสมสำหรับตัวแปรเชิงปริมาณเดียวสำหรับตัวอย่างอิสระสองกลุ่ม คือช่วง t แบบสองตัวอย่าง (two-sample $t$-interval) สำหรับผลต่างของค่าเฉลี่ยประชากร

จุดประสงค์การเรียนรู้ UNC-4.W: ตรวจสอบเงื่อนไขในการคำนวณช่วงความเชื่อมั่นสำหรับผลต่างของค่าเฉลี่ยประชากรสองกลุ่ม [ทักษะ 4.C]

  • UNC-4.W.1 เพื่อคำนวณช่วงความเชื่อมั่นเพื่อประมาณผลต่างของค่าเฉลี่ยประชากร เราต้องตรวจสอบความเป็นอิสระและการกระจายตัวของตัวอย่างมีความใกล้เคียงปกติ:
    • ก. ในการตรวจสอบความเป็นอิสระ:
      • ข. ควรเก็บข้อมูลโดยใช้ตัวอย่างสุ่มอิสระสองกลุ่มหรือการทดลองแบบสุ่ม
      • ค. เมื่อสุ่มโดยไม่ใส่กลับ ให้ตรวจสอบว่า $n_1 \leq 10\%N_1$ และ $n_2 \leq 10\%N_2$
    • b. เพื่อตรวจสอบว่าการกระจายตัวของ $(\overline{x}_1 - \overline{x}_2)$ ควรจะมีความใกล้เคียงปกติ (รูปร่าง):
      • i. หากการแจกแจงที่สังเกตเห็นมีความเบ้ ทั้ง $n_1$ และ $n_2$ ควรมีค่ามากกว่า 30

จุดประสงค์การเรียนรู้ UNC-4.X: กำหนดค่าความคลาดเคลื่อนของผลต่างของค่าเฉลี่ยประชากรสองกลุ่ม [ทักษะ 3.D]

  • UNC-4.X.1 สำหรับผลต่างของค่าเฉลี่ยตัวอย่างสองกลุ่ม ค่าความคลาดเคลื่อนคือค่าวิกฤต ($t^*$) คูณกับค่าความคลาดเคลื่อนมาตรฐาน ($SE$) ของผลต่างของค่าเฉลี่ยสองกลุ่ม
  • UNC-4.X.2 ค่าความผิดพลาดมาตรฐานของการต่างของค่าเฉลี่ยจากตัวอย่างสองกลุ่มด้วยส่วนเบี่ยงเบนมาตรฐานของตัวอย่าง $s_1$ และ $s_2$ คือ $\sqrt{\dfrac{(s_1)^2}{n_1} + \dfrac{(s_2)^2}{n_2}}$

จุดประสงค์การเรียนรู้ UNC-4.Y: คำนวณช่วงความเชื่อมั่นที่เหมาะสมสำหรับการต่างของค่าเฉลี่ยประชากรสองกลุ่ม [ทักษะ 3.D]

  • UNC-4.Y.1 จุดประมาณการสำหรับการต่างของค่าเฉลี่ยประชากรสองกลุ่มคือการต่างของค่าเฉลี่ยจากตัวอย่าง $\overline{x}_1 - \overline{x}_2$
  • UNC-4.Y.2 สำหรับการต่างของค่าเฉลี่ยประชากรสองกลุ่มที่ส่วนเบี่ยงเบนมาตรฐานของประชากรไม่ทราบ ช่วงความเชื่อมั่นคือ $(\overline{x}_1 - \overline{x}_2) \pm t^* \sqrt{\dfrac{s_1^2}{n_1} + \dfrac{s_2^2}{n_2}}$ โดยที่ $\pm t^*$ เป็นค่าวิกฤตสำหรับ C% ตรงกลางของการแจกแจง $t$ ที่มีดีกรีอิสระที่เหมาะสมซึ่งสามารถหาได้โดยใช้เทคโนโลยี

คำอธิบายขอบเขต: สูตรสำหรับการประมาณช่วงไม่ได้ปรากฏอย่างชัดเจนในแผ่นสูตร AP Statistics ที่ให้มาพร้อมกับข้อสอบ AP Statistics อย่างไรก็ตาม สูตรเหล่านี้ไม่จำเป็นต้องจดจำ เพราะสามารถสร้างได้จากรูปค่าทดสอบทั่วไปและสูตรความคลาดเคลื่อนมาตรฐานที่เกี่ยวข้องซึ่งมีอยู่ในแผ่นสูตร
Source: College Board AP Course and Exam Description · ⁨แหล่งที่มา: คำอธิบายหลักสูตรและข้อสอบ College Board AP⁩

English

For independent samples, estimate $\mu_1-\mu_2$:

$$(\bar{x}_1-\bar{x}_2)\pm t^{*}\sqrt{\frac{s_1^2}{n_1}+\frac{s_2^2}{n_2}}.$$
Conditions must hold in both samples. (Use technology for the $df$; do not pool the variances on the AP exam.)

ไทย

สำหรับตัวอย่างที่เป็น อิสระต่อกัน, ประมาณค่า $\mu_1-\mu_2$:

$$(\bar{x}_1-\bar{x}_2)\pm t^{*}\sqrt{\frac{s_1^2}{n_1}+\frac{s_2^2}{n_2}}.$$
เงื่อนไขต้องเป็นจริงในทั้งสองตัวอย่าง. (ใช้เทคโนโลยีในการคำนวณ $df$; อย่า pool variances ในการสอบ AP.)

การสุ่มเป็นพื้นฐานของการเปรียบเทียบอย่างยุติธรรมระหว่างสองกลุ่มในการทดสอบความแตกต่างของค่าเฉลี่ย
7.7

Justifying a Claim About Two Means · ⁨การให้เหตุผลกับข้ออ้างเกี่ยวกับค่าเฉลี่ยสองค่า⁩

Syllabus · ⁨หลักสูตร⁩
English

Enduring Understanding (UNC-4): An interval of values should be used to estimate parameters, in order to account for uncertainty.

Learning Objective UNC-4.Z: Interpret a confidence interval for a difference of population means. [Skill 4.B]

  • UNC-4.Z.1 In repeated random sampling with the same sample size, approximately C% of confidence intervals created will capture the difference of population means.
  • UNC-4.Z.2 An interpretation for a confidence interval for the difference of two population means should include a reference to the samples taken and details about the populations they represent.
    • Illustrative examples for UNC-4.Z.2: For interpreting a confidence interval for a difference between mean response times for two fire stations (northern - southern): "Based on these samples, one can be 95 percent confident that the difference in the population mean response times (northern - southern) is between -2.37 minutes and 0.37 minutes" (2009 FRQ 4).

Learning Objective UNC-4.AA: Justify a claim based on a confidence interval for a difference of population means. [Skill 4.D]

  • UNC-4.AA.1 A confidence interval for a difference of population means provides an interval of values that may provide sufficient evidence to support a particular claim in context.

Learning Objective UNC-4.AB: Identify the effects of sample size on the width of a confidence interval for the difference of two means. [Skill 4.A]

  • UNC-4.AB.1 When all other things remain the same, the width of the confidence interval for the difference of two means tends to decrease as the sample sizes increase.
ไทย

ความเข้าใจที่ยั่งยืน (UNC-4): ควรใช้ช่วงของค่าเพื่อประมาณพารามิเตอร์ เพื่อคำนึงถึงความไม่แน่นอน

จุดประสงค์การเรียนรู้ UNC-4.Z: ตีความช่วงความเชื่อมั่นสำหรับการต่างของค่าเฉลี่ยประชากร [ทักษะ 4.B]

  • UNC-4.Z.1 ในการสุ่มตัวอย่างแบบสุ่มซ้ำด้วยขนาดตัวอย่างเท่าเดิม ช่วงความเชื่อมั่นประมาณ C% ที่สร้างขึ้นจะครอบคลุมค่าการต่างของค่าเฉลี่ยประชากร
  • UNC-4.Z.2 การตีความช่วงความเชื่อมั่นสำหรับการต่างของค่าเฉลี่ยประชากรสองกลุ่มควรกล่าวถึงตัวอย่างที่ถูกนำมาจากและรายละเอียดเกี่ยวกับประชากรที่ตัวอย่างเหล่านั้นเป็นตัวแทน
    • ตัวอย่างประกอบสำหรับ UNC-4.Z.2: สำหรับคำตีความช่วงความเชื่อมั่นสำหรับการต่างระหว่างเวลาตอบสนองเฉลี่ยของสถานีดับเพลิงสองแห่ง (เหนือ - เหนือ): "จากตัวอย่างเหล่านี้ เราสามารถมั่นใจได้ 95 เปอร์เซ็นต์ว่าการต่างของค่าเฉลี่ยเวลาตอบสนองของประชากร (เหนือ - เหนือ) อยู่ระหว่าง -2.37 นาที ถึง 0.37 นาที" (2009 FRQ 4)

**จุดประสงค์การเรียนรู้ UNC-4.AA:**证实 claims โดยอ้างอิงจากช่วงความเชื่อมั่นสำหรับการต่างของค่าเฉลี่ยประชากร [ทักษะ 4.D]

  • UNC-4.AA.1 ช่วงความเชื่อมั่นสำหรับการต่างของค่าเฉลี่ยประชากรให้ช่วงของค่าที่อาจมีหลักฐานเพียงพอเพื่อสนับสนุนclaims tertentuในบริบทนั้น

จุดประสงค์การเรียนรู้ UNC-4.AB: ระบุผลกระทบของขนาดตัวอย่างต่อความกว้างของช่วงความเชื่อมั่นสำหรับการต่างของค่าเฉลี่ยสองกลุ่ม [ทักษะ 4.A]

  • UNC-4.AB.1 เมื่อปัจจัยอื่นๆ คงที่ ความกว้างของช่วงความเชื่อมั่นสำหรับการต่างของค่าเฉลี่ยสองกลุ่มมีแนวโน้มลดลงเมื่อขนาดตัวอย่างเพิ่มขึ้น

Source: College Board AP Course and Exam Description · ⁨แหล่งที่มา: คำอธิบายหลักสูตรและข้อสอบ College Board AP⁩

English

If the interval for $\mu_1-\mu_2$ contains $0$, the data are consistent with equal means; if it excludes $0$, there is evidence of a difference in that direction. Interpret in context.

ไทย

หากช่วงความเชื่อมั่นสำหรับ $\mu_1-\mu_2$ มี $0$ อยู่ภายใน ข้อมูลสอดคล้องกับค่าเฉลี่ยที่เท่ากัน; หากช่วงนั้นไม่รวม $0$ จะมีหลักฐานว่ามีความแตกต่างในทิศทางนั้น ให้ตีความผลในบริบทของปัญหา

7.8

Setting Up a Test for a Difference of Means · ⁨การตั้งค่าทดสอบความแตกต่างของค่าเฉลี่ย⁩

Syllabus · ⁨หลักสูตร⁩
English

Enduring Understanding (VAR-7): The $t$-distribution may be used to model variation.

Learning Objective VAR-7.F: Identify an appropriate selection of a testing method for a difference of two population means. [Skill 1.E]

  • VAR-7.F.1 For a quantitative variable, the appropriate test for a difference of two population means is a two-sample $t$-test for a difference of two population means.

Learning Objective VAR-7.G: Identify the null and alternative hypotheses for a difference of two population means. [Skill 1.F]

  • VAR-7.G.1 The null hypothesis for a two-sample $t$-test for a difference of two population means, $\mu_1$ and $\mu_2$, is: $H_0 : \mu_1 - \mu_2 = 0$, or $H_0 : \mu_1 = \mu_2$. The alternative hypothesis is $H_a : \mu_1 - \mu_2 < 0$, or $H_a : \mu_1 - \mu_2 > 0$, or $H_a : \mu_1 - \mu_2 \neq 0$, or $H_a : \mu_1 > \mu_2$, or $H_a : \mu_1 < \mu_2$, or $H_a : \mu_1 \neq \mu_2$.

Learning Objective VAR-7.H: Verify the conditions for the significance test for the difference of two population means. [Skill 4.C]

  • VAR-7.H.1 In order to make statistical inferences when testing a difference between population means, we must check for independence and that the sampling distribution is approximately normal:
    • a. Individual observations should be independent:
      • i. Data should be collected using simple random samples or a randomized experiment.
      • ii. When sampling without replacement, check that $n_1 \leq 10\%N_1$ and $n_2 \leq 10\%N_2$.
    • b. The sampling distribution of $\overline{x}_1 - \overline{x}_2$ should be approximately normal (shape).
      • i. If the observed distribution is skewed, both $n_1$ and $n_2$ should be greater than 30.
      • ii. If the sample size is less than 30, the distribution of the sample data should be free from strong skewness and outliers. This should be checked for BOTH samples.
ไทย

ความเข้าใจที่ยั่งยืน (VAR-7): การแจกแจง $t$ สามารถUsed用来 model ความแปรปรวนได้

จุดประสงค์การเรียนรู้ VAR-7.F: ระบุวิธีการเลือกทดสอบที่เหมาะสมสำหรับการต่างของค่าเฉลี่ยประชากรสองกลุ่ม [ทักษะ 1.E]

  • VAR-7.F.1 สำหรับตัวแปรเชิงปริมาณ ทดสอบที่เหมาะสมสำหรับการต่างของค่าเฉลี่ยประชากรสองกลุ่มคือ two-sample $t$-test สำหรับค่าการต่างของค่าเฉลี่ยประชากรสองกลุ่ม

จุดประสงค์การเรียนรู้ VAR-7.G: ระบุสมมติฐานศูนย์และสมมติฐานทางเลือกสำหรับการต่างของค่าเฉลี่ยประชากรสองกลุ่ม [ทักษะ 1.F]

  • VAR-7.G.1 สมมติฐานศูนย์สำหรับ two-sample $t$-test สำหรับการต่างของค่าเฉลี่ยประชากรสองกลุ่ม $\mu_1$ และ $\mu_2$ คือ: $H_0 : \mu_1 - \mu_2 = 0$, หรือ $H_0 : \mu_1 = \mu_2$ สมมติฐานทางเลือกคือ $H_a : \mu_1 - \mu_2 < 0$, หรือ $H_a : \mu_1 - \mu_2 > 0$, หรือ $H_a : \mu_1 - \mu_2 \neq 0$, หรือ $H_a : \mu_1 > \mu_2$, หรือ $H_a : \mu_1 < \mu_2$, หรือ $H_a : \mu_1 \neq \mu_2$

จุดประสงค์การเรียนรู้ VAR-7.H: ตรวจสอบเงื่อนไขสำหรับการทดสอบนัยสำคัญสำหรับการต่างของค่าเฉลี่ยประชากรสองกลุ่ม [ทักษะ 4.C]

  • VAR-7.H.1 เพื่อทำการอนุมานทางสถิติในการทดสอบการต่างระหว่างค่าเฉลี่ยประชากร เราต้องตรวจสอบความเป็นอิสระและการแจกแจงตัวอย่างมีความใกล้เคียงปกติ:
    • a. ข้อมูลแต่ละจุดควรเป็นอิสระต่อกัน:
      • i. ข้อมูลควรเก็บรวบรวมโดยใช้ตัวอย่างสุ่มอย่างง่ายหรือการทดลองแบบสุ่ม
      • ค. เมื่อสุ่มโดยไม่ใส่กลับ ให้ตรวจสอบว่า $n_1 \leq 10\%N_1$ และ $n_2 \leq 10\%N_2$
    • b. การแจกแจงตัวอย่างของ $\overline{x}_1 - \overline{x}_2$ ควรมีความใกล้เคียงปกติ (รูปร่าง)
      • i. หากการแจกแจงที่สังเกตเห็นมีความเบ้ ทั้ง $n_1$ และ $n_2$ ควรมีค่ามากกว่า 30
      • ii. หากขนาดตัวอย่างน้อยกว่า 30 การแจกแจงข้อมูลตัวอย่างควรปราศจากความเบ้รุนแรงและค่าผิดปกติ ควรตรวจสอบสำหรับทั้งสองตัวอย่าง

Source: College Board AP Course and Exam Description · ⁨แหล่งที่มา: คำอธิบายหลักสูตรและข้อสอบ College Board AP⁩

English

Hypotheses: $H_0:\mu_1=\mu_2$ versus $H_a:\mu_1\neq\mu_2$ (or $<,>$). Distinguish two independent samples from paired data 配对数据 – for paired data (before/after, matched subjects), first take the differences and run a one-sample $t$ procedure on them.

ไทย

สมมติฐาน: $H_0:\mu_1=\mu_2$ เทียบกับ $H_a:\mu_1\neq\mu_2$ (หรือ $<,>$). แยกแยะ ตัวอย่างอิสระสองกลุ่ม จาก ข้อมูลคู่จับคู่ – สำหรับข้อมูลคู่จับคู่ (ก่อน/หลัง, กลุ่มตัวอย่างที่จับคู่กัน) ให้คำนวณ ผลต่าง ก่อน แล้วทำกระบวนการ one-sample $t$ กับผลต่างเหล่านั้น

7.9

Carrying Out a Test for a Difference of Means · ⁨การดำเนินการทดสอบความแตกต่างของค่าเฉลี่ย⁩

Syllabus · ⁨หลักสูตร⁩
English

Enduring Understanding (VAR-7): The $t$-distribution may be used to model variation.

Learning Objective VAR-7.I: Calculate an appropriate test statistic for a difference of two means. [Skill 3.E]

  • VAR-7.I.1 For a single quantitative variable, data collected using independent random samples or a randomized experiment from two populations, each of which can be modeled with a normal distribution, the sampling distribution of $t = \dfrac{(\overline{x}_1 - \overline{x}_2) - (\mu_1 - \mu_2)}{\sqrt{\dfrac{s_1^2}{n_1} + \dfrac{s_2^2}{n_2}}}$ is an approximate $t$-distribution with degrees of freedom that can be found using technology. The degrees of freedom fall between the smaller of $n_1 - 1$ and $n_2 - 1$ and $n_1 + n_2 - 2$.
    • Illustrative examples for VAR-7.I.1: In a study comparing mean recovery times for two surgical procedures to repair a torn anterior cruciate ligament (ACL), the group receiving one procedure had a sample size of 110, while the group receiving the other procedure had a sample size of 100. The degrees of freedom fall between 100 (the smaller of 110 and 100) and 208 (110 + 100 - 2). The degrees of freedom may be determined using technology. If the test statistic for this study is $t \approx 7.13$, then the $p$-value is the area greater than 7.13 for a $t$-distribution with $df = 207.18$ (2018 FRQ 4).

Boundary statement: The formulas for test statistics do not appear explicitly on the AP Statistics Formula Sheet provided with the AP Statistics Exam. However, these formulas do not need to be memorized, as they can be constructed based on the general test statistic formula and the standard error formulas for each of the relevant test statistics that are provided on the formula sheet.

Enduring Understanding (DAT-3): Significance testing allows us to make decisions about hypotheses within a particular context.

Learning Objective DAT-3.G: Interpret the $p$-value of a significance test for a difference of population means. [Skill 4.B]

  • DAT-3.G.1 An interpretation of the $p$-value of a significance test for a two-sample difference of population means should recognize that the $p$-value is computed by assuming that the null hypothesis is true, i.e., by assuming that the true population means are equal to each other.

Learning Objective DAT-3.H: Justify a claim about the population based on the results of a significance test for a difference of two population means in context. [Skill 4.E]

  • DAT-3.H.1 A formal decision explicitly compares the $p$-value to the significance $\alpha$. If the $p$-value $\leq \alpha$, then reject the null hypothesis, $H_0 : \mu_1 - \mu_2 = 0$, or $H_0 : \mu_1 = \mu_2$. If the $p$-value $> \alpha$, then fail to reject the null hypothesis.
  • DAT-3.H.2 The results of a significance test for a two-sample test for a difference between two population means can serve as the statistical reasoning to support the answer to a research question about the populations that were sampled.
ไทย

ความเข้าใจที่ยั่งยืน (VAR-7): การแจกแจง $t$ สามารถUsed用来 model ความแปรปรวนได้

จุดประสงค์การเรียนรู้ VAR-7.I: คำนวณค่าสถิติทดสอบที่เหมาะสมสำหรับการต่างของค่าเฉลี่ยสองกลุ่ม [ทักษะ 3.E]

  • VAR-7.I.1 สำหรับตัวแปรเชิงปริมาณหนึ่ง ตัว数据存储ที่เก็บรวบรวมโดยใช้ตัวอย่างสุ่มอย่างอิสระหรือการทดลองแบบสุ่มจากสองประชากรซึ่งแต่ละกลุ่มสามารถจำลองด้วยการแจกแจงปกติ การแจกแจงตัวอย่างของ $t = \dfrac{(\overline{x}_1 - \overline{x}_2) - (\mu_1 - \mu_2)}{\sqrt{\dfrac{s_1^2}{n_1} + \dfrac{s_2^2}{n_2}}}$ เป็นการแจกแจง $t$ ประมาณที่มีดีกรีอิสระซึ่งสามารถหาได้โดยใช้เทคโนโลยี ดีกรีอิสระจะอยู่ระหว่างค่าที่น้อยที่สุดของ $n_1 - 1$ และ $n_2 - 1$ กับ $n_1 + n_2 - 2$
    • ตัวอย่างประกอบสำหรับ VAR-7.I.1: ในการศึกษาเปรียบเทียบเวลาพักฟื้นเฉลี่ยสำหรับกระบวนการผ่าตัดสองชนิดเพื่อซ่อมไขสันหลังส่วนหน้าฉีกขาด (ACL) กลุ่มที่ได้รับการผ่าตัดชนิดหนึ่งมีขนาดตัวอย่าง 110 คน ในขณะที่กลุ่มที่ได้รับการผ่าตัดอีกชนิดหนึ่งมีขนาดตัวอย่าง 100 คน ดีกรีอิสระจะอยู่ระหว่าง 100 (ค่าน้อยกว่าของ 110 และ 100) และ 208 (110 + 100 - 2) ดีกรีอิสระสามารถกำหนดได้โดยใช้เทคโนโลยี หากค่าสถิติทดสอบสำหรับการศึกษานี้คือ $t \approx 7.13$ แล้วค่า $p$-value คือพื้นที่มากกว่า 7.13 สำหรับการแจกแจง $t$ กับ $df = 207.18$ (2018 FRQ 4)

คำชี้ขอบเขต: สูตรสำหรับค่าสถิติทดสอบไม่ได้ปรากฏอย่างชัดเจนในแผ่นสูตร AP Statistics Formula Sheet ที่ให้มาในการสอบ AP Statistics อย่างไรก็ตาม สูตรเหล่านี้ไม่จำเป็นต้องจดจำ เนื่องจากสามารถสร้างขึ้นได้จากสูตรทั่วไปของค่าสถิติทดสอบและสูตรค่าความผิดพลาดมาตรฐานของแต่ละค่าสถิติทดสอบที่เกี่ยวข้องที่ระบุไว้ในแผ่นสูตร

ความเข้าใจที่ยั่งยืน (DAT-3): การทดสอบความสำคัญช่วยให้เราตัดสินใจเกี่ยวกับสมมติฐานภายในบริบทหนึ่งๆ ได้

จุดประสงค์การเรียนรู้ DAT-3.G: ตีความค่า $p$-value ของการทดสอบนัยสำคัญสำหรับการต่างของค่าเฉลี่ยประชากร [ทักษะ 4.B]

  • DAT-3.G.1 การตีความค่า $p$ ของการทดสอบนัยสำคัญสำหรับการแตกต่างของค่าเฉลี่ยประชากรสองกลุ่ม ควรตระหนักว่า ค่า $p$ ถูกคำนวณโดยสมมติว่าสมมติฐานศูนย์เป็นจริง นั่นคือ โดยสมมติว่าค่าเฉลี่ยประชากรที่แท้จริงเท่ากัน

วัตถุประสงค์การเรียนรู้ DAT-3.H: อธิบายเหตุผลสนับสนุนข้ออ้างเกี่ยวกับประชากรจากผลการทดสอบนัยสำคัญสำหรับการแตกต่างของค่าเฉลี่ยประชากรสองกลุ่มในบริบทที่เกี่ยวข้อง [ทักษะ 4.E]

  • DAT-3.H.1 การตัดสินใจอย่างเป็นทางการเปรียบเทียบค่า $p$ กับระดับนัยสำคัญ $\alpha$ ถ้าค่า $p$ $\leq \alpha$ แล้วปฏิเสธสมมติฐานศูนย์, $H_0 : \mu_1 - \mu_2 = 0$, หรือ $H_0 : \mu_1 = \mu_2$. ถ้าค่า $p$ $> \alpha$ แล้วไม่ปฏิเสธสมมติฐานศูนย์
  • DAT-3.H.2 ผลลัพธ์ของการทดสอบนัยสำคัญสำหรับการแตกต่างของค่าเฉลี่ยประชากรสองกลุ่ม สามารถใช้เป็นเหตุผลทางสถิติเพื่อสนับสนุนคำตอบสำหรับคำถามการวิจัยเกี่ยวกับประชากรที่ถูกสุ่มตัวอย่าง

Source: College Board AP Course and Exam Description · ⁨แหล่งที่มา: คำอธิบายหลักสูตรและข้อสอบ College Board AP⁩

English

The two-sample $t$ statistic:

$$t=\frac{(\bar{x}_1-\bar{x}_2)-0}{\sqrt{\frac{s_1^2}{n_1}+\frac{s_2^2}{n_2}}}.$$
Get the $p$-value (technology for $df$), compare to $\alpha$, conclude in context.

ไทย

สถิติสองตัวอย่าง $t$:

$$t=\frac{(\bar{x}_1-\bar{x}_2)-0}{\sqrt{\frac{s_1^2}{n_1}+\frac{s_2^2}{n_2}}}.$$
หาค่า p-value ของ $p$ (ใช้เทคโนโลยีสำหรับ $df$), เปรียบเทียบกับ $\alpha$, และสรุปผลในบริบทของปัญหา

7.10

Selecting and Communicating a Procedure · ⁨การเลือกและสื่อสารวิธีการ⁩

Syllabus · ⁨หลักสูตร⁩
English

This topic is intended to focus on the skill of selecting an appropriate inference procedure, now that students have a range of options. Students should be given opportunities to practice when and how to apply all learning objectives relating to inference involving proportions or means.

ไทย

หัวข้อนี้มุ่งเน้นการพัฒนาทักษะในการเลือกขั้นตอนการสรุปผลที่เหมาะสม โดยที่นักเรียนมีทางเลือกให้พิจารณาแล้ว นักเรียนควรได้รับโอกาสฝึกปฏิบัติเวลาและวิธีการใช้วัตถุประสงค์การเรียนรู้ทั้งหมดที่เกี่ยวข้องกับการสรุปผลที่มีส่วนประกอบเป็นสัดส่วนหรือค่าเฉลี่ย

Source: College Board AP Course and Exam Description · ⁨แหล่งที่มา: คำอธิบายหลักสูตรและข้อสอบ College Board AP⁩

English

The hardest exam skill is choosing the right procedure: one or two samples? proportion or mean? paired or independent? confidence interval or test? Read the question for what is being estimated or claimed, then name the procedure, check its conditions, carry it out, and communicate the conclusion clearly with numbers and context.

ไทย

ทักษะการสอบที่ยากที่สุดคือ การเลือก วิธีการที่ถูกต้อง: หนึ่งหรือสองตัวอย่าง? ส่วนแบ่งหรือค่าเฉลี่ย? คู่จับคู่หรืออิสระ? ช่วงความเชื่อมั่นหรือการทดสอบ? อ่านโจทย์เพื่อหาสิ่งที่ถูกประมาณหรืออ้างถึง จากนั้นระบุชื่อวิธี, ตรวจสอบเงื่อนไข, ดำเนินการ, และสื่อสารสรุปผลอย่างชัดเจนพร้อมตัวเลขและบริบท

7.10

Exam tips · ⁨ข้อแนะนำสำหรับการสอบ⁩

English
  • Use t-procedures for means (population $\sigma$ unknown) — the t-distribution has heavier tails than normal.
  • Check conditions: random, independent, and roughly normal (or large $n$).
  • Interpret an interval and a test in context, always tied to the parameter (the true mean).
  • Match the right procedure: one-sample, two-sample, or paired (look for a natural pairing).
  • State the degrees of freedom; for a two-sample $t$-test use technology's value (or, by hand, the conservative smaller $n-1$).
ไทย
  • ใช้ t-procedures สำหรับค่าเฉลี่ย (เมื่อ population $\sigma$ ไม่ทราบ) – การแจกแจง t มีหางหนากว่าการแจกแจงปกติ
  • ตรวจสอบเงื่อนไข: สุ่ม, อิสระ, และประมาณปกติ (หรือมี $n$ ขนาดใหญ่)
  • ตีความช่วงความเชื่อมั่นและการทดสอบในบริบทของปัญหา โดยเชื่อมโยงกับพารามิเตอร์เสมอ (ค่าเฉลี่ยจริง)
  • จับคู่วิธีให้เหมาะสม: one-sample, two-sample หรือคู่จับคู่ (มองหาการจับคู่ตามธรรมชาติ)
  • ระบุองศาอิสระ; สำหรับการทดสอบ $t$ แบบสองกลุ่ม ใช้ค่าจากโปรแกรมคอมพิวเตอร์ (หรือโดยมือ ใช้ค่าที่ระมัดระวัง更小 $n-1$)

Interactive lessons on this topic · ⁨บทเรียนเชิงโต้ตอบสำหรับหัวข้อนี้⁩

Work through it step by step, with instant-check exercises. · ⁨ทำทีละขั้นตอน พร้อมแบบฝึกหัดตรวจสอบผลทันที⁩

Past Papers · ⁨ข้อสอบย้อนหลัง⁩

More topics in AP Statistics · ⁨หัวข้อเพิ่มเติมใน AP Statistics⁩

Log in or create account · ⁨เข้าสู่ระบบหรือสร้างบัญชี⁩

IGCSE, A-Level & AP