Skip to content · ⁨ข้ามไปยังเนื้อหา⁩

Basic Economic Concepts · ⁨แนวคิดพื้นฐานทางเศรษฐศาสตร์⁩

AP Macroeconomics · ⁨AP เศรษฐศาสตร์มหภาค⁩ · Topic 1 · ⁨หัวข้อ 1⁩

Video lesson for this topic · ⁨บทเรียนวิดีโอสำหรับหัวข้อนี้⁩ Open the video page · ⁨เปิดหน้าวิดีโอ⁩
7:30

แนวคิดพื้นฐานทางเศรษฐศาสตร์

นี่คือผลลัพธ์ที่รู้สึกผิดทันทีที่คุณเจอครั้งแรก สมมติว่าคุณเขียนโค้ดเร็วกว่าเพื่อน และเขียนเอกสาร也快 You...

English narration · English + 中文 subtitles burned in · ⁨การบรรยายภาษาอังกฤษ · คำบรรยายภาษาอังกฤษ + 中文 ลอยตัวบนภาพ⁩

1.1

Scarcity · ⁨ความขาดแคลน⁩

Syllabus · ⁨หลักสูตร⁩
English

Enduring Understanding (MOD-1): The production possibilities curve (PPC) model is used to demonstrate the full employment level of output and to illustrate changes in full employment.

Learning Objective MOD-1.A: Define scarcity and economic resources.

  • MOD-1.A.1 Individuals and societies are forced to make choices because most resources are scarce.
ไทย

ความเข้าใจที่ยั่งยืน (MOD-1): โมเดลเส้น生产能力 (PPC) ใช้เพื่อแสดงระดับการผลิตที่การจ้างงานเต็มรูปแบบ และเพื่ออธิบายการเปลี่ยนแปลงของการจ้างงานเต็มรูปแบบ

วัตถุประสงค์การเรียนรู้ MOD-1.A: นิยามความขาดแคลนและทรัพยากรทางเศรษฐกิจ

  • MOD-1.A.1 บุคคลและสังคมถูกบังคับให้ต้องเลือกทำสิ่งต่างๆ เนื่องจากทรัพยากรส่วนใหญ่มีความขาดแคลน
Source: College Board AP Course and Exam Description · ⁨แหล่งที่มา: คำอธิบายหลักสูตรและข้อสอบ College Board AP⁩

English

Economics 经济学 begins with scarcity 稀缺性: people's wants are unlimited, but the resources 资源 to satisfy them are limited. The resources – the factors of production 生产要素 – are land, labor 劳动, capital 资本, and entrepreneurship 企业家才能. Scarcity forces every society to choose what, how, and for whom to produce, and it makes trade-offs 权衡 unavoidable.

ไทย
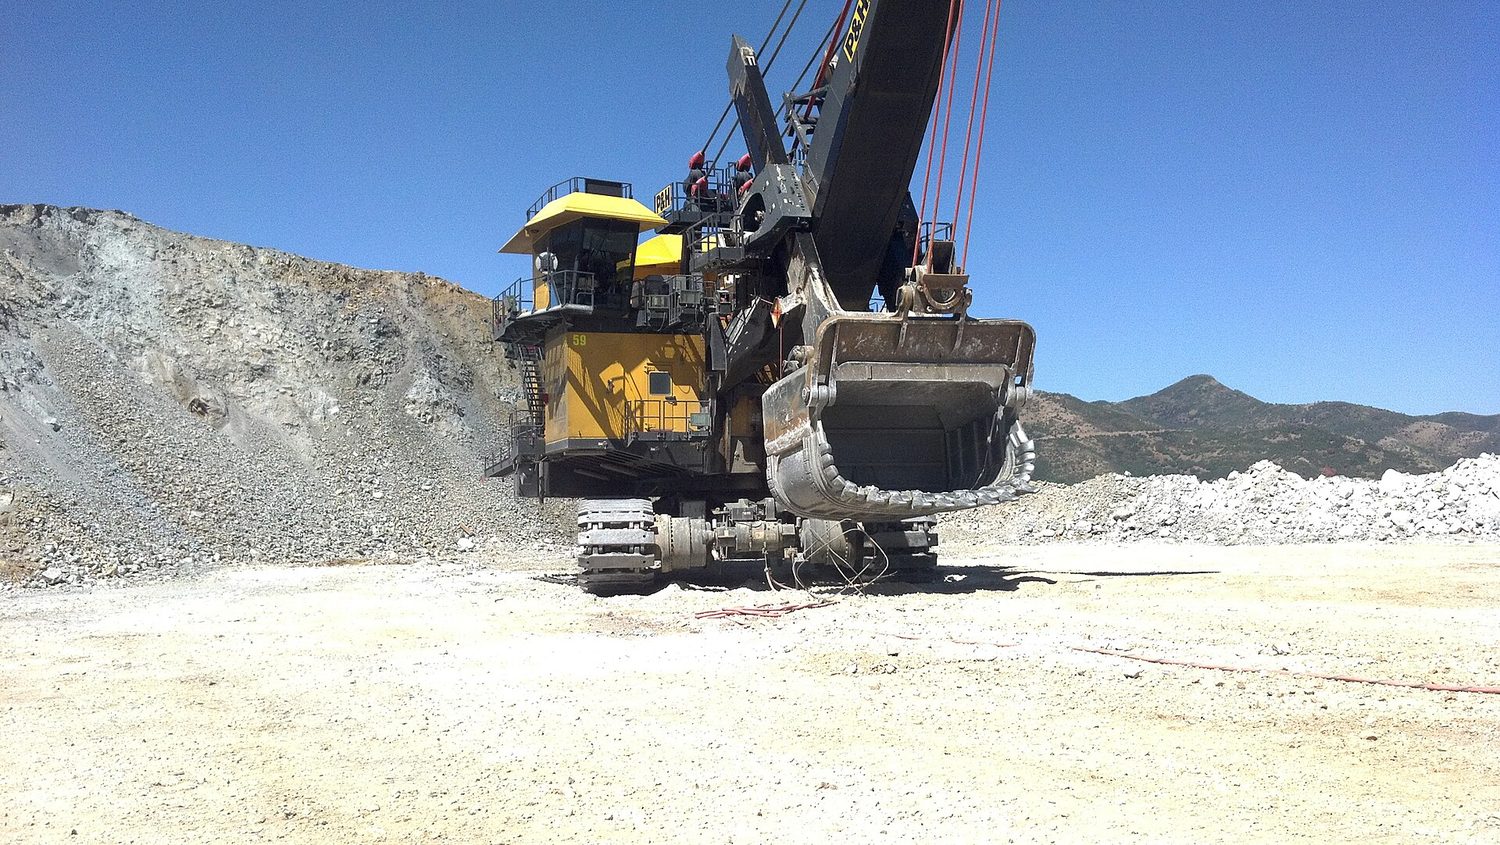
เหมืองเปิด: ที่ดินและแร่ธาตุเป็นทรัพยากรที่มีจำกัดและมี opportunity cost
เหมืองเปิด: ที่ดินและแร่ธาตุเป็นทรัพยากรที่ขาดแคลนและมีต้นทุนทางเลือก

เศรษฐศาสตร์ เริ่มต้นด้วย ความขาดแคลน: ความต้องการของมนุษย์ไม่มีที่สิ้นสุด แต่ ทรัพยากร ที่จะตอบสนองความต้องการนั้นมีจำกัด ทรัพยากร – หรือ ปัจจัยการผลิต – ได้แก่ ที่ดิน, แรงงาน, ทุน และ ** предприิกรรม** ความขาดแคลนบังคับให้ทุกสังคมต้องเลือก อะไร, อย่างไร และ สำหรับใคร ในการผลิต และทำให้การ แลกเปลี่ยนทางเลือก เป็นเรื่องหลีกเลี่ยงไม่ได้

Vocabulary · ⁨คำศัพท์⁩ Train · ⁨ฝึกฝน⁩
English ไทย
Economics/ˌiːkəˈnɒmɪks/ เศรษฐศาสตร์
scarcity/ˈskeəsɪti/ ความขาดแคลน
resources/rɪˈzɔːsɪz/ ทรัพยากร
factors of production/ˈfæktəz ɒv prəˈdʌkʃn/ ปัจจัยการผลิต
labor/ˈleɪbə/ แรงงาน
capital/ˈkæpɪtl/ ทุน (capital)
entrepreneurship/ˌɒntrɪprəˈnjʊəʃɪp/ entrepreneurship
trade-offs/treɪd ɒfs/ การแลกเปลี่ยนข้อดี-ข้อเสีย
opportunity cost/ɒpəˈtjuːnɪti kɒst/ ต้นทุนโอกาส
production possibilities curve (PPC)/prəˈdʌkʃn ˌpɒsəˈbɪlɪtiz kɜːv/ เส้นโค้งความเป็นไปได้ในการผลิต (PPC)
economic growth/ˌiːkəˈnɒmɪk ɡrəʊθ/ การเติบโตทางเศรษฐกิจ
absolute advantage/ˈæbsəluːt ədˈvæntɪdʒ/ ข้อได้เปรียบสัมบูรณ์
1.2

Opportunity Cost and the Production Possibilities Curve (PPC) · ⁨ต้นทุนทางเลือกและเส้นโค้งความสามารถในการผลิต (PPC)⁩

Syllabus · ⁨หลักสูตร⁩
English

Enduring Understanding (MOD-1): The production possibilities curve (PPC) model is used to demonstrate the full employment level of output and to illustrate changes in full employment.

Learning Objective MOD-1.B: a. Define (using graphs as appropriate) the PPC and related terms. b. Explain (using graphs as appropriate) how the PPC illustrates opportunity costs, tradeoffs, inefficiency, efficiency, and economic growth or contraction under various conditions. c. Calculate (using data from PPCs or tables as appropriate) opportunity cost.

  • MOD-1.B.1 The PPC is a model used to show the tradeoffs associated with allocating resources.
  • MOD-1.B.2 The PPC can be used to illustrate the concepts of scarcity, opportunity cost, efficiency, underutilized resources, and economic growth or contraction.
  • MOD-1.B.3 The shape of the PPC depends on whether opportunity costs are constant, increasing, or decreasing.
  • MOD-1.B.4 The PPC can shift because of changes in factors of production as well as changes in productivity/technology.
  • MOD-1.B.5 Economic growth results in an outward shift of the PPC.
ไทย

ความเข้าใจที่ยั่งยืน (MOD-1): โมเดลเส้น生产能力 (PPC) ใช้เพื่อแสดงระดับการผลิตที่การจ้างงานเต็มรูปแบบ และเพื่ออธิบายการเปลี่ยนแปลงของการจ้างงานเต็มรูปแบบ

วัตถุประสงค์การเรียนรู้ MOD-1.B: ก. นิยาม (โดยใช้กราฟเมื่อเหมาะสม) เส้น生产能力 (PPC) และคำศัพท์ที่เกี่ยวข้อง ข. อธิบาย (โดยใช้กราฟเมื่อเหมาะสม) ว่า PPC แสดงถึงค่าโอกาสเสีย การแลกเปลี่ยนผลดี ความไม่ประสิทธิภาพ ประสิทธิภาพ และการเติบโตหรือหดตัวของเศรษฐกิจภายใต้สภาวะต่างๆ ได้อย่างไร ค. คำนวณ (โดยใช้ข้อมูลจาก PPC หรือตารางเมื่อเหมาะสม) ค่าโอกาสเสีย

  • MOD-1.B.1 PPC เป็นโมเดลที่ใช้แสดงความแลกเปลี่ยนผลดีที่เกี่ยวข้องกับการจัดสรรทรัพยากร
  • MOD-1.B.2 PPC สามารถใช้เพื่ออธิบายแนวคิดเรื่องความขาดแคลน ค่าโอกาสเสีย ประสิทธิภาพ การใช้ประโยชน์ทรัพยากรไม่เต็มที่ และการเติบโตหรือหดตัวของเศรษฐกิจ
  • MOD-1.B.3 รูปร่างของ PPC ขึ้นอยู่กับว่าค่าโอกาสเสียนั้นคงที่ เพิ่มขึ้น หรือลดลง
  • MOD-1.B.4 PPC สามารถเคลื่อนที่ได้เนื่องจากปัจจัยการผลิตเปลี่ยนแปลง性以及ประสิทธิภาพ/เทคโนโลยีเปลี่ยนไป
  • MOD-1.B.5 การเติบโตทางเศรษฐกิจส่งผลให้ PPC เคลื่อนที่ออกไปด้านนอก

Source: College Board AP Course and Exam Description · ⁨แหล่งที่มา: คำอธิบายหลักสูตรและข้อสอบ College Board AP⁩

English
The production possibility frontier

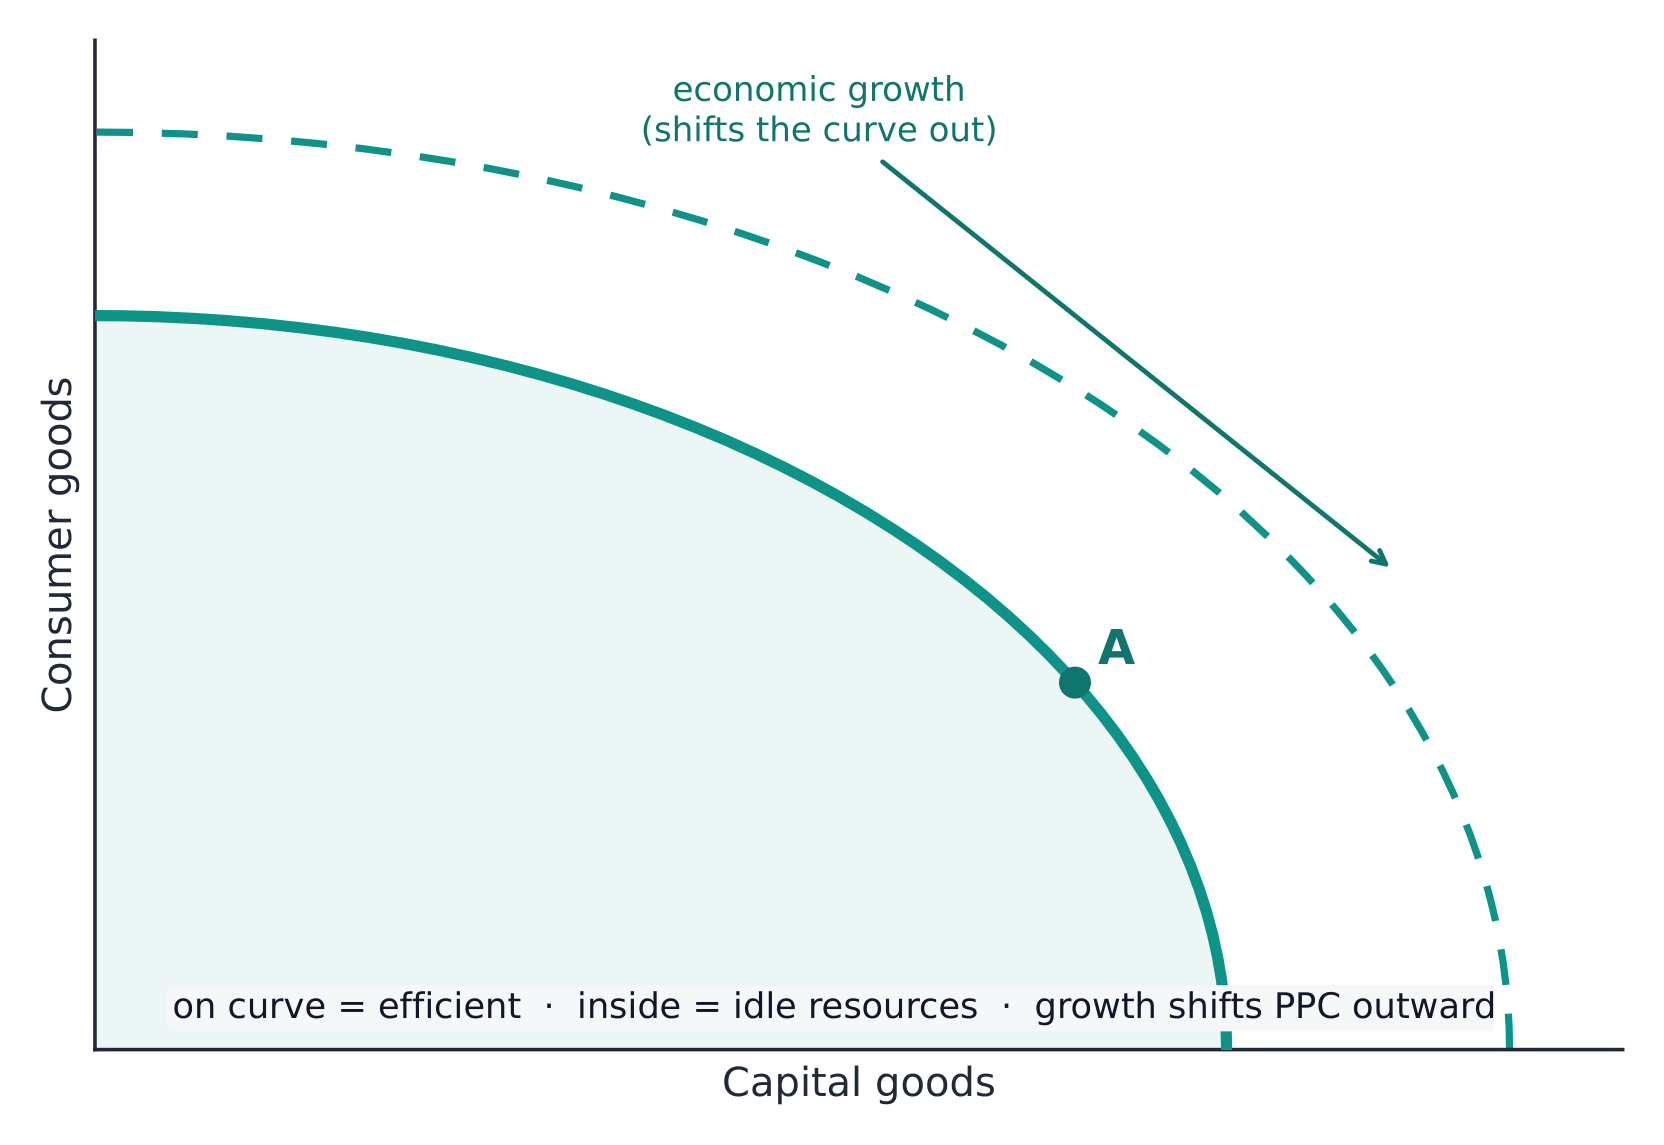
Every choice has an opportunity cost 机会成本 – the value of the next-best alternative given up. The production possibilities curve (PPC) 生产可能性曲线 shows the maximum combinations of two goods an economy can make when resources are fully and efficiently used.

  • Points on the curve are efficient; inside, inefficient (unemployed resources); outside, unattainable.
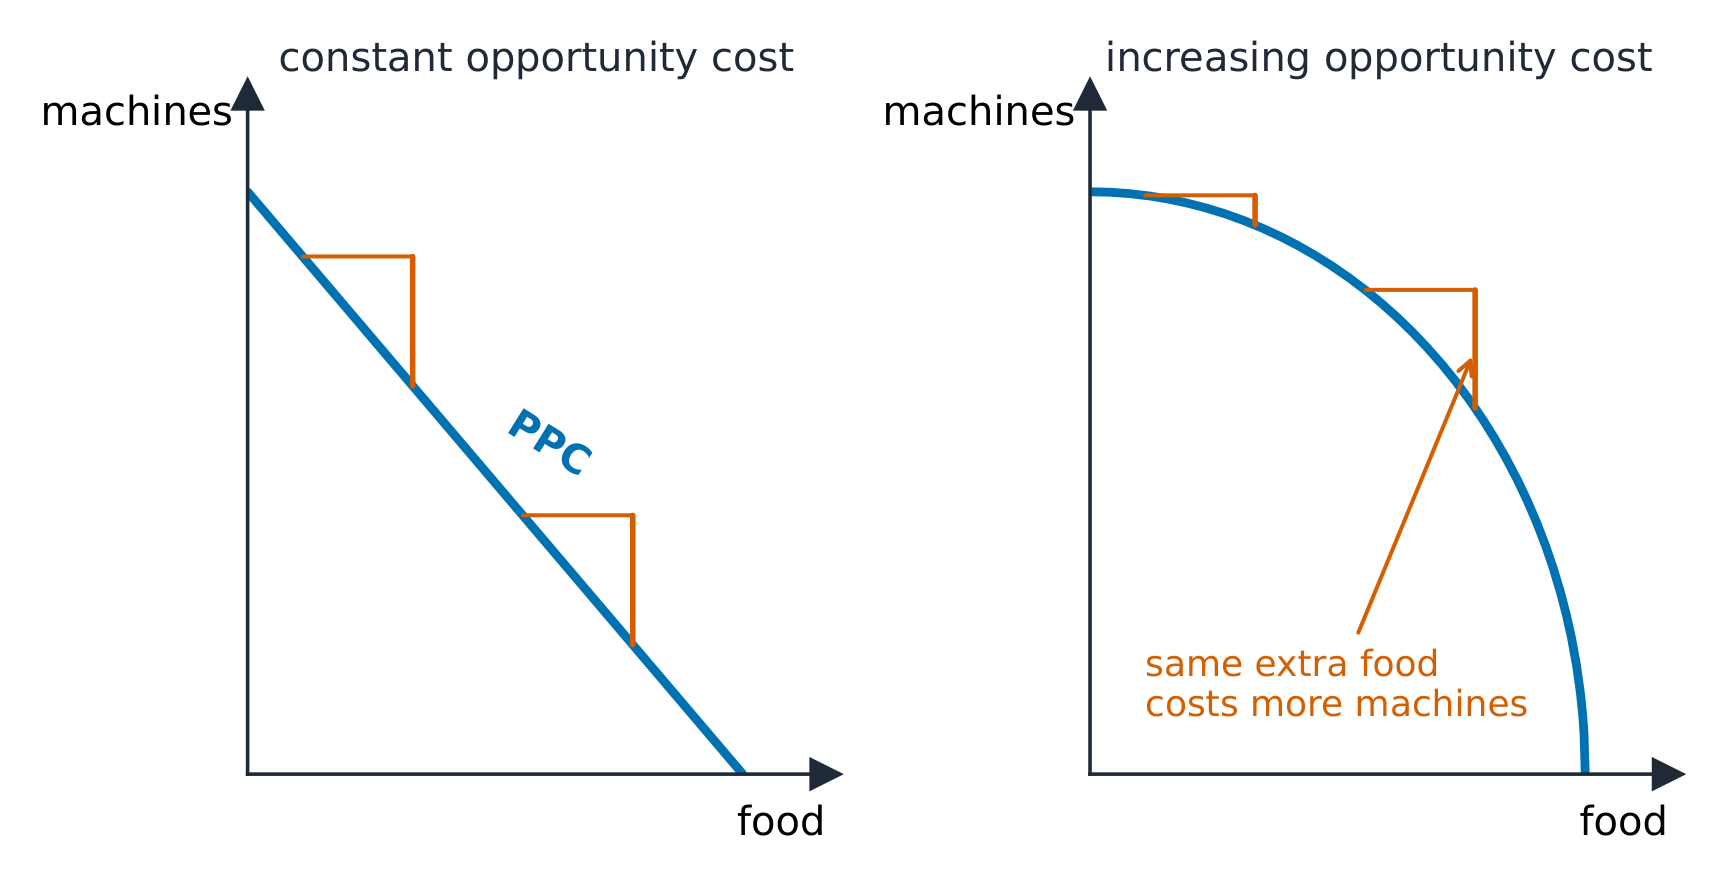
  • The downward slope shows opportunity cost; a bowed-out curve shows increasing opportunity cost.
  • More resources or better technology cause economic growth 经济增长, shifting the PPC outward.
ไทย

*เส้นขอบเขตความสามารถในการผลิต

ทุกการตัดสินใจมี ต้นทุนทางเลือก — ซึ่งคือคุณค่าของทางเลือกที่ดีที่สุดถัดมาที่ถูกทิ้งไว้ เส้นโค้งความสามารถในการผลิต (PPC) แสดงชุดผสมผสานสูงสุดของสินค้าสองชนิดที่เศรษฐกิจสามารถผลิตได้เมื่อทรัพยากรถูกใช้งานอย่างเต็มที่และมีประสิทธิภาพ

PPC แบบเส้นตรงหมายถึง opportunity cost คงที่; แบบโค้งเข้าหาจุดกำเนิดหมายถึงต้นทุนเพิ่มขึ้น *PPC แบบตรงแสดงต้นทุนทางเลือกคงที่; PPC แบบโค้งงอแสดงต้นทุนทางเลือกเพิ่มขึ้น

  • จุด บน เส้นโค้งหมายถึงประสิทธิภาพ; ภายใน ไม่มีประสิทธิภาพ (ทรัพยากรตกงาน); ภายนอก เป็นสิ่งที่ไม่สามารถบรรลุได้
  • ความชันลงแสดงต้นทุนทางเลือก; เส้นโค้งที่โค้งออก แสดงถึง ต้นทุนทางเลือกที่เพิ่มขึ้น
  • ทรัพยากรมากขึ้นหรือเทคโนโลยีที่ดีขึ้นทำให้เกิด การเติบโตทางเศรษฐกิจ ซึ่งเลื่อนเส้น PPC ไป ด้านนอก
เส้นความเป็นไปได้ในการผลิต; การลงทุนในสินค้าทุนจะเลื่อนเส้นออกไปด้านนอก
เส้น frontier ของการผลิต; การลงทุนในสินค้าทุนจะเลื่อนเส้นนี้ออกไปข้างนอก
Explore · ⁨สำรวจ⁩

Explore the production possibilities curve

Move along the curve — making more capital goods means giving up consumer goods. That lost output is the opportunity cost, and the bowed shape shows it rising with each extra unit. · ⁨เคลื่อนที่ไปตามเส้นโค้ง — การผลิต สินค้าทุน ที่มากขึ้นหมายถึงการสละ สินค้าอุปโภคบริโภค ผลผลิตรวมที่สูญเสียไป คือ โอกาสต้นทุน และรูปร่างโค้งที่นูนขึ้นแสดงว่าสิ่งนี้ เพิ่มขึ้น เมื่อเพิ่มหน่วยการผลิตหนึ่งหน่วย⁩

1.3

Comparative Advantage and Gains from Trade · ⁨ความได้เปรียบสัมพัทธ์และประโยชน์จากการค้า⁩

Syllabus · ⁨หลักสูตร⁩
English

Enduring Understanding (MKT-1): Production and consumption increase by engaging in trade.

Learning Objective MKT-1.A: a. Define absolute advantage and comparative advantage. b. Determine (using data from PPCs or tables as appropriate) absolute and comparative advantage.

  • MKT-1.A.1 Absolute advantage describes a situation in which an individual, business, or country can produce more of a good or service than any other producer with the same quantity of resources.
  • MKT-1.A.2 Comparative advantage describes a situation in which an individual, business, or country can produce a good or service at a lower opportunity cost than another producer.

Learning Objective MKT-1.B: a. Explain (using data from PPCs or tables as appropriate) how specialization according to comparative advantage with appropriate terms of trade can lead to gains from trade. b. Calculate (using data from PPCs or tables as appropriate) mutually beneficial terms of trade.

  • MKT-1.B.1 Production specialization according to comparative advantage results in exchange opportunities that lead to consumption opportunities beyond the PPC.
  • MKT-1.B.2 Comparative advantage and opportunity costs determine the terms of trade for exchange under which mutually beneficial trade can occur.
ไทย

ความเข้าใจที่ยั่งยืน (MKT-1): การผลิตและการบริโภคเพิ่มขึ้นโดยการทำธุรกรรมการค้า

วัตถุประสงค์การเรียนรู้ MKT-1.A: ก. นิยามข้อได้เปรียบสัมบูรณ์และข้อได้เปรียบเปรียบเทียบ ข. ตระหนัก (โดยใช้ข้อมูลจาก PPC หรือตารางเมื่อเหมาะสม) ข้อได้เปรียบสัมบูรณ์และข้อได้เปรียบเปรียบเทียบ

  • MKT-1.A.1 ข้อได้เปรียบสัมบูรณ์อธิบายสถานการณ์ที่บุคคล ธุรกิจ หรือประเทศสามารถผลิตสินค้าหรือบริการได้มากกว่าผู้ผลิตรายอื่นด้วยปริมาณทรัพยากรเท่ากัน
  • MKT-1.A.2 ข้อได้เปรียบเปรียบเทียบอธิบายสถานการณ์ที่บุคคล ธุรกิจ หรือประเทศสามารถผลิตสินค้าหรือบริการได้ด้วยค่าโอกาสเสียต่ำกว่าผู้ผลิตรายอื่น

วัตถุประสงค์การเรียนรู้ MKT-1.B: ก. อธิบาย (โดยใช้ข้อมูลจาก PPC หรือตารางเมื่อเหมาะสม) ว่าการแบ่งความเชี่ยวชาญตามข้อได้เปรียบพร้อมอัตราแลกเปลี่ยนที่เหมาะสมสามารถนำไปสู่ผลประโยชน์ทางการค้าได้อย่างไร ข. คำนวณ (โดยใช้ข้อมูลจาก PPC หรือตารางเมื่อเหมาะสม) อัตราแลกเปลี่ยนที่เป็นประโยชน์ร่วมกัน

  • MKT-1.B.1 การแบ่งความเชี่ยวชาญในการผลิตตามข้อได้เปรียบ_category导致การแลกเปลี่ยนโอกาสที่จะนำไปสู่โอกาสในการบริโภคที่เกินกว่าเส้น生产能力
  • MKT-1.B.2 ข้อได้เปรียบเปรียบเทียบและค่าโอกาสเสียกำหนดอัตราแลกเปลี่ยนสำหรับการแลกเปลี่ยนที่การซื้อขายที่เป็นประโยชน์ร่วมกันสามารถเกิดขึ้นได้

Source: College Board AP Course and Exam Description · ⁨แหล่งที่มา: คำอธิบายหลักสูตรและข้อสอบ College Board AP⁩

English

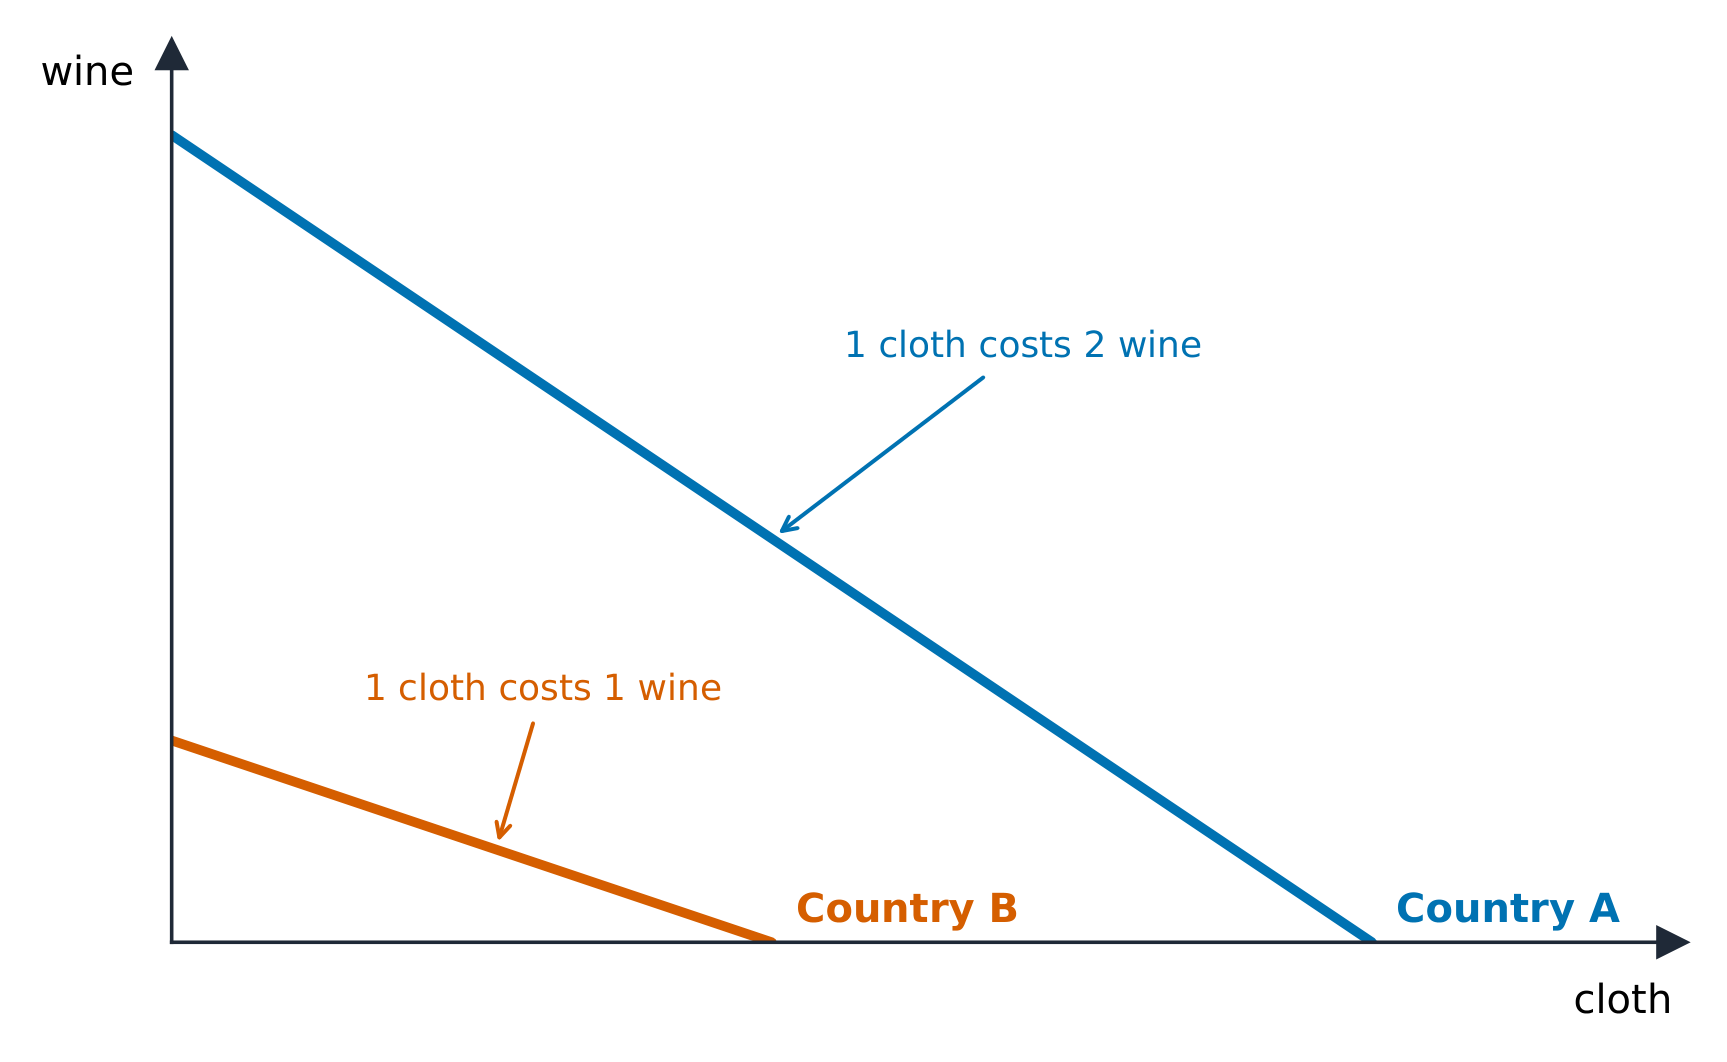
A producer has an absolute advantage 绝对优势 in a good if it can make more of it. It has a comparative advantage 比较优势 if it has the lower opportunity cost. Nations should specialize in their comparative-advantage goods and trade – both gain if the terms of trade 贸易条件 lie between the two opportunity costs. Trade lets a country consume beyond its own PPC.

Worked example. Country A can make $10$ wheat or $5$ cloth per day; Country B can make $8$ wheat or $8$ cloth. For A, one cloth costs $\tfrac{10}{5}=2$ wheat; for B it costs $\tfrac{8}{8}=1$ wheat. B's opportunity cost of cloth is lower, so B specializes in cloth. Checking wheat: A gives up $0.5$ cloth per wheat and B gives up $1$, so A specializes in wheat. Trading at any rate between the two costs, both consume beyond their own PPC.

ไทย

ผู้ผลิตมี ความได้เปรียบสัมบูรณ์ ในสินค้าหากสามารถผลิตได้มากกว่า ผู้ผลิตมี ความได้เปรียบสัมพัทธ์ หากมี ต้นทุนโอกาสที่ต่ำกว่า ประเทศควรเชี่ยวชาญในสินค้าที่มีความได้เปรียบสัมพัทธ์และค้าขาย – ทั้งสองฝ่ายจะได้ประโยชน์หาก อัตราการค้า อยู่ระหว่างต้นทุนโอกาสทั้งสอง การค้าช่วยให้ประเทศบริโภคเกินกว่าขีดจำกัดของ PPC自身ได้

ตัวอย่างฝึกหัด. ประเทศ A สามารถผลิต $10$ ข้าวสาลี หรือ $5$ ผ้าต่อวัน; ประเทศ B สามารถผลิต $8$ ข้าวสาลี หรือ $8$ ผ้า สำหรับ A หนึ่งหน่วยผ้ามีต้นทุน $\tfrac{10}{5}=2$ ข้าวสาลี; สำหรับ B มีต้นทุน $\tfrac{8}{8}=1$ ข้าวสาลี ต้นทุนโอกาสของผ้าของ B ต่ำกว่า ดังนั้น B ชำนาญด้านผ้า ตรวจสอบข้าวสาลี: A สละ $0.5$ หน่วยผ้าต่อข้าวสาลี และ B สละ $1$ หน่วย ดังนั้น A ชำนาญด้านข้าวสาลี การค้าที่อัตราใดก็ได้ระหว่างต้นทุนทั้งสอง ทำให้ทั้งสองฝ่ายบริโภคเกินกว่าขีดจำกัดของ PPC自身ได้

ความได้เปรียบสัมพัทธ์เกิดจากเส้น frontier ของการผลิตที่มีความชันต่างกัน
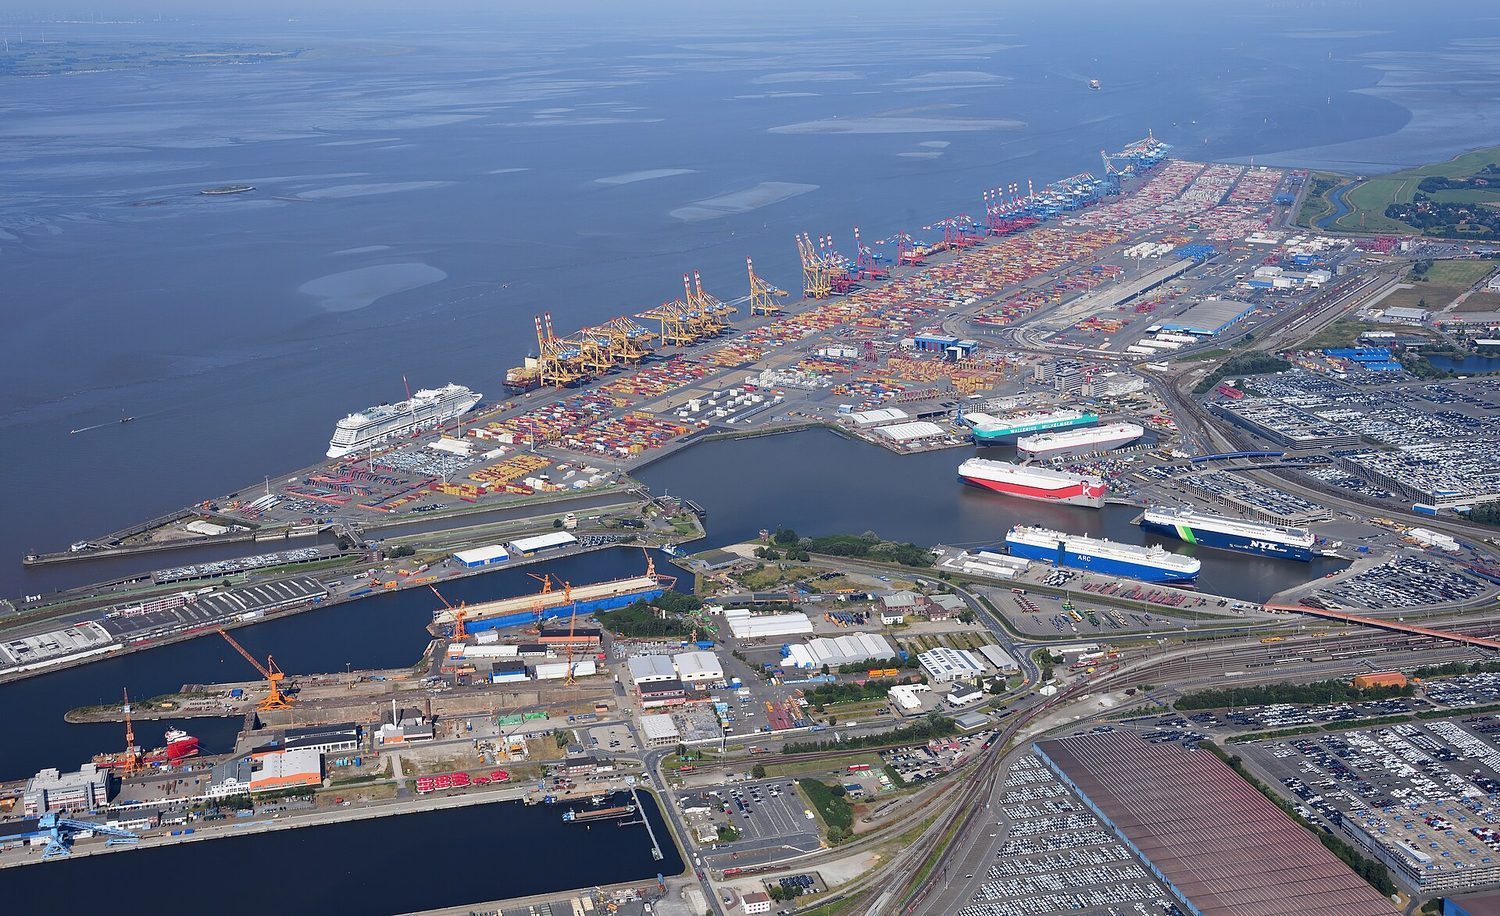
การขนส่งแบบคอนเทนเนอร์: ความได้เปรียบสัมพัทธ์และการค้าช่วยให้ประเทศเชี่ยวชาญและได้รับประโยชน์
Explore · ⁨สำรวจ⁩

See the gains from specialization and trade · ⁨เห็นประโยชน์จากการแบ่งงานเฉพาะด้านและการค้า⁩

A country should specialize where its opportunity cost is lowest, then trade for the rest. Because the terms of trade sit between the two countries' costs, each can consume beyond its own production frontier. · ⁨ประเทศควรแบ่งงานเฉพาะด้านที่ โอกาสต้นทุน ต่ำที่สุด แล้วซื้อขายส่วนที่เหลือ เนื่องจากอัตราแลกเปลี่ยนอยู่ระหว่างต้นทุนของประเทศทั้งสอง ทุกประเทศจึงสามารถบริโภค เกินกว่า ขอบเขตการผลิตของตนเองได้⁩

Vocabulary · ⁨คำศัพท์⁩ Train · ⁨ฝึกฝน⁩
English ไทย
comparative advantage/kəmˈpærətɪv ədˈvæntɪdʒ/ ความได้เปรียบสัมพัทธ์
terms of trade/tɜːmz ɒv treɪd/ terms of trade
1.4

Demand · ⁨ความต้องการ⁩

Syllabus · ⁨หลักสูตร⁩
English

Enduring Understanding (MKT-2): In a competitive market, demand for and supply of a good or service determine the equilibrium price.

Learning Objective MKT-2.A: a. Define (using graphs as appropriate) the law of demand. b. Explain (using graphs as appropriate) the relationship between the price of a good or service and the quantity demanded.

  • MKT-2.A.1 The law of demand states there is an inverse relationship between price and quantity demanded, leading to a downward-sloping demand curve.

Learning Objective MKT-2.B: Explain (using graphs as appropriate) the determinants of demand.

  • MKT-2.B.1 Factors that influence consumer demand, such as changes in consumer income, cause the market demand curve to shift.
ไทย

ความเข้าใจที่ยั่งยืน (MKT-2): ในตลาดแข่งขัน ความต้องการและอุปทานของสินค้าหรือบริการกำหนดราคาสมดุล

วัตถุประสงค์การเรียนรู้ MKT-2.A: ก. นิยาม (โดยใช้กราฟเมื่อเหมาะสม) กฎของความ ต้องการ ข. อธิบาย (โดยใช้กราฟเมื่อเหมาะสม) ความสัมพันธ์ระหว่างราคาของสินค้าหรือบริการกับปริมาณที่ต้องการ

  • MKT-2.A.1 กฎของความ ต้องการระบุว่ามีความสัมพันธ์ผกผันระหว่างราคาและปริมาณที่ต้องการ ซึ่งนำไปสู่เส้นความต้องการที่มีแนวโน้มลดลง

วัตถุประสงค์การเรียนรู้ MKT-2.B: อธิบาย (โดยใช้กราฟเมื่อเหมาะสม) ปัจจัยกำหนดความต้องการ

  • MKT-2.B.1 ปัจจัยที่ส่งผลต่อความต้องการของผู้บริโภค เช่น การเปลี่ยนแปลงรายได้ของผู้บริโภค ทำให้เส้นความต้องการในตลาดเคลื่อนที่

Source: College Board AP Course and Exam Description · ⁨แหล่งที่มา: คำอธิบายหลักสูตรและข้อสอบ College Board AP⁩

English

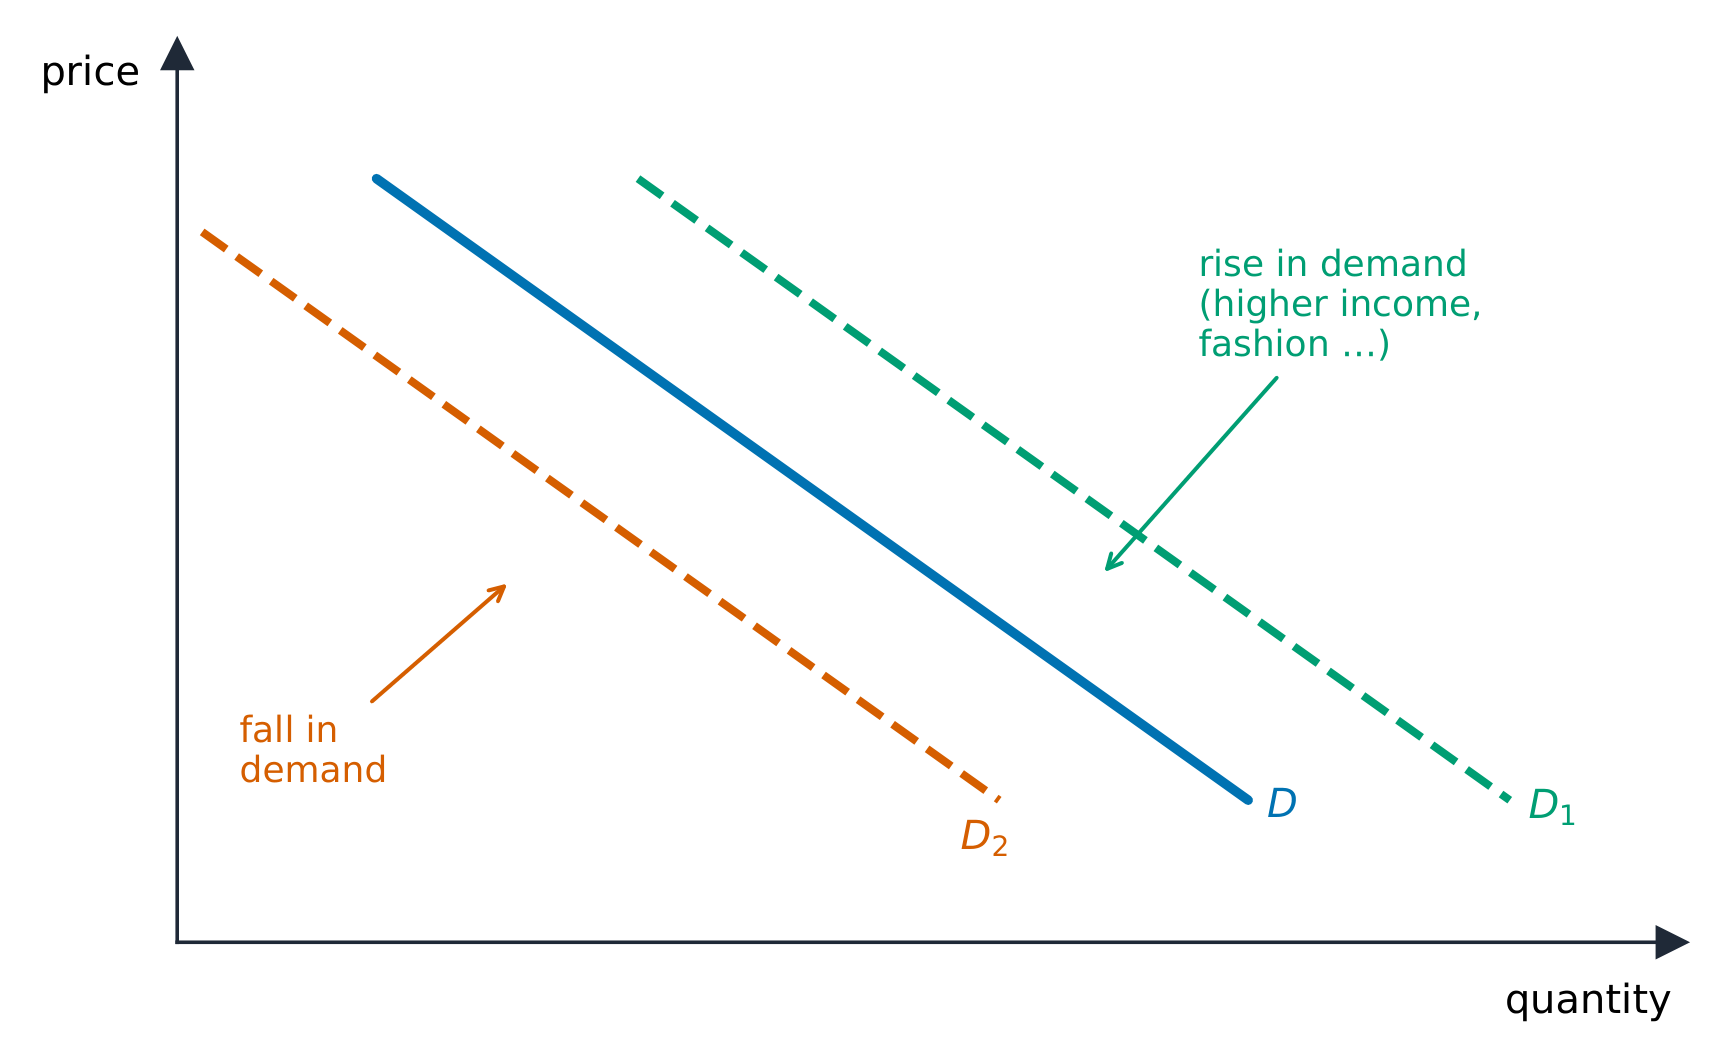
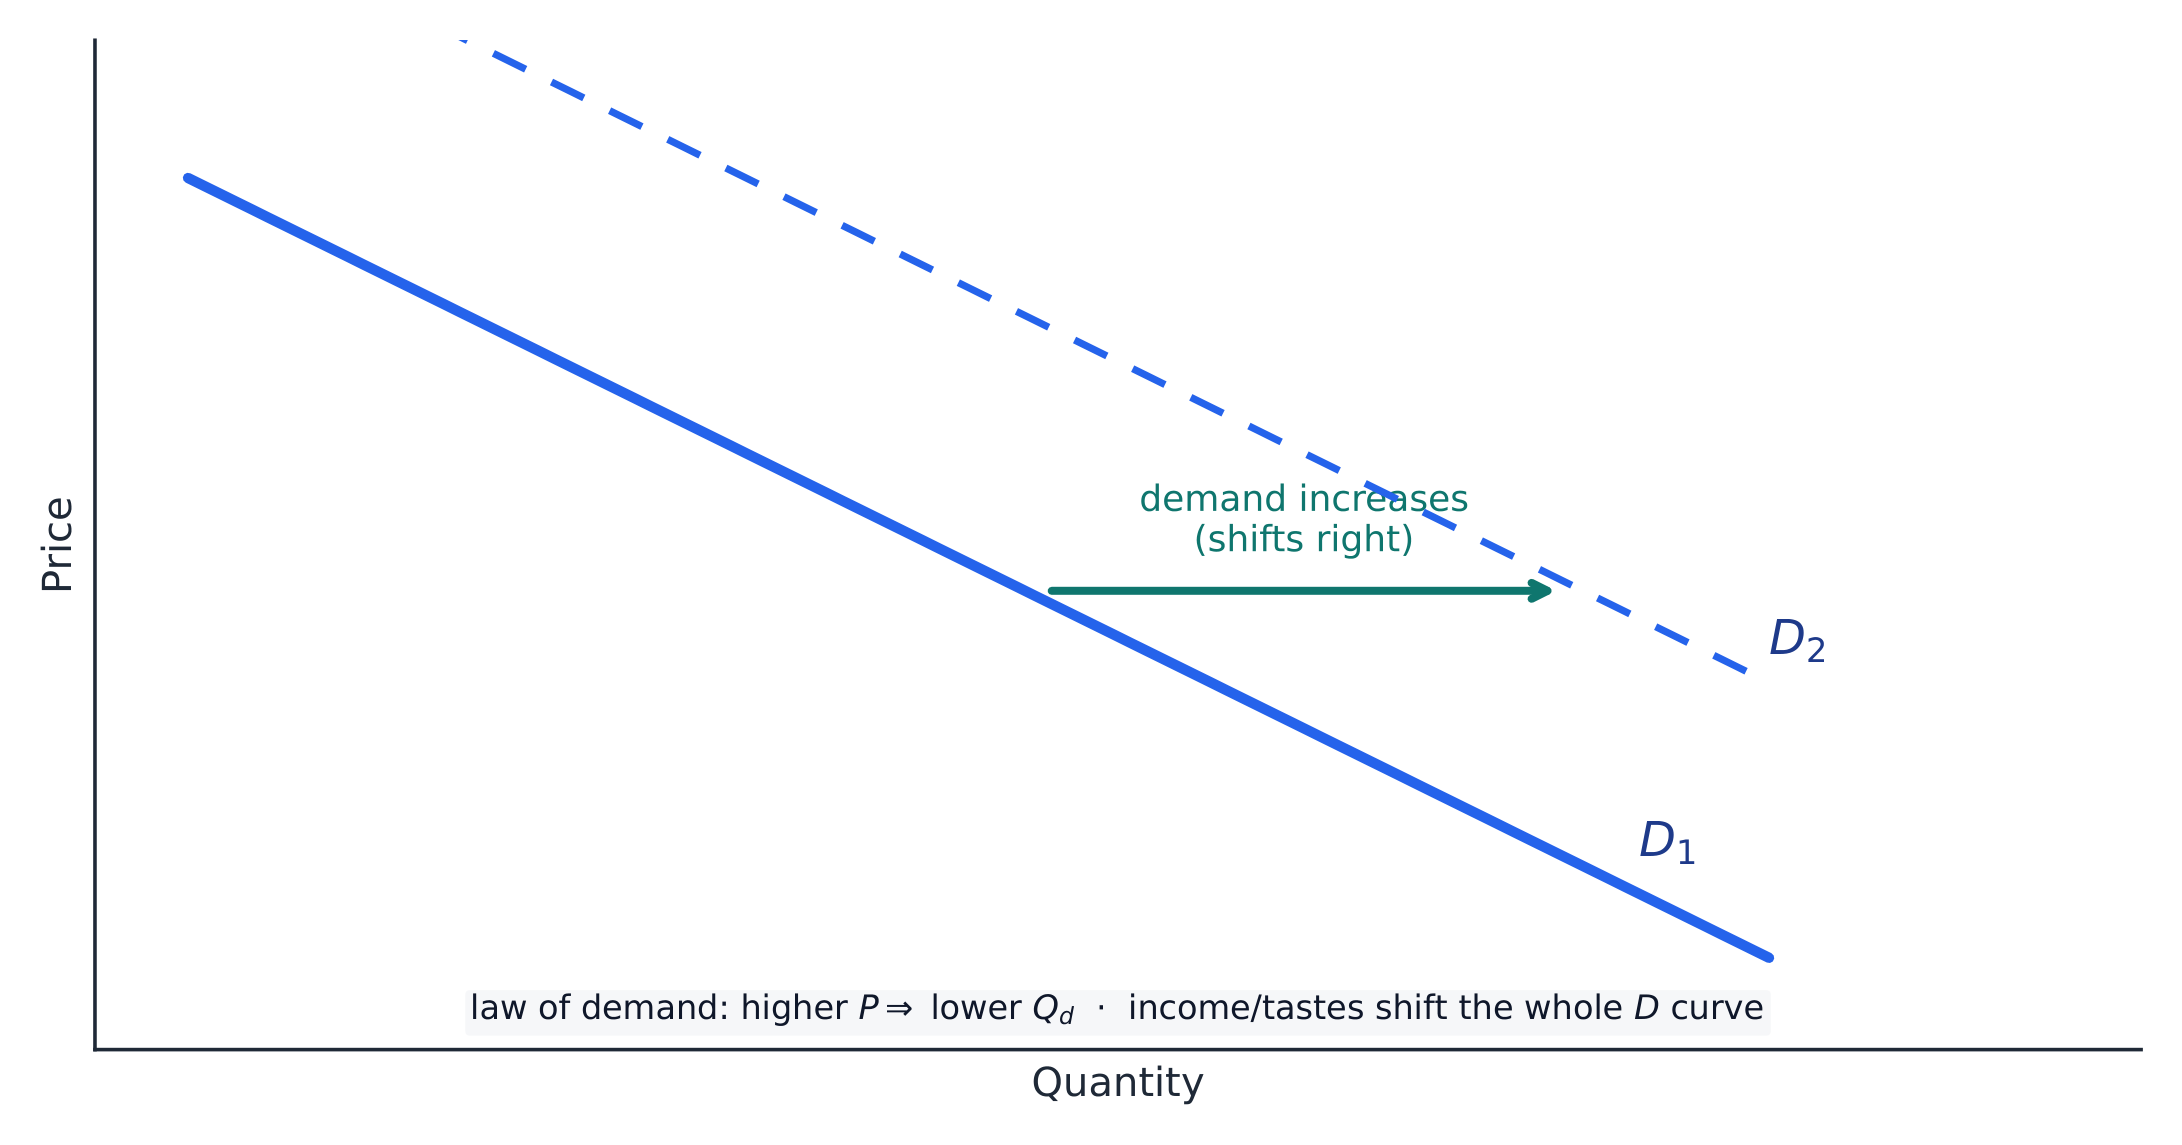
Demand 需求 relates price to the quantity buyers will buy. The law of demand 需求定律 makes the curve slope downward. A change in the good's own price is a movement along the curve; the determinants (income, tastes, prices of substitutes 替代品 and complements 互补品, number of buyers, expectations) shift the whole curve.

ไทย

ความต้องการ เชื่อมโยงราคาเข้ากับปริมาณที่ผู้ซื้อจะซื้อ กฎแห่งความต้องการ ทำให้เส้นโค้งมีความ ชันลง การเปลี่ยนแปลง ราคาของสินค้านั้นๆ คือการเคลื่อนที่ตามเส้นโค้ง ส่วน ตัวกำหนด (รายได้ รสนิยม ราคาของ สินค้าทดแทน และ สินค้าเสริม, จำนวนผู้ซื้อ, ความคาดหวัง) จะ เลื่อน เส้นโค้งทั้งเส้น

เส้นโค้งความต้องการชันลง; รายได้ รสนิยม และราคาสินค้าที่เกี่ยวข้องเลื่อนเส้นโค้ง
กฎแห่งความต้องการทำให้เส้นโค้งชันลง; ตัวกำหนดเลื่อนเส้นโค้งทั้งเส้น
Explore · ⁨สำรวจ⁩

Explore demand — move along vs shift the curve · ⁨สำรวจความต้องการ — เคลื่อนที่ตามเส้น vs เลื่อนเส้น⁩

A change in the own price moves you along a fixed curve (a change in quantity demanded); a determinant like income or tastes shifts the whole curve ($D_1 \to D_2$) — a change in demand. · ⁨การเปลี่ยนแปลง ราคาตัวเอง ทำให้คุณ เคลื่อนที่ตาม เส้นคงที่ (เป็นการเปลี่ยนแปลง ปริมาณต้องการซื้อ); ปัจจัยกำหนดอย่างเช่น รายได้หรือรสนิยมจะ เลื่อน เส้นทั้งหมด ($D_1 \to D_2$) — ซึ่งเป็นการเปลี่ยนแปลง ความต้องการ⁩

Vocabulary · ⁨คำศัพท์⁩ Train · ⁨ฝึกฝน⁩
English ไทย
Demand/dɪˈmænd/ อุปสงค์
law of demand/lɔː ɒv dɪˈmænd/ กฎแห่งการต้องการ
substitutes/ˈsʌbstɪtjuːts/ สินค้าทดแทน
complements/ˈkɒmplɪmənts/ สินค้าเสริมกัน
1.5

Supply · ⁨Offer⁩

Syllabus · ⁨หลักสูตร⁩
English

Enduring Understanding (MKT-2): In a competitive market, demand for and supply of a good or service determine the equilibrium price.

Learning Objective MKT-2.C: a. Define (using graphs as appropriate) the law of supply. b. Explain (using graphs as appropriate) the relationship between the price of a good or service and the quantity supplied.

  • MKT-2.C.1 The law of supply states there is a positive relationship between price and quantity supplied, leading to an upward-sloping supply curve.

Learning Objective MKT-2.D: Explain (using graphs as appropriate) the determinants of supply.

  • MKT-2.D.1 Factors that influence producer supply, such as changes in input prices, cause the market supply curve to shift.
ไทย

ความเข้าใจที่ยั่งยืน (MKT-2): ในตลาดแข่งขัน ความต้องการและอุปทานของสินค้าหรือบริการกำหนดราคาสมดุล

วัตถุประสงค์การเรียนรู้ MKT-2.C: ก. นิยาม (โดยใช้กราฟเมื่อเหมาะสม) กฎของอุปทาน ข. อธิบาย (โดยใช้กราฟเมื่อเหมาะสม) ความสัมพันธ์ระหว่างราคาของสินค้าหรือบริการกับปริมาณที่เสนอขาย

  • MKT-2.C.1 กฎของอุปทานระบุว่ามีความสัมพันธ์บวกระหว่างราคาและปริมาณที่เสนอขาย ซึ่งนำไปสู่เส้นอุปทานที่มีแนวโน้มเพิ่มขึ้น

วัตถุประสงค์การเรียนรู้ MKT-2.D: อธิบาย (โดยใช้กราฟเมื่อเหมาะสม) ปัจจัยกำหนดอุปทาน

  • MKT-2.D.1 ปัจจัยที่ส่งผลต่ออุปทานของผู้ผลิต เช่น การเปลี่ยนแปลงราคาสินค้าเข้า ทำให้เส้นอุปทานในตลาดเคลื่อนที่

Source: College Board AP Course and Exam Description · ⁨แหล่งที่มา: คำอธิบายหลักสูตรและข้อสอบ College Board AP⁩

English

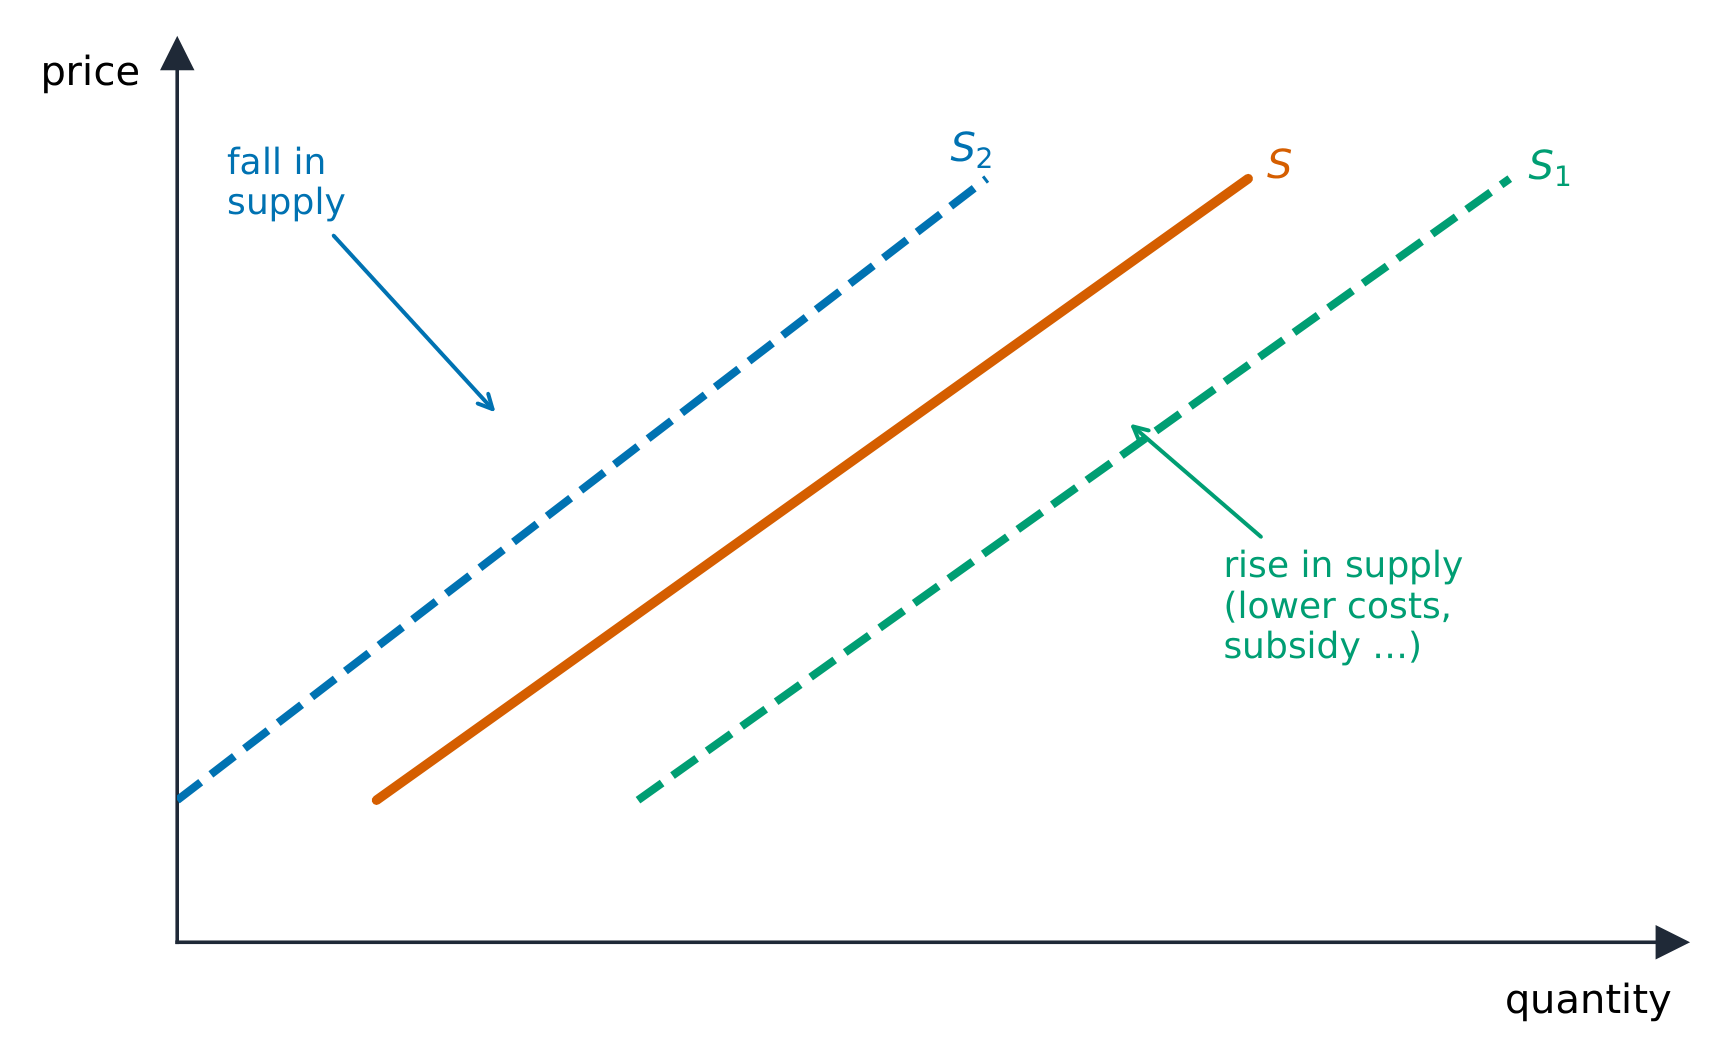
Supply 供给 relates price to the quantity sellers will offer; the law of supply 供给定律 makes it slope upward. Its determinants – input prices, technology, taxes and subsidies 补贴, number of sellers, expectations – shift the curve, while the good's own price moves along it.

ไทย

** عرضه** เชื่อมโยงราคาเข้ากับปริมาณที่ผู้ขายจะเสนอ กฎแห่ง عرضه ทำให้เส้นโค้งมีความ ชันขึ้น ตัวกำหนดของมัน – ราคาปัจจัยการผลิต เทคโนโลยี ภาษีและ เงินอุดหนุน, จำนวนผู้ขาย, ความคาดหวัง – เลื่อนเส้นโค้ง ในขณะที่ราคาของสินค้านั้นๆ ทำให้เกิดการเคลื่อนที่ตามเส้นโค้ง

เส้นโค้ง عرضهชันขึ้น; ต้นทุน เทคโนโลยี ภาษี และการอุดหนุนเลื่อนเส้นโค้ง
Explore · ⁨สำรวจ⁩

Explore what moves the supply curve · ⁨สำรวจปัจจัยที่ทำให้เส้น_supply_เคลื่อนที่⁩

Supply slopes up: a higher price makes selling more worthwhile. A change in costs, technology or the number of sellers shifts the whole curve — not a move along it. Drag the supply line and watch price and quantity respond. · ⁨** عرضه** มีแนวโน้มเป็นบวก: ราคาที่สูงขึ้นทำให้การขายมากขึ้นคุ้มค่า การเปลี่ยนแปลงต้นทุน เทคโนโลยี หรือจำนวนผู้ขายจะ เลื่อน เส้นทั้งหมด — ไม่ใช่การเคลื่อนที่ตามเส้น ลากเส้น عرضهแล้วดูปฏิกิริยาของราคาและปริมาณ⁩

Vocabulary · ⁨คำศัพท์⁩ Train · ⁨ฝึกฝน⁩
English ไทย
Supply/səˈplaɪ/ อุปทาน
law of supply/lɔː ɒv səˈplaɪ/ กฎแห่งการเสนอขาย
subsidies/ˈsʌbsɪdiz/ เงินอุดหนุน
1.6

Market Equilibrium, Disequilibrium, and Changes in Equilibrium · ⁨จุดสมดุลตลาด ความไม่สมดุล และการเปลี่ยนแปลงจุดสมดุล⁩

Syllabus · ⁨หลักสูตร⁩
English

Enduring Understanding (MKT-2): In a competitive market, demand for and supply of a good or service determine the equilibrium price.

Learning Objective MKT-2.E: Define (using graphs as appropriate) market equilibrium.

  • MKT-2.E.1 Equilibrium is achieved at the price at which quantities demanded and supplied are equal.

Learning Objective MKT-2.F: a. Define a surplus and shortage. b. Explain (using graphs as appropriate) how prices adjust to restore equilibrium in markets that are experiencing imbalances. c. Calculate (using graphs as appropriate) the surplus or shortage in the market experience an imbalance.

  • MKT-2.F.1 Whenever markets experience imbalances—creating disequilibrium prices, surpluses, and shortages—market forces drive prices toward equilibrium.

Learning Objective MKT-2.G: Explain (using graphs as appropriate) how changes in demand and supply affect equilibrium price and equilibrium quantity.

  • MKT-2.G.1 Changes in the determinants of supply and/or demand result in a new equilibrium price and quantity.
ไทย

ความเข้าใจที่ยั่งยืน (MKT-2): ในตลาดแข่งขัน ความต้องการและอุปทานของสินค้าหรือบริการกำหนดราคาสมดุล

วัตถุประสงค์การเรียนรู้ MKT-2.E: นิยาม (โดยใช้กราฟเมื่อเหมาะสม) ความสมดุลของตลาด

  • MKT-2.E.1 ความสมดุลเกิดขึ้นที่ราคาที่ปริมาณต้องการและปริมาณเสนอขายเท่ากัน

วัตถุประสงค์การเรียนรู้ MKT-2.F: ก. นิยามส่วนเกินและส่วนขาด ข. อธิบาย (โดยใช้กราฟเมื่อเหมาะสม) ราคาปรับตัวอย่างไรเพื่อคืนสู่ความสมดุลในตลาดที่กำลังเผชิญกับความไม่สมดุล ค. คำนวณ (โดยใช้กราฟเมื่อเหมาะสม) ส่วนเกินหรือส่วนขาดในตลาดที่ประสบความไม่สมดุล

  • MKT-2.F.1 เมื่อใดก็ตามที่ตลาดเผชิญกับความไม่สมดุล—ซึ่งสร้างราคาที่ไม่สมดุล ส่วนเกิน และส่วนขาด—แรงจูงใจของตลาดจะดันราคาไปสู่ความสมดุล

วัตถุประสงค์การเรียนรู้ MKT-2.G: อธิบาย (โดยใช้กราฟเมื่อเหมาะสม) การเปลี่ยนแปลงความต้องการและอุปทานส่งผลต่อราคาสมดุลและปริมาณสมดุลอย่างไร

  • MKT-2.G.1 การเปลี่ยนแปลงปัจจัยกำหนดอุปทานและ/หรือความต้องการนำไปสู่ราคาและปริมาณสมดุลใหม่

Source: College Board AP Course and Exam Description · ⁨แหล่งที่มา: คำอธิบายหลักสูตรและข้อสอบ College Board AP⁩

English
Supply & demand: a shift raises P and Q

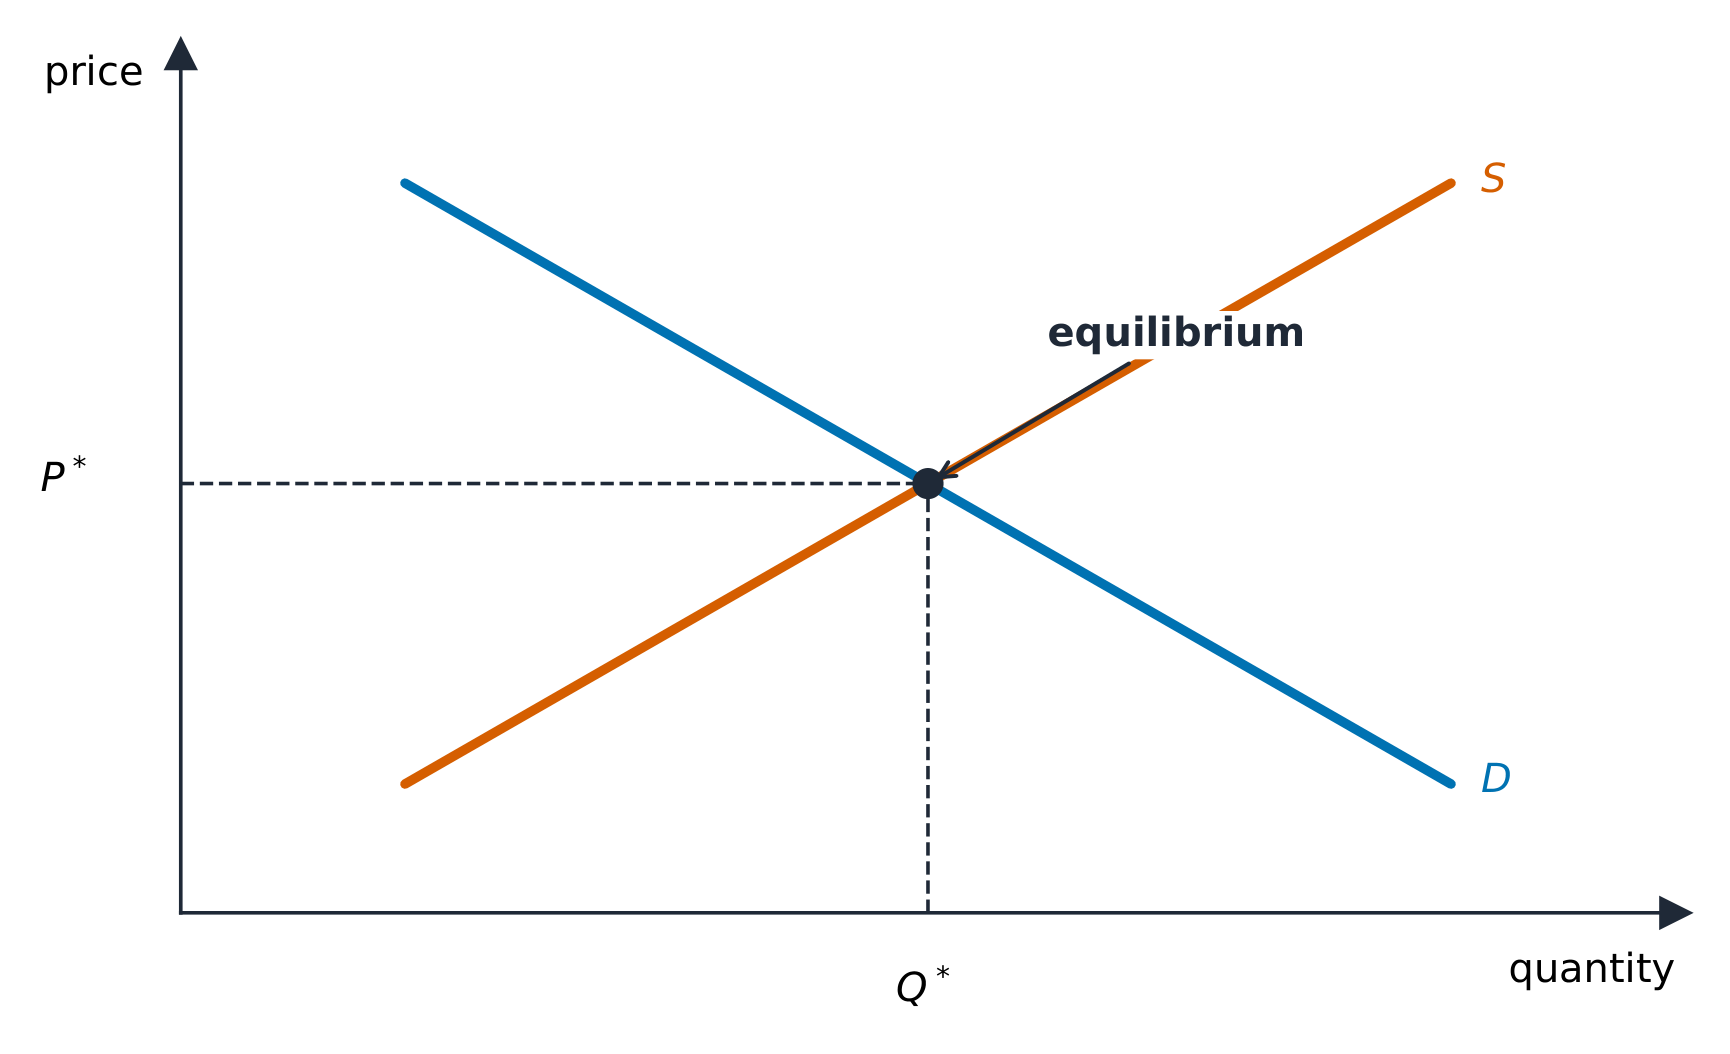
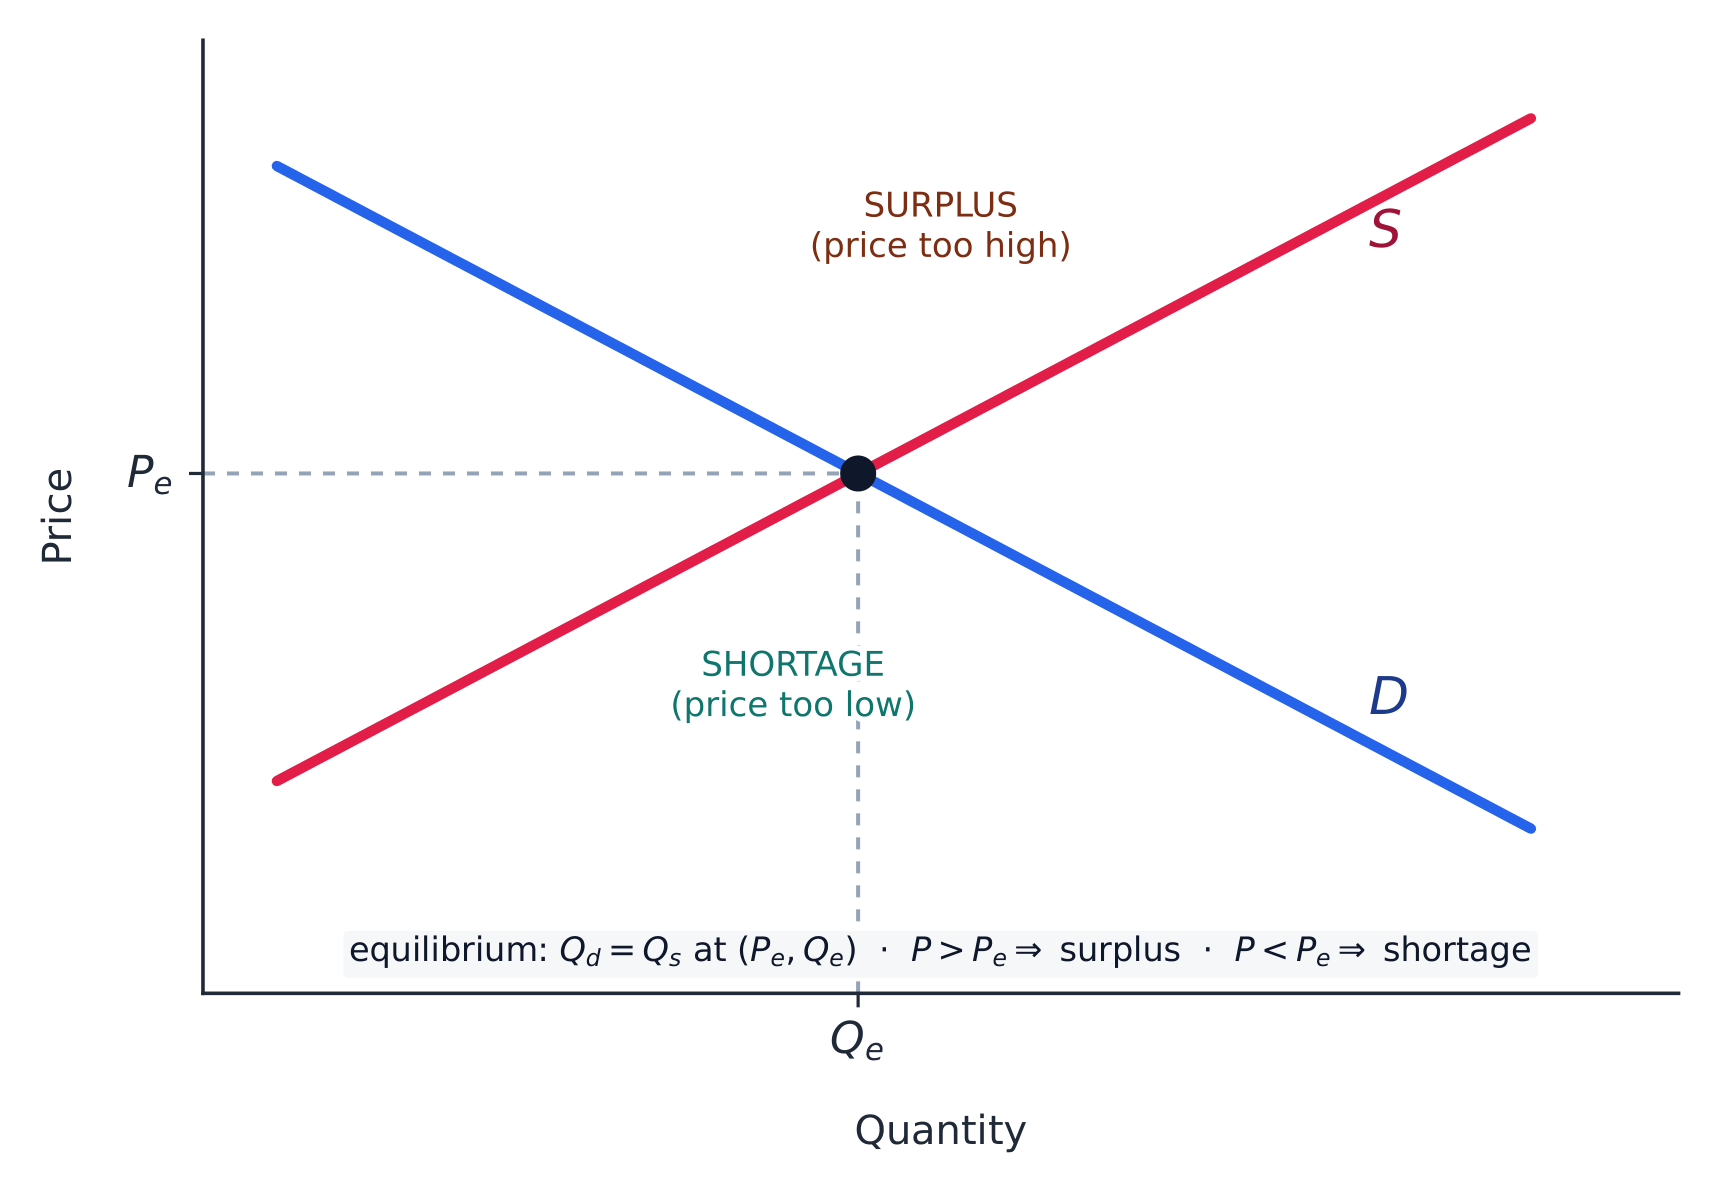
Equilibrium 均衡 is where supply meets demand, clearing the market. Above the equilibrium price a surplus 过剩 pushes price down; below it a shortage 短缺 pushes price up. When a determinant shifts one curve, price and quantity move predictably; when both shift, one of them is indeterminate.

Worked example. A new technology lowers producers' costs, shifting supply right. Along the unchanged demand curve, the equilibrium price falls and the equilibrium quantity rises. If instead a rise in incomes shifts demand right at the same time, quantity clearly rises but the effect on price depends on which shift is larger – the "both shift" indeterminate case.

Exam skill: macro builds on these micro tools – you must draw and shift supply-and-demand and PPC graphs correctly, because the same shift logic drives the aggregate (whole-economy) models later in the course.

ไทย
ตลาดคึกคัก: ความต้องการและ عرضهพบกันที่จุดที่ผู้ซื้อและผู้ขายเห็นพ้องต้องกันในราคา
อุปสงค์ & อุปทาน: การ SHIFT จะทำให้ P และ Q สูงขึ้น

จุดสมดุล คือจุดที่ عرضهพบกับความต้องการ ทำให้อุปทานและอุปสงค์สมดุลกัน เหนือจากราคาสมดุล ส่วนเกิน จะกดให้ราคาลง; ต่ำกว่าจุดนั้น ส่วนขาด จะดันให้ราคาขึ้น เมื่อตัวกำหนดเลื่อนเส้นโค้งหนึ่ง ราคาและปริมาณจะเคลื่อนไหวได้อย่างคาดเดาได้; เมื่อทั้งสองเลื่อน ค่าใดค่าหนึ่งจะเป็น ไม่แน่นอน

ตัวอย่างฝึกหัด. เทคโนโลยีใหม่ลดต้นทุนของผู้ผลิตรับ ** عرضهเลื่อนไปทางขวา** ตามเส้นความต้องการที่ไม่เปลี่ยน ราคาสมดุลลดลง และ ปริมาณสมดุลเพิ่มขึ้น หากในขณะเดียวกันรายได้อัตนเพิ่มขึ้น ความต้องการเลื่อนไปทางขวา ปริมาณเพิ่มขึ้นอย่างชัดเจน แต่ผลกระทบต่ราราคาขึ้นอยู่กับว่าการเลื่อน کدامใหญ่กว่า – กรณี "ทั้งสองเลื่อน" ที่ไม่แน่นอน

ราคาและปริมาณสมดุล ณ จุดที่ความต้องการตัดกับอุปทาน

ทักษะการสอบ: เศรษฐศาสตร์มหภาคสร้างบนเครื่องมือจุลภาคเหล่านี้ – คุณต้องวาดและเลื่อนกราฟ عرضه-ความต้องการและ PPC ให้ถูกต้อง เพราะตรรกะการเลื่อนเดียวกันนี้ขับเคลื่อนโมเดลรวม (ทั้งเศรษฐกิจ) ในภายหลังของหลักสูตร

จุดสมดุลตลาดอยู่ที่ที่ عرضهพบกับความต้องการ; ข้างนอกจุดนั้นคือส่วนเกินและส่วนขาด
Explore · ⁨สำรวจ⁩

Explore market equilibrium, surplus and shortage · ⁨สำรวจจุดสมดุลตลาด ความเหลือเฟือ และความขาดแคลน⁩

The market clears where supply meets demand. Shift a curve and watch the crossing move — a rightward demand shift raises both price and quantity; away from equilibrium a surplus or shortage pushes the price back. · ⁨ตลาดจะเคลียร์เมื่อ ** عرضهพบความต้องการ** เลื่อนเส้นและดูจุดตัดเคลื่อนที่ — การเลื่อนความต้องการไปทางขวาทำให้ ราคาและปริมาณ เพิ่มขึ้นทั้งคู่; ห่างจากจุดสมดุล ความเหลือเฟือหรือความขาดแคลน จะดันราคากลับคืนมา⁩

Vocabulary · ⁨คำศัพท์⁩ Train · ⁨ฝึกฝน⁩
English ไทย
Equilibrium/ˌiːkwɪˈlɪbrɪəm/ สมดุล
surplus/ˈsɜːpləs/ ส่วนเกิน
shortage/ˈʃɔːtɪdʒ/ ขาดแคลน
1.6

Exam tips · ⁨ข้อแนะนำสำหรับการสอบ⁩

English
  • Opportunity cost is what you give up — read it off a PPC as the slope; a bowed-out PPC shows increasing opportunity cost.
  • Comparative advantage (lower opportunity cost), not absolute advantage, decides who should specialise and trade.
  • Points inside the PPC are inefficient, outside unattainable; more resources/technology shift it out (growth).
  • Distinguish a movement along a demand/supply curve (own price) from a shift (a determinant).
  • These micro tools drive the aggregate models later — draw and shift the correct curve in the correct direction.
ไทย
  • ต้นทุนโอกาสคือสิ่งที่คุณ เสียสละ – อ่านค่าได้จากความชันของ PPC; PPC ที่โค้งอ้อมออกแสดงถึงต้นทุนโอกาสที่เพิ่มขึ้น
  • ความได้เปรียบสัมพัทธ์ (ต้นทุนโอกาสต่ำกว่า) ไม่ใช่ความได้เปรียบสัมบูรณ์来决定ว่าใครควรเชี่ยวชาญและค้าขาย
  • จุดภายใน PPC ไม่มีประสิทธิภาพ จุดภายนอกไม่สามารถทำได้; การเพิ่มทรัพยากร/เทคโนโลยีจะเลื่อนเส้นโค้งออกไป (การเติบโต)
  • แยกแยะการ เคลื่อนที่ตาม เส้นโค้งความต้องการ/ عرضه (ราคาเอง) จาก การเลื่อน (ตัวกำหนด)
  • เครื่องมือจุลภาคเหล่านี้ขับเคลื่อนโมเดลรวมในภายหลัง – วาดและเลื่อนเส้นโค้งที่ถูกต้องไปในทิศทางที่ถูกต้อง

Interactive lessons on this topic · ⁨บทเรียนเชิงโต้ตอบสำหรับหัวข้อนี้⁩

Work through it step by step, with instant-check exercises. · ⁨ทำทีละขั้นตอน พร้อมแบบฝึกหัดตรวจสอบผลทันที⁩

Past Papers · ⁨ข้อสอบย้อนหลัง⁩

More topics in AP Macroeconomics · ⁨AP เศรษฐศาสตร์มหภาค⁩ · ⁨หัวข้อเพิ่มเติมใน AP Macroeconomics · ⁨AP เศรษฐศาสตร์มหภาค⁩⁩

Log in or create account · ⁨เข้าสู่ระบบหรือสร้างบัญชี⁩

IGCSE, A-Level & AP