| Enduring Understanding | Learning Objective | Essential Knowledge |
|---|---|---|
POL-1 | POL-1.F |
|
Long-Run Consequences of Stabilization Policies
AP Macroeconomics · Topic 5
 8:29
8:29
Long-Run Consequences of Stabilization Policies
A government wants to end a recession fast. It spends more, cuts taxes, and the central bank makes borrowing cheap. It works — output rises, jobs come back.…
English narration · English + 中文 subtitles burned in
5.1
Fiscal and Monetary Policy in the Short Run

Syllabus
Source: College Board AP Course and Exam Description
Both policies work by shifting AD in the short run. Fiscal policy 财政政策 changes government spending or taxes; monetary policy 货币政策 changes the money supply and thus the interest rate. They can work together (both expansionary to fight a deep recession) or be mixed (e.g. loose fiscal + tight monetary). In the short run, expansionary policy raises output and the price level and lowers unemployment; contractionary policy does the reverse.
Explore
Use policy to shift aggregate demand
In the short run, fiscal (spending/taxes) and monetary (interest-rate) policy shift aggregate demand, moving real GDP and the price level along short-run aggregate supply.
Vocabulary
Train
| English |
|---|
| Fiscal policy/ˈfɪskl ˈpɒlɪsi/ |
| monetary policy/ˈmʌnɪtəri ˈpɒlɪsi/ |
5.2
The Phillips Curve
Syllabus
| Enduring Understanding | Learning Objective | Essential Knowledge |
|---|---|---|
MOD-3 | MOD-3.A |
|
MOD-3.B |
|
Source: College Board AP Course and Exam Description
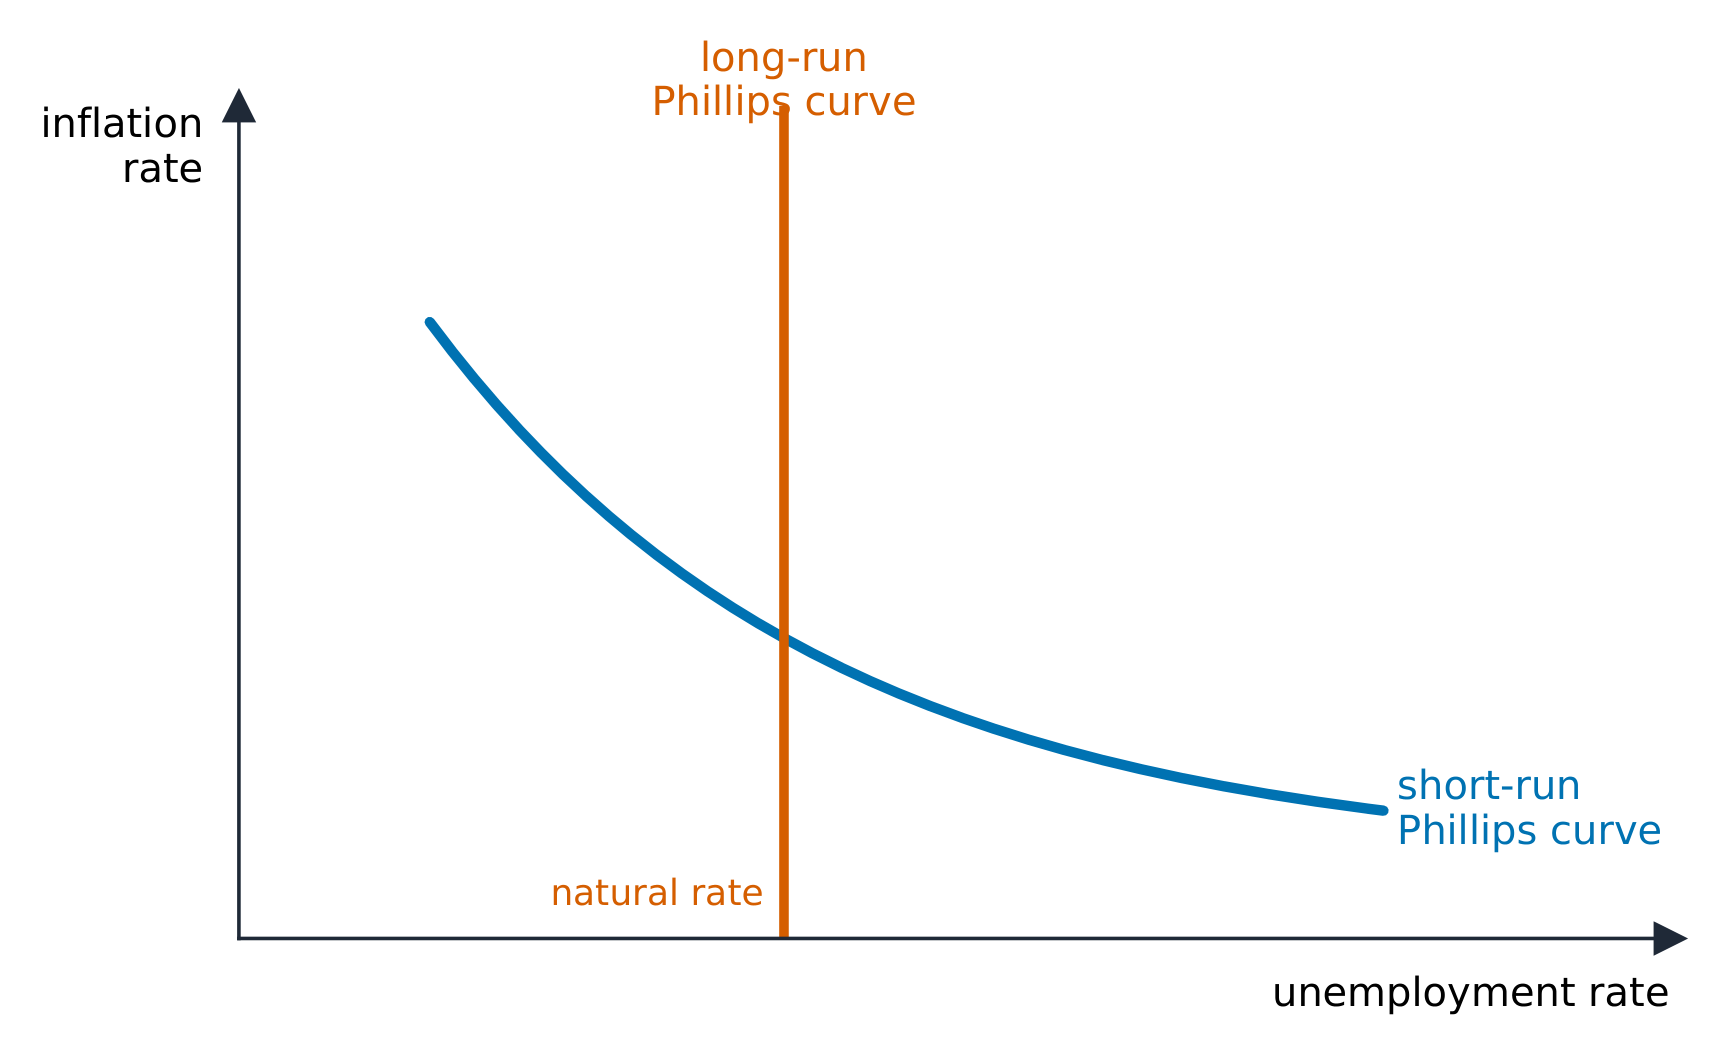
The Phillips curve 菲利普斯曲线 shows the short-run trade-off between inflation and unemployment:
- The short-run Phillips curve (SRPC) 短期菲利普斯曲线 slopes downward – lower unemployment comes with higher inflation. It is the mirror image of AD-AS: a rightward AD shift moves the economy up-left along the SRPC (less unemployment, more inflation).
- The long-run Phillips curve (LRPC) 长期菲利普斯曲线 is vertical at the natural rate of unemployment 自然失业率 – the counterpart of vertical LRAS. In the long run there is no trade-off: policy changes inflation, not unemployment.
- A supply shock shifts the SRPC (a negative shock moves it right – worse inflation and unemployment, i.e. stagflation). A change in expected inflation also shifts the SRPC.
Exam skill: link the AD-AS and Phillips graphs – a recessionary gap in AD-AS corresponds to a point on the SRPC to the right of the natural rate; know what shifts SRPC versus moves along it.
Vocabulary
Train
| English |
|---|
| Phillips curve/ˈfɪlɪps kɜːv/ |
| short-run Phillips curve (SRPC)/ʃɔːt rʌn ˈfɪlɪps kɜːv/ |
| long-run Phillips curve (LRPC)/lɒŋ rʌn ˈfɪlɪps kɜːv/ |
| natural rate of unemployment/ˈnætʃərəl reɪt ɒv ʌnemˈplɔɪmənt/ |
5.3
Money Growth and Inflation

Syllabus
| Enduring Understanding | Learning Objective | Essential Knowledge |
|---|---|---|
POL-3 | POL-3.A |
|
Source: College Board AP Course and Exam Description
In the long run, inflation is a monetary phenomenon. The quantity theory of money 货币数量论 states $M\times V = P\times Y$ (money supply $\times$ velocity $=$ price level $\times$ real output). With velocity $V$ and real output $Y$ roughly stable in the long run, growth in the money supply translates almost one-for-one into inflation. Printing money faster than the economy grows raises the price level, not real output – the root of high inflation and, in the extreme, hyperinflation 恶性通货膨胀.
Worked example. Suppose the money supply grows $8\%$ per year while real output $Y$ grows $3\%$ and velocity $V$ is stable. Rearranging $M\times V=P\times Y$ into growth rates, inflation $\approx 8\%-3\%=5\%$. The $5\%$ of money growth not matched by extra output simply becomes higher prices.
Explore
Link money growth to inflation
The quantity theory $MV=PY$: with output and velocity roughly fixed, the price level moves in proportion to the money supply — too much money chasing the same goods is inflation.
Vocabulary
Train
| English |
|---|
| quantity theory of money/ˈkwɒntɪti ˈθɪəri ɒv ˈmʌni/ |
| hyperinflation/ˌhaɪpərɪnˈfleɪʃn/ |
5.4
Government Deficits and the National Debt

Syllabus
| Enduring Understanding | Learning Objective | Essential Knowledge |
|---|---|---|
POL-3 | POL-3.B |
|
Source: College Board AP Course and Exam Description
A budget deficit 预算赤字 occurs when government spending exceeds tax revenue in a year (a surplus 盈余 is the reverse). The accumulated total of past deficits is the national debt 国债. Deficits are financed by borrowing – selling government bonds – which adds to the debt and to future interest payments. Persistent deficits raise concerns about crowding out and the burden of servicing the debt.
Vocabulary
Train
| English |
|---|
| budget deficit/ˈbʌdʒɪt ˈdefɪsɪt/ |
| surplus/ˈsɜːpləs/ |
| national debt/ˈnæʃənl det/ |
5.5
Crowding Out
Syllabus
| Enduring Understanding | Learning Objective | Essential Knowledge |
|---|---|---|
POL-3 | POL-3.C |
|
Source: College Board AP Course and Exam Description
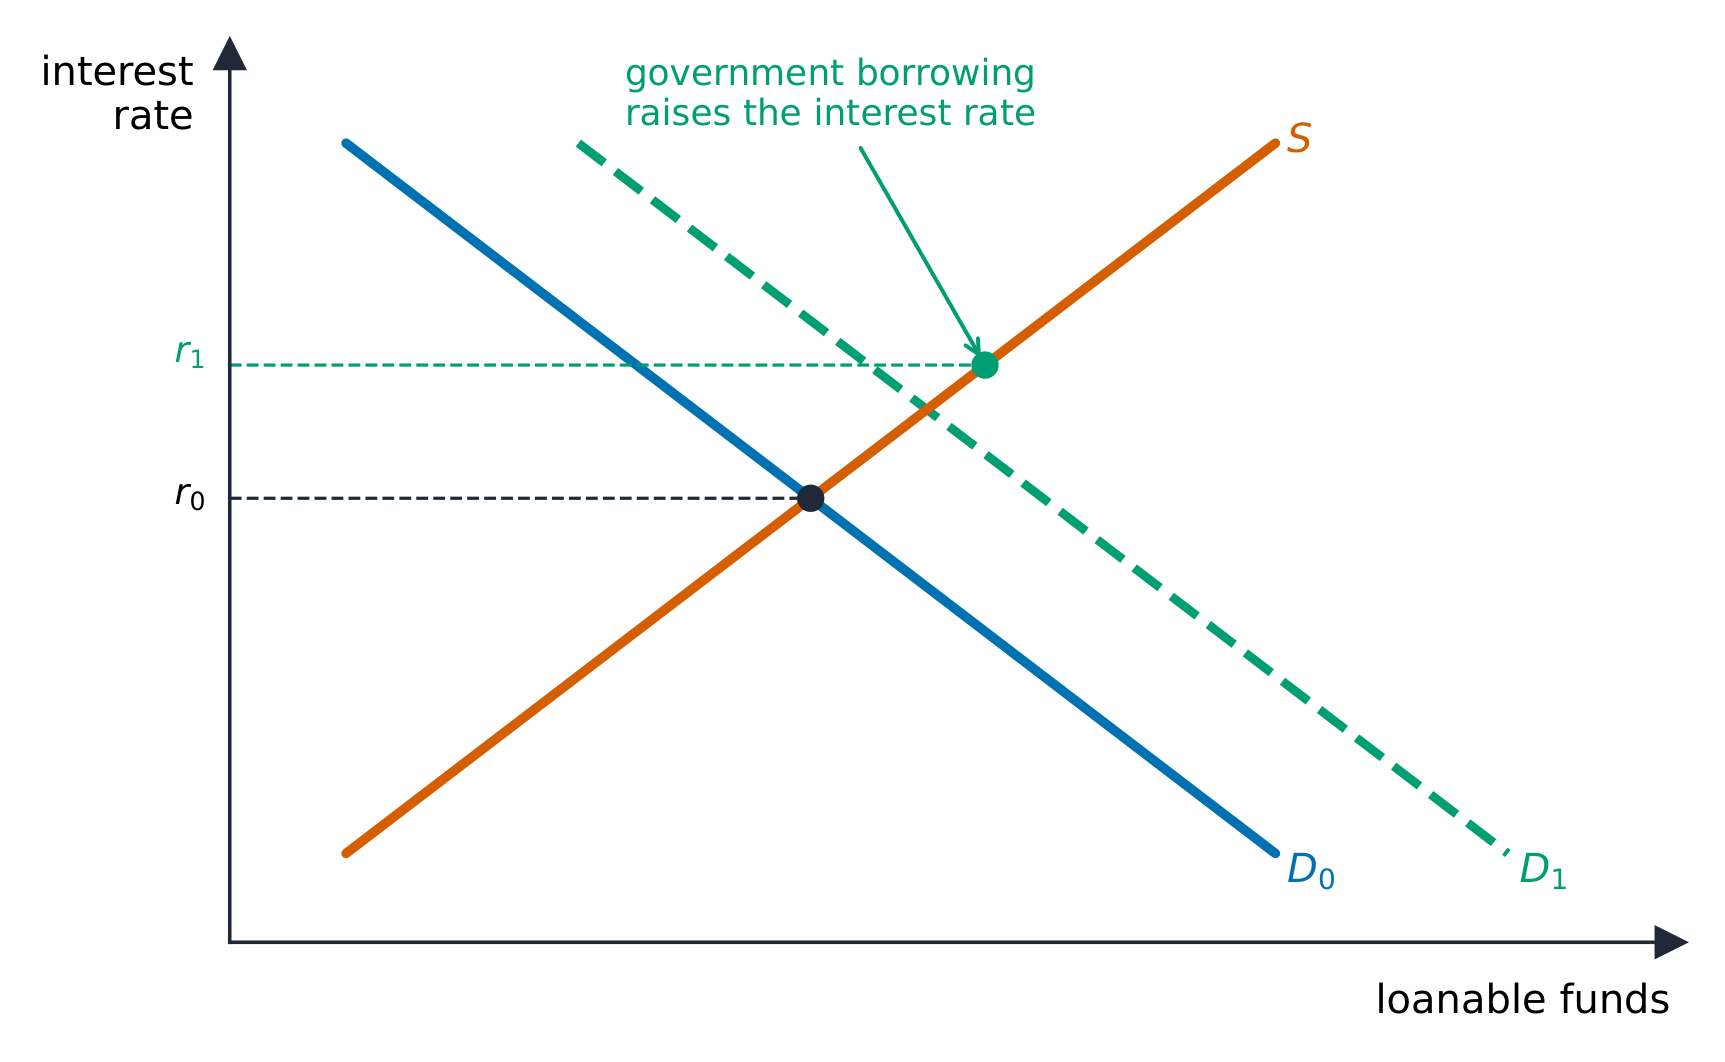
Crowding out 挤出效应 is the main long-run cost of deficit-financed fiscal policy. When the government borrows heavily, it increases the demand for loanable funds, raising the real interest rate. Higher rates reduce private investment (and interest-sensitive consumption). So expansionary fiscal policy partly cancels itself: the AD boost is offset by weaker investment. Worse, less investment today means a smaller capital stock and slower long-run growth.
Exam skill: show crowding out on the loanable funds graph – government borrowing shifts demand right, the real interest rate rises, and private investment falls.
Worked example. A government borrows $\$500$ billion to finance a deficit. On the loanable funds market this shifts the demand for funds right, pushing the real interest rate up (say from $3\%$ to $4\%$). At the higher rate firms scale back investment – perhaps by $\$150$ billion – so the net boost to AD is smaller than the $\$500$ billion, and the lost investment slows long-run growth.
Vocabulary
Train
| English |
|---|
| Crowding out/ˈkraʊdɪŋ aʊt/ |
5.6
Economic Growth
Syllabus
| Enduring Understanding | Learning Objective | Essential Knowledge |
|---|---|---|
MEA-2 | MEA-2.B |
|
Source: College Board AP Course and Exam Description
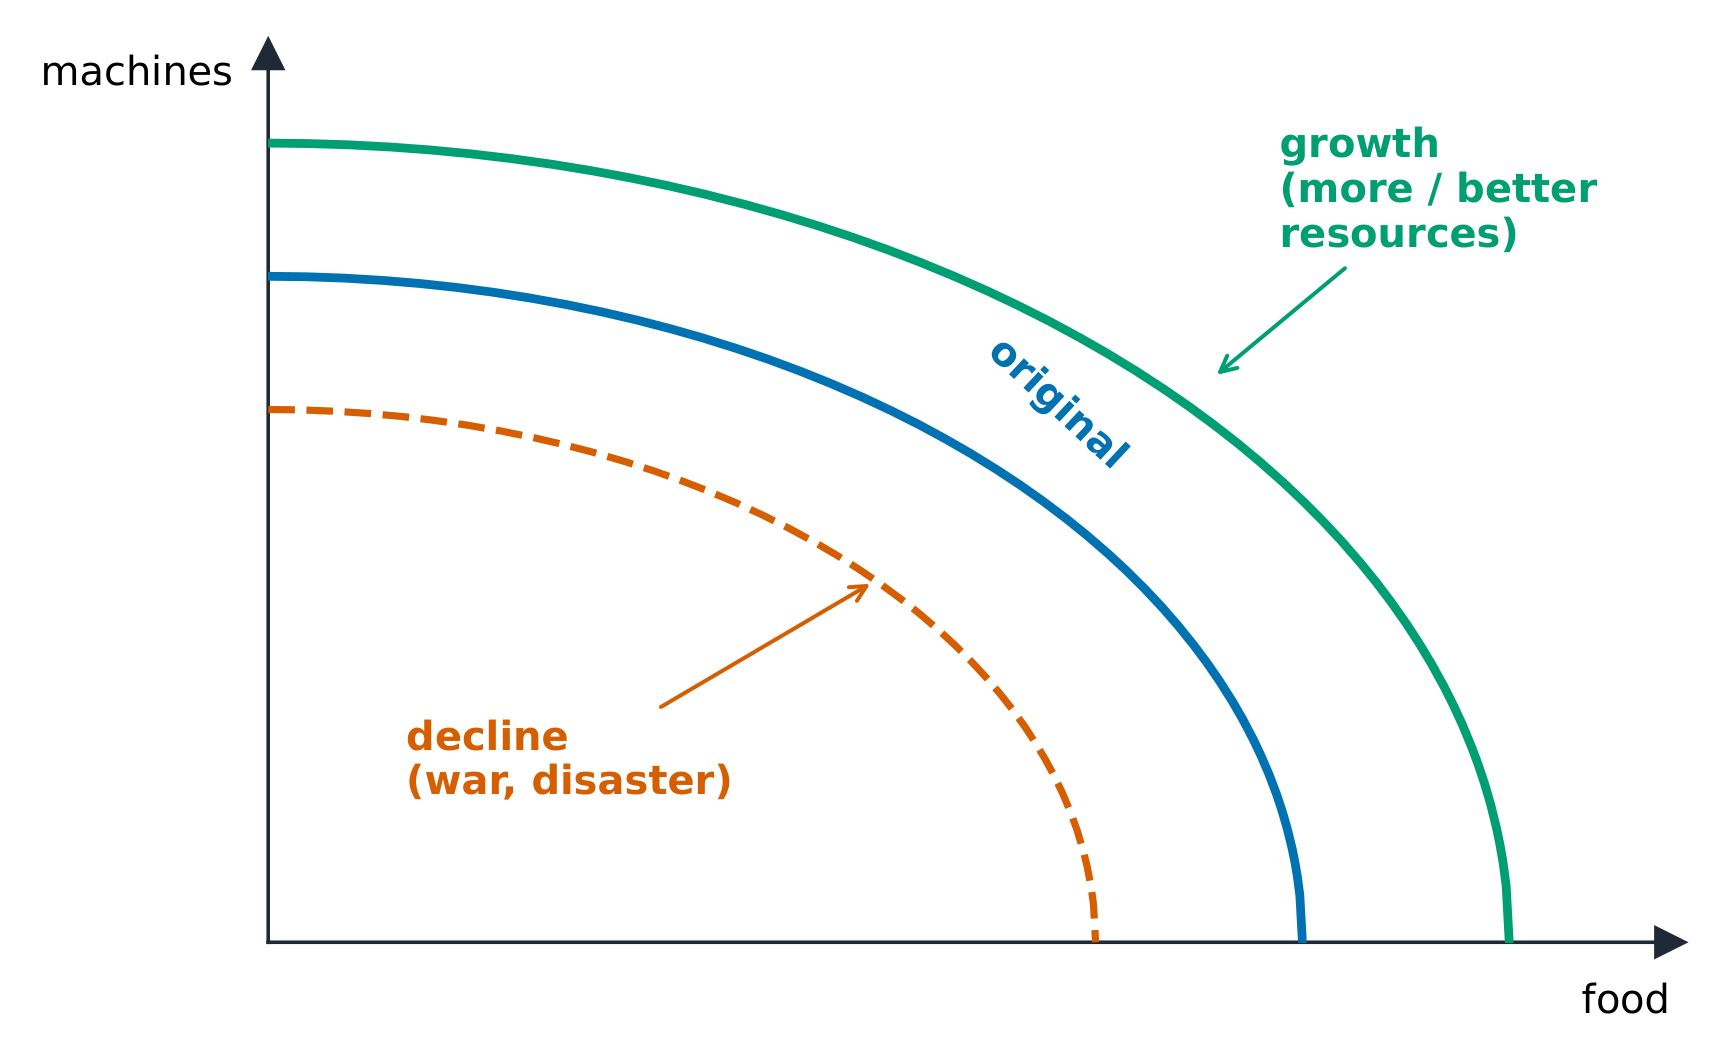
Economic growth 经济增长 is a sustained rise in real GDP per capita – the true source of higher living standards. It comes from more or better resources and is shown as a rightward shift of LRAS (and an outward shift of the PPC). Its main drivers:
- physical capital 实物资本 (more tools and machines per worker),
- human capital 人力资本 (education, skills, health),
- technology 技术 and innovation,
- productivity 生产率 (output per worker) growth, the deepest driver.
Explore
Economic growth pushes the frontier out
Economic growth — more resources, better technology — shifts the whole production possibilities frontier outward, letting the economy produce more of everything.
Vocabulary
Train
| English |
|---|
| Economic growth/ˌiːkəˈnɒmɪk ɡrəʊθ/ |
| physical capital/ˈfɪzɪkl ˈkæpɪtl/ |
| human capital/ˈhjuːmən ˈkæpɪtl/ |
| technology/tekˈnɒlədʒi/ |
| productivity/ˌprɒdəkˈtɪvɪti/ |
5.7
Public Policy and Economic Growth

Syllabus
| Enduring Understanding | Learning Objective | Essential Knowledge |
|---|---|---|
POL-4 | POL-4.A |
|
Source: College Board AP Course and Exam Description
Governments can raise long-run growth by policies that build capital and productivity: investment in infrastructure and education, research and development incentives, protecting property rights 产权 and the rule of law, encouraging saving and investment (which finances capital), and keeping inflation low and stable. The recurring long-run theme: policies that crowd out or discourage investment slow growth, while those that encourage capital formation speed it up.
Vocabulary
Train
| English |
|---|
| property rights/ˈprɒpəti raɪts/ |
5.7
Exam tips
- The short-run Phillips curve shows the inflation–unemployment trade-off; the long-run curve is vertical at the natural rate.
- In the long run inflation is a monetary phenomenon (money growth beyond output growth → inflation).
- Show crowding out on the loanable-funds graph: government borrowing raises the real rate and cuts private investment.
- Growth comes from more/better resources — physical capital, human capital, technology — shifting LRAS right.
- A supply shock moves inflation and unemployment the same way (stagflation), unlike a demand shock.
Interactive lessons on this topic
Work through it step by step, with instant-check exercises.