| Enduring Understanding | Learning Objective | Essential Knowledge |
|---|---|---|
MEA-1 | MEA-1.A |
|
Economic Indicators and the Business Cycle
AP Macroeconomics · Topic 2
 9:58
9:58
Economic Indicators and the Business Cycle
Two ordinary scenes. A supermarket aisle, where the same basket of food costs more than it did last year. And a long queue of people, waiting. Neither is an…
English narration · English + 中文 subtitles burned in
2.1
The Circular Flow and GDP
Syllabus
Source: College Board AP Course and Exam Description
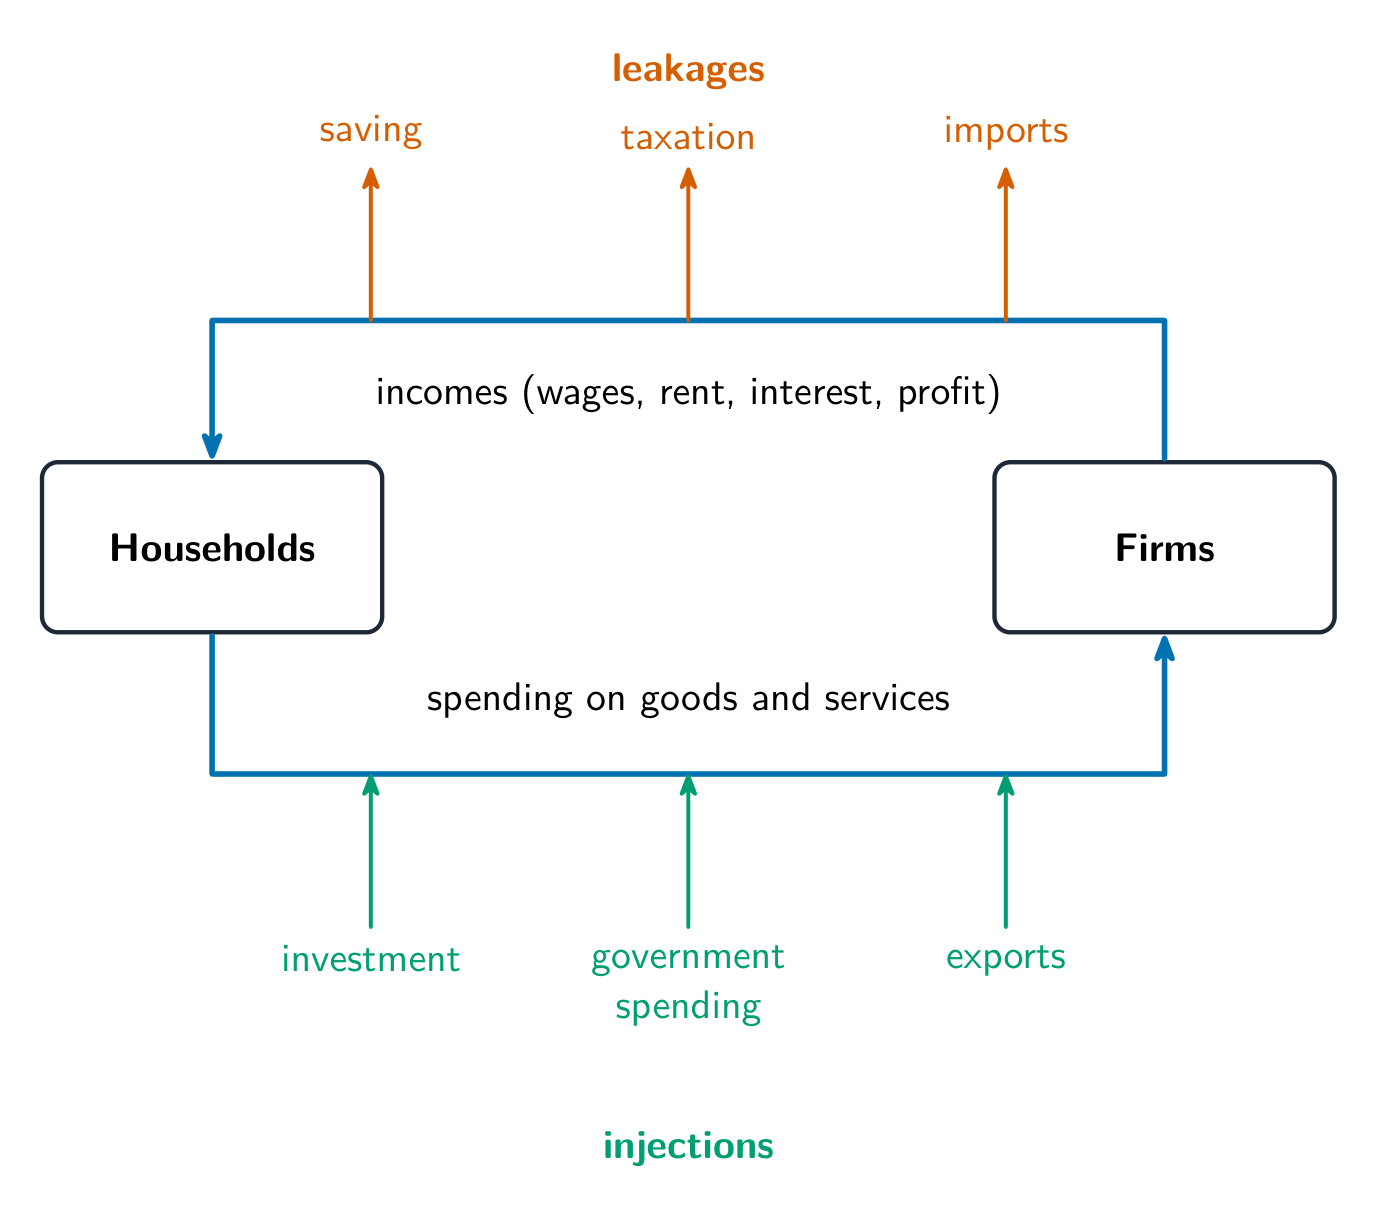
The circular-flow model 循环流动模型 links households supplying factors and earning income with firms producing goods and services. Spending on current domestic production generates income; transfers and existing financial assets do not themselves add to GDP.
Gross domestic product (GDP) 国内生产总值 is the market value of all final goods and services produced within a country in a year. Three ways to measure it give the same number:
- Expenditure approach: $GDP = C + I + G + X_n$ – consumption 消费, investment 投资 (business spending on capital, plus new housing and inventory), government purchases 政府购买, and net exports 净出口 (exports minus imports).
- Income approach: add the incomes earned in production: wages, rent, interest, and profit.
- Value-added approach: add each producer's sales minus its purchases of intermediate goods. For example, grain sells for $2, flour for $5, and bread for $8. Total value added is $2+(5-2)+(8-5)=8$ dollars, equal to the final bread sale. Adding all three sales would double count.
Worked example (billions of dollars). If $C=700$, $I=200$, $G=300$, exports are $150$ and imports $100$, GDP is $700+200+300+(150-100)=1250$. Buying shares is not investment in this GDP formula; a new factory machine is.
Exclude intermediate goods (avoid double counting), used goods, purely financial transactions, and transfer payments.
Explore
Follow money around the circular flow
Trace spending on current domestic production and the income it generates. Distinguish saving, taxes and imports from investment, government purchases and exports; not every money transfer is GDP.
Vocabulary
Train
| English |
|---|
| circular-flow model/ˈsɜːkjʊlə fləʊ ˈmɒdl/ |
| Gross domestic product (GDP)/ɡrəʊs dəˈmestɪk ˈprɒdʌkt/ |
| consumption/kənˈsʌmpʃn/ |
| investment/ɪnˈvestmənt/ |
| government purchases/ˈɡʌvənmənt ˈpɜːtʃɪsɪz/ |
| net exports/net ˈekspɔːts/ |
2.2
Limitations of GDP

Syllabus
| Enduring Understanding | Learning Objective | Essential Knowledge |
|---|---|---|
MEA-1 | MEA-1.B |
|
Source: College Board AP Course and Exam Description
GDP measures market output, not well-being. It omits non-market production (unpaid housework, volunteering), unreported production in the underground economy 地下经济, leisure, and the distribution of income, and it ignores environmental damage and resource depletion. So a higher GDP does not automatically mean a better standard of living. Real GDP per capita (real GDP $\div$ population) is a better welfare proxy than total GDP.

Comparison example (AP 2024 Set 1, Q2). Year 1: real GDP $800,000, population 1,000, so output per person $800. Year 2: nominal GDP $1,035,000, deflator 115 (year 1 = 100), so real GDP $900,000. Population 1,200 gives $750 per person. Total real output rose 12.5%; output per person fell 6.25%. Neither average proves every household's welfare.
Vocabulary
Train
| English |
|---|
| underground economy/ˌʌndəˈɡraʊnd ɪˈkɒnəmi/ |
2.3
Unemployment
Syllabus
| Enduring Understanding | Learning Objective | Essential Knowledge |
|---|---|---|
MEA-1 | MEA-1.C |
|
MEA-1.D |
| |
MEA-1.E |
|
Source: College Board AP Course and Exam Description
The labor force 劳动力 is the employed plus the unemployed (those without work who are available and actively looking). People not looking are not in the labor force.
$$\text{Unemployment rate}=\frac{\text{unemployed}}{\text{labor force}}\times 100\%,\qquad \text{Labor-force participation}=\frac{\text{labor force}}{\text{working-age population}}\times100\%.$$
Worked example. A country has $150$ million employed and $10$ million unemployed (actively looking), with $40$ million working-age adults not looking. The labor force is $150+10=160$ million, so the unemployment rate is $\dfrac{10}{160}\times100\%=6.25\%$ and the participation rate is $\dfrac{160}{200}\times100\%=80\%$.
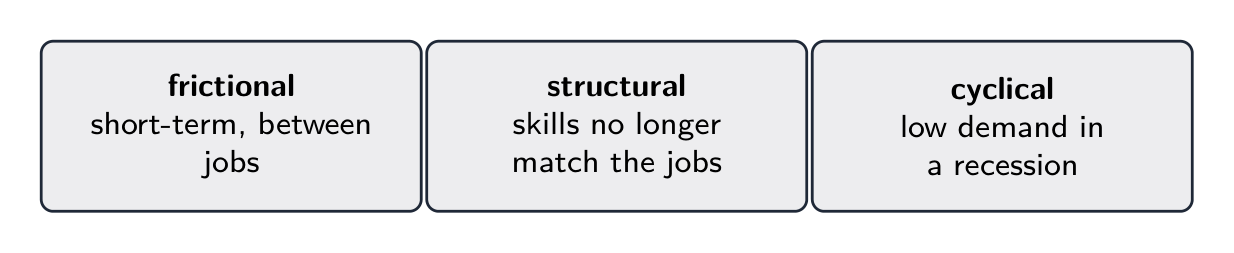
Three types of unemployment:
- Frictional 摩擦性失业: between jobs or searching for a first job (normal, short).
- Structural 结构性失业: skills or location don't match available jobs (technology, trade).
- Cyclical 周期性失业: caused by a recession (a downturn in the business cycle).
Frictional + structural make up the natural rate of unemployment 自然失业率. At the natural rate cyclical unemployment is zero and the economy is at full employment 充分就业. The rate does not describe all unused labor. Discouraged workers 灰心工人 have stopped looking, so are outside the labor force. Underemployed people working part time who want full-time work count as employed, not unemployed. If 5 million of the 10 million unemployed stop looking, with no new jobs, unemployment becomes $5/155\times100\%=3.23\%$ and participation $155/200\times100\%=77.5\%$. A falling unemployment rate need not mean more jobs.
Classify the cause. First-job search is frictional; skills mismatch is structural; recession layoffs are cyclical. Actual unemployment 8% minus cyclical 3% gives natural 5%; subtract frictional 4% to find structural 1% (AP 2024 Set 1, Q1a). The natural rate can change.
Vocabulary
Train
| English |
|---|
| labor force/ˈleɪbə fɔːs/ |
| Frictional/ˈfrɪkʃənl/ |
| Structural/ˈstrʌktʃərəl/ |
| Cyclical/ˈsaɪklɪkl/ |
| natural rate of unemployment/ˈnætʃərəl reɪt ɒv ʌnemˈplɔɪmənt/ |
| full employment/fʊl emˈplɔɪmənt/ |
| discouraged workers/dɪˈskʌrɪdʒd ˈwɜːkəz/ |
2.4
Price Indices and Inflation
Syllabus
| Enduring Understanding | Learning Objective | Essential Knowledge |
|---|---|---|
MEA-1 | MEA-1.F |
|
MEA-1.G |
|
Source: College Board AP Course and Exam Description
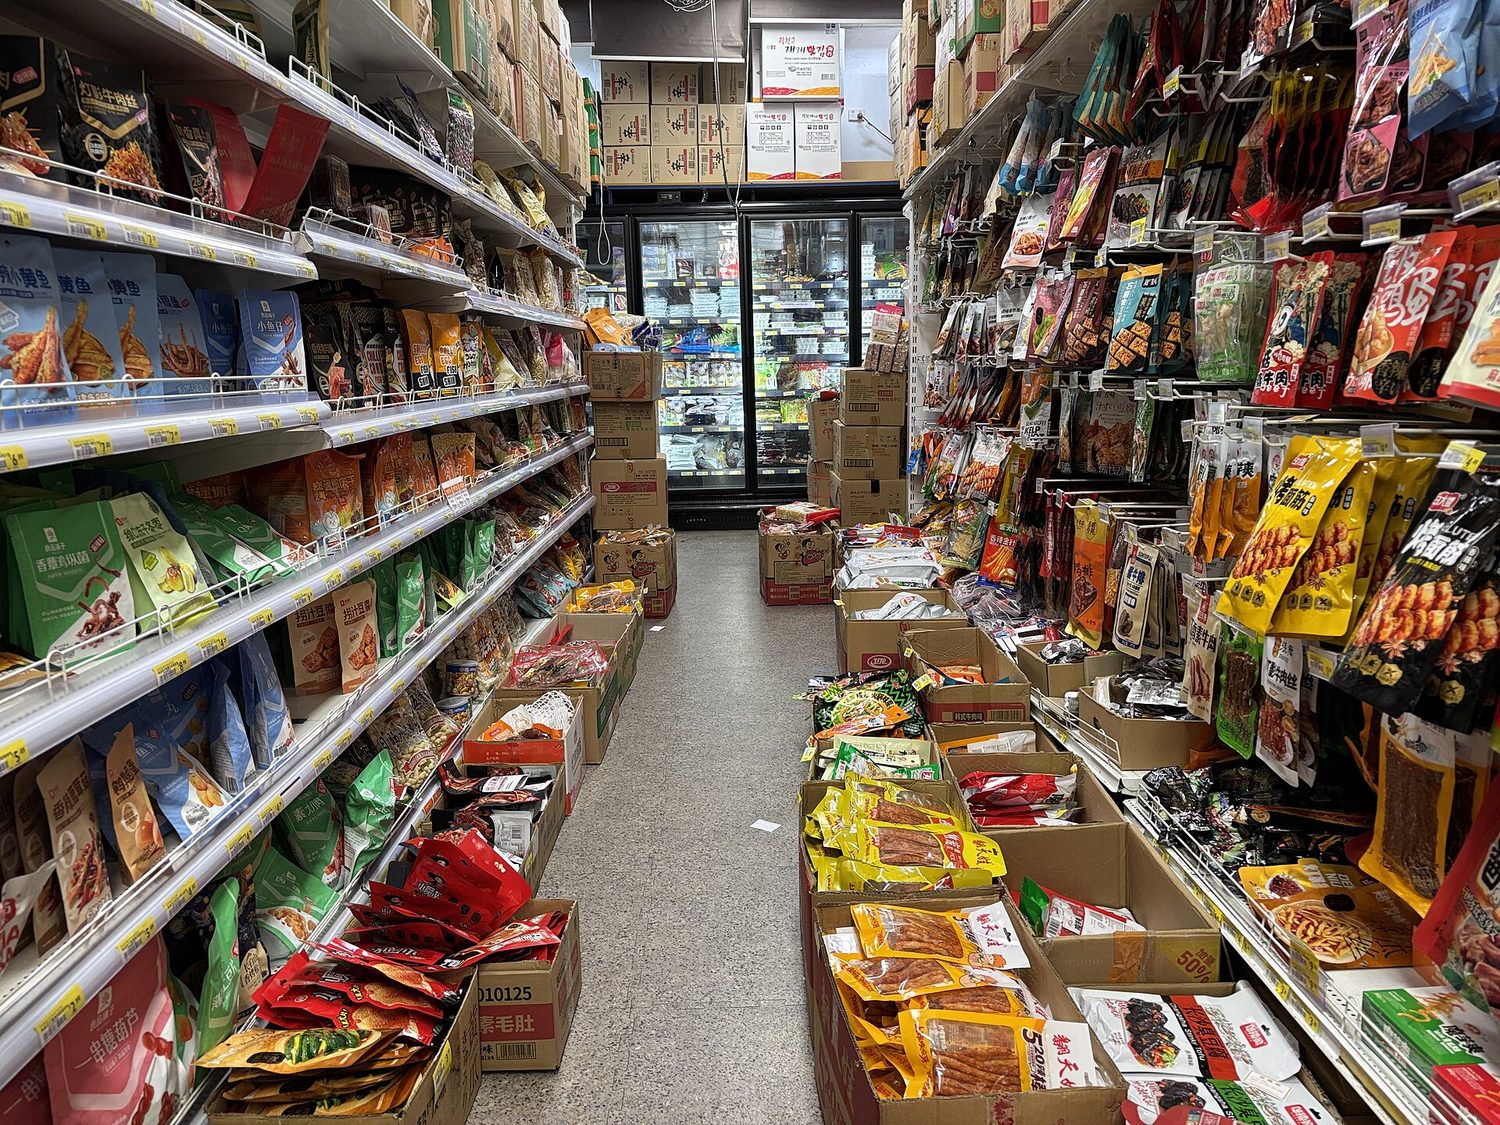
Inflation 通货膨胀 is a sustained rise in the average price level. It is measured with a price index 价格指数, most often the consumer price index (CPI) 消费者价格指数, built from a fixed market basket of goods a typical household buys:
$$CPI=\frac{\text{cost of basket this year}}{\text{cost of basket in base year}}\times100.$$
The inflation rate is the percent change in the index between two years. Deflation 通货紧缩 is a falling price level; disinflation is a slowing of inflation.
Read a series. In a fictional example, CPI values of 100, 110, 115 and 112 in four consecutive years imply inflation of 10%, 4.55% and -2.61%. Year 3 has disinflation: prices still rise, but more slowly. Year 4 has deflation: prices fall from year 3, yet remain 12% above the base year.
Substitution bias. If beef becomes dearer, households may buy more chicken. A fixed basket keeps the old quantities, so it can overstate the increase in the cost of maintaining living standards.
Worked example. If the CPI is $200$ this year and was $190$ last year, the inflation rate is $\dfrac{200-190}{190}\times100\%=5.3\%$. A basket that cost $\$190$ then costs $\$200$ – the same goods, more dollars.
Vocabulary
Train
| English |
|---|
| Inflation/ɪnˈfleɪʃn/ |
| price index/praɪs ˈɪndeks/ |
| consumer price index (CPI)/kənˈsuːmə praɪs ˈɪndeks/ |
| Deflation/diːˈfleɪʃn/ |
2.5
Costs of Inflation
Syllabus
| Enduring Understanding | Learning Objective | Essential Knowledge |
|---|---|---|
MEA-1 | MEA-1.H |
|
Source: College Board AP Course and Exam Description
Inflation redistributes and distorts:
- Unexpected inflation above the expected rate hurts lenders and helps borrowers on existing fixed nominal interest-rate loans: repayments buy less than expected. Unexpected deflation reverses this effect. Cash and incomes that do not adjust lose purchasing power when prices rise; indexed incomes may adjust.
- Menu costs and uncertainty discourage investment.
- Anticipated inflation can be allowed for in contracts and interest rates, reducing surprise redistribution; menu costs can still remain. This is why we separate nominal and real values.
2.6
Real v. Nominal GDP
Syllabus
| Enduring Understanding | Learning Objective | Essential Knowledge |
|---|---|---|
MEA-1 | MEA-1.I |
|
MEA-1.J |
|
Source: College Board AP Course and Exam Description
- Nominal GDP 名义GDP is valued at current prices, so it rises with both output and prices.
- Real GDP 实际GDP is valued at constant (base-year) prices, stripping out inflation, so it reflects true output. Compare real GDP across periods to measure output growth.
$$\text{Real GDP}=\frac{\text{Nominal GDP}}{\text{GDP deflator}}\times100,\qquad \text{GDP deflator}=\frac{\text{Nominal GDP}}{\text{Real GDP}}\times100.$$
Worked example. Nominal GDP is $\$22$ trillion and the GDP deflator is $110$. Real GDP is $\dfrac{22}{110}\times100=\$20$ trillion. The $2 trillion difference reflects different price bases, not growth. If last year's real GDP was $19 trillion, real growth is $(20-19)/19\times100\%=5.26\%$. Growth needs an earlier value.
Exam skill: be fluent converting nominal to real using a price index, and computing an inflation rate or a growth rate as a percent change.
Vocabulary
Train
| English |
|---|
| Nominal GDP/ˈnɒmɪnl ˌdʒiː diː ˈpiː/ |
| Real GDP/rɪəl ˌdʒiː diː ˈpiː/ |
2.7
Business Cycles
Syllabus
| Enduring Understanding | Learning Objective | Essential Knowledge |
|---|---|---|
MEA-2 | MEA-2.A |
|
Source: College Board AP Course and Exam Description
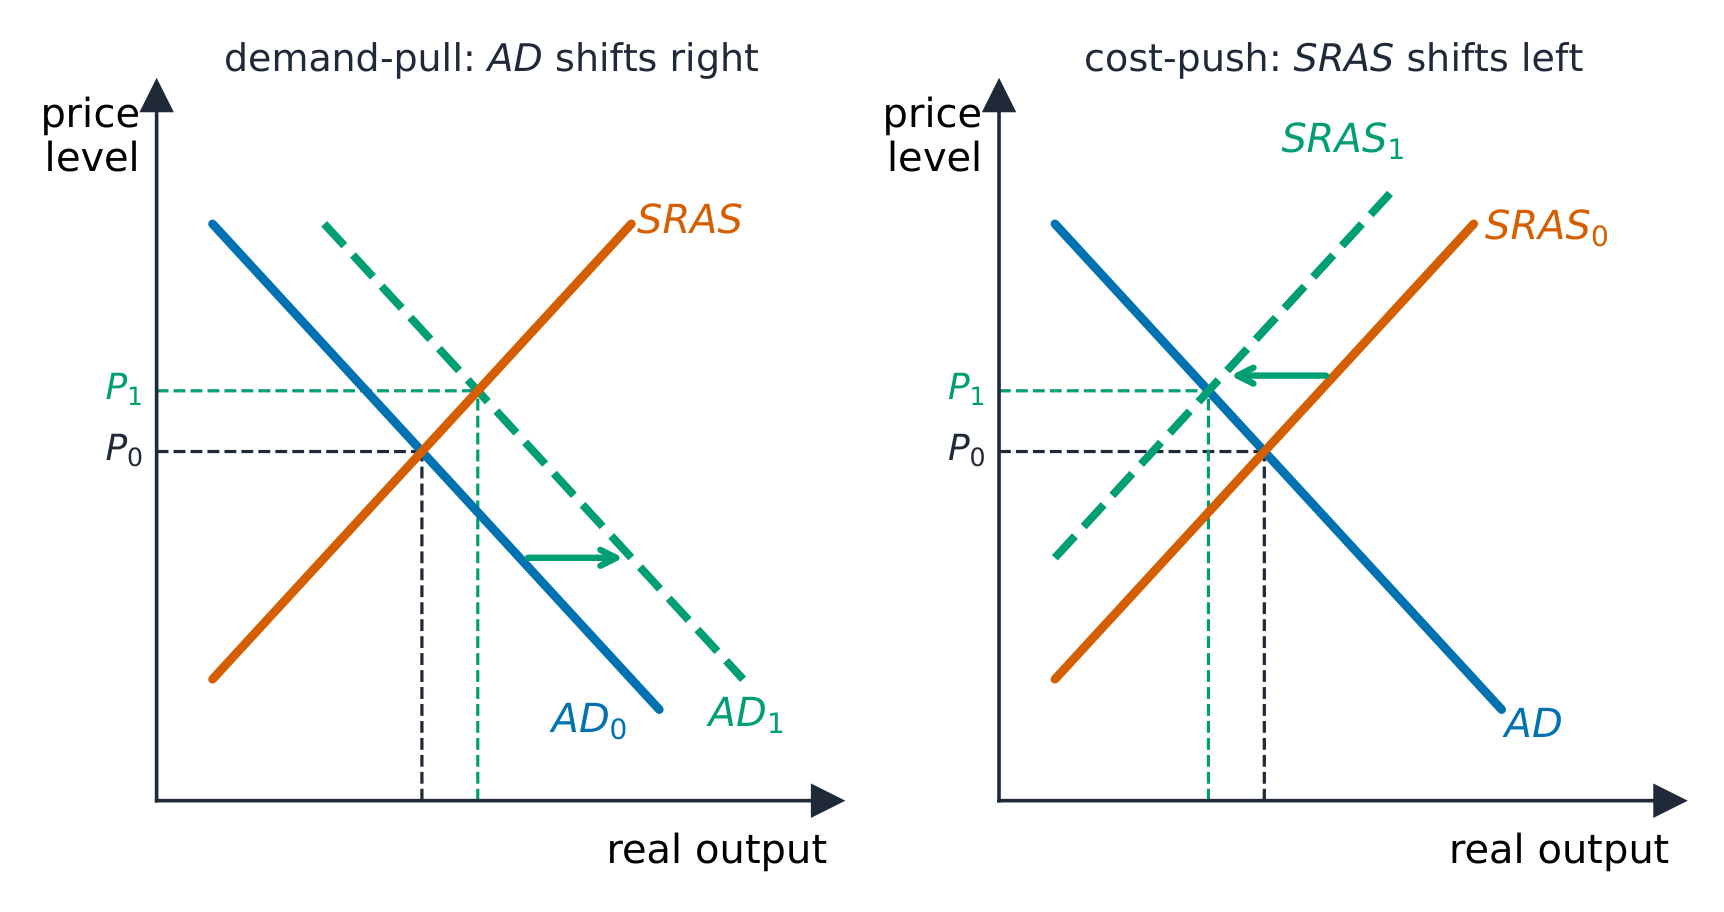
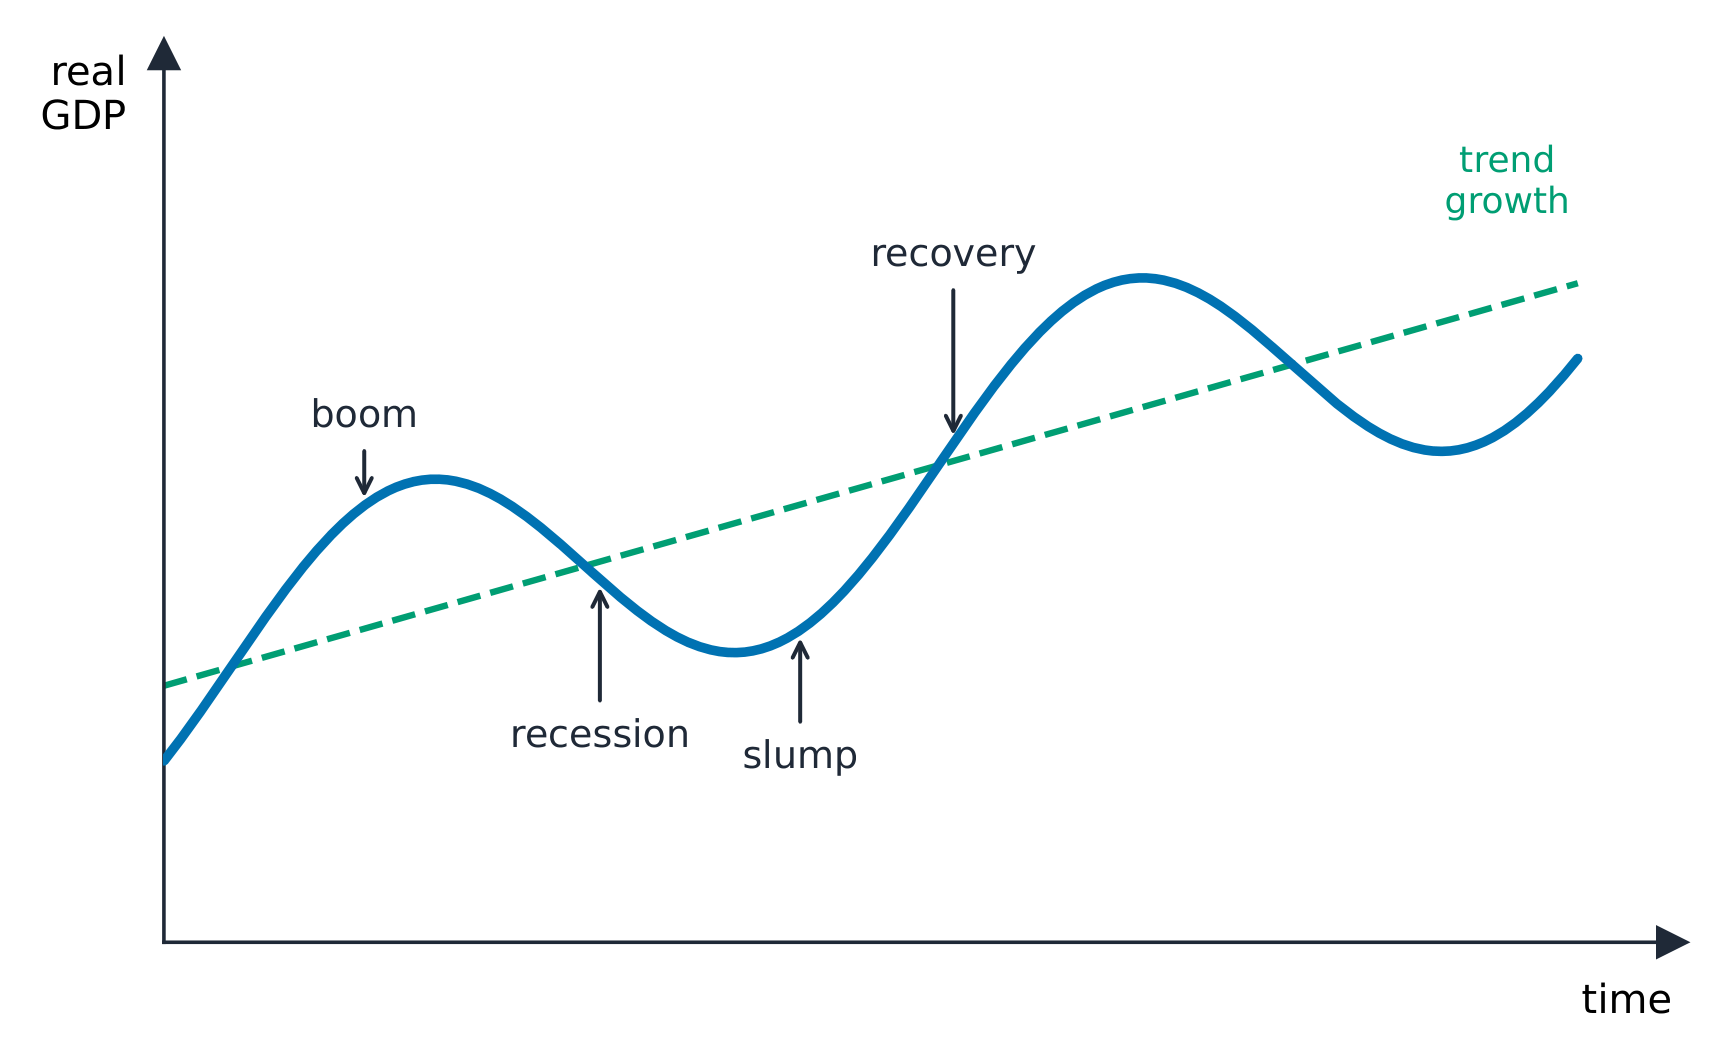
The business cycle 经济周期 describes real GDP fluctuating around its long-run trend. Expansion 扩张 (rising output) ends at a peak 顶峰; contraction/recession 衰退 (falling output) ends at a trough 谷底. These are two phases and two turning points. Recessions raise cyclical unemployment, but inflation need not fall: an adverse supply shock can reduce output while raising prices.
Output-gap example. Potential output is real GDP at full employment. If actual real GDP is $1,140 billion and potential output $1,200 billion, the gap is minus $60 billion, or $-5\%$ of potential output: a recessionary gap. Positive gaps indicate actual output above potential, not automatically a higher long-run growth rate.
Vocabulary
Train
| English |
|---|
| business cycle/ˈbɪznəs ˈsaɪkl/ |
| expansion/ekˈspænʃn/ |
| peak/piːk/ |
| contraction/recession/kənˈtrækʃn rɪˈseʃn/ |
| trough/trɒf/ |
2.7
Exam tips
Show the formula and denominator before substituting. Distinguish final output from intermediate sales, unemployment from non-participation, and index levels from inflation rates. For growth, compare real values across years; for living standards, divide by population and state the limitations.
Interactive lessons on this topic
Work through it step by step, with instant-check exercises.