| Enduring Understanding | Learning Objective | Essential Knowledge |
|---|---|---|
MOD-1 | MOD-1.A |
|
Basic Economic Concepts
AP Macroeconomics · Topic 1
 7:30
7:30
Basic Economic Concepts
Here is a result that feels wrong the first time you meet it. Suppose you are faster than your friend at writing code and faster at writing documentation. You…
English narration · English + 中文 subtitles burned in
1.1
Scarcity
Syllabus
Source: College Board AP Course and Exam Description
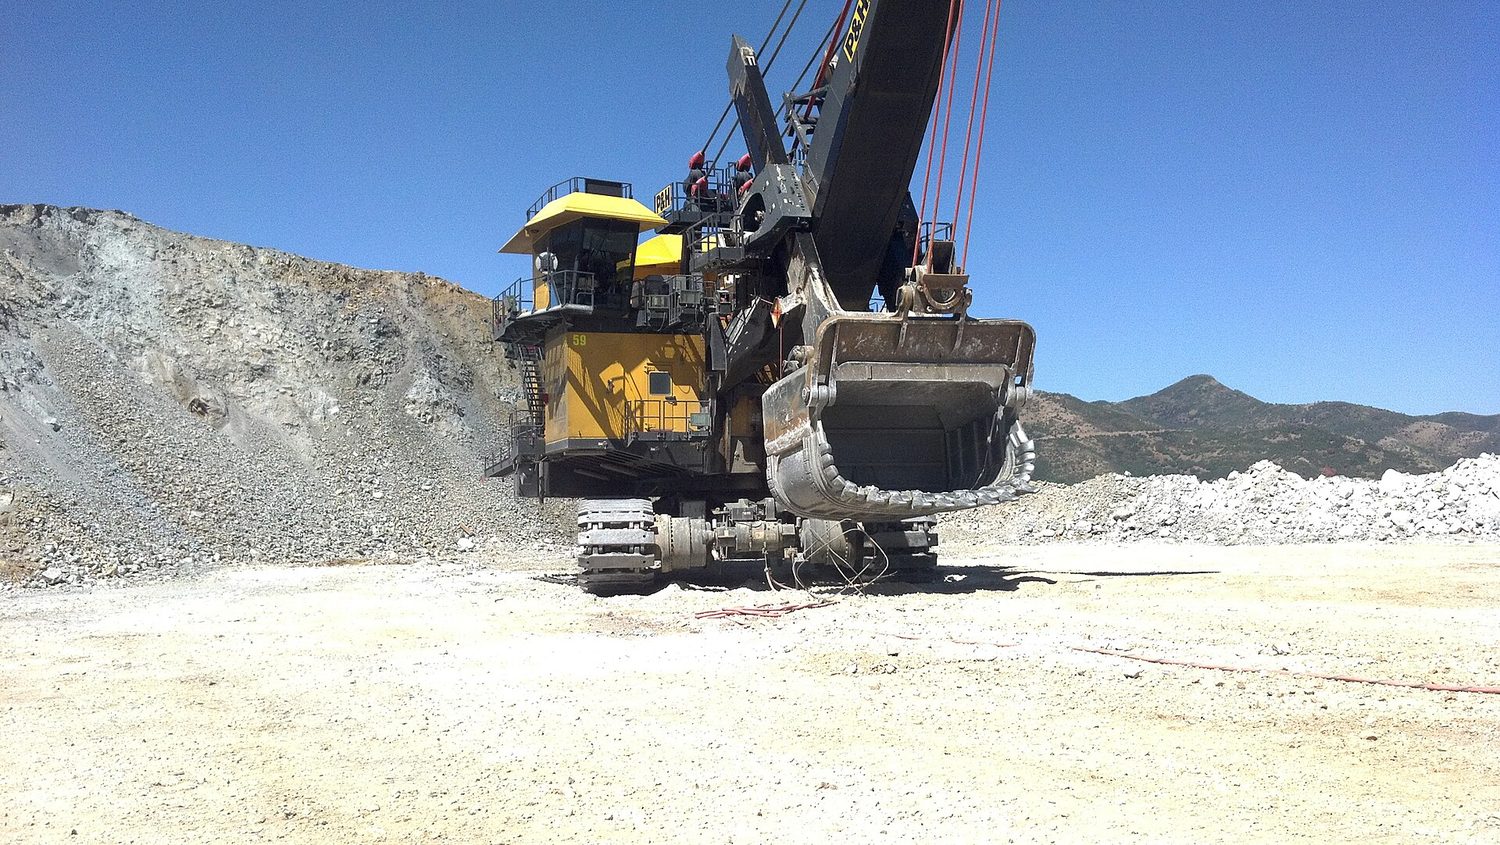
Economics 经济学 begins with scarcity 稀缺性: people's wants are unlimited, but the resources 资源 to satisfy them are limited. The resources – the factors of production 生产要素 – are land, labor 劳动, capital 资本, and entrepreneurship 企业家才能. Scarcity forces every society to choose what, how, and for whom to produce, and it makes trade-offs 权衡 unavoidable.
Vocabulary
Train
| English |
|---|
| Economics/ˌiːkəˈnɒmɪks/ |
| scarcity/ˈskeəsɪti/ |
| resources/rɪˈzɔːsɪz/ |
| factors of production/ˈfæktəz ɒv prəˈdʌkʃn/ |
| labor/ˈleɪbə/ |
| capital/ˈkæpɪtl/ |
| entrepreneurship/ˌɒntrɪprəˈnjʊəʃɪp/ |
| trade-offs/treɪd ɒfs/ |
1.2
Opportunity Cost and the Production Possibilities Curve (PPC)
Syllabus
| Enduring Understanding | Learning Objective | Essential Knowledge |
|---|---|---|
MOD-1 | MOD-1.B |
|
Source: College Board AP Course and Exam Description
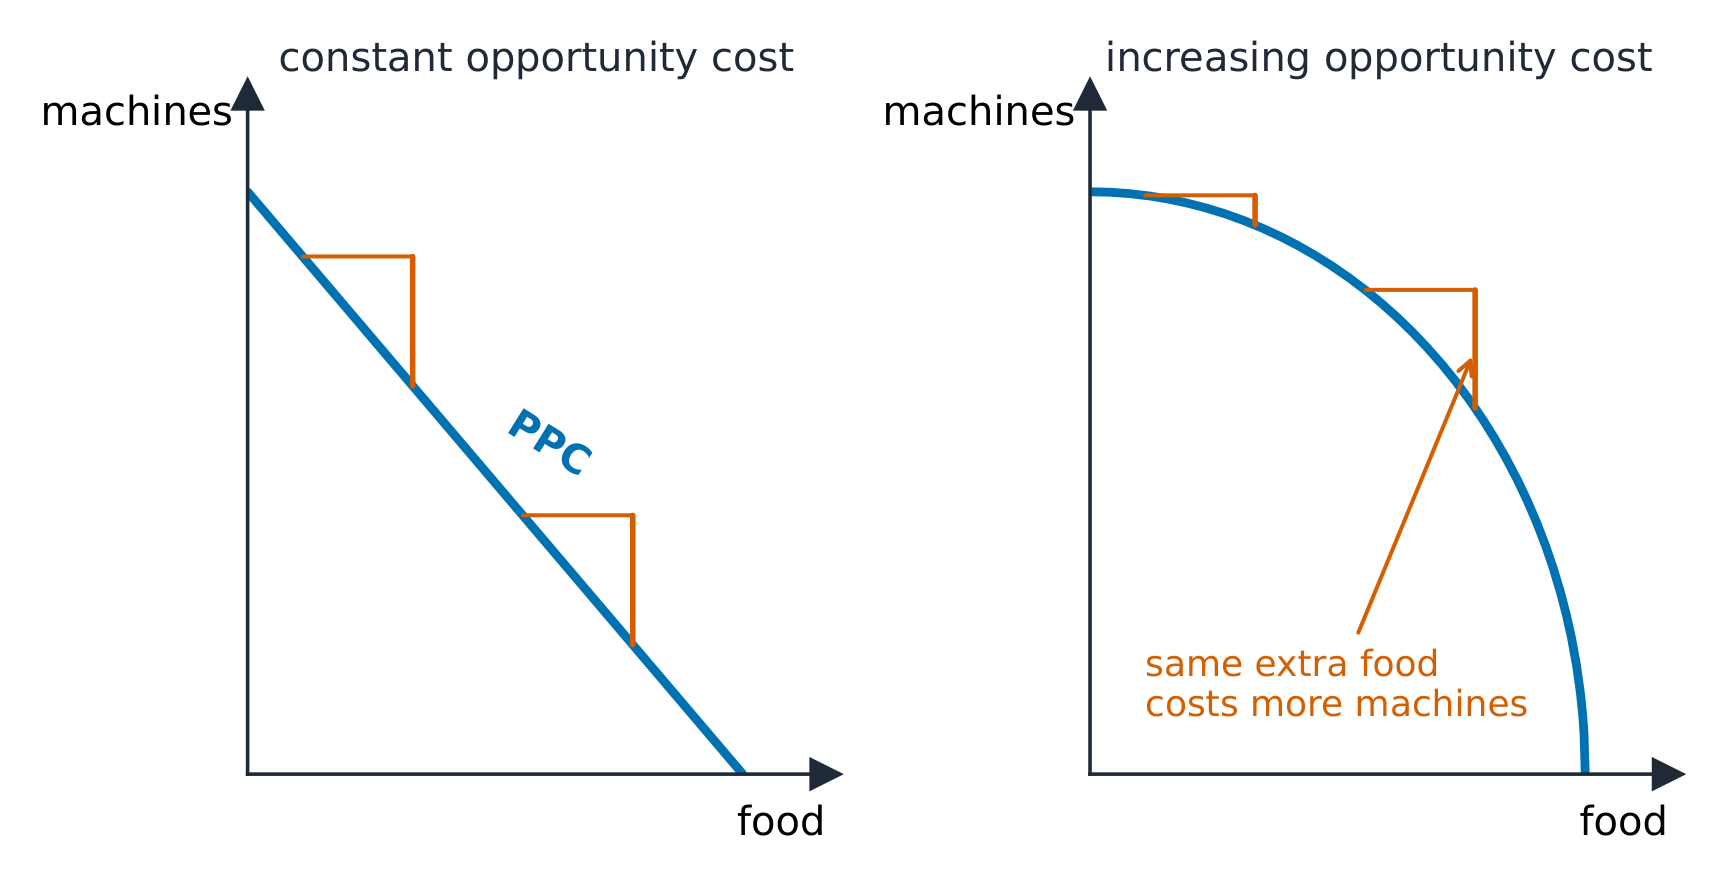
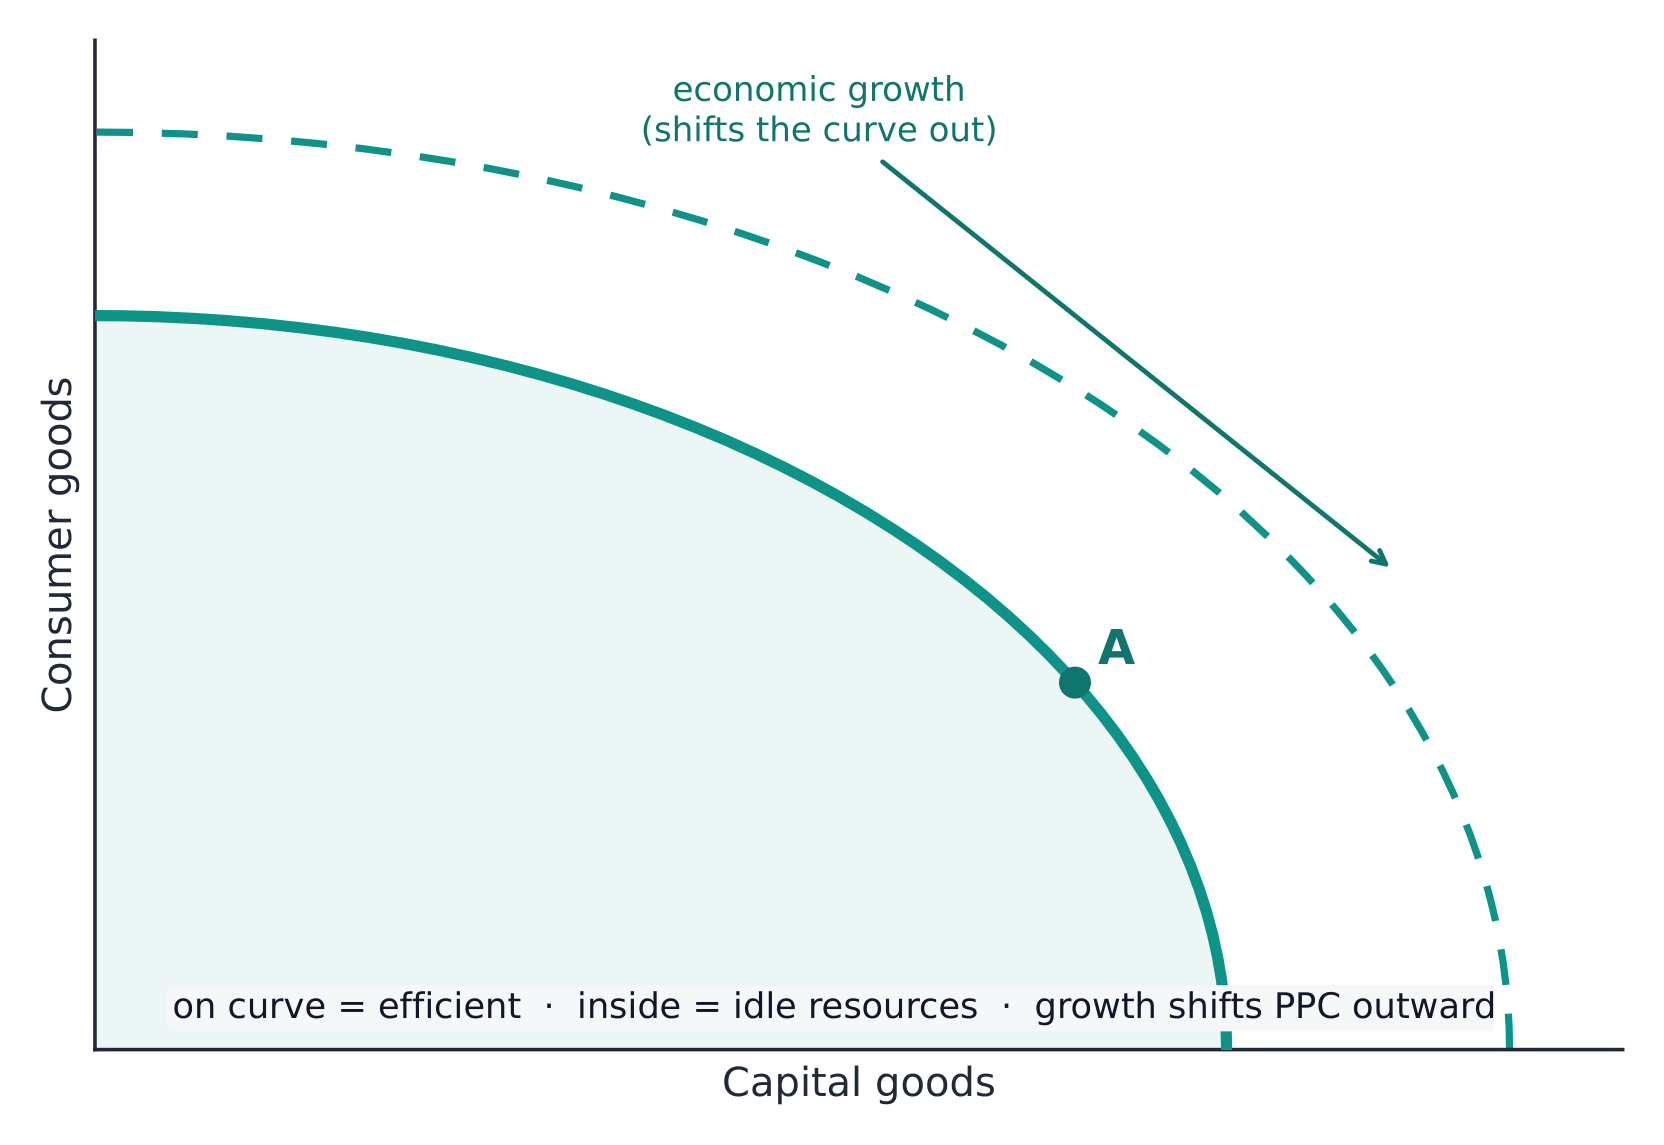
Every choice has an opportunity cost 机会成本 – the value of the next-best alternative given up. The production possibilities curve (PPC) 生产可能性曲线 shows the maximum combinations of two goods an economy can make when resources are fully and efficiently used.
- Points on the curve are efficient; inside, inefficient (unemployed resources); outside, unattainable.
- The downward slope shows opportunity cost; a bowed-out curve shows increasing opportunity cost.
- More resources or better technology cause economic growth 经济增长, shifting the PPC outward.
Explore
Explore the production possibilities curve
Move along the curve — making more capital goods means giving up consumer goods. That lost output is the opportunity cost, and the bowed shape shows it rising with each extra unit.
Vocabulary
Train
| English |
|---|
| opportunity cost/ɒpəˈtjuːnɪti kɒst/ |
| production possibilities curve (PPC)/prəˈdʌkʃn ˌpɒsəˈbɪlɪtiz kɜːv/ |
| economic growth/ˌiːkəˈnɒmɪk ɡrəʊθ/ |
1.3
Comparative Advantage and Gains from Trade
Syllabus
| Enduring Understanding | Learning Objective | Essential Knowledge |
|---|---|---|
MKT-1 | MKT-1.A |
|
MKT-1.B |
|
Source: College Board AP Course and Exam Description
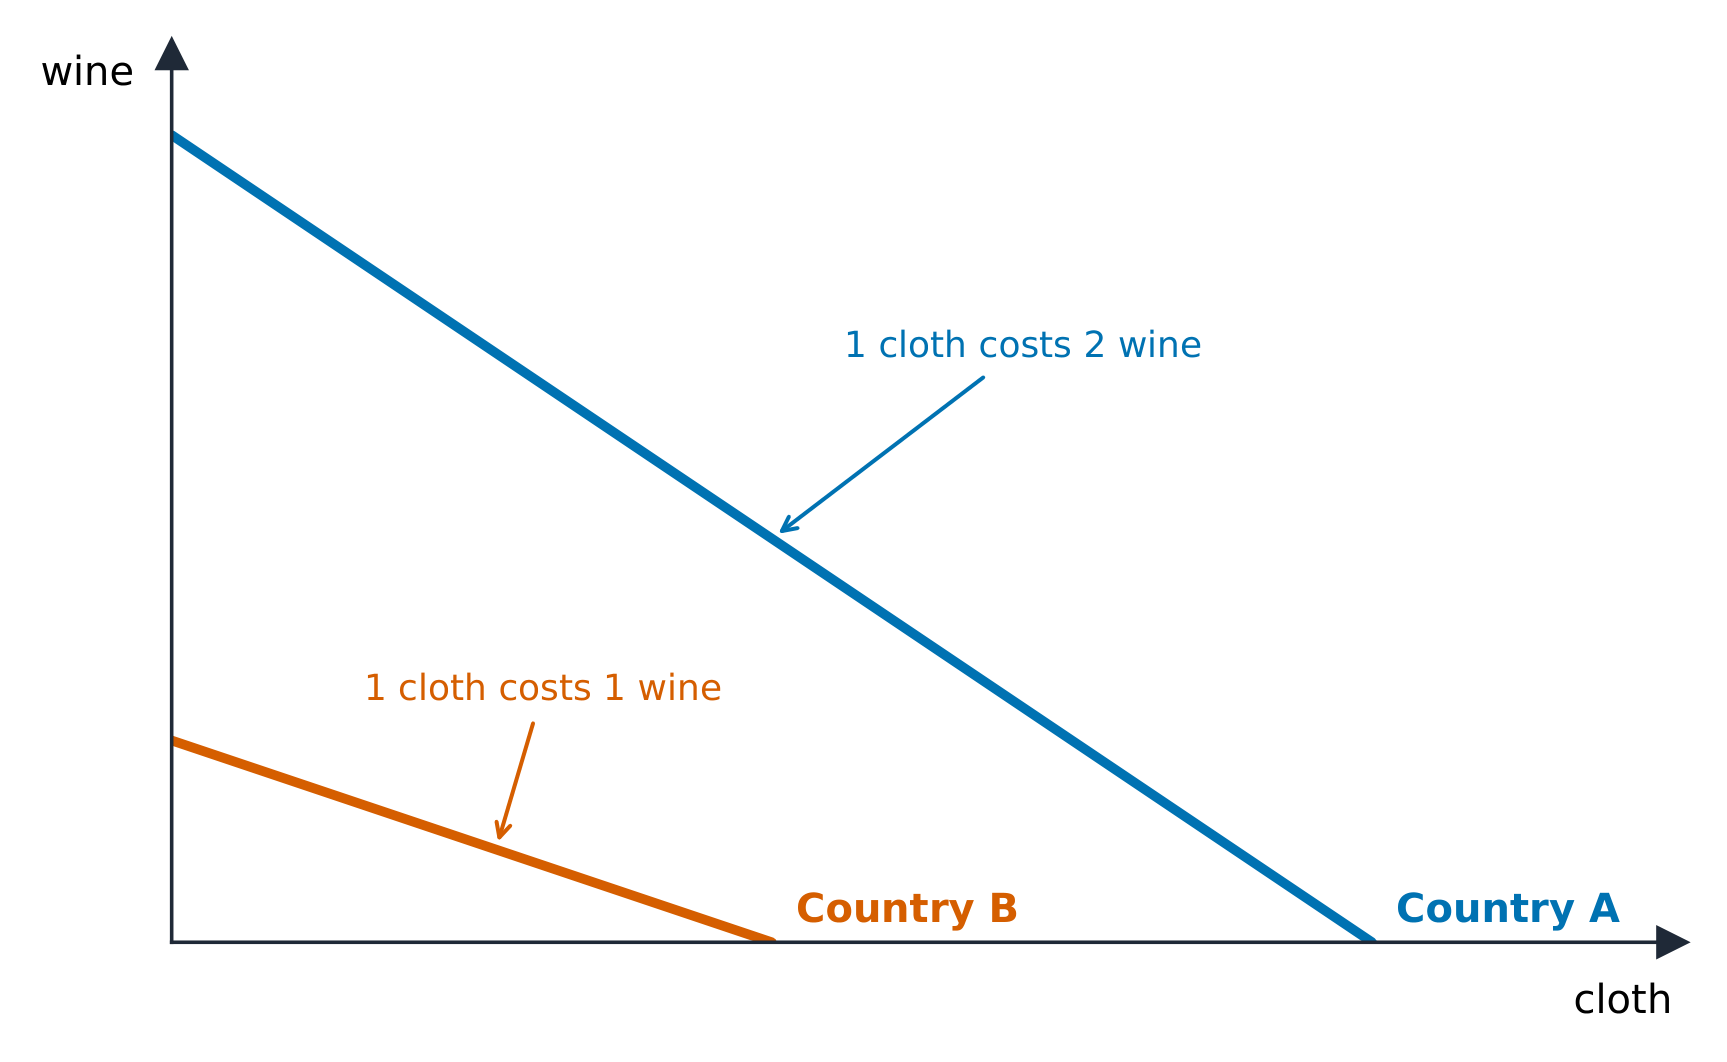
A producer has an absolute advantage 绝对优势 in a good if it can make more of it. It has a comparative advantage 比较优势 if it has the lower opportunity cost. Nations should specialize in their comparative-advantage goods and trade – both gain if the terms of trade 贸易条件 lie between the two opportunity costs. Trade lets a country consume beyond its own PPC.
Worked example. Country A can make $10$ wheat or $5$ cloth per day; Country B can make $8$ wheat or $8$ cloth. For A, one cloth costs $\tfrac{10}{5}=2$ wheat; for B it costs $\tfrac{8}{8}=1$ wheat. B's opportunity cost of cloth is lower, so B specializes in cloth. Checking wheat: A gives up $0.5$ cloth per wheat and B gives up $1$, so A specializes in wheat. Trading at any rate between the two costs, both consume beyond their own PPC.
Explore
See the gains from specialization and trade
A country should specialize where its opportunity cost is lowest, then trade for the rest. Because the terms of trade sit between the two countries' costs, each can consume beyond its own production frontier.
Vocabulary
Train
| English |
|---|
| absolute advantage/ˈæbsəluːt ədˈvæntɪdʒ/ |
| comparative advantage/kəmˈpærətɪv ədˈvæntɪdʒ/ |
| terms of trade/tɜːmz ɒv treɪd/ |
1.4
Demand
Syllabus
| Enduring Understanding | Learning Objective | Essential Knowledge |
|---|---|---|
MKT-2 | MKT-2.A |
|
MKT-2.B |
|
Source: College Board AP Course and Exam Description
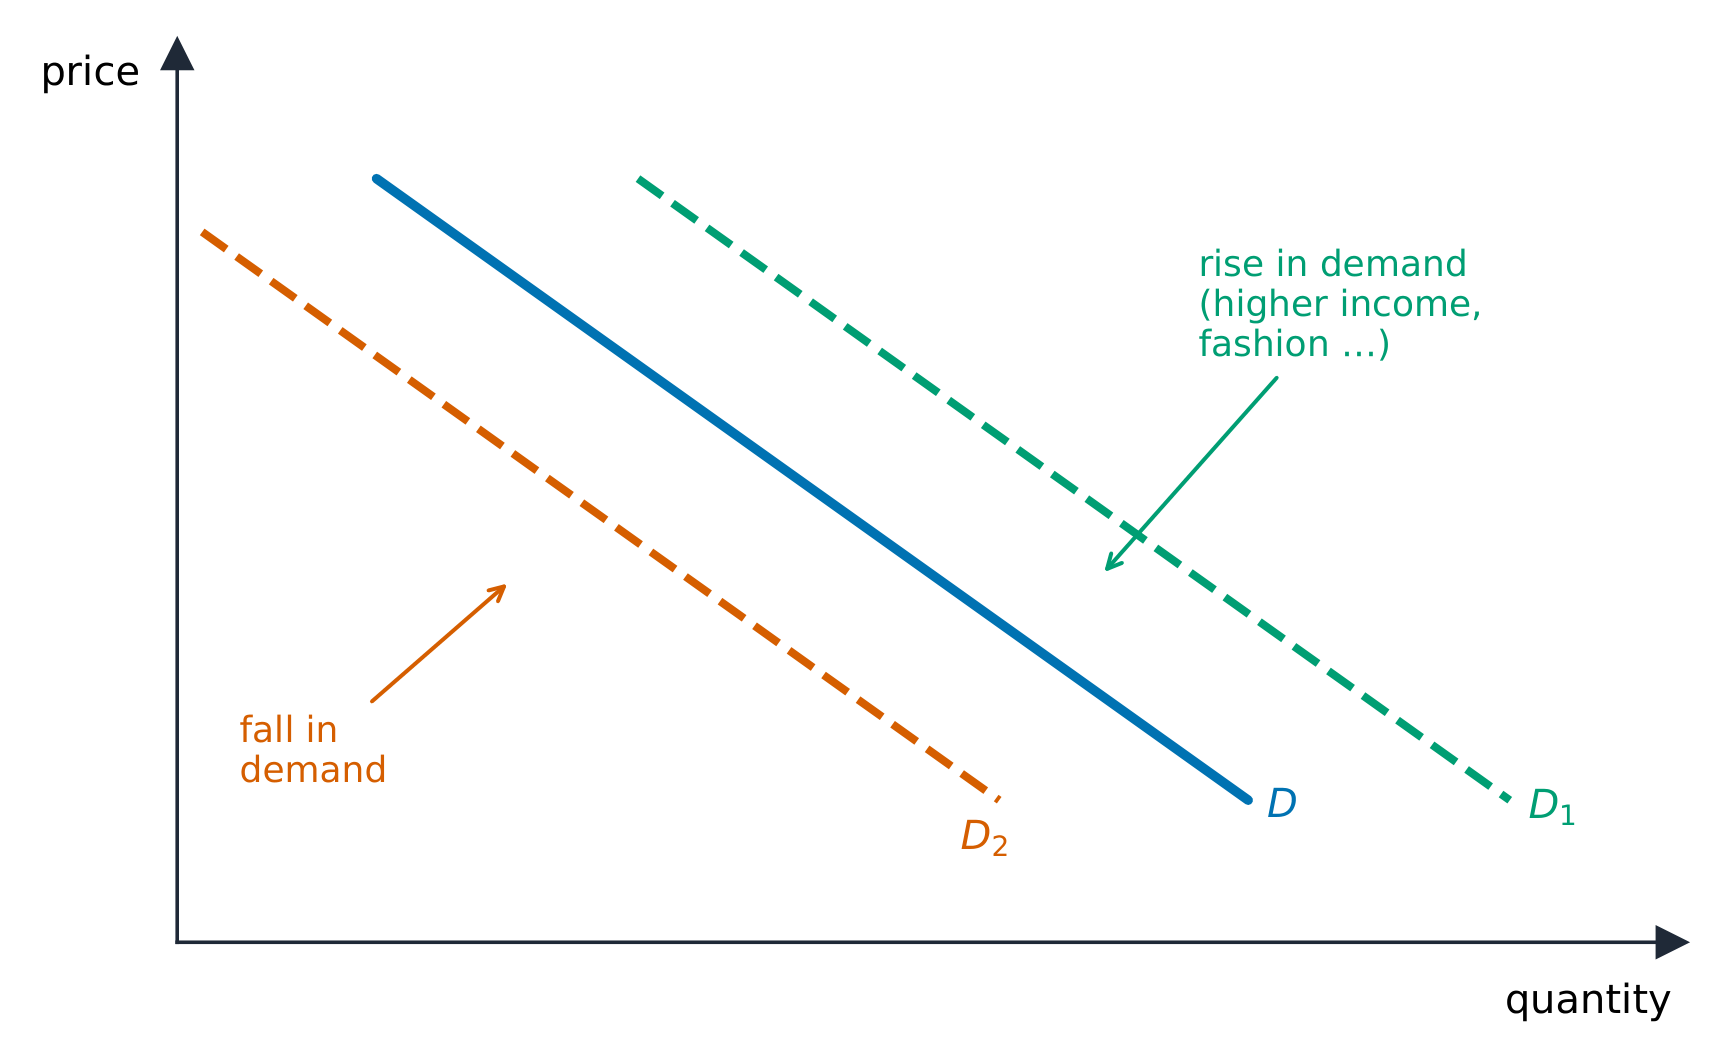
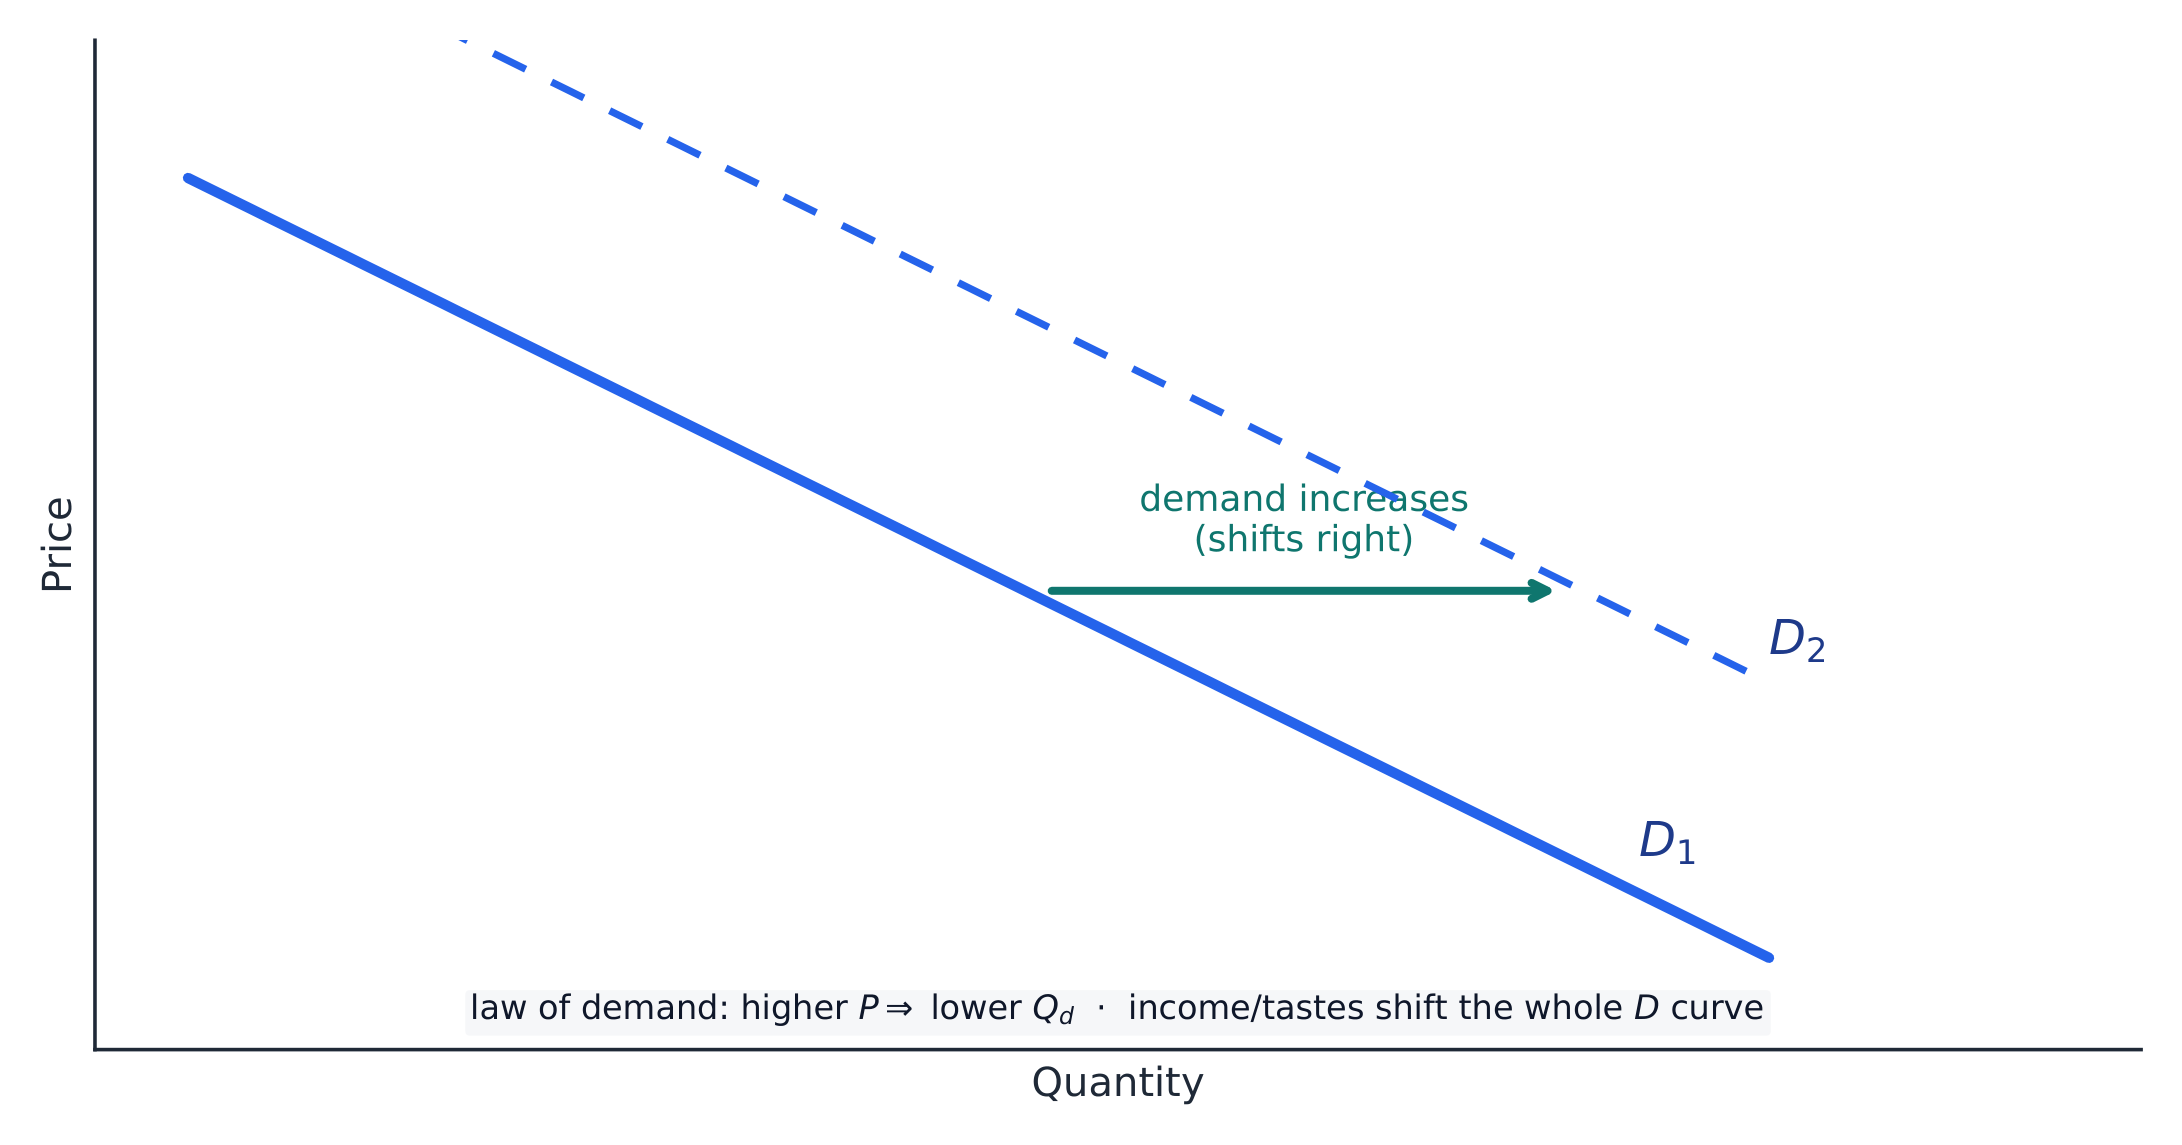
Demand 需求 relates price to the quantity buyers will buy. The law of demand 需求定律 makes the curve slope downward. A change in the good's own price is a movement along the curve; the determinants (income, tastes, prices of substitutes 替代品 and complements 互补品, number of buyers, expectations) shift the whole curve.
Explore
Explore demand — move along vs shift the curve
A change in the own price moves you along a fixed curve (a change in quantity demanded); a determinant like income or tastes shifts the whole curve ($D_1 \to D_2$) — a change in demand.
Vocabulary
Train
| English |
|---|
| Demand/dɪˈmænd/ |
| law of demand/lɔː ɒv dɪˈmænd/ |
| substitutes/ˈsʌbstɪtjuːts/ |
| complements/ˈkɒmplɪmənts/ |
1.5
Supply
Syllabus
| Enduring Understanding | Learning Objective | Essential Knowledge |
|---|---|---|
MKT-2 | MKT-2.C |
|
MKT-2.D |
|
Source: College Board AP Course and Exam Description
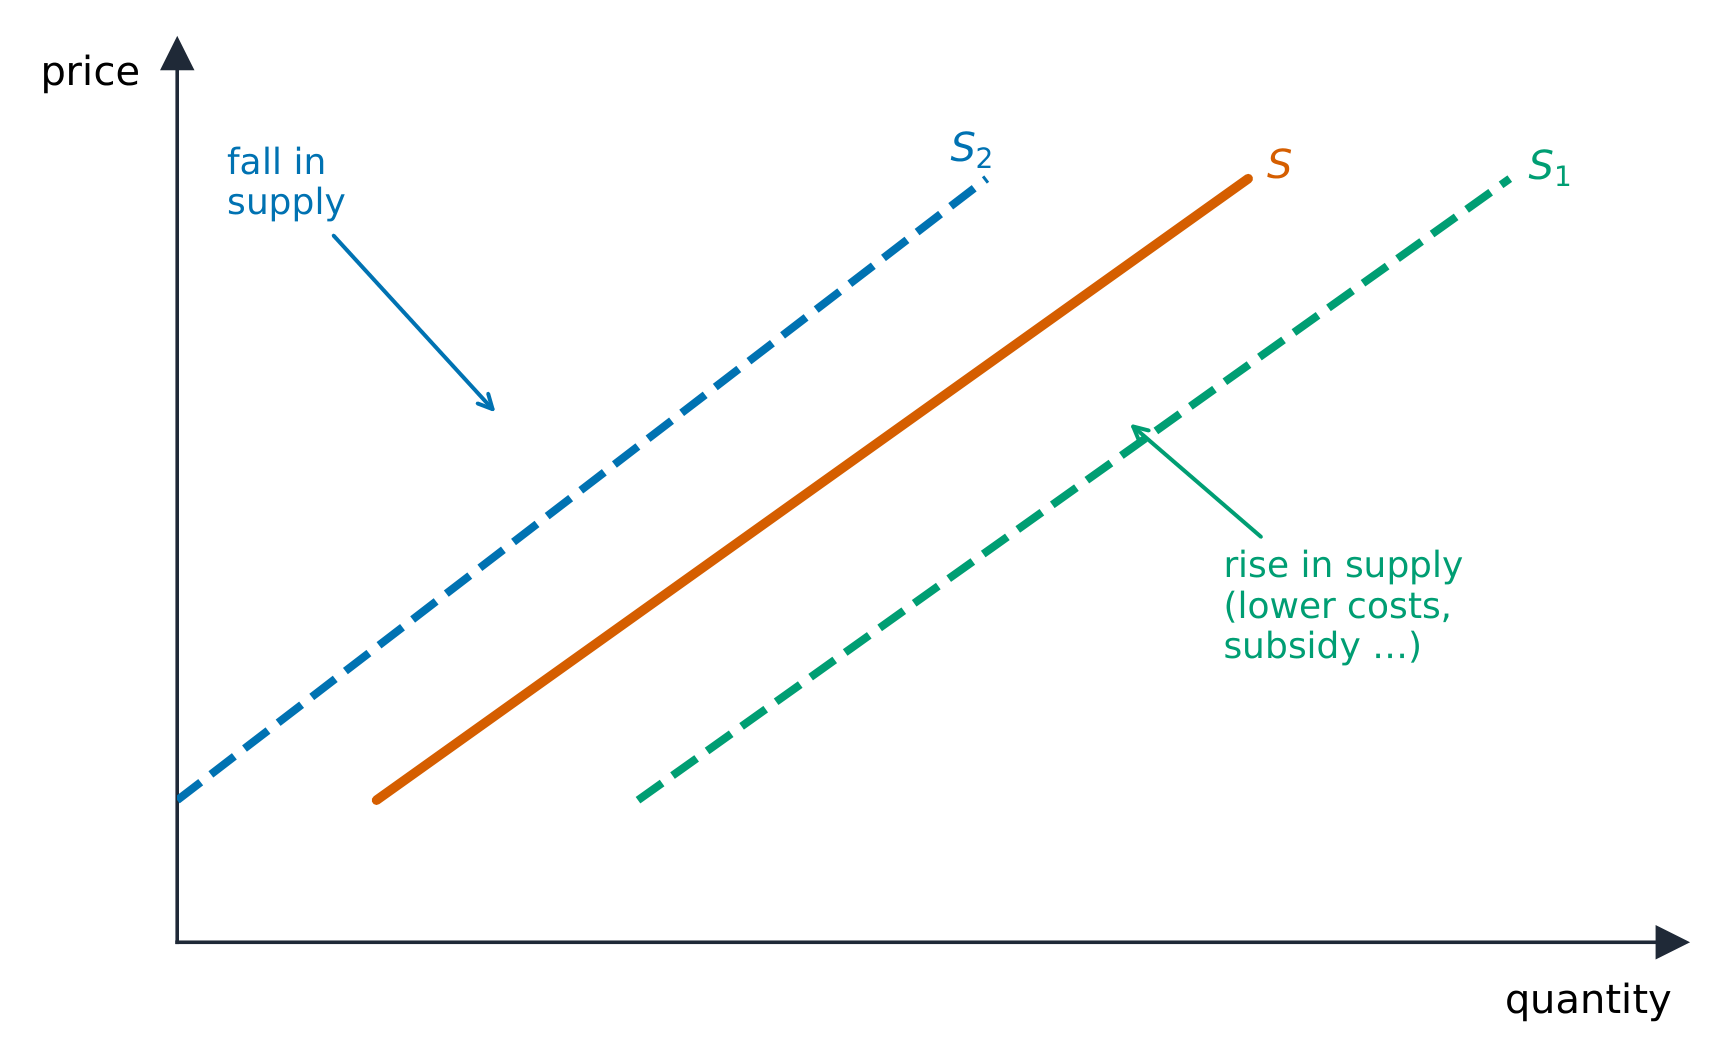
Supply 供给 relates price to the quantity sellers will offer; the law of supply 供给定律 makes it slope upward. Its determinants – input prices, technology, taxes and subsidies 补贴, number of sellers, expectations – shift the curve, while the good's own price moves along it.
Explore
Explore what moves the supply curve
Supply slopes up: a higher price makes selling more worthwhile. A change in costs, technology or the number of sellers shifts the whole curve — not a move along it. Drag the supply line and watch price and quantity respond.
Vocabulary
Train
| English |
|---|
| Supply/səˈplaɪ/ |
| law of supply/lɔː ɒv səˈplaɪ/ |
| subsidies/ˈsʌbsɪdiz/ |
1.6
Market Equilibrium, Disequilibrium, and Changes in Equilibrium

Syllabus
| Enduring Understanding | Learning Objective | Essential Knowledge |
|---|---|---|
MKT-2 | MKT-2.E |
|
MKT-2.F |
| |
MKT-2.G |
|
Source: College Board AP Course and Exam Description
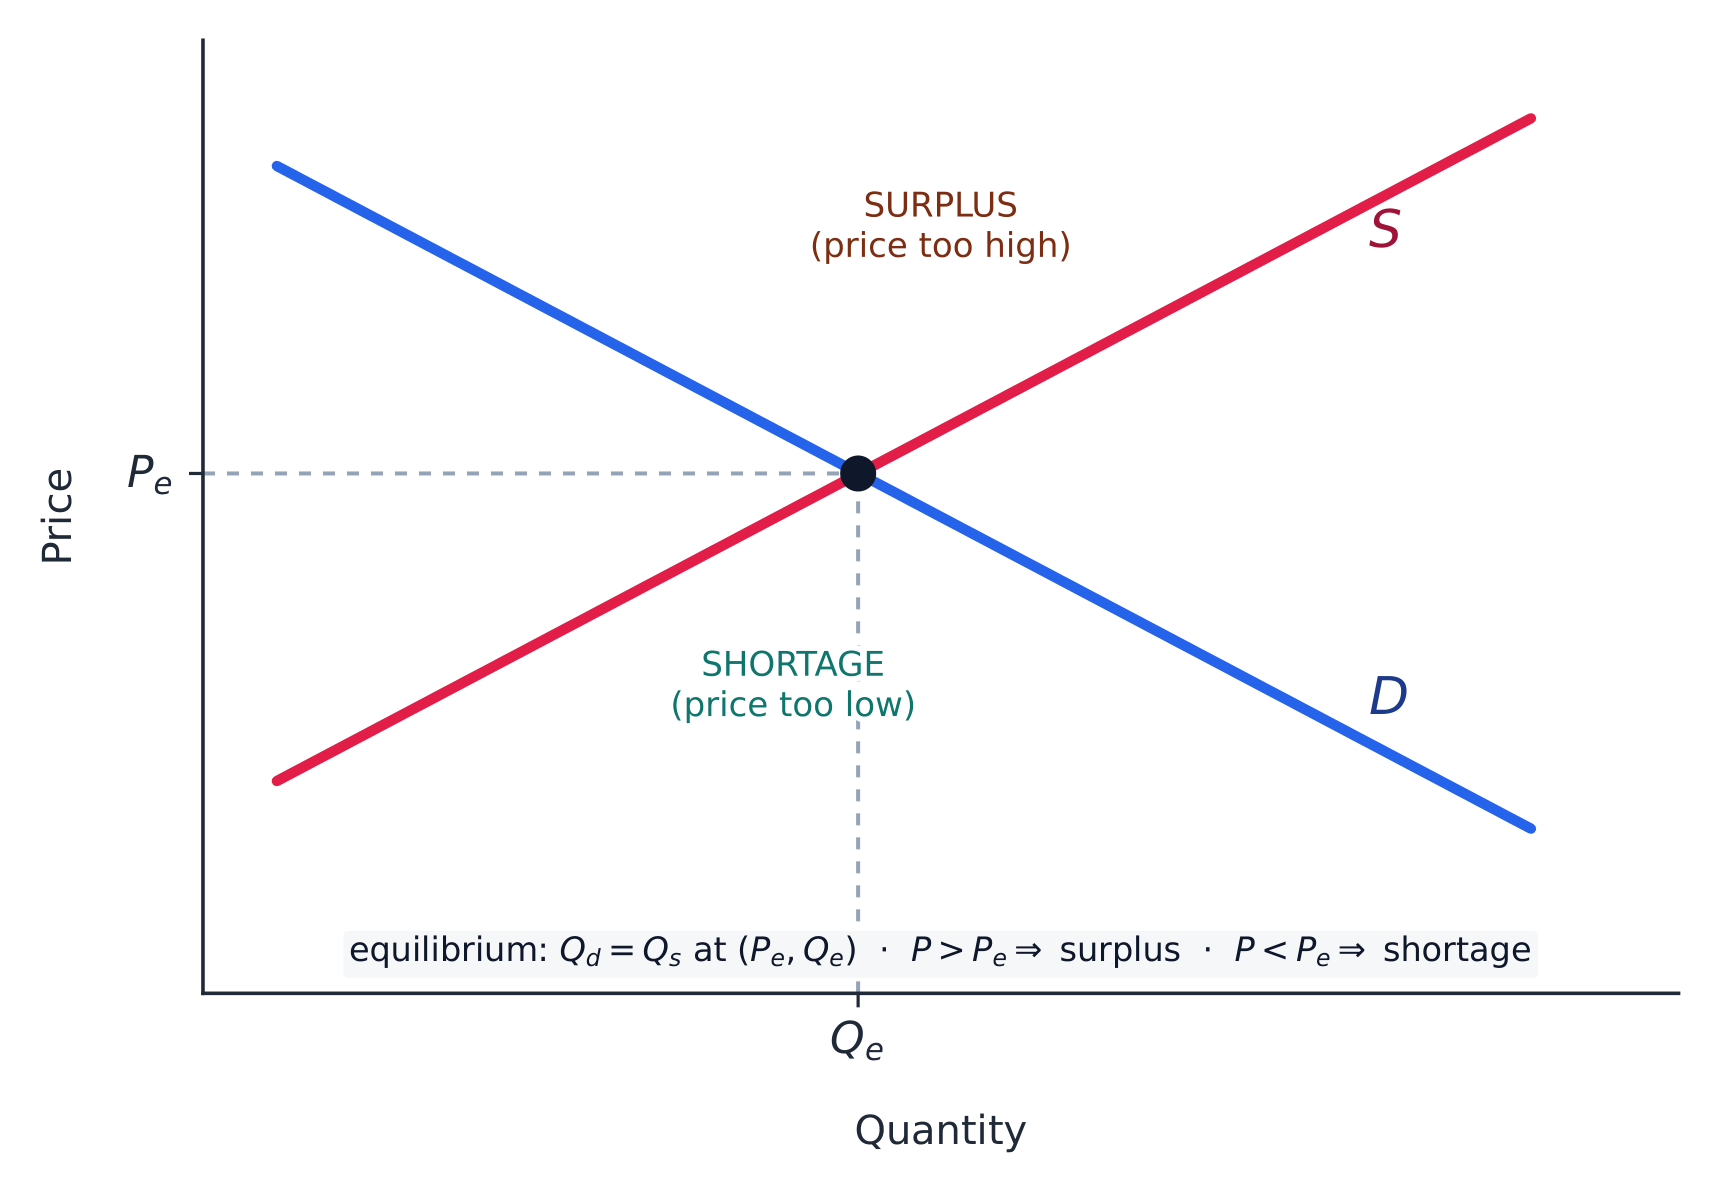
Equilibrium 均衡 is where supply meets demand, clearing the market. Above the equilibrium price a surplus 过剩 pushes price down; below it a shortage 短缺 pushes price up. When a determinant shifts one curve, price and quantity move predictably; when both shift, one of them is indeterminate.
Worked example. A new technology lowers producers' costs, shifting supply right. Along the unchanged demand curve, the equilibrium price falls and the equilibrium quantity rises. If instead a rise in incomes shifts demand right at the same time, quantity clearly rises but the effect on price depends on which shift is larger – the "both shift" indeterminate case.
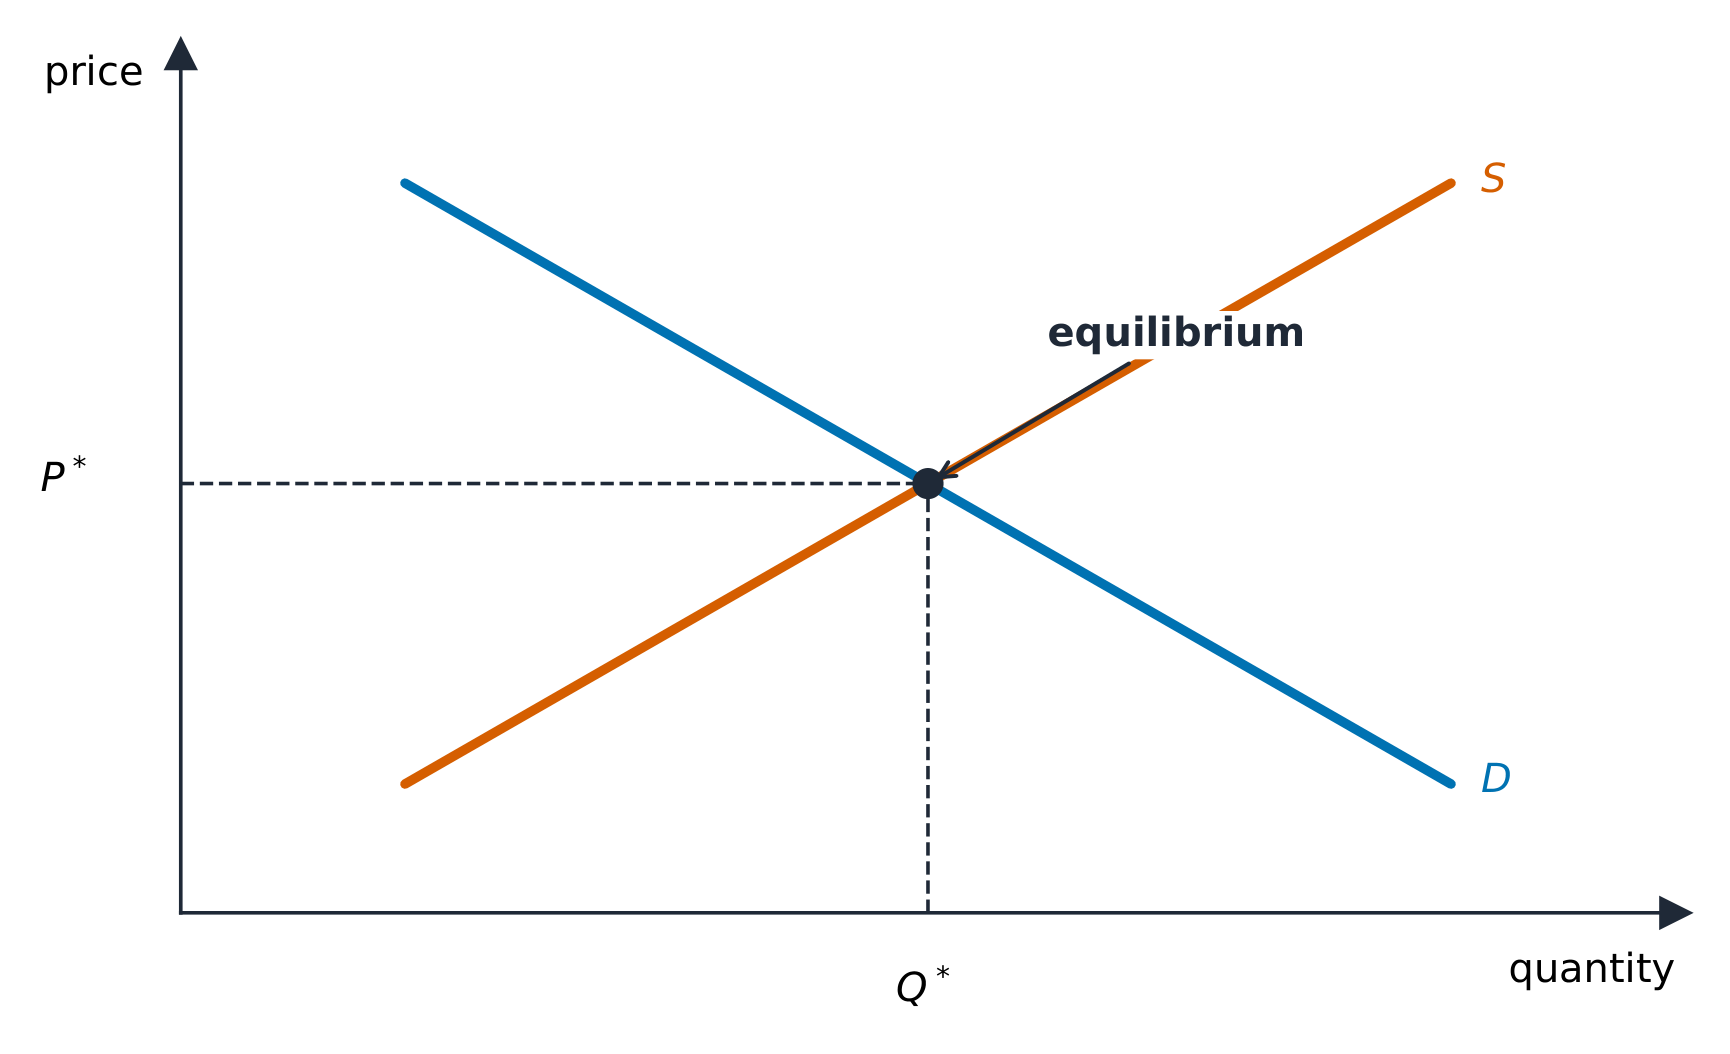
Exam skill: macro builds on these micro tools – you must draw and shift supply-and-demand and PPC graphs correctly, because the same shift logic drives the aggregate (whole-economy) models later in the course.
Explore
Explore market equilibrium, surplus and shortage
The market clears where supply meets demand. Shift a curve and watch the crossing move — a rightward demand shift raises both price and quantity; away from equilibrium a surplus or shortage pushes the price back.
Vocabulary
Train
| English |
|---|
| Equilibrium/ˌiːkwɪˈlɪbrɪəm/ |
| surplus/ˈsɜːpləs/ |
| shortage/ˈʃɔːtɪdʒ/ |
1.6
Exam tips
- Opportunity cost is what you give up — read it off a PPC as the slope; a bowed-out PPC shows increasing opportunity cost.
- Comparative advantage (lower opportunity cost), not absolute advantage, decides who should specialise and trade.
- Points inside the PPC are inefficient, outside unattainable; more resources/technology shift it out (growth).
- Distinguish a movement along a demand/supply curve (own price) from a shift (a determinant).
- These micro tools drive the aggregate models later — draw and shift the correct curve in the correct direction.
Interactive lessons on this topic
Work through it step by step, with instant-check exercises.