Skip to content · ⁨Перейти к содержанию⁩

Inference for Quantitative Data: Means · ⁨Статистический вывод для количественных данных: средние значения⁩

AP Statistics · Topic 7 · ⁨Тема 7⁩

Video lesson for this topic · ⁨Видеоурок по этой теме⁩ Open the video page · ⁨Открыть страницу видео⁩
7:38

Статистический вывод для количественных данных: средние значения

Вы уже знаете суть статистического вывода. Возьмите выборку, найдите её среднее значение, а затем делайте это снова и снова. Даже если распределение генеральной совокупности несимметрично, эти выборочные средние…

English narration · English + 中文 subtitles burned in · ⁨Английское озвучивание · Английский + китайские субтитры (встроенные)⁩

7.1

Should I Worry About Error? · ⁨Стоит ли беспокоиться об ошибке?⁩

Syllabus · ⁨Программа⁩
English

Enduring Understanding (VAR-1): Given that variation may be random or not, conclusions are uncertain.

Learning Objective VAR-1.I: Identify questions suggested by probabilities of errors in statistical inference. [Skill 1.A]

  • VAR-1.I.1 Random variation may result in errors in statistical inference.
Русский

Вечная идея (VAR-1): Поскольку вариация может быть случайной или нет, выводы остаются неопределенными.

Цель обучения VAR-1.I: Определять вопросы, возникающие из-за вероятности ошибок в статистических выводах. [Навык 1.A]

  • VAR-1.I.1 Случайная вариативность может приводить к ошибкам в статистических выводах.
Source: College Board AP Course and Exam Description · ⁨Источник: Описание курса и экзамена College Board AP⁩

English
Type I and Type II errors

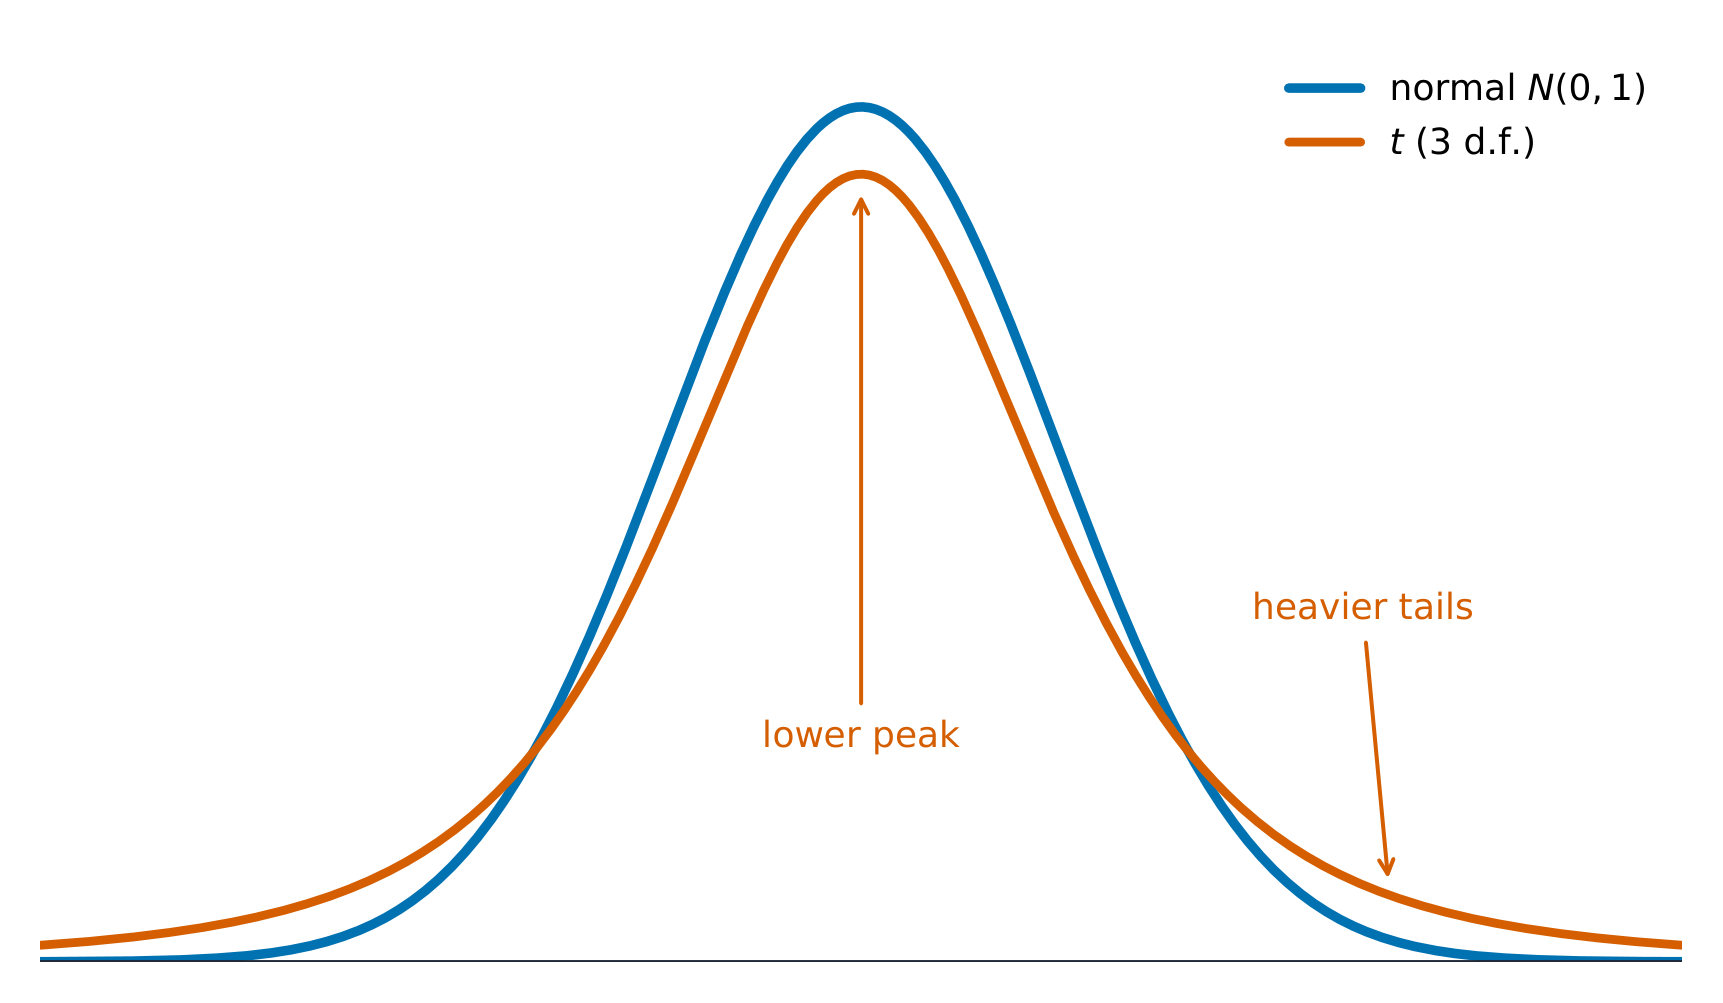
Inference for a mean works like inference for a proportion, with one change: we rarely know the population standard deviation $\sigma$, so we estimate it with the sample $s$. That extra uncertainty means we use the $t$-distribution instead of the normal – a distribution 分布 that is bell-shaped but with heavier tails, and it depends on the degrees of freedom 自由度 $df=n-1$; as $n$ grows it approaches the normal.

Русский
Ошибки первого и второго рода

Инференс для среднего работает аналогично инференсу для доли, с одним изменением: мы редко знаем генеральное стандартное отклонение $\sigma$, поэтому оцениваем его выборочным $s$. Эта дополнительная неопределенность означает использование $t$-распределения вместо нормального – распределения, имеющего колоколообразную форму, но с более тяжелыми хвостами, и зависящего от степеней свободы $df=n-1$; по мере роста $n$ оно приближается к нормальному.

Vocabulary · ⁨Словарь⁩ Train · ⁨Тренировать⁩
English Русский
distribution/ˌdɪstrɪˈbjuːʃn/ распределение
degrees of freedom/dɪˈɡriːz ɒv ˈfriːdəm/ число степеней свободы
paired data/peəd ˈdeɪtə/ парные данные
7.2

Confidence Interval for a Mean · ⁨Доверительный интервал для среднего⁩

Syllabus · ⁨Программа⁩
English

Enduring Understanding (VAR-7): The $t$-distribution may be used to model variation.

Learning Objective VAR-7.A: Describe $t$-distributions. [Skill 3.C]

  • VAR-7.A.1 When $s$ is used instead of $\sigma$ to calculate a test statistic, the corresponding distribution, known as the $t$-distribution, varies from the normal distribution in shape, in that more of the area is allocated to the tails of the density curve than in a normal distribution.
  • VAR-7.A.2 As the degrees of freedom increase, the area in the tails of a $t$-distribution decreases.

Enduring Understanding (UNC-4): An interval of values should be used to estimate parameters, in order to account for uncertainty.

Learning Objective UNC-4.O: Identify an appropriate confidence interval procedure for a population mean, including the mean difference between values in matched pairs. [Skill 1.D]

  • UNC-4.O.1 Because $\sigma$ is typically not known for distributions of quantitative variables, the appropriate confidence interval procedure for estimating the population mean of one quantitative variable for one sample is a one-sample $t$-interval for a mean.
  • UNC-4.O.2 For one quantitative variable, $X$, that is normally distributed, the distribution of $t = \dfrac{(\overline{x} - \mu)}{\frac{s}{\sqrt{n}}}$ is a $t$-distribution with $n-1$ degrees of freedom.
  • UNC-4.O.3 Matched pairs can be thought of as one sample of pairs. Once differences between pairs of values are found, inference for confidence intervals proceeds as for a population mean.

Learning Objective UNC-4.P: Verify the conditions for calculating confidence intervals for a population mean, including the mean difference between values in matched pairs. [Skill 4.C]

  • UNC-4.P.1 In order to calculate confidence intervals to estimate a population mean, we must check for independence and that the sampling distribution is approximately normal:
    • a. To check for independence:
      • i. Data should be collected using a random sample or a randomized experiment.
      • ii. When sampling without replacement, check that $n \leq 10\%N$, where $N$ is the size of the population.
    • b. To check that the sampling distribution of $\overline{x}$ is approximately normal (shape):
      • i. If the observed distribution is skewed, $n$ should be greater than 30.
      • ii. If the sample size is less than 30, the distribution of the sample data should be free from strong skewness and outliers.

Learning Objective UNC-4.Q: Determine the margin of error for a given sample size for a one-sample $t$-interval. [Skill 3.D]

  • UNC-4.Q.1 The critical value $t^*$ with $n-1$ degrees of freedom can be found using a table or computer-generated output.
  • UNC-4.Q.2 The standard error for a sample mean is given by $SE = \dfrac{s}{\sqrt{n}}$, where $s$ is the sample standard deviation.
  • UNC-4.Q.3 For a one-sample $t$-interval for a mean, the margin of error is the critical value ($t^*$) times the standard error ($SE$), which equals $t^*\left(\dfrac{s}{\sqrt{n}}\right)$.

Learning Objective UNC-4.R: Calculate an appropriate confidence interval for a population mean, including the mean difference between values in matched pairs. [Skill 3.D]

  • UNC-4.R.1 The point estimate for a population mean is the sample mean, $\overline{x}$.
  • UNC-4.R.2 For the population mean for one sample with unknown population standard deviation, the confidence interval is $\overline{x} \pm t^* \dfrac{s}{\sqrt{n}}$.

Boundary statement: Formulas for interval estimates do not appear explicitly on the AP Statistics Formula Sheet provided with the AP Statistics Exam. However, these formulas do not need to be memorized, as they can be constructed based on the general test statistic formula and the relevant standard error formulas that are provided on the formula sheet.

Русский

Долговременное понимание (VAR-7): Распределение $t$ может использоваться для моделирования вариативности.

Цель обучения VAR-7.A: Описывать распределения $t$. [Навык 3.C]

  • VAR-7.A.1 Когда $s$ используется вместо $\sigma$ для вычисления тестовой статистики, соответствующее распределение, известное как распределение $t$, отличается от нормального распределения формой: большая часть площади сосредоточена в хвостах кривой плотности вероятности, чем в нормальном распределении.
  • VAR-7.A.2 По мере увеличения числа степеней свободы площадь в хвостах распределения $t$ уменьшается.

Продолжающееся понимание (UNC-4): Доверительный интервал значений следует использовать для оценки параметров, чтобы учесть неопределенность.

Цель обучения UNC-4.O: Определять подходящую процедуру построения доверительного интервала для среднего значения генеральной совокупности, включая среднюю разницу между значениями в спаренных выборках. [Навык 1.D]

  • UNC-4.O.1 Поскольку σ ($\sigma$) обычно неизвестно для распределений количественных переменных, подходящей процедурой доверительного интервала для оценки среднего значения генеральной совокупности одной количественной переменной для одного выборочного набора является одновыборочный t-интервал ($t$) для среднего.
  • UNC-4.O.2 Для одной количественной переменной со стандартным отклонением генеральной совокупности $X$, имеющей нормальное распределение, распределение тестовой статистики $t = \dfrac{(\overline{x} - \mu)}{\frac{s}{\sqrt{n}}}$ является распределением $t$ с $n-1$ степенями свободы.
  • UNC-4.O.3 Спаренные выборки можно рассматривать как одну выборку пар. После нахождения разниц между парами значений вывод о доверительных интервалах проводится так же, как для среднего значения генеральной совокупности.

Цель обучения UNC-4.P: Проверять условия для расчета доверительных интервалов для среднего значения генеральной совокупности, включая среднюю разницу между значениями в спаренных выборках. [Навык 4.C]

  • UNC-4.P.1 Чтобы рассчитать доверительные интервалы для оценки среднего значения генеральной совокупности, необходимо проверить независимость и то, что выборочное распределение приблизительно нормально:
    • a. Для проверки независимости:
      • i. Данные следует собирать с использованием случайной выборки или рандомизированного эксперимента.
      • ii. При выборке без возвращения проверьте, что $n \leq 10\%N$, где $N$ — это размер генеральной совокупности.
    • b. Для проверки того, что выборочное распределение $\overline{x}$ приближенно нормально (форма):
      • i. Если наблюдаемое распределение скошено, размер выборки $n$ должен быть больше 30.
      • ii. Если размер выборки меньше 30, распределение выборочных данных должно быть свободным от сильной асимметрии и выбросов.

Цель обучения UNC-4.Q: Определить маржу ошибки для заданного размера выборки для одновыборочного t-интервала ($t$). [Навык 3.D]

  • UNC-4.Q.1 Критическое значение (t*, $t^*$) со степенью свободы (df, $n-1$) можно найти с помощью таблицы или компьютерного вывода.
  • UNC-4.Q.2 Стандартная ошибка выборочного среднего определяется формулой $SE = \dfrac{s}{\sqrt{n}}$, где $s$ — выборочное стандартное отклонение.
  • UNC-4.Q.3 Для одновыборочного t-интервала ($t$) для среднего маржа ошибки равна произведению критического значения (t*, $t^*$) на стандартную ошибку (SE, $SE$), что равно $t^*\left(\dfrac{s}{\sqrt{n}}\right)$.

Цель обучения UNC-4.R: Рассчитывать подходящий доверительный интервал для среднего значения генеральной совокупности, включая среднюю разницу между значениями в спаренных выборках. [Навык 3.D]

  • UNC-4.R.1 Точечной оценкой для среднего значения генеральной совокупности является выборочное среднее $\overline{x}$.
  • UNC-4.R.2 Для среднего значения генеральной совокупности по одной выборке с неизвестным стандартным отклонением генеральной совокупности доверительный интервал имеет вид $\overline{x} \pm t^* \dfrac{s}{\sqrt{n}}$.

Пограничное утверждение: Формулы для точечных оценок не приводятся явно на Листе формул AP Statistics, прилагаемом к экзамену AP Statistics. Однако эти формулы не нужно заучивать, так как их можно вывести на основе общей формулы тестовой статистики и соответствующих формул стандартной ошибки, которые приведены на листе формул.

Source: College Board AP Course and Exam Description · ⁨Источник: Описание курса и экзамена College Board AP⁩

English
What a confidence interval means

A one-sample $t$ interval for $\mu$:

$$\bar{x}\pm t^{*}\frac{s}{\sqrt{n}}.$$
$t^{*}$ is the critical value with $df=n-1$. Conditions: random sample, Normal/Large Sample (population normal, or $n\ge 30$ by the CLT, or a roughly symmetric sample with no outliers), and the 10% condition. Interpret the interval and the confidence level in context.

Worked example. A random sample of $n=25$ has $\bar{x}=50$ and $s=8$. For a $95\%$ interval, $df=24$ gives $t^*=2.064$:

$$50\pm2.064\cdot\frac{8}{\sqrt{25}}=50\pm2.064(1.6)=50\pm3.3=(46.7,\ 53.3).$$

Русский
Что означает доверительный интервал

Одновыборочный $t$-интервал для $\mu$:

$$\bar{x}\pm t^{*}\frac{s}{\sqrt{n}}.$$
$t^{*}$ — это критическое значение с $df=n-1$. Условия: случайная выборка, Нормальное/Большая выборка (генеральная совокупность нормальна, или $n\ge 30$ согласно ЦПТ, или примерно симметричная выборка без выбросов) и условие 10%. Интерпретируйте интервал и уровень доверия в контексте.

Разбор примера. Случайная выборка из $n=25$ имеет среднее $\bar{x}=50$ и стандартное отклонение $s=8$. Для $95\%$-интервала $df=24$ дает $t^*=2.064$:

$$50\pm2.064\cdot\frac{8}{\sqrt{25}}=50\pm2.064(1.6)=50\pm3.3=(46.7,\ 53.3).$$

t-распределение имеет меньшую вершину и более тяжелые хвосты, чем нормальное
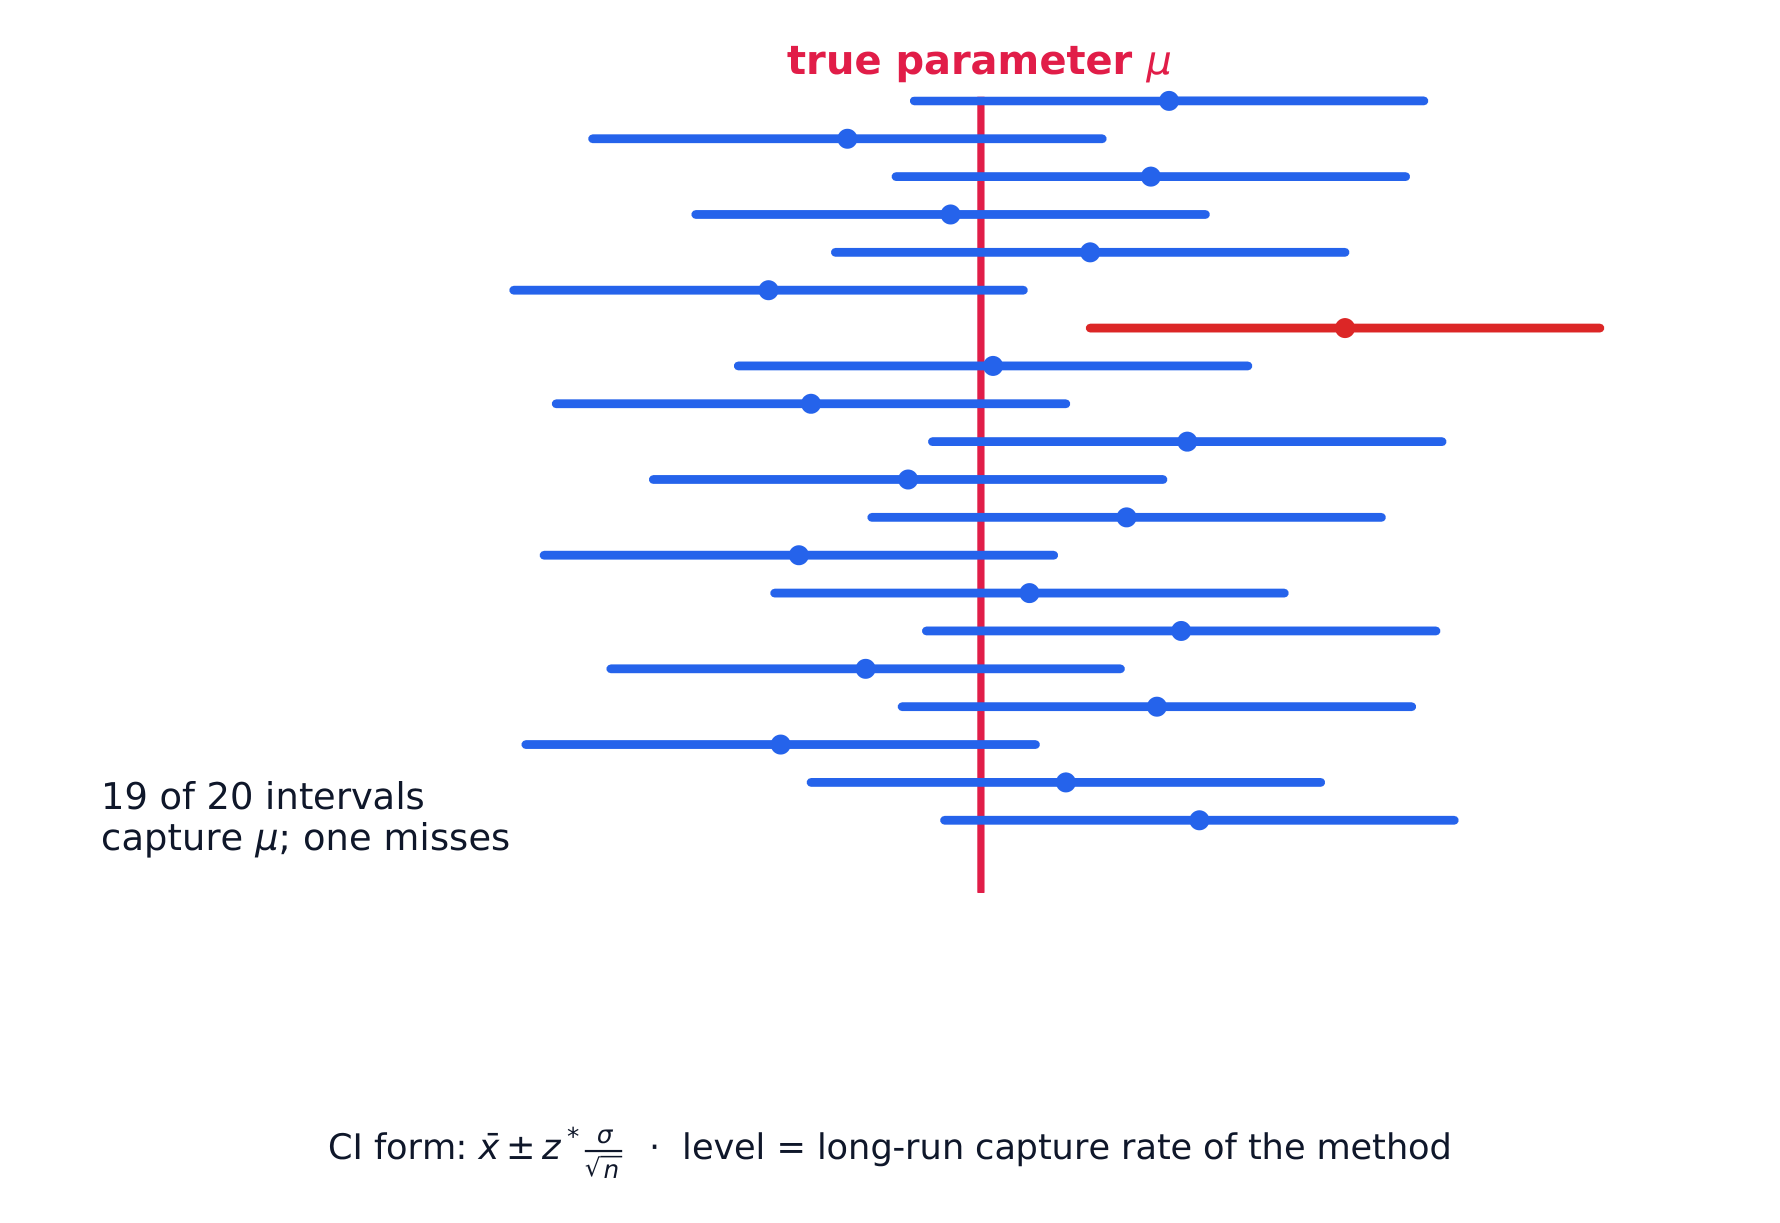
Множественные 95%-доверительные интервалы: около 95% захватывают истинный параметр
«95% уверенность» описывает метод, а не один конкретный интервал: при многократном повторении отбора выборок около 95% интервалов содержат $\mu$, а около 5% – нет.
Explore · ⁨Исследовать⁩

Why a t interval is wider than a z interval · ⁨Почему t-интервал шире z-интервала⁩

A mean interval uses $t^*$, not $1.96$, because $\sigma$ is estimated by $s$. Drag df down and watch $t^*$ grow — at $df=10$ it is $2.228$, and the interval is wider for it. Drag df up and $t^*$ falls back toward $1.96$, which is why large samples may use $z$. · ⁨Доверительный интервал для среднего использует $t^*$, а не $1.96$, потому что стандартное отклонение population $\sigma$ оценивается по выборке $s$. Уменьшайте степени свободы (df) и наблюдайте, как $t^*$ растет — при значении $df=10$ он составляет $2.228$, и интервал становится шире. Увеличивайте df, и $t^*$ возвращается к $1.96$, поэтому для больших выборок можно использовать $z$.⁩

7.3

Justifying a Claim About a Mean · ⁨Обоснование утверждения о среднем⁩

Syllabus · ⁨Программа⁩
Enduring UnderstandingLearning ObjectiveEssential Knowledge

UNC-4
An interval of values should be used to estimate parameters, in order to account for uncertainty.

UNC-4.S
Interpret a confidence interval for a population mean, including the mean difference between values in matched pairs. [Skill 4.B]

  • UNC-4.S.1 A confidence interval for a population mean either contains the population mean or it does not, because each interval is based on data from a random sample, which varies from sample to sample.
  • UNC-4.S.2 We are C% confident that the confidence interval for a population mean captures the population mean.
  • UNC-4.S.3 An interpretation of a confidence interval for a population mean includes a reference to the sample taken and details about the population it represents.
    • Illustrative examples for UNC-4.S.3: For interpreting a 96% confidence interval for mean foot length for all footprints found in a cave based on a particular randomly selected sample of footprints in the cave: "We are 96% confident that the mean foot length for all footprints found in the cave falls within the confidence interval" (based on 2000 FRQ 2).

UNC-4.T
Justify a claim based on a confidence interval for a population mean, including the mean difference between values in matched pairs. [Skill 4.D]

  • UNC-4.T.1 A confidence interval for a population mean provides an interval of values that may provide sufficient evidence to support a particular claim in context.

UNC-4.U
Identify the relationships between sample size, width of a confidence interval, confidence level, and margin of error for a population mean. [Skill 4.A]

  • UNC-4.U.1 When all other things remain the same, the width of a confidence interval for a population mean tends to decrease as the sample size increases.
  • UNC-4.U.2 For a single mean, the width of the interval is proportional to $\dfrac{1}{\sqrt{n}}$.
  • UNC-4.U.3 For a given sample, the width of the confidence interval for a population mean increases as the confidence level increases.

Source: College Board AP Course and Exam Description · ⁨Источник: Описание курса и экзамена College Board AP⁩

English

As with proportions: a claimed mean inside the interval is plausible; outside the interval, the data give evidence against it. Answer in context using the plausible range.

Русский

Как и для долей: заявленное среднее, находящееся внутри интервала, возможно; вне интервала данные дают доказательства против него. Отвечайте в контексте, используя диапазон возможных значений.

7.4

Setting Up a Test for a Mean · ⁨Настройка теста для среднего⁩

Syllabus · ⁨Программа⁩
English

Enduring Understanding (VAR-7): The $t$-distribution may be used to model variation.

Learning Objective VAR-7.B: Identify an appropriate testing method for a population mean with unknown $\sigma$, including the mean difference between values in matched pairs. [Skill 1.E]

  • VAR-7.B.1 The appropriate test for a population mean with unknown $\sigma$ is a one-sample $t$-test for a population mean.
  • VAR-7.B.2 Matched pairs can be thought of as one sample of pairs. Once differences between pairs of values are found, inference for significance testing proceeds as for a population mean.

Learning Objective VAR-7.C: Identify the null and alternative hypotheses for a population mean with unknown $\sigma$, including the mean difference between values in matched pairs. [Skill 1.F]

  • VAR-7.C.1 The null hypothesis for a one-sample $t$-test for a population mean is $H_0 : \mu = \mu_0$, where $\mu_0$ is the hypothesized value. Depending upon the situation, the alternative hypothesis is $H_a : \mu < \mu_0$, or $H_a : \mu > \mu_0$, or $H_a : \mu \neq \mu_0$.
  • VAR-7.C.2 When finding the mean difference, $\mu_d$, between values in a matched pair, it is important to define the order of subtraction.

Learning Objective VAR-7.D: Verify the conditions for the test for a population mean, including the mean difference between values in matched pairs. [Skill 4.C]

  • VAR-7.D.1 In order to make statistical inferences when testing a population mean, we must check for independence and that the sampling distribution is approximately normal:
    • a. To check for independence:
      • i. Data should be collected using a random sample or a randomized experiment.
      • ii. When sampling without replacement, check that $n \leq 10\%N$.
    • b. To check that the sampling distribution of $\overline{x}$ is approximately normal (shape):
      • i. If the observed distribution is skewed, $n$ should be greater than 30.
      • ii. If the sample size is less than 30, the distribution of the sample data should be free from strong skewness and outliers.
Русский

Долговременное понимание (VAR-7): Распределение $t$ может использоваться для моделирования вариативности.

Цель обучения VAR-7.B: Определить соответствующий метод тестирования для среднего значения генеральной совокупности с неизвестным $\sigma$, включая среднюю разницу между значениями в спаренных выборках. [Навык 1.E]

  • VAR-7.B.1 Соответствующим тестом для среднего значения генеральной совокупности с неизвестным $\sigma$ является одновыборочный $t$-тест для среднего значения генеральной совокупности.
  • VAR-7.B.2 Спаренные выборки можно рассматривать как одну выборку пар. После нахождения разниц между парами значений статистический вывод для проверки гипотез проводится аналогично тесту для среднего значения генеральной совокупности.

Цель обучения VAR-7.C: Определить нулевую и альтернативную гипотезы для среднего значения генеральной совокупности с неизвестным $\sigma$, включая среднюю разницу между значениями в спаренных выборках. [Навык 1.F]

  • VAR-7.C.1 Нулевая гипотеза для одновыборочного $t$-теста для среднего значения генеральной совокупности — это $H_0 : \mu = \mu_0$, где $\mu_0$ — предполагаемое значение. В зависимости от ситуации альтернативная гипотеза может быть $H_a : \mu < \mu_0$, или $H_a : \mu > \mu_0$, или $H_a : \mu \neq \mu_0$.
  • VAR-7.C.2 При нахождении средней разницы $\mu_d$ между значениями в спаренной выборке важно определить порядок вычитания.

Цель обучения VAR-7.D: Проверить условия для теста для среднего значения генеральной совокупности, включая среднюю разницу между значениями в спаренных выборках. [Навык 4.C]

  • VAR-7.D.1 Для проведения статистического вывода при тестировании среднего значения генеральной совокупности необходимо проверить независимость и то, что выборочное распределение приблизительно нормально:
    • a. Для проверки независимости:
      • i. Данные следует собирать с использованием случайной выборки или рандомизированного эксперимента.
      • ii. При выборке без возвращения проверьте, что $n \leq 10\%N$.
    • b. Для проверки того, что выборочное распределение $\overline{x}$ приближенно нормально (форма):
      • i. Если наблюдаемое распределение скошено, размер выборки $n$ должен быть больше 30.
      • ii. Если размер выборки меньше 30, распределение выборочных данных должно быть свободным от сильной асимметрии и выбросов.

Source: College Board AP Course and Exam Description · ⁨Источник: Описание курса и экзамена College Board AP⁩

English
What a p-value means

State hypotheses about $\mu$: $H_0:\mu=\mu_0$ versus $H_a:\mu\neq\mu_0$ (or $<,>$). Check the same conditions. The one-sample $t$ statistic:

$$t=\frac{\bar{x}-\mu_0}{s/\sqrt{n}},\qquad df=n-1.$$

Worked example. Test $H_0:\mu=45$ against $H_a:\mu\neq45$ for the sample above ($\bar{x}=50$, $s=8$, $n=25$):

$$t=\frac{50-45}{8/\sqrt{25}}=\frac{5}{1.6}=3.13,\qquad df=24.$$
This $t$ is far out in the tail (two-tailed $p<0.01$), so reject $H_0$ – strong evidence the mean is not $45$. Notice $45$ also falls outside the $95\%$ interval $(46.7,53.3)$, the same conclusion by two routes.

Русский
Что означает p-значение

Запишите гипотезы относительно $\mu$: $H_0:\mu=\mu_0$ против $H_a:\mu\neq\mu_0$ (или $<,>$). Проверьте те же условия. Статистика одновыборочного $t$-теста:

$$t=\frac{\bar{x}-\mu_0}{s/\sqrt{n}},\qquad df=n-1.$$

Разбор примера. Проверьте $H_0:\mu=45$ против $H_a:\mu\neq45$ для выборки выше ($\bar{x}=50$, $s=8$, $n=25$):

$$t=\frac{50-45}{8/\sqrt{25}}=\frac{5}{1.6}=3.13,\qquad df=24.$$
Это $t$ находится далеко в хвосте (двустороннее $p<0.01$), поэтому отвергаем $H_0$ – сильные доказательства того, что среднее не равно $45$. Заметьте, что также $45$ выходит за пределы $95\%$-интервала $(46.7,53.3)$, тот же вывод двумя способами.

7.5

Carrying Out a Test for a Mean · ⁨Проведение теста для среднего⁩

Syllabus · ⁨Программа⁩
Enduring UnderstandingLearning ObjectiveEssential Knowledge

VAR-7
The $t$-distribution may be used to model variation.

VAR-7.E
Calculate an appropriate test statistic for a population mean, including the mean difference between values in matched pairs. [Skill 3.E]

  • VAR-7.E.1 For a single quantitative variable when random sampling with replacement from a population that can be modeled with a normal distribution with mean $\mu$ and standard deviation $\sigma$, the sampling distribution of $t = \dfrac{\overline{x} - \mu}{\frac{s}{\sqrt{n}}}$ has a $t$-distribution with $n - 1$ degrees of freedom.

Boundary statement: The formulas for test statistics do not appear explicitly on the AP Statistics Formula Sheet provided with the AP Statistics Exam. However, these formulas do not need to be memorized, as they can be constructed based on the general test statistic formula and the relevant standard error formulas that are provided on the formula sheet.

DAT-3
Significance testing allows us to make decisions about hypotheses within a particular context.

DAT-3.E
Interpret the $p$-value of a significance test for a population mean, including the mean difference between values in matched pairs. [Skill 4.B]

  • DAT-3.E.1 An interpretation of the $p$-value of a significance test for a population mean should recognize that the $p$-value is computed by assuming that the null hypothesis is true, i.e., by assuming that the true population mean is equal to the particular value stated in the null hypothesis.

DAT-3.F
Justify a claim about the population based on the results of a significance test for a population mean. [Skill 4.E]

  • DAT-3.F.1 A formal decision explicitly compares the $p$-value to the significance $\alpha$. If the $p$-value $\leq \alpha$, then reject the null hypothesis, $H_0 : \mu = \mu_0$. If the $p$-value $> \alpha$, then fail to reject the null hypothesis.
  • DAT-3.F.2 The results of a significance test for a population mean can serve as the statistical reasoning to support the answer to a research question about the population that was sampled.

Source: College Board AP Course and Exam Description · ⁨Источник: Описание курса и экзамена College Board AP⁩

English

Find the $p$-value from the $t$-distribution with $df=n-1$, compare to $\alpha$, and conclude in context – reject or fail to reject $H_0$, then state what that means for the claim. Show the test name, statistic, $df$, and $p$-value.

Русский

Найдите $p$-значение из $t$-распределения со степенью свободы $df=n-1$, сравните с $\alpha$ и сделайте вывод в контексте – отвергните или не отвергайте $H_0$, затем укажите, что это значит для утверждения. Покажите название теста, статистику, $df$ и $p$-значение.

Explore · ⁨Исследовать⁩

Read a p-value off the t curve · ⁨Определите p-значение по t-кривой⁩

The p-value is the shaded tail area beyond your $t$ statistic — both tails for a two-tailed $H_a$. The dashed normal curve behind $t$ shows what you would have got by wrongly using $z$: at small df the $t$ tail is visibly fatter, so the true p-value is larger than the normal would suggest. · ⁨p-значение — это заштрихованная площадь хвоста за вашим статистиком $t$; оба хвоста для двустороннего $H_a$. Пунктирная нормальная кривая на фоне $t$ показывает, что получилось бы при ошибочном использовании $z$: при малых df $t$ хвост заметно толще, поэтому истинное p-значение больше, чем предполагает нормальное распределение.⁩

7.6

Confidence Interval for a Difference of Two Means · ⁨Доверительный интервал для разности двух средних⁩

Syllabus · ⁨Программа⁩
English

Enduring Understanding (UNC-4): An interval of values should be used to estimate parameters, in order to account for uncertainty.

Learning Objective UNC-4.V: Identify an appropriate confidence interval procedure for a difference of two population means. [Skill 1.D]

  • UNC-4.V.1 Consider a simple random sample from population 1 of size $n_1$, mean $\mu_1$, and standard deviation $\sigma_1$ and a second simple random sample from population 2 of size $n_2$, mean $\mu_2$, and standard deviation $\sigma_2$. If the distributions of populations 1 and 2 are normal or if both $n_1$ and $n_2$ are greater than 30, then the sampling distribution of the difference of means, $\overline{x}_1 - \overline{x}_2$ is also normal. The mean for the sampling distribution of $\overline{x}_1 - \overline{x}_2$ is $\mu_1 - \mu_2$. The standard deviation of $\overline{x}_1 - \overline{x}_2$ is $\sqrt{\dfrac{(\sigma_1)^2}{n_1} + \dfrac{(\sigma_2)^2}{n_2}}$.
  • UNC-4.V.2 The appropriate confidence interval procedure for one quantitative variable for two independent samples is a two-sample $t$-interval for a difference between population means.

Learning Objective UNC-4.W: Verify the conditions to calculate confidence intervals for the difference of two population means. [Skill 4.C]

  • UNC-4.W.1 In order to calculate confidence intervals to estimate a difference of population means, we must check for independence and that the sampling distribution is approximately normal:
    • a. To check for independence:
      • i. Data should be collected using two independent, random samples or a randomized experiment.
      • ii. When sampling without replacement, check that $n_1 \leq 10\%N_1$ and $n_2 \leq 10\%N_2$.
    • b. To check that the sampling distribution of $(\overline{x}_1 - \overline{x}_2)$ should be approximately normal (shape):
      • i. If the observed distributions are skewed, both $n_1$ and $n_2$ should be greater than 30.

Learning Objective UNC-4.X: Determine the margin of error for the difference of two population means. [Skill 3.D]

  • UNC-4.X.1 For the difference of two sample means, the margin of error is the critical value ($t^*$) times the standard error ($SE$) of the difference of two means.
  • UNC-4.X.2 The standard error for the difference in two sample means with sample standard deviations, $s_1$ and $s_2$, is $\sqrt{\dfrac{(s_1)^2}{n_1} + \dfrac{(s_2)^2}{n_2}}$.

Learning Objective UNC-4.Y: Calculate an appropriate confidence interval for a difference of two population means. [Skill 3.D]

  • UNC-4.Y.1 The point estimate for the difference of two population means is the difference in sample means, $\overline{x}_1 - \overline{x}_2$.
  • UNC-4.Y.2 For a difference of two population means where the population standard deviations are not known, the confidence interval is $(\overline{x}_1 - \overline{x}_2) \pm t^* \sqrt{\dfrac{s_1^2}{n_1} + \dfrac{s_2^2}{n_2}}$ where $\pm t^*$ are the critical values for the central C% of a $t$-distribution with appropriate degrees of freedom that can be found using technology.

Boundary statement: Formulas for interval estimates do not appear explicitly on the AP Statistics Formula Sheet provided with the AP Statistics Exam. However, these formulas do not need to be memorized, as they can be constructed based on the general test statistic formula and the relevant standard error formulas that are provided on the formula sheet.

Русский

Продолжающееся понимание (UNC-4): Доверительный интервал значений следует использовать для оценки параметров, чтобы учесть неопределенность.

Цель обучения UNC-4.V: Определить соответствующую процедуру доверительного интервала для разницы двух средних значений генеральных совокупностей. [Навык 1.D]

  • UNC-4.V.1 Рассмотрим простую случайную выборку из генеральной совокупности 1 объемом $n_1$, со средним $\mu_1$ и стандартным отклонением $\sigma_1$, а также вторую простую случайную выборку из генеральной совокупности 2 объемом $n_2$, со средним $\mu_2$ и стандартным отклонением $\sigma_2$. Если распределения генеральных совокупностей 1 и 2 являются нормальными или если оба размера выборки $n_1$ и $n_2$ больше 30, то выборочное распределение разницы средних значений, $\overline{x}_1 - \overline{x}_2$, также является нормальным. Среднее значение для выборочного распределения $\overline{x}_1 - \overline{x}_2$ равно $\mu_1 - \mu_2$. Стандартное отклонение для $\overline{x}_1 - \overline{x}_2$ равно $\sqrt{\dfrac{(\sigma_1)^2}{n_1} + \dfrac{(\sigma_2)^2}{n_2}}$.
  • UNC-4.V.2 Соответствующей процедурой доверительного интервала для одной количественной переменной для двух независимых выборок является двухвыборочный $t$-интервал для разницы средних значений генеральных совокупностей.

Цель обучения UNC-4.W: Проверить условия для расчета доверительных интервалов для разницы двух средних значений генеральных совокупностей. [Навык 4.C]

  • UNC-4.W.1 Для расчета доверительных интервалов для оценки разницы средних значений генеральных совокупностей необходимо проверить независимость и то, что выборочное распределение приблизительно нормально:
    • a. Для проверки независимости:
      • i. Данные должны собираться с помощью двух независимых случайных выборок или рандомизированного эксперимента.
      • ii. При выборке без возвращения проверьте, что $n_1 \leq 10\%N_1$ и $n_2 \leq 10\%N_2$.
    • b. Чтобы убедиться, что выборочное распределение $(\overline{x}_1 - \overline{x}_2)$ приблизительно нормально (форма):
      • i. Если наблюдаемые распределения скошены, оба размера выборки $n_1$ и $n_2$ должны быть больше 30.

Цель обучения UNC-4.X: Определить маржу ошибки для разницы двух средних значений генеральных совокупностей. [Навык 3.D]

  • UNC-4.X.1 Для разницы двух выборочных средних маржа ошибки равна критическому значению ($t^*$), умноженному на стандартную ошибку ($SE$) разницы двух средних значений.
  • UNC-4.X.2 Стандартная ошибка разности двух выборочных средних со стандартными отклонениями выборок $s_1$ и $s_2$ равна $\sqrt{\dfrac{(s_1)^2}{n_1} + \dfrac{(s_2)^2}{n_2}}$.

Цель обучения UNC-4.Y: Вычислить соответствующий доверительный интервал для разности двух генеральных средних. [Навык 3.D]

  • UNC-4.Y.1 Точечная оценка разности двух генеральных средних — это разность выборочных средних, $\overline{x}_1 - \overline{x}_2$.
  • UNC-4.Y.2 Для разности двух средних популяций, когда стандартные отклонения популяций неизвестны, доверительный интервал составляет $(\overline{x}_1 - \overline{x}_2) \pm t^* \sqrt{\dfrac{s_1^2}{n_1} + \dfrac{s_2^2}{n_2}}$, где $\pm t^*$ — критические значения для центральной части C% распределения $t$ с соответствующими степенями свободы, которые можно найти с помощью программного обеспечения.

Пограничное утверждение: Формулы для точечных оценок не приводятся явно на Листе формул AP Statistics, прилагаемом к экзамену AP Statistics. Однако эти формулы не нужно заучивать, так как их можно вывести на основе общей формулы тестовой статистики и соответствующих формул стандартной ошибки, которые приведены на листе формул.

Source: College Board AP Course and Exam Description · ⁨Источник: Описание курса и экзамена College Board AP⁩

English

For independent samples, estimate $\mu_1-\mu_2$:

$$(\bar{x}_1-\bar{x}_2)\pm t^{*}\sqrt{\frac{s_1^2}{n_1}+\frac{s_2^2}{n_2}}.$$
Conditions must hold in both samples. (Use technology for the $df$; do not pool the variances on the AP exam.)

Русский

Для независимых выборок оцените $\mu_1-\mu_2$:

$$(\bar{x}_1-\bar{x}_2)\pm t^{*}\sqrt{\frac{s_1^2}{n_1}+\frac{s_2^2}{n_2}}.$$
Условия должны выполняться в обеих выборках. (Используйте технологии для расчета $df$; на экзамене AP не объединяйте дисперсии.)

Случайное распределение лежит в основе справедливого сравнения двух групп при тесте на разность средних
7.7

Justifying a Claim About Two Means · ⁨Обоснование утверждения о двух средних⁩

Syllabus · ⁨Программа⁩
English

Enduring Understanding (UNC-4): An interval of values should be used to estimate parameters, in order to account for uncertainty.

Learning Objective UNC-4.Z: Interpret a confidence interval for a difference of population means. [Skill 4.B]

  • UNC-4.Z.1 In repeated random sampling with the same sample size, approximately C% of confidence intervals created will capture the difference of population means.
  • UNC-4.Z.2 An interpretation for a confidence interval for the difference of two population means should include a reference to the samples taken and details about the populations they represent.
    • Illustrative examples for UNC-4.Z.2: For interpreting a confidence interval for a difference between mean response times for two fire stations (northern - southern): "Based on these samples, one can be 95 percent confident that the difference in the population mean response times (northern - southern) is between -2.37 minutes and 0.37 minutes" (2009 FRQ 4).

Learning Objective UNC-4.AA: Justify a claim based on a confidence interval for a difference of population means. [Skill 4.D]

  • UNC-4.AA.1 A confidence interval for a difference of population means provides an interval of values that may provide sufficient evidence to support a particular claim in context.

Learning Objective UNC-4.AB: Identify the effects of sample size on the width of a confidence interval for the difference of two means. [Skill 4.A]

  • UNC-4.AB.1 When all other things remain the same, the width of the confidence interval for the difference of two means tends to decrease as the sample sizes increase.
Русский

Продолжающееся понимание (UNC-4): Доверительный интервал значений следует использовать для оценки параметров, чтобы учесть неопределенность.

Цель обучения UNC-4.Z: Интерпретировать доверительный интервал для разности генеральных средних. [Навык 4.B]

  • UNC-4.Z.1 При многократном повторном случайном отборе с одинаковым размером выборки приблизительно C% созданных доверительных интервалов будут включать истинную разность генеральных средних.
  • UNC-4.Z.2 Интерпретация доверительного интервала для разности двух генеральных средних должна содержать ссылку на взятые выборки и детали об изучаемых генеральных совокупностях.
    • Иллюстративные примеры для UNC-4.Z.2: При интерпретации доверительного интервала для разницы средних времен реакции двух пожарных станций (северная минус южная): «Основываясь на этих выборках, мы можем быть на 95 процентов уверены, что разница в средних времени реакции популяции (северная - южная) находится между -2.37 минутами и 0.37 минутами» (2009 FRQ 4).

Цель обучения UNC-4.AA: Обосновать утверждение на основе доверительного интервала для разности генеральных средних. [Навык 4.D]

  • UNC-4.AA.1 Доверительный интервал для разности генеральных средних представляет собой диапазон значений, который может предоставить достаточные доказательства для подтверждения конкретного утверждения в контексте задачи.

Цель обучения UNC-4.AB: Определить влияние размера выборки на ширину доверительного интервала для разности двух средних. [Навык 4.A]

  • UNC-4.AB.1 При неизменных остальных условиях ширина доверительного интервала для разности двух средних имеет тенденцию уменьшаться по мере увеличения размеров выборок.

Source: College Board AP Course and Exam Description · ⁨Источник: Описание курса и экзамена College Board AP⁩

English

If the interval for $\mu_1-\mu_2$ contains $0$, the data are consistent with equal means; if it excludes $0$, there is evidence of a difference in that direction. Interpret in context.

Русский

Если доверительный интервал для $\mu_1-\mu_2$ содержит $0$, данные согласуются с равенством средних; если он не включает $0$, это свидетельствует о различии в данном направлении. Дайте интерпретацию в контексте задачи.

7.8

Setting Up a Test for a Difference of Means · ⁨Подготовка к тесту на разность средних⁩

Syllabus · ⁨Программа⁩
Enduring UnderstandingLearning ObjectiveEssential Knowledge

VAR-7
The $t$-distribution may be used to model variation.

VAR-7.F
Identify an appropriate selection of a testing method for a difference of two population means. [Skill 1.E]

  • VAR-7.F.1 For a quantitative variable, the appropriate test for a difference of two population means is a two-sample $t$-test for a difference of two population means.

VAR-7.G
Identify the null and alternative hypotheses for a difference of two population means. [Skill 1.F]

  • VAR-7.G.1 The null hypothesis for a two-sample $t$-test for a difference of two population means, $\mu_1$ and $\mu_2$, is: $H_0 : \mu_1 - \mu_2 = 0$, or $H_0 : \mu_1 = \mu_2$. The alternative hypothesis is $H_a : \mu_1 - \mu_2 < 0$, or $H_a : \mu_1 - \mu_2 > 0$, or $H_a : \mu_1 - \mu_2 \neq 0$, or $H_a : \mu_1 > \mu_2$, or $H_a : \mu_1 < \mu_2$, or $H_a : \mu_1 \neq \mu_2$.

VAR-7.H
Verify the conditions for the significance test for the difference of two population means. [Skill 4.C]

  • VAR-7.H.1 In order to make statistical inferences when testing a difference between population means, we must check for independence and that the sampling distribution is approximately normal:
    • a. Individual observations should be independent:
      • i. Data should be collected using simple random samples or a randomized experiment.
      • ii. When sampling without replacement, check that $n_1 \leq 10\%N_1$ and $n_2 \leq 10\%N_2$.
    • b. The sampling distribution of $\overline{x}_1 - \overline{x}_2$ should be approximately normal (shape).
      • i. If the observed distribution is skewed, both $n_1$ and $n_2$ should be greater than 30.
      • ii. If the sample size is less than 30, the distribution of the sample data should be free from strong skewness and outliers. This should be checked for BOTH samples.

Source: College Board AP Course and Exam Description · ⁨Источник: Описание курса и экзамена College Board AP⁩

English

Hypotheses: $H_0:\mu_1=\mu_2$ versus $H_a:\mu_1\neq\mu_2$ (or $<,>$). Distinguish two independent samples from paired data 配对数据 – for paired data (before/after, matched subjects), first take the differences and run a one-sample $t$ procedure on them.

Русский

Гипотезы: $H_0:\mu_1=\mu_2$ против $H_a:\mu_1\neq\mu_2$ (или $<,>$). Различайте два независимых выборки и связанные данные – для связанных данных (до/после, парные subjekty) сначала вычислите разности и примените процедуру одновыборочного $t$ теста к ним.

7.9

Carrying Out a Test for a Difference of Means · ⁨Проведение теста на разность средних⁩

Syllabus · ⁨Программа⁩
Enduring UnderstandingLearning ObjectiveEssential Knowledge

VAR-7
The $t$-distribution may be used to model variation.

VAR-7.I
Calculate an appropriate test statistic for a difference of two means. [Skill 3.E]

  • VAR-7.I.1 For a single quantitative variable, data collected using independent random samples or a randomized experiment from two populations, each of which can be modeled with a normal distribution, the sampling distribution of $t = \dfrac{(\overline{x}_1 - \overline{x}_2) - (\mu_1 - \mu_2)}{\sqrt{\dfrac{s_1^2}{n_1} + \dfrac{s_2^2}{n_2}}}$ is an approximate $t$-distribution with degrees of freedom that can be found using technology. The degrees of freedom fall between the smaller of $n_1 - 1$ and $n_2 - 1$ and $n_1 + n_2 - 2$.
    • Illustrative examples for VAR-7.I.1: In a study comparing mean recovery times for two surgical procedures to repair a torn anterior cruciate ligament (ACL), the group receiving one procedure had a sample size of 110, while the group receiving the other procedure had a sample size of 100. The degrees of freedom fall between 100 (the smaller of 110 and 100) and 208 (110 + 100 - 2). The degrees of freedom may be determined using technology. If the test statistic for this study is $t \approx 7.13$, then the $p$-value is the area greater than 7.13 for a $t$-distribution with $df = 207.18$ (2018 FRQ 4).

Boundary statement: The formulas for test statistics do not appear explicitly on the AP Statistics Formula Sheet provided with the AP Statistics Exam. However, these formulas do not need to be memorized, as they can be constructed based on the general test statistic formula and the standard error formulas for each of the relevant test statistics that are provided on the formula sheet.

DAT-3
Significance testing allows us to make decisions about hypotheses within a particular context.

DAT-3.G
Interpret the $p$-value of a significance test for a difference of population means. [Skill 4.B]

  • DAT-3.G.1 An interpretation of the $p$-value of a significance test for a two-sample difference of population means should recognize that the $p$-value is computed by assuming that the null hypothesis is true, i.e., by assuming that the true population means are equal to each other.

DAT-3.H
Justify a claim about the population based on the results of a significance test for a difference of two population means in context. [Skill 4.E]

  • DAT-3.H.1 A formal decision explicitly compares the $p$-value to the significance $\alpha$. If the $p$-value $\leq \alpha$, then reject the null hypothesis, $H_0 : \mu_1 - \mu_2 = 0$, or $H_0 : \mu_1 = \mu_2$. If the $p$-value $> \alpha$, then fail to reject the null hypothesis.
  • DAT-3.H.2 The results of a significance test for a two-sample test for a difference between two population means can serve as the statistical reasoning to support the answer to a research question about the populations that were sampled.

Source: College Board AP Course and Exam Description · ⁨Источник: Описание курса и экзамена College Board AP⁩

English

The two-sample $t$ statistic:

$$t=\frac{(\bar{x}_1-\bar{x}_2)-0}{\sqrt{\frac{s_1^2}{n_1}+\frac{s_2^2}{n_2}}}.$$
Get the $p$-value (technology for $df$), compare to $\alpha$, conclude in context.

Русский

Статистика двувывборочного $t$ теста:

$$t=\frac{(\bar{x}_1-\bar{x}_2)-0}{\sqrt{\frac{s_1^2}{n_1}+\frac{s_2^2}{n_2}}}.$$
Найдите p-значение ($p$-значение), используя технологии для вычисления $df$, сравните его со значением $\alpha$ и сделайте вывод в контексте задачи.

7.10

Selecting and Communicating a Procedure · ⁨Выбор и формулировка процедуры⁩

Syllabus · ⁨Программа⁩
English

This topic is intended to focus on the skill of selecting an appropriate inference procedure, now that students have a range of options. Students should be given opportunities to practice when and how to apply all learning objectives relating to inference involving proportions or means.

Русский

Эта тема предназначена для отработки навыка выбора соответствующей процедуры вывода, после того как у студентов появился широкий спектр вариантов. Студентам следует предоставлять возможность практиковаться в выборе момента и способа применения всех целей обучения, связанных с выводами о пропорциях или средних значениях.

Source: College Board AP Course and Exam Description · ⁨Источник: Описание курса и экзамена College Board AP⁩

English

The hardest exam skill is choosing the right procedure: one or two samples? proportion or mean? paired or independent? confidence interval or test? Read the question for what is being estimated or claimed, then name the procedure, check its conditions, carry it out, and communicate the conclusion clearly with numbers and context.

Русский

Самый сложный навык на экзамене — это выбор правильной процедуры: одна или две выборки? пропорция или среднее? связанные или независимые данные? доверительный интервал или тест? Внимательно прочитайте вопрос, чтобы понять, что оценивается или утверждается, затем назовите процедуру, проверьте условия, выполните расчеты и четко сформулируйте вывод, приводя числа и объясняя их в контексте.

7.10

Exam tips · ⁨Советы для экзамена⁩

English
  • Use t-procedures for means (population $\sigma$ unknown) — the t-distribution has heavier tails than normal.
  • Check conditions: random, independent, and roughly normal (or large $n$).
  • Interpret an interval and a test in context, always tied to the parameter (the true mean).
  • Match the right procedure: one-sample, two-sample, or paired (look for a natural pairing).
  • State the degrees of freedom; for a two-sample $t$-test use technology's value (or, by hand, the conservative smaller $n-1$).
Русский
  • Используйте t-процедуры для средних (когда генеральная дисперсия $\sigma$ неизвестна) — t-распределение имеет более тяжелые хвосты, чем нормальное.
  • Проверьте условия: случайная выборка, независимость и приблизительно нормальное распределение (или большая $n$).
  • Интерпретируйте интервал и тест в контексте, всегда привязываясь к параметру (истинному среднему).
  • Подберите правильную процедуру: одновыборочная, двувывборочная или связанная (ищите естественное пары).
  • Укажите число степеней свободы; для двувывборочного $t$-теста используйте значение от технологий (или вручную консервативное меньшее $n-1$).

Interactive lessons on this topic · ⁨Интерактивные уроки по этой теме⁩

Work through it step by step, with instant-check exercises. · ⁨Пройдите его шаг за шагом с упражнениями мгновенной проверки.⁩

Past Papers · ⁨Архив экзаменационных работ⁩

More topics in AP Statistics · ⁨Больше тем в AP Statistics⁩

Log in or create account · ⁨Войти или создать аккаунт⁩

IGCSE, A-Level & AP