Skip to content · ⁨Lompat ke konten⁩

Inference for Quantitative Data: Means · ⁨Inferensi untuk Data Kuantitatif: Rata-rata⁩

AP Statistics · ⁨AP Statistik⁩ · Topic 7 · ⁨Topik 7⁩

Video lesson for this topic · ⁨Pelajaran video untuk topik ini⁩ Open the video page · ⁨Buka halaman video⁩
7:38

Inferensi untuk Data Kuantitatif: Rata-rata

Anda sudah mengetahui inti inferensi. Ambil sampel, temukan rata-ratanya, lalu lakukan itu terus-menerus. Bahkan ketika populasi miring, rata-rata sampel itu…

English narration · English + 中文 subtitles burned in · ⁨Narasi bahasa Inggris · Subtitle bahasa Inggris + 中文 disematkan langsung⁩

7.1

Should I Worry About Error? · ⁨Apakah Saya Harus Khawatir tentang Kesalahan?⁩

Syllabus · ⁨Silabus⁩
English

Enduring Understanding (VAR-1): Given that variation may be random or not, conclusions are uncertain.

Learning Objective VAR-1.I: Identify questions suggested by probabilities of errors in statistical inference. [Skill 1.A]

  • VAR-1.I.1 Random variation may result in errors in statistical inference.
Bahasa Indonesia

Pemahaman Abadi (VAR-1): Mengingat variasi bisa bersifat acak atau tidak, kesimpulan bersifat tidak pasti.

Tujuan Pembelajaran VAR-1.I: Identifikasi pertanyaan yang muncul dari probabilitas kesalahan dalam inferensi statistik. [Keterampilan 1.A]

  • VAR-1.I.1 Variasi acak dapat menghasilkan kesalahan dalam inferensi statistik.
Source: College Board AP Course and Exam Description · ⁨Sumber: Deskripsi Kursus dan Ujian College Board AP⁩

English
Type I and Type II errors

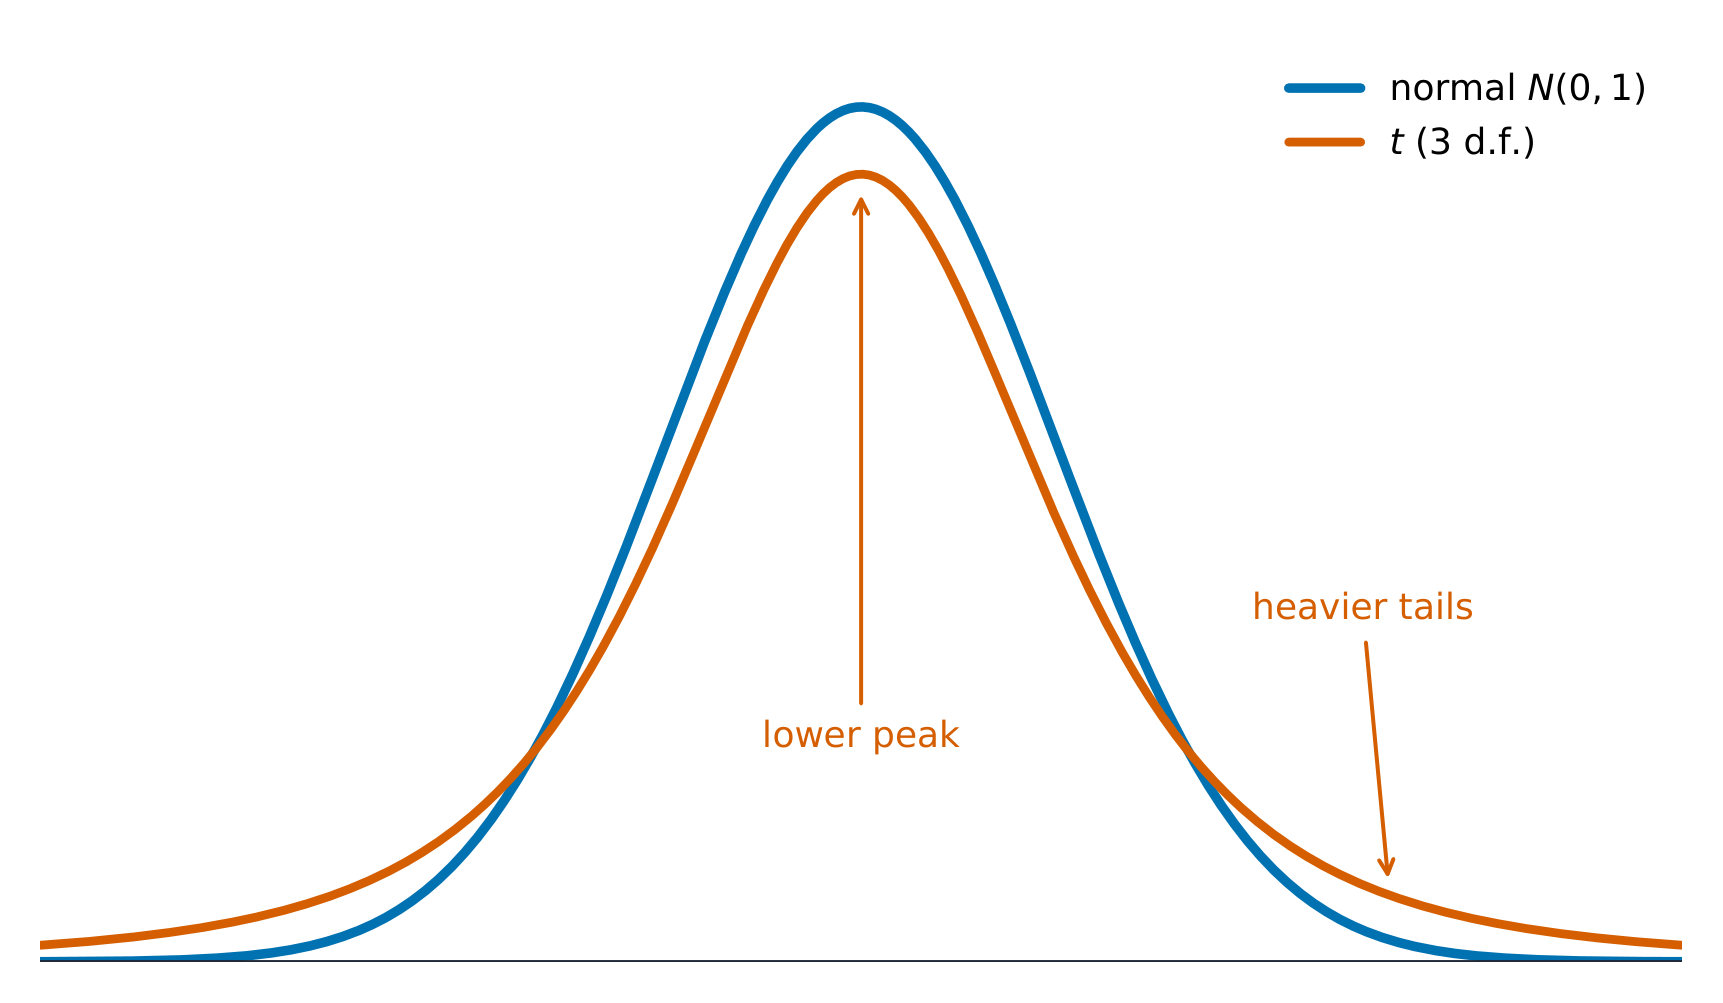
Inference for a mean works like inference for a proportion, with one change: we rarely know the population standard deviation $\sigma$, so we estimate it with the sample $s$. That extra uncertainty means we use the $t$-distribution instead of the normal – a distribution 分布 that is bell-shaped but with heavier tails, and it depends on the degrees of freedom 自由度 $df=n-1$; as $n$ grows it approaches the normal.

Bahasa Indonesia
Kesalahan Tipe I dan Tipe II

Inferensi untuk mean bekerja seperti inferensi untuk proporsi, dengan satu perubahan: kita jarang mengetahui deviasi standar populasi $\sigma$, jadi kita memperkirakannya dengan sampel $s$. Ketidakpastian tambahan ini berarti kita menggunakan distribusi-$t$ alih-alih normal – distribusi yang berbentuk lonceng tetapi dengan ekor yang lebih tebal, dan bergantung pada derajat kebebasan $df=n-1$; saat $n$ tumbuh ia mendekati normal.

7.2

Confidence Interval for a Mean · ⁨Interval Kepercayaan untuk Mean⁩

Syllabus · ⁨Silabus⁩
Enduring UnderstandingLearning ObjectiveEssential Knowledge

VAR-7
The $t$-distribution may be used to model variation.

VAR-7.A
Describe $t$-distributions. [Skill 3.C]

  • VAR-7.A.1 When $s$ is used instead of $\sigma$ to calculate a test statistic, the corresponding distribution, known as the $t$-distribution, varies from the normal distribution in shape, in that more of the area is allocated to the tails of the density curve than in a normal distribution.
  • VAR-7.A.2 As the degrees of freedom increase, the area in the tails of a $t$-distribution decreases.

UNC-4
An interval of values should be used to estimate parameters, in order to account for uncertainty.

UNC-4.O
Identify an appropriate confidence interval procedure for a population mean, including the mean difference between values in matched pairs. [Skill 1.D]

  • UNC-4.O.1 Because $\sigma$ is typically not known for distributions of quantitative variables, the appropriate confidence interval procedure for estimating the population mean of one quantitative variable for one sample is a one-sample $t$-interval for a mean.
  • UNC-4.O.2 For one quantitative variable, $X$, that is normally distributed, the distribution of $t = \dfrac{(\overline{x} - \mu)}{\frac{s}{\sqrt{n}}}$ is a $t$-distribution with $n-1$ degrees of freedom.
  • UNC-4.O.3 Matched pairs can be thought of as one sample of pairs. Once differences between pairs of values are found, inference for confidence intervals proceeds as for a population mean.

UNC-4.P
Verify the conditions for calculating confidence intervals for a population mean, including the mean difference between values in matched pairs. [Skill 4.C]

  • UNC-4.P.1 In order to calculate confidence intervals to estimate a population mean, we must check for independence and that the sampling distribution is approximately normal:
    • a. To check for independence:
      • i. Data should be collected using a random sample or a randomized experiment.
      • ii. When sampling without replacement, check that $n \leq 10\%N$, where $N$ is the size of the population.
    • b. To check that the sampling distribution of $\overline{x}$ is approximately normal (shape):
      • i. If the observed distribution is skewed, $n$ should be greater than 30.
      • ii. If the sample size is less than 30, the distribution of the sample data should be free from strong skewness and outliers.

UNC-4.Q
Determine the margin of error for a given sample size for a one-sample $t$-interval. [Skill 3.D]

  • UNC-4.Q.1 The critical value $t^*$ with $n-1$ degrees of freedom can be found using a table or computer-generated output.
  • UNC-4.Q.2 The standard error for a sample mean is given by $SE = \dfrac{s}{\sqrt{n}}$, where $s$ is the sample standard deviation.
  • UNC-4.Q.3 For a one-sample $t$-interval for a mean, the margin of error is the critical value ($t^*$) times the standard error ($SE$), which equals $t^*\left(\dfrac{s}{\sqrt{n}}\right)$.

UNC-4.R
Calculate an appropriate confidence interval for a population mean, including the mean difference between values in matched pairs. [Skill 3.D]

  • UNC-4.R.1 The point estimate for a population mean is the sample mean, $\overline{x}$.
  • UNC-4.R.2 For the population mean for one sample with unknown population standard deviation, the confidence interval is $\overline{x} \pm t^* \dfrac{s}{\sqrt{n}}$.

Boundary statement: Formulas for interval estimates do not appear explicitly on the AP Statistics Formula Sheet provided with the AP Statistics Exam. However, these formulas do not need to be memorized, as they can be constructed based on the general test statistic formula and the relevant standard error formulas that are provided on the formula sheet.

Source: College Board AP Course and Exam Description · ⁨Sumber: Deskripsi Kursus dan Ujian College Board AP⁩

English
What a confidence interval means

A one-sample $t$ interval for $\mu$:

$$\bar{x}\pm t^{*}\frac{s}{\sqrt{n}}.$$
$t^{*}$ is the critical value with $df=n-1$. Conditions: random sample, Normal/Large Sample (population normal, or $n\ge 30$ by the CLT, or a roughly symmetric sample with no outliers), and the 10% condition. Interpret the interval and the confidence level in context.

Worked example. A random sample of $n=25$ has $\bar{x}=50$ and $s=8$. For a $95\%$ interval, $df=24$ gives $t^*=2.064$:

$$50\pm2.064\cdot\frac{8}{\sqrt{25}}=50\pm2.064(1.6)=50\pm3.3=(46.7,\ 53.3).$$

Bahasa Indonesia
Apa arti interval kepercayaan

Interval $t$ satu-sampel untuk $\mu$:

$$\bar{x}\pm t^{*}\frac{s}{\sqrt{n}}.$$
$t^{*}$ adalah nilai kritis dengan $df=n-1$. Kondisi: sampel acak, Normal/Sampel Besar (populasi normal, atau $n\ge 30$ oleh CLT, atau sampel kira-kira simetris tanpa pencilan), dan kondisi 10%. Interpretasikan interval dan tingkat kepercayaan dalam konteks.

Contoh terpecahkan. Sampel acak dari $n=25$ memiliki $\bar{x}=50$ dan $s=8$. Untuk interval $95\%$, $df=24$ memberikan $t^*=2.064$:

$$50\pm2.064\cdot\frac{8}{\sqrt{25}}=50\pm2.064(1.6)=50\pm3.3=(46.7,\ 53.3).$$

The t-distribution has a lower peak and heavier tails than the normal
Distribusi t memiliki puncak lebih rendah dan ekor lebih tebal daripada normal
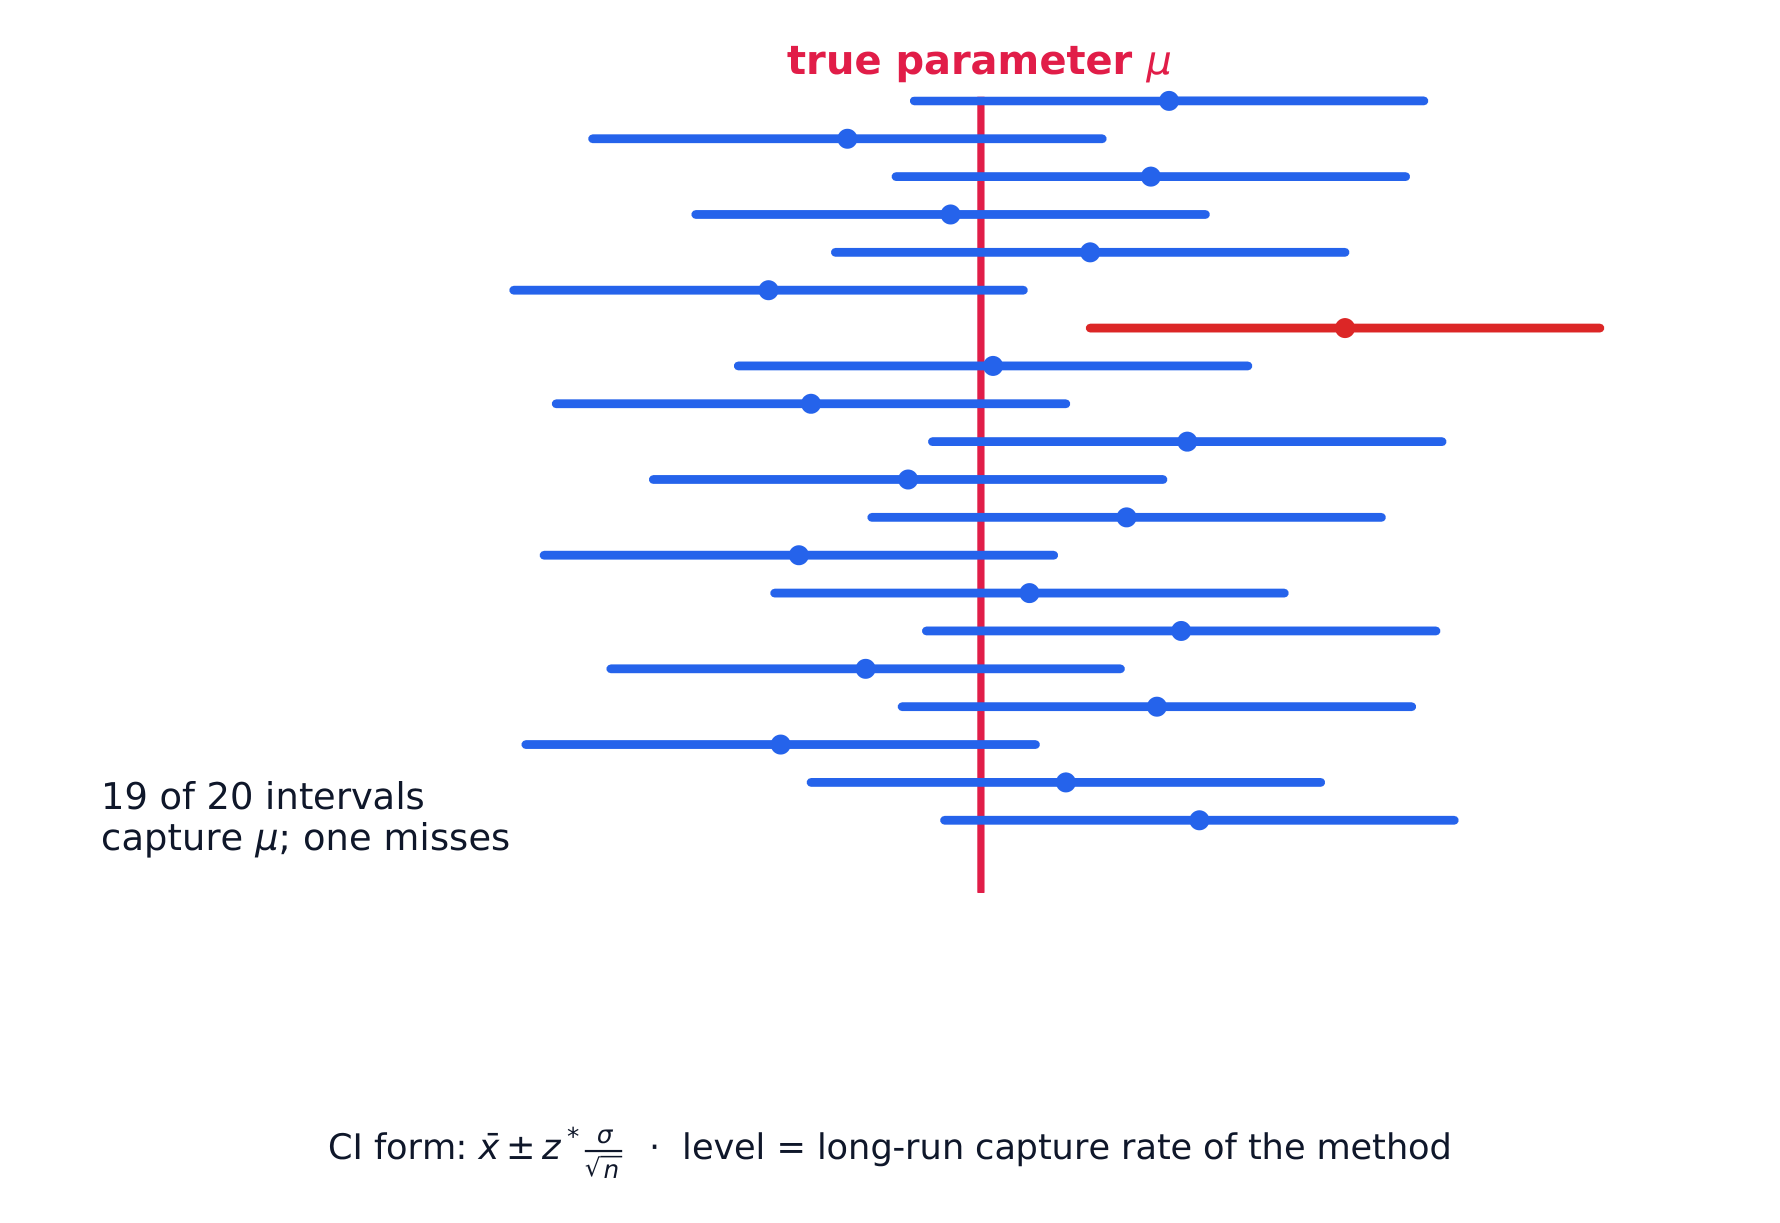
Interval kepercayaan 95 yang diulang: sekitar 95% menangkap parameter sejati
"Percaya 95%" menggambarkan metode, bukan satu interval: melalui banyak sampel sekitar 95% interval berisi $\mu$ dan sekitar 5% melewatkannya.
Explore · ⁨Jelajahi⁩

Why a t interval is wider than a z interval · ⁨Mengapa interval t lebih lebar daripada interval z⁩

A mean interval uses $t^*$, not $1.96$, because $\sigma$ is estimated by $s$. Drag df down and watch $t^*$ grow — at $df=10$ it is $2.228$, and the interval is wider for it. Drag df up and $t^*$ falls back toward $1.96$, which is why large samples may use $z$. · ⁨Interval rata-rata menggunakan $t^*$, bukan $1.96$, karena $\sigma$ diestimasi oleh $s$. Seret df ke bawah dan lihat $t^*$ bertambah besar — pada $df=10$ nilainya $2.228$, sehingga intervalnya lebih lebar. Seret df ke atas dan $t^*$ turun kembali menuju $1.96$, itulah sebabnya sampel besar mungkin menggunakan $z$.⁩

Vocabulary · ⁨Kosa kata⁩ Train · ⁨Latih⁩
English Bahasa Indonesia
distribution/ˌdɪstrɪˈbjuːʃn/ distribusi
degrees of freedom/dɪˈɡriːz ɒv ˈfriːdəm/ derajat kebebasan
paired data/peəd ˈdeɪtə/ data berpasangan
7.3

Justifying a Claim About a Mean · ⁨Membenarkan Klaim tentang Mean⁩

Syllabus · ⁨Silabus⁩
English

Enduring Understanding (UNC-4): An interval of values should be used to estimate parameters, in order to account for uncertainty.

Learning Objective UNC-4.S: Interpret a confidence interval for a population mean, including the mean difference between values in matched pairs. [Skill 4.B]

  • UNC-4.S.1 A confidence interval for a population mean either contains the population mean or it does not, because each interval is based on data from a random sample, which varies from sample to sample.
  • UNC-4.S.2 We are C% confident that the confidence interval for a population mean captures the population mean.
  • UNC-4.S.3 An interpretation of a confidence interval for a population mean includes a reference to the sample taken and details about the population it represents.
    • Illustrative examples for UNC-4.S.3: For interpreting a 96% confidence interval for mean foot length for all footprints found in a cave based on a particular randomly selected sample of footprints in the cave: "We are 96% confident that the mean foot length for all footprints found in the cave falls within the confidence interval" (based on 2000 FRQ 2).

Learning Objective UNC-4.T: Justify a claim based on a confidence interval for a population mean, including the mean difference between values in matched pairs. [Skill 4.D]

  • UNC-4.T.1 A confidence interval for a population mean provides an interval of values that may provide sufficient evidence to support a particular claim in context.

Learning Objective UNC-4.U: Identify the relationships between sample size, width of a confidence interval, confidence level, and margin of error for a population mean. [Skill 4.A]

  • UNC-4.U.1 When all other things remain the same, the width of a confidence interval for a population mean tends to decrease as the sample size increases.
  • UNC-4.U.2 For a single mean, the width of the interval is proportional to $\dfrac{1}{\sqrt{n}}$.
  • UNC-4.U.3 For a given sample, the width of the confidence interval for a population mean increases as the confidence level increases.
Bahasa Indonesia

Pemahaman Berkelanjutan (UNC-4): Interval nilai harus digunakan untuk memperkirakan parameter, guna mempertimbangkan ketidakpastian.

Tujuan Pembelajaran UNC-4.S: Interpretasikan interval kepercayaan untuk rata-rata populasi, termasuk selisih rata-rata antara nilai-nilai dalam pasangan berpasangan. [Keterampilan 4.B]

  • UNC-4.S.1 Interval kepercayaan untuk rata-rata populasi baik mengandung rata-rata populasi atau tidak, karena setiap interval didasarkan pada data dari sampel acak, yang bervariasi dari sampel ke sampel.
  • UNC-4.S.2 Kita yakin sebesar C% bahwa interval kepercayaan untuk rata-rata populasi mencakup rata-rata populasi.
  • UNC-4.S.3 Interpretasi interval kepercayaan untuk rata-rata populasi mencakup referensi terhadap sampel yang diambil dan detail tentang populasi yang diwakilinya.
    • Contoh ilustratif untuk UNC-4.S.3: Untuk menginterpretasikan interval kepercayaan 96% untuk panjang kaki rata-rata dari semua jejak kaki yang ditemukan di sebuah gua berdasarkan sampel acak tertentu dari jejak kaki di gua tersebut: "Kami memiliki keyakinan 96% bahwa panjang kaki rata-rata untuk semua jejak kaki yang ditemukan di gua berada dalam interval kepercayaan" (berdasarkan FRQ 2000 2).

Tujuan Pembelajaran UNC-4.T: Benarkan klaim berdasarkan interval kepercayaan untuk rata-rata populasi, termasuk selisih rata-rata antara nilai-nilai dalam pasangan berpasangan. [Keterampilan 4.D]

  • UNC-4.T.1 Interval kepercayaan untuk rata-rata populasi menyediakan rentang nilai yang mungkin memberikan bukti yang cukup untuk mendukung klaim tertentu dalam konteks.

Tujuan Pembelajaran UNC-4.U: Identifikasi hubungan antara ukuran sampel, lebar interval kepercayaan, tingkat kepercayaan, dan batas kesalahan untuk rata-rata populasi. [Keterampilan 4.A]

  • UNC-4.U.1 Ketika semua hal lainnya tetap sama, lebar interval kepercayaan untuk rata-rata populasi cenderung menurun seiring dengan peningkatan ukuran sampel.
  • UNC-4.U.2 Untuk satu rata-rata, lebar interval sebanding dengan $\dfrac{1}{\sqrt{n}}$.
  • UNC-4.U.3 Untuk suatu sampel tertentu, lebar interval kepercayaan untuk rata-rata populasi meningkat seiring dengan meningkatnya tingkat kepercayaan.

Source: College Board AP Course and Exam Description · ⁨Sumber: Deskripsi Kursus dan Ujian College Board AP⁩

English

As with proportions: a claimed mean inside the interval is plausible; outside the interval, the data give evidence against it. Answer in context using the plausible range.

Bahasa Indonesia

Seperti dengan proporsi: mean yang diklaim di dalam interval masuk akal; di luar interval, data memberikan bukti melawannya. Jawab dalam konteks menggunakan rentang yang masuk akal.

7.4

Setting Up a Test for a Mean · ⁨Menyiapkan Uji untuk Mean⁩

Syllabus · ⁨Silabus⁩
English

Enduring Understanding (VAR-7): The $t$-distribution may be used to model variation.

Learning Objective VAR-7.B: Identify an appropriate testing method for a population mean with unknown $\sigma$, including the mean difference between values in matched pairs. [Skill 1.E]

  • VAR-7.B.1 The appropriate test for a population mean with unknown $\sigma$ is a one-sample $t$-test for a population mean.
  • VAR-7.B.2 Matched pairs can be thought of as one sample of pairs. Once differences between pairs of values are found, inference for significance testing proceeds as for a population mean.

Learning Objective VAR-7.C: Identify the null and alternative hypotheses for a population mean with unknown $\sigma$, including the mean difference between values in matched pairs. [Skill 1.F]

  • VAR-7.C.1 The null hypothesis for a one-sample $t$-test for a population mean is $H_0 : \mu = \mu_0$, where $\mu_0$ is the hypothesized value. Depending upon the situation, the alternative hypothesis is $H_a : \mu < \mu_0$, or $H_a : \mu > \mu_0$, or $H_a : \mu \neq \mu_0$.
  • VAR-7.C.2 When finding the mean difference, $\mu_d$, between values in a matched pair, it is important to define the order of subtraction.

Learning Objective VAR-7.D: Verify the conditions for the test for a population mean, including the mean difference between values in matched pairs. [Skill 4.C]

  • VAR-7.D.1 In order to make statistical inferences when testing a population mean, we must check for independence and that the sampling distribution is approximately normal:
    • a. To check for independence:
      • i. Data should be collected using a random sample or a randomized experiment.
      • ii. When sampling without replacement, check that $n \leq 10\%N$.
    • b. To check that the sampling distribution of $\overline{x}$ is approximately normal (shape):
      • i. If the observed distribution is skewed, $n$ should be greater than 30.
      • ii. If the sample size is less than 30, the distribution of the sample data should be free from strong skewness and outliers.
Bahasa Indonesia

Pemahaman Abadi (VAR-7): Distribusi $t$ dapat digunakan untuk memodelkan variasi.

Tujuan Pembelajaran VAR-7.B: Identifikasi metode pengujian yang tepat untuk rata-rata populasi dengan $\sigma$ yang tidak diketahui, termasuk selisih rata-rata antara nilai dalam pasangan yang cocok. [Keterampilan 1.E]

  • VAR-7.B.1 Pengujian yang tepat untuk rata-rata populasi dengan $\sigma$ yang tidak diketahui adalah pengujian $t$-satu sampel untuk rata-rata populasi.
  • VAR-7.B.2 Pasangan yang cocok dapat dipandang sebagai satu sampel pasangan. Setelah perbedaan antar pasangan nilai ditemukan, inferensi untuk pengujian signifikansi proceeded seperti untuk rata-rata populasi.

Tujuan Pembelajaran VAR-7.C: Identifikasi hipotesis nol dan alternatif untuk rata-rata populasi dengan standar deviasi populasi ($\sigma$) yang tidak diketahui, termasuk perbedaan rata-rata antara nilai-nilai dalam pasangan yang cocok. [Skill 1.F]

  • VAR-7.C.1 Hipotesis nol untuk pengujian $t$-satu sampel untuk rata-rata populasi adalah $H_0 : \mu = \mu_0$, di mana $\mu_0$ adalah nilai yang diasumsikan. Bergantung pada situasinya, hipotesis alternatif adalah $H_a : \mu < \mu_0$, atau $H_a : \mu > \mu_0$, atau $H_a : \mu \neq \mu_0$.
  • VAR-7.C.2 Saat menemukan selisih rata-rata, $\mu_d$, antara nilai dalam pasangan yang cocok, penting untuk mendefinisikan urutan pengurangan.

Tujuan Pembelajaran VAR-7.D: Verifikasi kondisi untuk tes rata-rata populasi, termasuk selisih rata-rata antara nilai dalam pasangan yang cocok. [Keterampilan 4.C]

  • VAR-7.D.1 Agar dapat melakukan inferensi statistik saat menguji rata-rata populasi, kita harus memeriksa independensi dan bahwa distribusi sampling mendekati normal:
    • a. Untuk memeriksa kemandirian:
      • i. Data harus dikumpulkan menggunakan sampel acak atau eksperimen teracak.
      • ii. Ketika mengambil sampel tanpa pengembalian, periksa bahwa $n \leq 10\%N$.
    • b. Untuk memeriksa bahwa distribusi sampling dari $\overline{x}$ mendekati normal (bentuk):
      • i. Jika distribusi yang diamati miring, $n$ harus lebih besar dari 30.
      • ii. Jika ukuran sampel kurang dari 30, distribusi data sampel harus bebas dari kemiringan kuat dan pencilan.

Source: College Board AP Course and Exam Description · ⁨Sumber: Deskripsi Kursus dan Ujian College Board AP⁩

English
What a p-value means

State hypotheses about $\mu$: $H_0:\mu=\mu_0$ versus $H_a:\mu\neq\mu_0$ (or $<,>$). Check the same conditions. The one-sample $t$ statistic:

$$t=\frac{\bar{x}-\mu_0}{s/\sqrt{n}},\qquad df=n-1.$$

Worked example. Test $H_0:\mu=45$ against $H_a:\mu\neq45$ for the sample above ($\bar{x}=50$, $s=8$, $n=25$):

$$t=\frac{50-45}{8/\sqrt{25}}=\frac{5}{1.6}=3.13,\qquad df=24.$$
This $t$ is far out in the tail (two-tailed $p<0.01$), so reject $H_0$ – strong evidence the mean is not $45$. Notice $45$ also falls outside the $95\%$ interval $(46.7,53.3)$, the same conclusion by two routes.

Bahasa Indonesia
Apa makna nilai-p

Nyatakan hipotesis tentang $\mu$: $H_0:\mu=\mu_0$ versus $H_a:\mu\neq\mu_0$ (atau $<,>$). Periksa kondisi yang sama. Statistik satu-sampel $t$:

$$t=\frac{\bar{x}-\mu_0}{s/\sqrt{n}},\qquad df=n-1.$$

Contoh terpecahkan. Uji $H_0:\mu=45$ terhadap $H_a:\mu\neq45$ untuk sampel di atas ($\bar{x}=50$, $s=8$, $n=25$):

$$t=\frac{50-45}{8/\sqrt{25}}=\frac{5}{1.6}=3.13,\qquad df=24.$$
$t$ ini jauh di ekor ($p<0.01$ dua-sided), jadi tolak $H_0$ – bukti kuat bahwa mean bukan $45$. Perhatikan $45$ juga jatuh di luar interval $95\%$ $(46.7,53.3)$, kesimpulan yang sama melalui dua jalur.

7.5

Carrying Out a Test for a Mean · ⁨Melakukan Uji untuk Mean⁩

Syllabus · ⁨Silabus⁩
English

Enduring Understanding (VAR-7): The $t$-distribution may be used to model variation.

Learning Objective VAR-7.E: Calculate an appropriate test statistic for a population mean, including the mean difference between values in matched pairs. [Skill 3.E]

  • VAR-7.E.1 For a single quantitative variable when random sampling with replacement from a population that can be modeled with a normal distribution with mean $\mu$ and standard deviation $\sigma$, the sampling distribution of $t = \dfrac{\overline{x} - \mu}{\frac{s}{\sqrt{n}}}$ has a $t$-distribution with $n - 1$ degrees of freedom.

Boundary statement: The formulas for test statistics do not appear explicitly on the AP Statistics Formula Sheet provided with the AP Statistics Exam. However, these formulas do not need to be memorized, as they can be constructed based on the general test statistic formula and the relevant standard error formulas that are provided on the formula sheet.

Enduring Understanding (DAT-3): Significance testing allows us to make decisions about hypotheses within a particular context.

Learning Objective DAT-3.E: Interpret the $p$-value of a significance test for a population mean, including the mean difference between values in matched pairs. [Skill 4.B]

  • DAT-3.E.1 An interpretation of the $p$-value of a significance test for a population mean should recognize that the $p$-value is computed by assuming that the null hypothesis is true, i.e., by assuming that the true population mean is equal to the particular value stated in the null hypothesis.

Learning Objective DAT-3.F: Justify a claim about the population based on the results of a significance test for a population mean. [Skill 4.E]

  • DAT-3.F.1 A formal decision explicitly compares the $p$-value to the significance $\alpha$. If the $p$-value $\leq \alpha$, then reject the null hypothesis, $H_0 : \mu = \mu_0$. If the $p$-value $> \alpha$, then fail to reject the null hypothesis.
  • DAT-3.F.2 The results of a significance test for a population mean can serve as the statistical reasoning to support the answer to a research question about the population that was sampled.
Bahasa Indonesia

Pemahaman Abadi (VAR-7): Distribusi $t$ dapat digunakan untuk memodelkan variasi.

Tujuan Pembelajaran VAR-7.E: Hitung statistik uji yang sesuai untuk rata-rata populasi, termasuk selisih rata-rata antara nilai dalam pasangan yang cocok. [Keterampilan 3.E]

  • VAR-7.E.1 Untuk satu variabel kuantitatif ketika pengambilan sampel acak dengan pengembalian dari populasi yang dapat dimodelkan dengan distribusi normal dengan mean $\mu$ dan simpangan baku $\sigma$, distribusi sampling dari $t = \dfrac{\overline{x} - \mu}{\frac{s}{\sqrt{n}}}$ memiliki distribusi $t$ dengan $n - 1$ derajat kebebasan.

Pernyataan Batas: Rumus untuk statistik uji tidak muncul secara eksplisit di Lembar Rumus AP Statistics yang disediakan dengan Ujian AP Statistics. Namun, rumus-rumus ini tidak perlu dihafal, karena dapat disusun berdasarkan rumus statistik uji umum dan rumus galar standar relevan yang disediakan di lembar rumus.

Pemahaman Berkelanjutan (DAT-3): Pengujian signifikansi memungkinkan kita membuat keputusan tentang hipotesis dalam konteks tertentu.

Tujuan Pembelajaran DAT-3.E: Interpretasikan nilai $p$ dari pengujian signifikansi untuk rata-rata populasi, termasuk selisih rata-rata antara nilai dalam pasangan yang cocok. [Keterampilan 4.B]

  • DAT-3.E.1 Interpretasi nilai $p$ dari pengujian signifikansi untuk rata-rata populasi harus mengakui bahwa nilai $p$ dihitung dengan mengasumsikan bahwa hipotesis nol benar, yaitu dengan mengasumsikan bahwa rata-rata populasi sejati sama dengan nilai tertentu yang dinyatakan dalam hipotesis nol.

Tujuan Pembelajaran DAT-3.F: Justifikasi klaim tentang populasi berdasarkan hasil pengujian signifikansi untuk rata-rata populasi. [Keterampilan 4.E]

  • DAT-3.F.1 Keputusan formal secara eksplisit membandingkan nilai $p$ dengan tingkat signifikansi $\alpha$. Jika nilai $p$ $\leq \alpha$, maka tolak hipotesis nol, $H_0 : \mu = \mu_0$. Jika nilai $p$ $> \alpha$, maka gagal menolak hipotesis nol.
  • DAT-3.F.2 Hasil pengujian signifikansi untuk rata-rata populasi dapat berfungsi sebagai alasan statistik untuk mendukung jawaban atas pertanyaan penelitian tentang populasi yang telah diambil sampelnya.

Source: College Board AP Course and Exam Description · ⁨Sumber: Deskripsi Kursus dan Ujian College Board AP⁩

English

Find the $p$-value from the $t$-distribution with $df=n-1$, compare to $\alpha$, and conclude in context – reject or fail to reject $H_0$, then state what that means for the claim. Show the test name, statistic, $df$, and $p$-value.

Bahasa Indonesia

Temukan nilai-$p$ dari distribusi-$t$ dengan $df=n-1$, bandingkan dengan $\alpha$, dan simpulkan dalam konteks – tolak atau gagal tolak $H_0$, lalu nyatakan apa itu berarti untuk klaim. Tunjukkan nama uji, statistik, $df$, dan nilai-$p$.

Explore · ⁨Jelajahi⁩

Read a p-value off the t curve · ⁨Baca nilai-p dari kurva t⁩

The p-value is the shaded tail area beyond your $t$ statistic — both tails for a two-tailed $H_a$. The dashed normal curve behind $t$ shows what you would have got by wrongly using $z$: at small df the $t$ tail is visibly fatter, so the true p-value is larger than the normal would suggest. · ⁨Nilai-p adalah area ekor yang diarsir di luar statistik $t$ Anda — kedua ekor untuk uji dua-arah $H_a$. Kurva normal putus-putus di belakang $t$ menunjukkan apa yang akan Anda dapatkan dengan salah menggunakan $z$: pada df kecil, ekor $t$ terlihat lebih tebal, sehingga nilai-p sebenarnya lebih besar daripada yang disarankan kurva normal.⁩

7.6

Confidence Interval for a Difference of Two Means · ⁨Interval Kepercayaan untuk Selisih Dua Mean⁩

Syllabus · ⁨Silabus⁩
Enduring UnderstandingLearning ObjectiveEssential Knowledge

UNC-4
An interval of values should be used to estimate parameters, in order to account for uncertainty.

UNC-4.V
Identify an appropriate confidence interval procedure for a difference of two population means. [Skill 1.D]

  • UNC-4.V.1 Consider a simple random sample from population 1 of size $n_1$, mean $\mu_1$, and standard deviation $\sigma_1$ and a second simple random sample from population 2 of size $n_2$, mean $\mu_2$, and standard deviation $\sigma_2$. If the distributions of populations 1 and 2 are normal or if both $n_1$ and $n_2$ are greater than 30, then the sampling distribution of the difference of means, $\overline{x}_1 - \overline{x}_2$ is also normal. The mean for the sampling distribution of $\overline{x}_1 - \overline{x}_2$ is $\mu_1 - \mu_2$. The standard deviation of $\overline{x}_1 - \overline{x}_2$ is $\sqrt{\dfrac{(\sigma_1)^2}{n_1} + \dfrac{(\sigma_2)^2}{n_2}}$.
  • UNC-4.V.2 The appropriate confidence interval procedure for one quantitative variable for two independent samples is a two-sample $t$-interval for a difference between population means.

UNC-4.W
Verify the conditions to calculate confidence intervals for the difference of two population means. [Skill 4.C]

  • UNC-4.W.1 In order to calculate confidence intervals to estimate a difference of population means, we must check for independence and that the sampling distribution is approximately normal:
    • a. To check for independence:
      • i. Data should be collected using two independent, random samples or a randomized experiment.
      • ii. When sampling without replacement, check that $n_1 \leq 10\%N_1$ and $n_2 \leq 10\%N_2$.
    • b. To check that the sampling distribution of $(\overline{x}_1 - \overline{x}_2)$ should be approximately normal (shape):
      • i. If the observed distributions are skewed, both $n_1$ and $n_2$ should be greater than 30.

UNC-4.X
Determine the margin of error for the difference of two population means. [Skill 3.D]

  • UNC-4.X.1 For the difference of two sample means, the margin of error is the critical value ($t^*$) times the standard error ($SE$) of the difference of two means.
  • UNC-4.X.2 The standard error for the difference in two sample means with sample standard deviations, $s_1$ and $s_2$, is $\sqrt{\dfrac{(s_1)^2}{n_1} + \dfrac{(s_2)^2}{n_2}}$.

UNC-4.Y
Calculate an appropriate confidence interval for a difference of two population means. [Skill 3.D]

  • UNC-4.Y.1 The point estimate for the difference of two population means is the difference in sample means, $\overline{x}_1 - \overline{x}_2$.
  • UNC-4.Y.2 For a difference of two population means where the population standard deviations are not known, the confidence interval is $(\overline{x}_1 - \overline{x}_2) \pm t^* \sqrt{\dfrac{s_1^2}{n_1} + \dfrac{s_2^2}{n_2}}$ where $\pm t^*$ are the critical values for the central C% of a $t$-distribution with appropriate degrees of freedom that can be found using technology.

Boundary statement: Formulas for interval estimates do not appear explicitly on the AP Statistics Formula Sheet provided with the AP Statistics Exam. However, these formulas do not need to be memorized, as they can be constructed based on the general test statistic formula and the relevant standard error formulas that are provided on the formula sheet.

Source: College Board AP Course and Exam Description · ⁨Sumber: Deskripsi Kursus dan Ujian College Board AP⁩

English

For independent samples, estimate $\mu_1-\mu_2$:

$$(\bar{x}_1-\bar{x}_2)\pm t^{*}\sqrt{\frac{s_1^2}{n_1}+\frac{s_2^2}{n_2}}.$$
Conditions must hold in both samples. (Use technology for the $df$; do not pool the variances on the AP exam.)

Bahasa Indonesia

Untuk sampel independen, estimasi $\mu_1-\mu_2$:

$$(\bar{x}_1-\bar{x}_2)\pm t^{*}\sqrt{\frac{s_1^2}{n_1}+\frac{s_2^2}{n_2}}.$$
Kondisi harus terpenuhi di kedua sampel. (Gunakan teknologi untuk $df$; jangan gabungkan varians pada ujian AP.)

Randomisasi mendasari perbandingan yang adil antara dua kelompok dalam uji selisih rata-rata
7.7

Justifying a Claim About Two Means · ⁨Membenarkan Klaim tentang Dua Rata-rata⁩

Syllabus · ⁨Silabus⁩
English

Enduring Understanding (UNC-4): An interval of values should be used to estimate parameters, in order to account for uncertainty.

Learning Objective UNC-4.Z: Interpret a confidence interval for a difference of population means. [Skill 4.B]

  • UNC-4.Z.1 In repeated random sampling with the same sample size, approximately C% of confidence intervals created will capture the difference of population means.
  • UNC-4.Z.2 An interpretation for a confidence interval for the difference of two population means should include a reference to the samples taken and details about the populations they represent.
    • Illustrative examples for UNC-4.Z.2: For interpreting a confidence interval for a difference between mean response times for two fire stations (northern - southern): "Based on these samples, one can be 95 percent confident that the difference in the population mean response times (northern - southern) is between -2.37 minutes and 0.37 minutes" (2009 FRQ 4).

Learning Objective UNC-4.AA: Justify a claim based on a confidence interval for a difference of population means. [Skill 4.D]

  • UNC-4.AA.1 A confidence interval for a difference of population means provides an interval of values that may provide sufficient evidence to support a particular claim in context.

Learning Objective UNC-4.AB: Identify the effects of sample size on the width of a confidence interval for the difference of two means. [Skill 4.A]

  • UNC-4.AB.1 When all other things remain the same, the width of the confidence interval for the difference of two means tends to decrease as the sample sizes increase.
Bahasa Indonesia

Pemahaman Berkelanjutan (UNC-4): Interval nilai harus digunakan untuk memperkirakan parameter, guna mempertimbangkan ketidakpastian.

Tujuan Pembelajaran UNC-4.Z: Interpretasikan interval kepercayaan untuk perbedaan mean populasi. [Skill 4.B]

  • UNC-4.Z.1 Dalam pengambilan sampel acak berulang dengan ukuran sampel yang sama, sekitar C% dari interval kepercayaan yang dibuat akan mencakup perbedaan mean populasi.
  • UNC-4.Z.2 Interpretasi untuk interval kepercayaan untuk perbedaan dua mean populasi harus menyertakan referensi terhadap sampel yang diambil dan detail mengenai populasi yang mereka wakili.
    • Contoh ilustratif untuk UNC-4.Z.2: Untuk menginterpretasikan interval kepercayaan untuk perbedaan waktu respons rata-rata antara dua stasiun pemadam kebakaran (utara - selatan): "Berdasarkan sampel ini, seseorang dapat yakin 95 persen bahwa perbedaan rata-rata waktu respons populasi (utara - selatan) berada antara -2.37 menit dan 0.37 menit" (FRQ 2009 4).

Tujuan Pembelajaran UNC-4.AA: Benarkan sebuah klaim berdasarkan interval kepercayaan untuk perbedaan mean populasi. [Skill 4.D]

  • UNC-4.AA.1 Interval kepercayaan untuk perbedaan mean populasi menyediakan rentang nilai yang mungkin memberikan bukti yang cukup untuk mendukung klaim tertentu dalam konteksnya.

Tujuan Pembelajaran UNC-4.AB: Identifikasi efek ukuran sampel pada lebar interval kepercayaan untuk perbedaan dua mean. [Skill 4.A]

  • UNC-4.AB.1 Ketika semua hal lainnya tetap sama, lebar interval kepercayaan untuk perbedaan dua mean cenderung menurun seiring dengan peningkatan ukuran sampel.

Source: College Board AP Course and Exam Description · ⁨Sumber: Deskripsi Kursus dan Ujian College Board AP⁩

English

If the interval for $\mu_1-\mu_2$ contains $0$, the data are consistent with equal means; if it excludes $0$, there is evidence of a difference in that direction. Interpret in context.

Bahasa Indonesia

Jika interval untuk $\mu_1-\mu_2$ memuat $0$, data konsisten dengan rata-rata yang sama; jika tidak memuat $0$, terdapat bukti adanya perbedaan ke arah tersebut. Interpretasikan dalam konteks.

7.8

Setting Up a Test for a Difference of Means · ⁨Menyiapkan Uji Selisih Rata-rata⁩

Syllabus · ⁨Silabus⁩
Enduring UnderstandingLearning ObjectiveEssential Knowledge

VAR-7
The $t$-distribution may be used to model variation.

VAR-7.F
Identify an appropriate selection of a testing method for a difference of two population means. [Skill 1.E]

  • VAR-7.F.1 For a quantitative variable, the appropriate test for a difference of two population means is a two-sample $t$-test for a difference of two population means.

VAR-7.G
Identify the null and alternative hypotheses for a difference of two population means. [Skill 1.F]

  • VAR-7.G.1 The null hypothesis for a two-sample $t$-test for a difference of two population means, $\mu_1$ and $\mu_2$, is: $H_0 : \mu_1 - \mu_2 = 0$, or $H_0 : \mu_1 = \mu_2$. The alternative hypothesis is $H_a : \mu_1 - \mu_2 < 0$, or $H_a : \mu_1 - \mu_2 > 0$, or $H_a : \mu_1 - \mu_2 \neq 0$, or $H_a : \mu_1 > \mu_2$, or $H_a : \mu_1 < \mu_2$, or $H_a : \mu_1 \neq \mu_2$.

VAR-7.H
Verify the conditions for the significance test for the difference of two population means. [Skill 4.C]

  • VAR-7.H.1 In order to make statistical inferences when testing a difference between population means, we must check for independence and that the sampling distribution is approximately normal:
    • a. Individual observations should be independent:
      • i. Data should be collected using simple random samples or a randomized experiment.
      • ii. When sampling without replacement, check that $n_1 \leq 10\%N_1$ and $n_2 \leq 10\%N_2$.
    • b. The sampling distribution of $\overline{x}_1 - \overline{x}_2$ should be approximately normal (shape).
      • i. If the observed distribution is skewed, both $n_1$ and $n_2$ should be greater than 30.
      • ii. If the sample size is less than 30, the distribution of the sample data should be free from strong skewness and outliers. This should be checked for BOTH samples.

Source: College Board AP Course and Exam Description · ⁨Sumber: Deskripsi Kursus dan Ujian College Board AP⁩

English

Hypotheses: $H_0:\mu_1=\mu_2$ versus $H_a:\mu_1\neq\mu_2$ (or $<,>$). Distinguish two independent samples from paired data 配对数据 – for paired data (before/after, matched subjects), first take the differences and run a one-sample $t$ procedure on them.

Bahasa Indonesia

Hipotesis: $H_0:\mu_1=\mu_2$ versus $H_a:\mu_1\neq\mu_2$ (atau $<,>$). Bedakan dua sampel independen dari data berpasangan – untuk data berpasangan (sebelum/sesudah, subjek yang cocok), pertama-tama hitung selisihnya dan lakukan prosedur satu-sampel $t$ pada selisih tersebut.

7.9

Carrying Out a Test for a Difference of Means · ⁨Melaksanakan Uji Selisih Rata-rata⁩

Syllabus · ⁨Silabus⁩
Enduring UnderstandingLearning ObjectiveEssential Knowledge

VAR-7
The $t$-distribution may be used to model variation.

VAR-7.I
Calculate an appropriate test statistic for a difference of two means. [Skill 3.E]

  • VAR-7.I.1 For a single quantitative variable, data collected using independent random samples or a randomized experiment from two populations, each of which can be modeled with a normal distribution, the sampling distribution of $t = \dfrac{(\overline{x}_1 - \overline{x}_2) - (\mu_1 - \mu_2)}{\sqrt{\dfrac{s_1^2}{n_1} + \dfrac{s_2^2}{n_2}}}$ is an approximate $t$-distribution with degrees of freedom that can be found using technology. The degrees of freedom fall between the smaller of $n_1 - 1$ and $n_2 - 1$ and $n_1 + n_2 - 2$.
    • Illustrative examples for VAR-7.I.1: In a study comparing mean recovery times for two surgical procedures to repair a torn anterior cruciate ligament (ACL), the group receiving one procedure had a sample size of 110, while the group receiving the other procedure had a sample size of 100. The degrees of freedom fall between 100 (the smaller of 110 and 100) and 208 (110 + 100 - 2). The degrees of freedom may be determined using technology. If the test statistic for this study is $t \approx 7.13$, then the $p$-value is the area greater than 7.13 for a $t$-distribution with $df = 207.18$ (2018 FRQ 4).

Boundary statement: The formulas for test statistics do not appear explicitly on the AP Statistics Formula Sheet provided with the AP Statistics Exam. However, these formulas do not need to be memorized, as they can be constructed based on the general test statistic formula and the standard error formulas for each of the relevant test statistics that are provided on the formula sheet.

DAT-3
Significance testing allows us to make decisions about hypotheses within a particular context.

DAT-3.G
Interpret the $p$-value of a significance test for a difference of population means. [Skill 4.B]

  • DAT-3.G.1 An interpretation of the $p$-value of a significance test for a two-sample difference of population means should recognize that the $p$-value is computed by assuming that the null hypothesis is true, i.e., by assuming that the true population means are equal to each other.

DAT-3.H
Justify a claim about the population based on the results of a significance test for a difference of two population means in context. [Skill 4.E]

  • DAT-3.H.1 A formal decision explicitly compares the $p$-value to the significance $\alpha$. If the $p$-value $\leq \alpha$, then reject the null hypothesis, $H_0 : \mu_1 - \mu_2 = 0$, or $H_0 : \mu_1 = \mu_2$. If the $p$-value $> \alpha$, then fail to reject the null hypothesis.
  • DAT-3.H.2 The results of a significance test for a two-sample test for a difference between two population means can serve as the statistical reasoning to support the answer to a research question about the populations that were sampled.

Source: College Board AP Course and Exam Description · ⁨Sumber: Deskripsi Kursus dan Ujian College Board AP⁩

English

The two-sample $t$ statistic:

$$t=\frac{(\bar{x}_1-\bar{x}_2)-0}{\sqrt{\frac{s_1^2}{n_1}+\frac{s_2^2}{n_2}}}.$$
Get the $p$-value (technology for $df$), compare to $\alpha$, conclude in context.

Bahasa Indonesia

Statistik dua-sampel $t$:

$$t=\frac{(\bar{x}_1-\bar{x}_2)-0}{\sqrt{\frac{s_1^2}{n_1}+\frac{s_2^2}{n_2}}}.$$
Dapatkan nilai-$p$ (teknologi untuk $df$), bandingkan dengan $\alpha$, dan buat kesimpulan dalam konteks.

7.10

Selecting and Communicating a Procedure · ⁨Memilih dan Mengomunikasikan Prosedur⁩

Syllabus · ⁨Silabus⁩
English

This topic is intended to focus on the skill of selecting an appropriate inference procedure, now that students have a range of options. Students should be given opportunities to practice when and how to apply all learning objectives relating to inference involving proportions or means.

Bahasa Indonesia

Topik ini bertujuan untuk fokus pada keterampilan memilih prosedur inferensi yang tepat, sekarang bahwa siswa memiliki berbagai pilihan. Siswa harus diberikan kesempatan untuk berlatih kapan dan bagaimana menerapkan semua tujuan pembelajaran yang berkaitan dengan inferensi melibatkan proporsi atau rata-rata.

Source: College Board AP Course and Exam Description · ⁨Sumber: Deskripsi Kursus dan Ujian College Board AP⁩

English

The hardest exam skill is choosing the right procedure: one or two samples? proportion or mean? paired or independent? confidence interval or test? Read the question for what is being estimated or claimed, then name the procedure, check its conditions, carry it out, and communicate the conclusion clearly with numbers and context.

Bahasa Indonesia

Keterampilan ujian terberat adalah memilih prosedur yang tepat: satu atau dua sampel? proporsi atau rata-rata? berpasangan atau independen? interval kepercayaan atau uji? Bacalah pertanyaan untuk mengetahui apa yang diestimasi atau diklaim, lalu sebutkan namanya, periksa kondisinya, jalankan prosedurnya, dan komunikasikan kesimpulannya dengan jelas menggunakan angka dan konteks.

7.10

Exam tips · ⁨Tips ujian⁩

English
  • Use t-procedures for means (population $\sigma$ unknown) — the t-distribution has heavier tails than normal.
  • Check conditions: random, independent, and roughly normal (or large $n$).
  • Interpret an interval and a test in context, always tied to the parameter (the true mean).
  • Match the right procedure: one-sample, two-sample, or paired (look for a natural pairing).
  • State the degrees of freedom; for a two-sample $t$-test use technology's value (or, by hand, the conservative smaller $n-1$).
Bahasa Indonesia
  • Gunakan prosedur t untuk rata-rata (standar deviasi populasi $\sigma$ tidak diketahui) – distribusi t memiliki ekor lebih tebal daripada normal.
  • Periksa kondisi: acak, independen, dan kira-kira normal (atau ukuran $n$ besar).
  • Interpretasikan interval dan uji dalam konteks, selalu terkait dengan parameternya (rata-rata sejati).
  • Cocokkan prosedur yang tepat: satu-sampel, dua-sampel, atau berpasangan (perhatikan adanya pasangan alami).
  • Nyatakan derajat kebebasan; untuk uji-$t$ dua-sampel gunakan nilai teknologi (atau, secara manual, nilai ⟨$n-1$⟩ konservatif yang lebih kecil).

Interactive lessons on this topic · ⁨Pelajaran interaktif untuk topik ini⁩

Work through it step by step, with instant-check exercises. · ⁨Kerjakan langkah demi langkah, dengan latihan pengecekan instan.⁩

Past Papers · ⁨Soal-Soil Masa Lalu⁩

More topics in AP Statistics · ⁨AP Statistik⁩ · ⁨Topik lain dalam AP Statistics · ⁨AP Statistik⁩⁩

Log in or create account · ⁨Masuk atau buat akun⁩

IGCSE, A-Level & AP