Skip to content · ⁨الانتقال إلى المحتوى⁩

Inference for Quantitative Data: Means · ⁨الاستدلال للبيانات الكمية: المتوسطات⁩

AP Statistics · ⁨AP الإحصاء⁩ · Topic 7 · ⁨الموضوع 7⁩

Video lesson for this topic · ⁨درس فيديو لهذا الموضوع⁩ Open the video page · ⁨افتح صفحة الفيديو⁩
7:38

الاستدلال للبيانات الكمية: المتوسطات

أنت تعرف بالفعل جوهر الاستنتاج. خذ عينة، أوجد متوسطها، ثم افعل ذلك مراراً وتكراراً. حتى عندما تكونPopulation مائلة، تلك المتوسطات…

English narration · English + 中文 subtitles burned in · ⁨سرد باللغة الإنجليزية · ترجمة مدمجة بالإنجليزية + الصينية⁩

7.1

Should I Worry About Error? · ⁨هل يجب أن أقلق بشأن الخطأ؟⁩

Syllabus · ⁨المنهج⁩
English

Enduring Understanding (VAR-1): Given that variation may be random or not, conclusions are uncertain.

Learning Objective VAR-1.I: Identify questions suggested by probabilities of errors in statistical inference. [Skill 1.A]

  • VAR-1.I.1 Random variation may result in errors in statistical inference.
العربية

الفهم الدائم (VAR-1): بما أن التباين قد يكون عشوائياً أو غير ذلك، فإن الاستنتاجات تكون غير مؤكدة.

الهدف التعليمي VAR-1.I: تحديد الأسئلة المقترحة من احتمالات الأخطاء في الاستدلال الإحصائي. [مهارة 1.A]

  • VAR-1.I.1 قد تؤدي التباين العشوائي إلى أخطاء في الاستدلال الإحصائي.

Source: College Board AP Course and Exam Description · ⁨المصدر: وصف دورة وامتحان College Board AP⁩

English
Type I and Type II errors

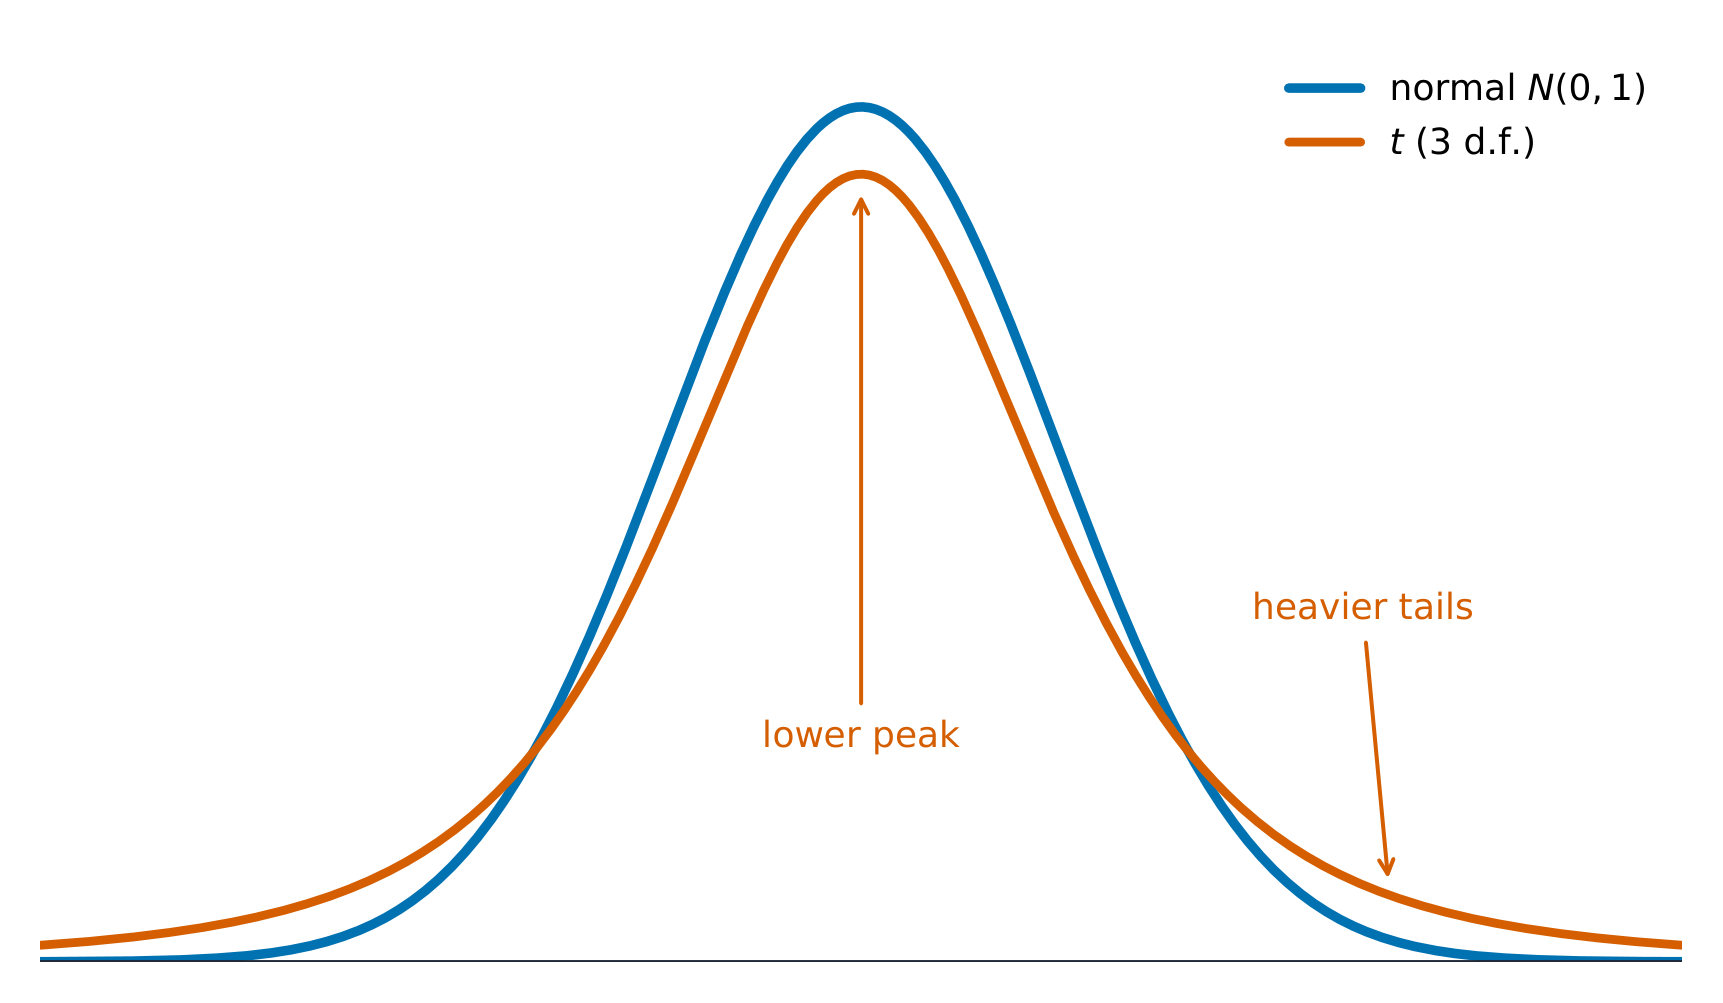
Inference for a mean works like inference for a proportion, with one change: we rarely know the population standard deviation $\sigma$, so we estimate it with the sample $s$. That extra uncertainty means we use the $t$-distribution instead of the normal – a distribution 分布 that is bell-shaped but with heavier tails, and it depends on the degrees of freedom 自由度 $df=n-1$; as $n$ grows it approaches the normal.

العربية
أخطاء النوع الأول والنوع الثاني

يعمل الاستنتاج للـ متوسط مثل الاستنتاج للنسبة، مع تغيير واحد: نادراً ما نعرف انحرافاً معيارياً للسكان $\sigma$، لذا نقدره بعينة $s$. إن هذه الشكوك الإضافية تعني أننا نستخدم توزيع $t$ بدلاً من التوزيع الطبيعي – وهو توزيع له شكل جرس لكن بذيول أثقل، ويعتمد على درجات الحرية $df=n-1$؛ كلما كبر $n$ اقترب من التوزيع الطبيعي.

Vocabulary · ⁨مفردات⁩ Train · ⁨تدريب⁩
English العربية
distribution/ˌdɪstrɪˈbjuːʃn/ التوزيع
degrees of freedom/dɪˈɡriːz ɒv ˈfriːdəm/ درجات الحرية
paired data/peəd ˈdeɪtə/ البيانات المترابطة
7.2

Confidence Interval for a Mean · ⁨فترة الثقة للمتوسط⁩

Syllabus · ⁨المنهج⁩
English

Enduring Understanding (VAR-7): The $t$-distribution may be used to model variation.

Learning Objective VAR-7.A: Describe $t$-distributions. [Skill 3.C]

  • VAR-7.A.1 When $s$ is used instead of $\sigma$ to calculate a test statistic, the corresponding distribution, known as the $t$-distribution, varies from the normal distribution in shape, in that more of the area is allocated to the tails of the density curve than in a normal distribution.
  • VAR-7.A.2 As the degrees of freedom increase, the area in the tails of a $t$-distribution decreases.

Enduring Understanding (UNC-4): An interval of values should be used to estimate parameters, in order to account for uncertainty.

Learning Objective UNC-4.O: Identify an appropriate confidence interval procedure for a population mean, including the mean difference between values in matched pairs. [Skill 1.D]

  • UNC-4.O.1 Because $\sigma$ is typically not known for distributions of quantitative variables, the appropriate confidence interval procedure for estimating the population mean of one quantitative variable for one sample is a one-sample $t$-interval for a mean.
  • UNC-4.O.2 For one quantitative variable, $X$, that is normally distributed, the distribution of $t = \dfrac{(\overline{x} - \mu)}{\frac{s}{\sqrt{n}}}$ is a $t$-distribution with $n-1$ degrees of freedom.
  • UNC-4.O.3 Matched pairs can be thought of as one sample of pairs. Once differences between pairs of values are found, inference for confidence intervals proceeds as for a population mean.

Learning Objective UNC-4.P: Verify the conditions for calculating confidence intervals for a population mean, including the mean difference between values in matched pairs. [Skill 4.C]

  • UNC-4.P.1 In order to calculate confidence intervals to estimate a population mean, we must check for independence and that the sampling distribution is approximately normal:
    • a. To check for independence:
      • i. Data should be collected using a random sample or a randomized experiment.
      • ii. When sampling without replacement, check that $n \leq 10\%N$, where $N$ is the size of the population.
    • b. To check that the sampling distribution of $\overline{x}$ is approximately normal (shape):
      • i. If the observed distribution is skewed, $n$ should be greater than 30.
      • ii. If the sample size is less than 30, the distribution of the sample data should be free from strong skewness and outliers.

Learning Objective UNC-4.Q: Determine the margin of error for a given sample size for a one-sample $t$-interval. [Skill 3.D]

  • UNC-4.Q.1 The critical value $t^*$ with $n-1$ degrees of freedom can be found using a table or computer-generated output.
  • UNC-4.Q.2 The standard error for a sample mean is given by $SE = \dfrac{s}{\sqrt{n}}$, where $s$ is the sample standard deviation.
  • UNC-4.Q.3 For a one-sample $t$-interval for a mean, the margin of error is the critical value ($t^*$) times the standard error ($SE$), which equals $t^*\left(\dfrac{s}{\sqrt{n}}\right)$.

Learning Objective UNC-4.R: Calculate an appropriate confidence interval for a population mean, including the mean difference between values in matched pairs. [Skill 3.D]

  • UNC-4.R.1 The point estimate for a population mean is the sample mean, $\overline{x}$.
  • UNC-4.R.2 For the population mean for one sample with unknown population standard deviation, the confidence interval is $\overline{x} \pm t^* \dfrac{s}{\sqrt{n}}$.

Boundary statement: Formulas for interval estimates do not appear explicitly on the AP Statistics Formula Sheet provided with the AP Statistics Exam. However, these formulas do not need to be memorized, as they can be constructed based on the general test statistic formula and the relevant standard error formulas that are provided on the formula sheet.

العربية

الفهم الدائم (VAR-7): يمكن استخدام توزيع $t$ لنمذجة التباين.

الهدف التعليمي VAR-7.A: وصف توزيعات $t$. [مهارة 3.C]

  • VAR-7.A.1 عندما يُستخدم $s$ بدلاً من $\sigma$ لحساب إحصاء اختبار، فإن التوزيع المقابل، المعروف بتوزيع $t$، يختلف عن التوزيع الطبيعي من حيث الشكل، حيث يتم تخصيص مساحة أكبر في ذيول منحنى الكثافة مقارنة بالتوزيع الطبيعي.
  • VAR-7.A.2 مع زيادة درجات الحرية، تقل المساحة فيذيول توزيع $t$.

الفهم الدائم (UNC-4): يجب استخدام فترة من القيم لتقدير المعايير، وذلك لحساب عدم اليقين.

الهدف التعليمي UNC-4.O: تحديد إجراء فترة الثقة المناسب لمتوسط مجتمع، بما في ذلك متوسط الفرق بين القيم في الأزواج المزدوجة. [مهارة 1.D]

  • UNC-4.O.1 نظرًا لأن $\sigma$ عادة ما يكون غير معروف لتوزيعات المتغيرات الكمية، فإن إجراء فترة الثقة المناسب لتقدير متوسط المجتمع لمتغير كمي واحد لعينة واحدة هو فترة $t$ لعينة واحدة لمتوسط.
  • UNC-4.O.2 لمتغير كمي واحد، $X$، الذي يتبع توزيعًا طبيعيًا، فإن توزيع $t = \dfrac{(\overline{x} - \mu)}{\frac{s}{\sqrt{n}}}$ هو توزيع $t$ بـ $n-1$ درجات حرية.
  • UNC-4.O.3 يمكن اعتبار الأزواج المزدوجة كمجموعة عينة واحدة من الأزواج. بمجرد إيجاد الفروقات بين أزواج القيم، يستمر الاستدلال لفترات الثقة كما لو كان الأمر يتعلق بمتوسط مجتمع.

الهدف التعليمي UNC-4.P: التحقق من شروط حساب فترات الثقة لمتوسط مجتمع، بما في ذلك متوسط الفرق بين القيم في الأزواج المزدوجة. [مهارة 4.C]

  • UNC-4.P.1 لحساب فترات الثقة لتقدير متوسط مجتمع، يجب التحقق من الاستقلالية وأن التوزيع العيني تقريبًا طبيعي:
    • أ. للتحقق من الاستقلال:
      • i. يجب جمع البيانات باستخدام عينة عشوائية أو تجربة عشوائية.
      • ii. عند العينة بدون إرجاع، تحقق من أن $n \leq 10\%N$، حيث $N$ هو حجم المجتمع.
    • ب. للتحقق من أن التوزيع المعايني لـ $\overline{x}$ تقريبًا طبيعي (الشكل):
      • i. إذا كان التوزيع المرصود مائلًا، يجب أن يكون $n$ أكبر من 30.
      • ii. إذا كانت حجم العينة أقل من 30، يجب أن يكون توزيع بيانات العينة خاليًا من الانحراف القوي والقيم الشاذة.

الهدف التعليمي UNC-4.Q: تحديد هامش الخطأ لحجم عينة معين لفترة $t$ لعينة واحدة. [مهارة 3.D]

  • UNC-4.Q.1 يمكن إيجاد القيمة الحرجة $t^*$ ذات $n-1$ درجة حرية باستخدام جدول أو مخرجات تم إنشاؤها بواسطة الكمبيوتر.
  • UNC-4.Q.2 الخطأ المعياري لمتوسط العينة معطى بـ $SE = \dfrac{s}{\sqrt{n}}$، حيث $s$ هو انحراف معياري للعينة.
  • UNC-4.Q.3 للفترة أحادية العينة $t$ للمعدل، هامش الخطأ هو القيمة الحرجة ($t^*$) مضروبة في الخطأ المعياري ($SE$)، والذي يساوي $t^*\left(\dfrac{s}{\sqrt{n}}\right)$.

الهدف التعليمي UNC-4.R: حساب فترة ثقة مناسبة لمتوسط مجتمع، بما في ذلك متوسط الفرق بين القيم في الأزواج المزدوجة. [مهارة 3.D]

  • UNC-4.R.1 التقدير النقطي لمتوسط المجتمع هو متوسط العينة، $\overline{x}$.
  • UNC-4.R.2 لمتوسط المجتمع لعينة واحدة بمجهول انحراف معياري للمجتمع، تكون فترة الثقة $\overline{x} \pm t^* \dfrac{s}{\sqrt{n}}$.

عبارة حدودية: لا تظهر صيغ تقديرات الفترة بشكل صريح في ورقة صيغ AP للإحصاء المقدمة مع امتحان AP للإحصاء. ومع ذلك، لا حاجة لحفظ هذه الصيغ، حيث يمكن بناؤها بناءً على صيغة إحصاء الاختبار العامة وصيغ الأخطاء المعيارية ذات الصلة المقدمة في ورقة الصيغ.

Source: College Board AP Course and Exam Description · ⁨المصدر: وصف دورة وامتحان College Board AP⁩

English
What a confidence interval means

A one-sample $t$ interval for $\mu$:

$$\bar{x}\pm t^{*}\frac{s}{\sqrt{n}}.$$
$t^{*}$ is the critical value with $df=n-1$. Conditions: random sample, Normal/Large Sample (population normal, or $n\ge 30$ by the CLT, or a roughly symmetric sample with no outliers), and the 10% condition. Interpret the interval and the confidence level in context.

Worked example. A random sample of $n=25$ has $\bar{x}=50$ and $s=8$. For a $95\%$ interval, $df=24$ gives $t^*=2.064$:

$$50\pm2.064\cdot\frac{8}{\sqrt{25}}=50\pm2.064(1.6)=50\pm3.3=(46.7,\ 53.3).$$

العربية
ما تعنيه فترة الثقة

فترة $t$ لعينة واحدة لـ $\mu$:

$$\bar{x}\pm t^{*}\frac{s}{\sqrt{n}}.$$
$t^{*}$ هي القيمة الحرجة مع $df=n-1$. الشروط: عينة عشوائية، طبيعي/عينة كبيرة (مجتمع طبيعي، أو $n\ge 30$ بموجب نظرية الحد المركزي، أو عينة متماثلة تقريباً بدون انحرافات)، وشروط 10٪. فسر الفترة ومستوى الثقة في السياق.

مثال محلول. عينة عشوائية من $n=25$ لها $\bar{x}=50$ و$s=8$. لفترة $95\%$، $df=24$ تعطيك $t^*=2.064$:

$$50\pm2.064\cdot\frac{8}{\sqrt{25}}=50\pm2.064(1.6)=50\pm3.3=(46.7,\ 53.3).$$

توزيع t له قمة أقل وذيول أثقل من الطبيعي
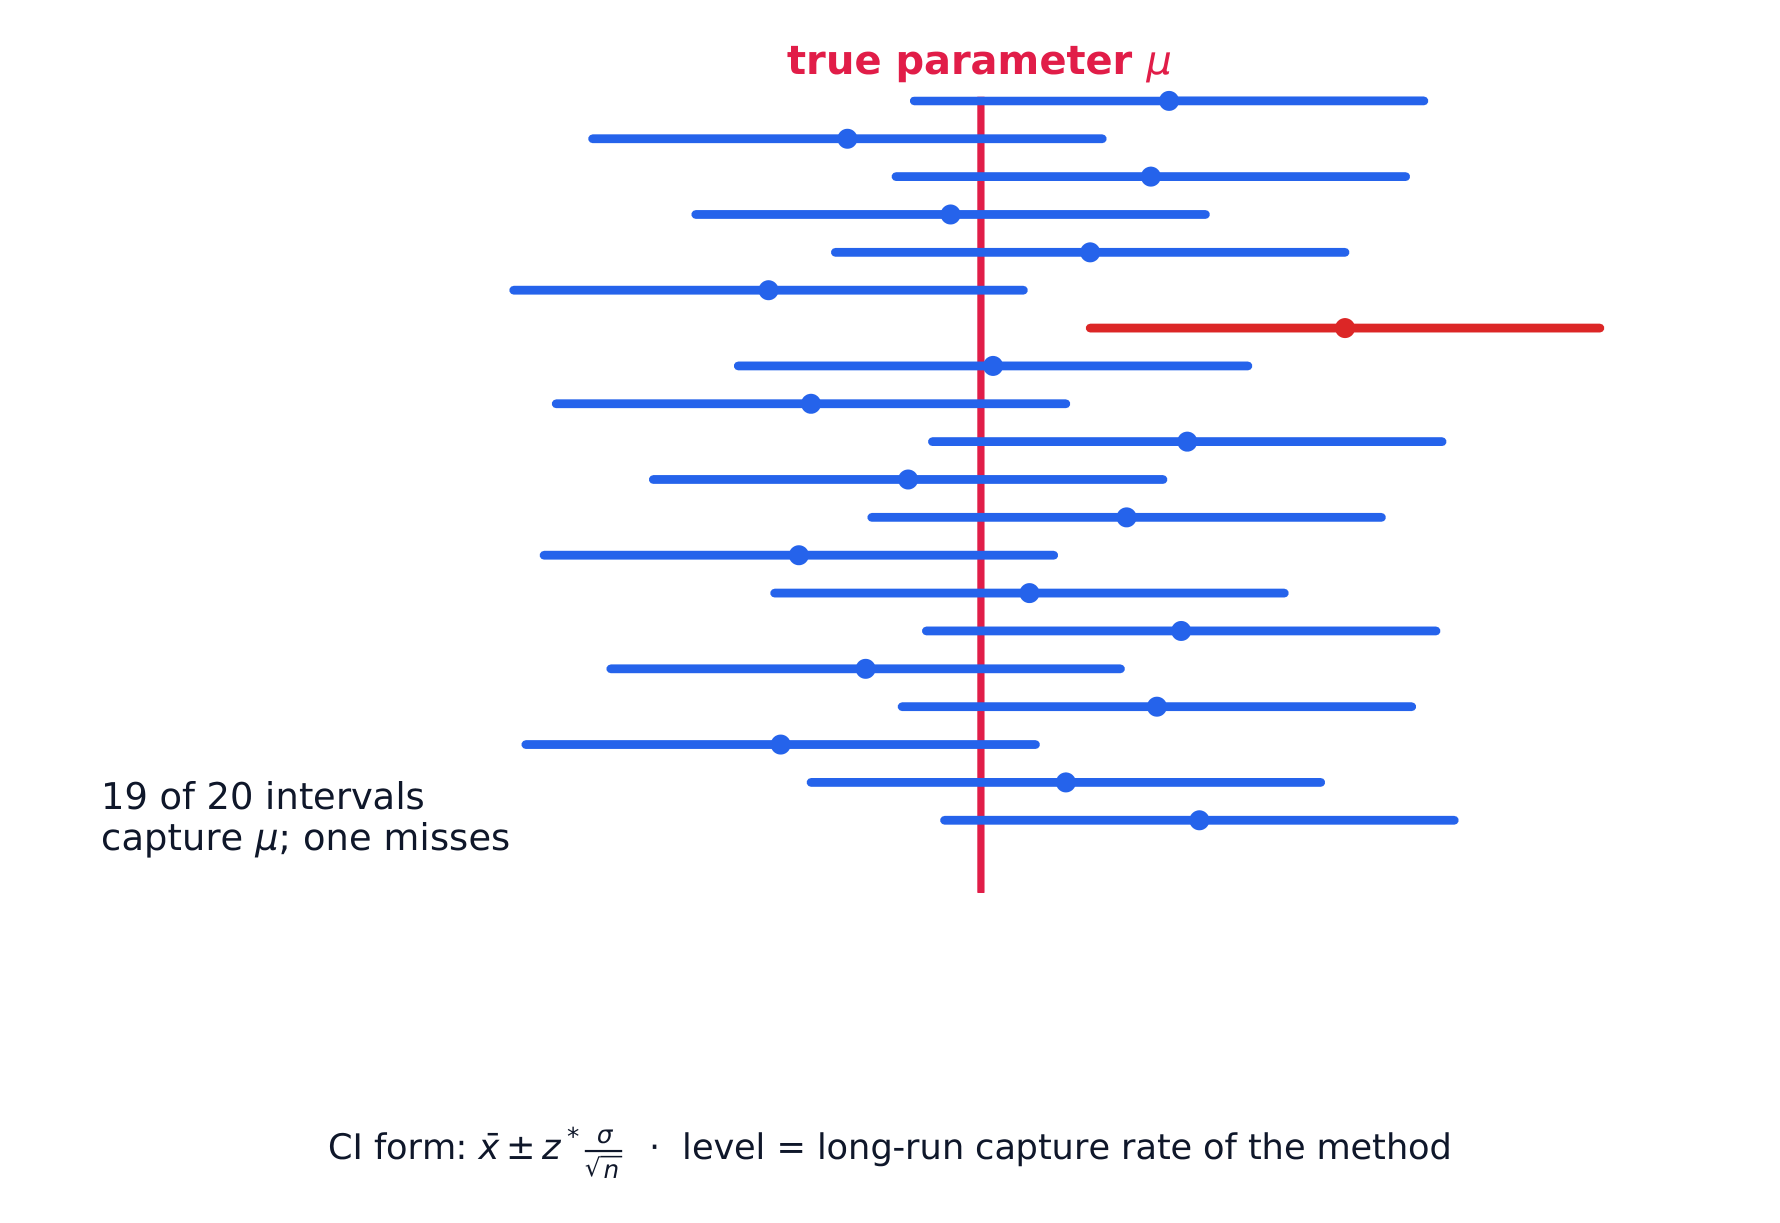
فترات ثقة 95٪ متكررة: حوالي 95٪ تحبس المعامل الحقيقي
"ثقة 95٪" تصف الطريقة، وليس فترة واحدة: عبر عينات عديدة حوالي 95٪ من الفترات تحتوي على $\mu$ وحوالي 5٪ تفوتها.
Explore · ⁨استكشف⁩

Why a t interval is wider than a z interval · ⁨لماذا يكون فترة t أعرض من فترة z⁩

A mean interval uses $t^*$, not $1.96$, because $\sigma$ is estimated by $s$. Drag df down and watch $t^*$ grow — at $df=10$ it is $2.228$, and the interval is wider for it. Drag df up and $t^*$ falls back toward $1.96$, which is why large samples may use $z$. · ⁨تستخدم الفترات المعتمدة على $t^*$، وليس $1.96$، لأن $\sigma$ تُقدر بواسطة $s$. اسحب درجات الحرية (df) للأسفل وانظر $t^*$ تكبر — عند $df=10$ تكون $2.228$، والفترات أوسع لها. اسحب df للأعلى وينخفض $t^*$ عائداً نحو $1.96$، ولهذا السبب قد تستخدم العينات الكبيرة $z$.⁩

7.3

Justifying a Claim About a Mean · ⁨تبرير ادعاء حول متوسط⁩

Syllabus · ⁨المنهج⁩
English

Enduring Understanding (UNC-4): An interval of values should be used to estimate parameters, in order to account for uncertainty.

Learning Objective UNC-4.S: Interpret a confidence interval for a population mean, including the mean difference between values in matched pairs. [Skill 4.B]

  • UNC-4.S.1 A confidence interval for a population mean either contains the population mean or it does not, because each interval is based on data from a random sample, which varies from sample to sample.
  • UNC-4.S.2 We are C% confident that the confidence interval for a population mean captures the population mean.
  • UNC-4.S.3 An interpretation of a confidence interval for a population mean includes a reference to the sample taken and details about the population it represents.
    • Illustrative examples for UNC-4.S.3: For interpreting a 96% confidence interval for mean foot length for all footprints found in a cave based on a particular randomly selected sample of footprints in the cave: "We are 96% confident that the mean foot length for all footprints found in the cave falls within the confidence interval" (based on 2000 FRQ 2).

Learning Objective UNC-4.T: Justify a claim based on a confidence interval for a population mean, including the mean difference between values in matched pairs. [Skill 4.D]

  • UNC-4.T.1 A confidence interval for a population mean provides an interval of values that may provide sufficient evidence to support a particular claim in context.

Learning Objective UNC-4.U: Identify the relationships between sample size, width of a confidence interval, confidence level, and margin of error for a population mean. [Skill 4.A]

  • UNC-4.U.1 When all other things remain the same, the width of a confidence interval for a population mean tends to decrease as the sample size increases.
  • UNC-4.U.2 For a single mean, the width of the interval is proportional to $\dfrac{1}{\sqrt{n}}$.
  • UNC-4.U.3 For a given sample, the width of the confidence interval for a population mean increases as the confidence level increases.
العربية

الفهم الدائم (UNC-4): يجب استخدام فترة من القيم لتقدير المعايير، وذلك لحساب عدم اليقين.

الهدف التعليمي UNC-4.S: تفسير فترة ثقة لمتوسط مجتمع، بما في ذلك متوسط الفرق بين القيم في الأزواج المزدوجة. [مهارة 4.B]

  • UNC-4.S.1 إما أن تحتوي فترة الثقة لمتوسط المجتمع على متوسط المجتمع أو لا تفعل ذلك، لأن كل فترة تعتمد على بيانات من عينة عشوائية، والتي تتغير من عينة إلى أخرى.
  • UNC-4.S.2 نحن واثقون بنسبة C% أن فترة الثقة لمتوسط المجتمع تلتقط متوسط المجتمع.
  • UNC-4.S.3 يتضمن تفسير فترة الثقة لمتوسط مجتمع مرجعاً إلى العينة taken وتفاصيل حول المجتمع الذي تمثلها.
    • أمثلة توضيحية لـ UNC-4.S.3: لتفسير فاصل ثقة بنسبة 96% لطول القدم لجميع البصمات الموجودة في كهف بناءً على عينة عشوائية معينة من البصمات في الكهف: "نحن واثقون بنسبة 96% أن متوسط طول القدم لجميع البصمات الموجودة في الكهف يقع ضمن فاصل الثقة" (بناءً على FRQ 2000 2).

الهدف التعليمي UNC-4.T: تبرير ادعاء استنادًا إلى فترة ثقة لمتوسط مجتمع، بما في ذلك متوسط الفرق بين القيم في الأزواج المزدوجة. [مهارة 4.D]

  • UNC-4.T.1 توفر فترة الثقة لمتوسط مجتمع نطاقًا من القيم التي قد تقدم أدلة كافية لدعم ادعاء معين في السياق.

الهدف التعليمي UNC-4.U: تحديد العلاقات بين حجم العينة، وعرض فترة الثقة، ومستوى الثقة، وهامش الخطأ لمتوسط مجتمع. [مهارة 4.A]

  • UNC-4.U.1 عندما تبقى جميع العوامل الأخرى ثابتة، فإن عرض فترة ثقة لمتوسط مجتمع يميل إلى الانخفاض مع زيادة حجم العينة.
  • UNC-4.U.2 بالنسبة لمتوسط واحد، يكون عرض الفترة متناسبًا مع $\dfrac{1}{\sqrt{n}}$.
  • UNC-4.U.3 لعينة معينة، يزداد عرض فترة الثقة لمتوسط مجتمع كلما زاد مستوى الثقة.

Source: College Board AP Course and Exam Description · ⁨المصدر: وصف دورة وامتحان College Board AP⁩

English

As with proportions: a claimed mean inside the interval is plausible; outside the interval, the data give evidence against it. Answer in context using the plausible range.

العربية

كما في النسب: متوسط مذكور داخل الفترة معقول؛ خارج الفترة، تعطي البيانات دليلاً ضده. أجب في السياق باستخدام النطاق المعقول.

7.4

Setting Up a Test for a Mean · ⁨إعداد اختبار للمتوسط⁩

Syllabus · ⁨المنهج⁩
English

Enduring Understanding (VAR-7): The $t$-distribution may be used to model variation.

Learning Objective VAR-7.B: Identify an appropriate testing method for a population mean with unknown $\sigma$, including the mean difference between values in matched pairs. [Skill 1.E]

  • VAR-7.B.1 The appropriate test for a population mean with unknown $\sigma$ is a one-sample $t$-test for a population mean.
  • VAR-7.B.2 Matched pairs can be thought of as one sample of pairs. Once differences between pairs of values are found, inference for significance testing proceeds as for a population mean.

Learning Objective VAR-7.C: Identify the null and alternative hypotheses for a population mean with unknown $\sigma$, including the mean difference between values in matched pairs. [Skill 1.F]

  • VAR-7.C.1 The null hypothesis for a one-sample $t$-test for a population mean is $H_0 : \mu = \mu_0$, where $\mu_0$ is the hypothesized value. Depending upon the situation, the alternative hypothesis is $H_a : \mu < \mu_0$, or $H_a : \mu > \mu_0$, or $H_a : \mu \neq \mu_0$.
  • VAR-7.C.2 When finding the mean difference, $\mu_d$, between values in a matched pair, it is important to define the order of subtraction.

Learning Objective VAR-7.D: Verify the conditions for the test for a population mean, including the mean difference between values in matched pairs. [Skill 4.C]

  • VAR-7.D.1 In order to make statistical inferences when testing a population mean, we must check for independence and that the sampling distribution is approximately normal:
    • a. To check for independence:
      • i. Data should be collected using a random sample or a randomized experiment.
      • ii. When sampling without replacement, check that $n \leq 10\%N$.
    • b. To check that the sampling distribution of $\overline{x}$ is approximately normal (shape):
      • i. If the observed distribution is skewed, $n$ should be greater than 30.
      • ii. If the sample size is less than 30, the distribution of the sample data should be free from strong skewness and outliers.
العربية

الفهم الدائم (VAR-7): يمكن استخدام توزيع $t$ لنمذجة التباين.

هدف التعلم VAR-7.B: تحديد طريقة اختبار مناسبة لمتوسط مجتمع بـ$\sigma$ غير معروف، بما في ذلك متوسط الفرق بين القيم في الأزواج المتطابقة. [مهارة 1.E]

  • VAR-7.B.1 الاختبار المناسب لمتوسط مجتمع بـ$\sigma$ غير معروف هو اختبار $t$ لعينة واحدة لمتوسط مجتمع.
  • VAR-7.B.2 يمكن اعتبار الأزواج المتطابقة عينة واحدة من الأزواج. بمجرد إيجاد الفروق بين أزواج القيم، تستمر الاستدلالات لاختبارات الدلالة الإحصائية كما هي لحالة متوسط مجتمع.

هدف التعلم VAR-7.C: تحديد فرضية الصفر والبديلة لمتوسط مجتمع بـ$\sigma$ غير معروف، بما في ذلك متوسط الفرق بين القيم في الأزواج المتطابقة. [مهارة 1.F]

  • VAR-7.C.1 فرضية الصفر لاختبار $t$ لعينة واحدة لمتوسط مجتمع هي $H_0 : \mu = \mu_0$، حيث $\mu_0$ هي القيمة المفترضة. اعتمادًا على الموقف، تكون فرضية البديل $H_a : \mu < \mu_0$، أو $H_a : \mu > \mu_0$، أو $H_a : \mu \neq \mu_0$.
  • VAR-7.C.2 عند إيجاد متوسط الفرق $\mu_d$ بين قيم في زوج متطابق، من المهم تحديد ترتيب طرح القيم.

هدف التعلم VAR-7.D: التحقق من شروط اختبار متوسط مجتمع، بما في ذلك متوسط الفرق بين القيم في الأزواج المتطابقة. [مهارة 4.C]

  • VAR-7.D.1 لإجراء استدلالات إحصائية عند اختبار متوسط مجتمع، يجب التحقق من الاستقلال وأن التوزيع المعايني طبيعي تقريبًا:
    • أ. للتحقق من الاستقلال:
      • i. يجب جمع البيانات باستخدام عينة عشوائية أو تجربة عشوائية.
      • ii. عند أخذ العينات بدون إرجاع، تأكد من أن $n \leq 10\%N$.
    • ب. للتحقق من أن التوزيع المعايني لـ $\overline{x}$ تقريبًا طبيعي (الشكل):
      • i. إذا كان التوزيع المرصود مائلًا، يجب أن يكون $n$ أكبر من 30.
      • ii. إذا كانت حجم العينة أقل من 30، يجب أن يكون توزيع بيانات العينة خاليًا من الانحراف القوي والقيم الشاذة.

Source: College Board AP Course and Exam Description · ⁨المصدر: وصف دورة وامتحان College Board AP⁩

English
What a p-value means

State hypotheses about $\mu$: $H_0:\mu=\mu_0$ versus $H_a:\mu\neq\mu_0$ (or $<,>$). Check the same conditions. The one-sample $t$ statistic:

$$t=\frac{\bar{x}-\mu_0}{s/\sqrt{n}},\qquad df=n-1.$$

Worked example. Test $H_0:\mu=45$ against $H_a:\mu\neq45$ for the sample above ($\bar{x}=50$, $s=8$, $n=25$):

$$t=\frac{50-45}{8/\sqrt{25}}=\frac{5}{1.6}=3.13,\qquad df=24.$$
This $t$ is far out in the tail (two-tailed $p<0.01$), so reject $H_0$ – strong evidence the mean is not $45$. Notice $45$ also falls outside the $95\%$ interval $(46.7,53.3)$, the same conclusion by two routes.

العربية
ماذا تعني قيمة p

صغ فرضيات حول $\mu$: $H_0:\mu=\mu_0$ مقابل $H_a:\mu\neq\mu_0$ (أو $<,>$). تحقق من نفس الشروط. إحصائية العينة الواحدة $t$:

$$t=\frac{\bar{x}-\mu_0}{s/\sqrt{n}},\qquad df=n-1.$$

مثال محلول. اختبر $H_0:\mu=45$ مقابل $H_a:\mu\neq45$ للعينة أعلاه ($\bar{x}=50$، $s=8$، $n=25$):

$$t=\frac{50-45}{8/\sqrt{25}}=\frac{5}{1.6}=3.13,\qquad df=24.$$
هذه $t$ بعيدة جدًا في الذيل (قيمة $p<0.01$ ذيلين)، لذا ارفض $H_0$ – دليل قوي على أن المتوسط ليس $45$. لاحظ أن $45$ أيضًا يقع خارج فترة $95\%$ $(46.7,53.3)$، نفس الاستنتاج بطريقتين.

7.5

Carrying Out a Test for a Mean · ⁨إجراء اختبار للمتوسط⁩

Syllabus · ⁨المنهج⁩
English

Enduring Understanding (VAR-7): The $t$-distribution may be used to model variation.

Learning Objective VAR-7.E: Calculate an appropriate test statistic for a population mean, including the mean difference between values in matched pairs. [Skill 3.E]

  • VAR-7.E.1 For a single quantitative variable when random sampling with replacement from a population that can be modeled with a normal distribution with mean $\mu$ and standard deviation $\sigma$, the sampling distribution of $t = \dfrac{\overline{x} - \mu}{\frac{s}{\sqrt{n}}}$ has a $t$-distribution with $n - 1$ degrees of freedom.

Boundary statement: The formulas for test statistics do not appear explicitly on the AP Statistics Formula Sheet provided with the AP Statistics Exam. However, these formulas do not need to be memorized, as they can be constructed based on the general test statistic formula and the relevant standard error formulas that are provided on the formula sheet.

Enduring Understanding (DAT-3): Significance testing allows us to make decisions about hypotheses within a particular context.

Learning Objective DAT-3.E: Interpret the $p$-value of a significance test for a population mean, including the mean difference between values in matched pairs. [Skill 4.B]

  • DAT-3.E.1 An interpretation of the $p$-value of a significance test for a population mean should recognize that the $p$-value is computed by assuming that the null hypothesis is true, i.e., by assuming that the true population mean is equal to the particular value stated in the null hypothesis.

Learning Objective DAT-3.F: Justify a claim about the population based on the results of a significance test for a population mean. [Skill 4.E]

  • DAT-3.F.1 A formal decision explicitly compares the $p$-value to the significance $\alpha$. If the $p$-value $\leq \alpha$, then reject the null hypothesis, $H_0 : \mu = \mu_0$. If the $p$-value $> \alpha$, then fail to reject the null hypothesis.
  • DAT-3.F.2 The results of a significance test for a population mean can serve as the statistical reasoning to support the answer to a research question about the population that was sampled.
العربية

الفهم الدائم (VAR-7): يمكن استخدام توزيع $t$ لنمذجة التباين.

هدف التعلم VAR-7.E: حساب إحصاء اختبار مناسب لمتوسط مجتمع، بما في ذلك متوسط الفرق بين القيم في الأزواج المتطابقة. [مهارة 3.E]

  • VAR-7.E.1 لمتغير كمي واحد، عند أخذ عينة عشوائية مع الإرجاع من مجتمع يمكن نمذجته بتوزيع طبيعي بمتوسط $\mu$ والانحراف المعياري $\sigma$، فإن التوزيع المعايني لـ$t = \dfrac{\overline{x} - \mu}{\frac{s}{\sqrt{n}}}$ له توزيع $t$ بـ$n - 1$ درجات حرية.

عبارة حدودية: لا تظهر صيغ إحصاءات الاختبار صراحةً في ورقة صيغ AP للإحصاء المرفقة باختبار AP للإحصاء. ومع ذلك، لا حاجة لحفظ هذه الصيغ، حيث يمكن بناؤها بناءً على صيغة إحصاء الاختبار العامة وصيغ الأخطاء المعيارية ذات الصلة الموضحة في ورقة الصيغ.

الفهم الدائم (DAT-3): يسمح اختبار الأهمية باتخاذ قرارات بشأن الفرضيات ضمن سياق معين.

هدف التعلم DAT-3.E: تفسير قيمة $p$ لاختبار دلالة إحصائي لمتوسط مجتمع، بما في ذلك متوسط الفرق بين القيم في الأزواج المتطابقة. [مهارة 4.B]

  • DAT-3.E.1 يجب أن يعترف تفسير قيمة $p$ لاختبار دلالة إحصائي لمتوسط مجتمع بأن قيمة $p$ يتم حسابها بافتراض صحة فرضية الصفر، أي بافتراض أن متوسط المجتمع الحقيقي يساوي القيمة المحددة في فرضية الصفر.

هدف التعلم DAT-3.F: تبرير ادعاء حول المجتمع بناءً على نتائج اختبار دلالة إحصائي لمتوسط مجتمع. [مهارة 4.E]

  • DAT-3.F.1 القرار الرسمي يقارن صراحةً قيمة $p$ بمستوى الدلالة $\alpha$. إذا كانت قيمة $p$ $\leq \alpha$، فإننا نرفض فرضية الصفر، $H_0 : \mu = \mu_0$. إذا كانت قيمة $p$ $> \alpha$، فإننا نفشل في رفض فرضية الصفر.
  • DAT-3.F.2 يمكن أن تخدم نتائج اختبار دلالة إحصائي لمتوسط مجتمع كتبرير إحصائي لدعم الإجابة على سؤال بحثي حول المجتمع الذي تم取样 منه.

Source: College Board AP Course and Exam Description · ⁨المصدر: وصف دورة وامتحان College Board AP⁩

English

Find the $p$-value from the $t$-distribution with $df=n-1$, compare to $\alpha$, and conclude in context – reject or fail to reject $H_0$, then state what that means for the claim. Show the test name, statistic, $df$, and $p$-value.

العربية

أوجد قيمة $p$ من توزيع $t$ مع $df=n-1$، قارنها بـ $\alpha$، واستنتج في السياق – ارفض أو لا ترفض $H_0$، ثم حدد ماذا يعني ذلك للادعاء. أظهر اسم الاختبار، والإحصاء، و$df$، وقيمة $p$.

Explore · ⁨استكشف⁩

Read a p-value off the t curve · ⁨اقرأ قيمة p من منحنى t⁩

The p-value is the shaded tail area beyond your $t$ statistic — both tails for a two-tailed $H_a$. The dashed normal curve behind $t$ shows what you would have got by wrongly using $z$: at small df the $t$ tail is visibly fatter, so the true p-value is larger than the normal would suggest. · ⁨قيمة p هي منطقة الذيل المظللة beyond الإحصاء $t$ الخاص بك — كلا الذيلين للاختبار ثنائي الذيل $H_a$. المنحنى الطبيعي المتقطع خلف $t$ يظهر ما كنت ستحصل عليه لو استخدمت $z$ بشكل خاطئ: عند درجات الحرية الصغيرة، يكون ذيل $t$ أكثر امتلاءً بوضوح، لذا فإن قيمة p الحقيقية أكبر مما يشير إليه التوزيع الطبيعي.⁩

7.6

Confidence Interval for a Difference of Two Means · ⁨فترة الثقة للفرق بين متوسطين⁩

Syllabus · ⁨المنهج⁩
English

Enduring Understanding (UNC-4): An interval of values should be used to estimate parameters, in order to account for uncertainty.

Learning Objective UNC-4.V: Identify an appropriate confidence interval procedure for a difference of two population means. [Skill 1.D]

  • UNC-4.V.1 Consider a simple random sample from population 1 of size $n_1$, mean $\mu_1$, and standard deviation $\sigma_1$ and a second simple random sample from population 2 of size $n_2$, mean $\mu_2$, and standard deviation $\sigma_2$. If the distributions of populations 1 and 2 are normal or if both $n_1$ and $n_2$ are greater than 30, then the sampling distribution of the difference of means, $\overline{x}_1 - \overline{x}_2$ is also normal. The mean for the sampling distribution of $\overline{x}_1 - \overline{x}_2$ is $\mu_1 - \mu_2$. The standard deviation of $\overline{x}_1 - \overline{x}_2$ is $\sqrt{\dfrac{(\sigma_1)^2}{n_1} + \dfrac{(\sigma_2)^2}{n_2}}$.
  • UNC-4.V.2 The appropriate confidence interval procedure for one quantitative variable for two independent samples is a two-sample $t$-interval for a difference between population means.

Learning Objective UNC-4.W: Verify the conditions to calculate confidence intervals for the difference of two population means. [Skill 4.C]

  • UNC-4.W.1 In order to calculate confidence intervals to estimate a difference of population means, we must check for independence and that the sampling distribution is approximately normal:
    • a. To check for independence:
      • i. Data should be collected using two independent, random samples or a randomized experiment.
      • ii. When sampling without replacement, check that $n_1 \leq 10\%N_1$ and $n_2 \leq 10\%N_2$.
    • b. To check that the sampling distribution of $(\overline{x}_1 - \overline{x}_2)$ should be approximately normal (shape):
      • i. If the observed distributions are skewed, both $n_1$ and $n_2$ should be greater than 30.

Learning Objective UNC-4.X: Determine the margin of error for the difference of two population means. [Skill 3.D]

  • UNC-4.X.1 For the difference of two sample means, the margin of error is the critical value ($t^*$) times the standard error ($SE$) of the difference of two means.
  • UNC-4.X.2 The standard error for the difference in two sample means with sample standard deviations, $s_1$ and $s_2$, is $\sqrt{\dfrac{(s_1)^2}{n_1} + \dfrac{(s_2)^2}{n_2}}$.

Learning Objective UNC-4.Y: Calculate an appropriate confidence interval for a difference of two population means. [Skill 3.D]

  • UNC-4.Y.1 The point estimate for the difference of two population means is the difference in sample means, $\overline{x}_1 - \overline{x}_2$.
  • UNC-4.Y.2 For a difference of two population means where the population standard deviations are not known, the confidence interval is $(\overline{x}_1 - \overline{x}_2) \pm t^* \sqrt{\dfrac{s_1^2}{n_1} + \dfrac{s_2^2}{n_2}}$ where $\pm t^*$ are the critical values for the central C% of a $t$-distribution with appropriate degrees of freedom that can be found using technology.

Boundary statement: Formulas for interval estimates do not appear explicitly on the AP Statistics Formula Sheet provided with the AP Statistics Exam. However, these formulas do not need to be memorized, as they can be constructed based on the general test statistic formula and the relevant standard error formulas that are provided on the formula sheet.

العربية

الفهم الدائم (UNC-4): يجب استخدام فترة من القيم لتقدير المعايير، وذلك لحساب عدم اليقين.

هدف التعلم UNC-4.V: تحديد إجراء فترة ثقة مناسب لفرق متوسطين لمجتمعين. [مهارة 1.D]

  • UNC-4.V.1 لنظر عينة عشوائية بسيطة من مجتمع 1 بحجم $n_1$ ومتوسط $\mu_1$ وانحراف معياري $\sigma_1$ وعينة عشوائية بسيطة ثانية من مجتمع 2 بحجم $n_2$ ومتوسط $\mu_2$ وانحراف معياري $\sigma_2$. إذا كانت توزيعات المجتمعات 1 و2 طبيعية أو إذا كان كلا من $n_1$ و$n_2$ أكبر من 30، فإن التوزيع العينی لفرق المعدلات، $\overline{x}_1 - \overline{x}_2$، يكون أيضاً طبيعياً. المتوسط للتوزيع العینی لـ $\overline{x}_1 - \overline{x}_2$ هو $\mu_1 - \mu_2$. الانحراف المعياري لـ $\overline{x}_1 - \overline{x}_2$ هو $\sqrt{\dfrac{(\sigma_1)^2}{n_1} + \dfrac{(\sigma_2)^2}{n_2}}$.
  • UNC-4.V.2 الإجراء المناسب لفترة الثقة لمتغير كمي واحد لعينتين مستقلتين هو فترة $t$ لعينتين لفرق متوسطات المجتمع.

هدف التعلم UNC-4.W: التحقق من الشروط لحساب فترات الثقة لفرق متوسطين لمجتمعين. [مهارة 4.C]

  • UNC-4.W.1 لحساب فترات الثقة لتقدير فرق متوسطات المجتمع، يجب التحقق من الاستقلال وأن التوزيع المعايني طبيعي تقريبًا:
    • أ. للتحقق من الاستقلال:
      • i. يجب جمع البيانات باستخدام عينتين مستقلتين وعشوائيتين أو تجربة معشاة.
      • ii. عند السحب بدون إرجاع، تحقق من أن $n_1 \leq 10\%N_1$ و $n_2 \leq 10\%N_2$.
    • ب. للتحقق من أن التوزيع المعايني لـ$(\overline{x}_1 - \overline{x}_2)$ يجب أن يكون طبيعيًا تقريبًا (الشكل):
      • أ. إذا كانت التوزيعات المرصودة منحرفة، يجب أن يكون كل من $n_1$ و$n_2$ أكبر من 30.

هدف التعلم UNC-4.X: تحديد هامش الخطأ لفرق متوسطين لمجتمعين. [مهارة 3.D]

  • UNC-4.X.1 لفرق متوسطين عينة، هامش الخطأ هو القيمة الحرجة ($t^*$) مضروبة في الخطأ المعياري ($SE$) لفرق متوسطين.
  • UNC-4.X.2 الخطأ المعياري للفرق بين متوسطين لعينتين مع انحرافات معيارية للعينة، $s_1$ و$s_2$، هو $\sqrt{\dfrac{(s_1)^2}{n_1} + \dfrac{(s_2)^2}{n_2}}$.

الهدف التعليمي UNC-4.Y: حساب فترة ثقة مناسبة لفرق متوسطين لسكان. [مهارة 3.D]

  • UNC-4.Y.1 التقدير النقطي للفرق بين متوسطين لسكان هو الفرق بين متوسعين للعينة، $\overline{x}_1 - \overline{x}_2$.
  • UNC-4.Y.2 بالنسبة لفرق متوسطين لسكان حيث لا تُعرف الانحرافات المعيارية للسكان، فإن فترة الثقة هي $(\overline{x}_1 - \overline{x}_2) \pm t^* \sqrt{\dfrac{s_1^2}{n_1} + \dfrac{s_2^2}{n_2}}$ حيث $\pm t^*$ هي القيم الحرجة للمركز C% من توزيع $t$ بدرجات حرية مناسبة يمكن العثور عليها باستخدام التكنولوجيا.

عبارة حدودية: لا تظهر صيغ تقديرات الفترة بشكل صريح في ورقة صيغ AP للإحصاء المقدمة مع امتحان AP للإحصاء. ومع ذلك، لا حاجة لحفظ هذه الصيغ، حيث يمكن بناؤها بناءً على صيغة إحصاء الاختبار العامة وصيغ الأخطاء المعيارية ذات الصلة المقدمة في ورقة الصيغ.
Source: College Board AP Course and Exam Description · ⁨المصدر: وصف دورة وامتحان College Board AP⁩

English

For independent samples, estimate $\mu_1-\mu_2$:

$$(\bar{x}_1-\bar{x}_2)\pm t^{*}\sqrt{\frac{s_1^2}{n_1}+\frac{s_2^2}{n_2}}.$$
Conditions must hold in both samples. (Use technology for the $df$; do not pool the variances on the AP exam.)

العربية

بالنسبة لعينات مستقلة، قدّر $\mu_1-\mu_2$:

$$(\bar{x}_1-\bar{x}_2)\pm t^{*}\sqrt{\frac{s_1^2}{n_1}+\frac{s_2^2}{n_2}}.$$
يجب تحقق الشروط في كلا العينتين. (استخدم التكنولوجيا لإيجاد $df$؛ لا تجمع التباينات في امتحان AP.)

الترميز يُمكّن مقارنة عادلة بين مجموعتين في اختبار فرق المتوسطات
7.7

Justifying a Claim About Two Means · ⁨تبرير ادعاء يتعلق بمتوسطين⁩

Syllabus · ⁨المنهج⁩
English

Enduring Understanding (UNC-4): An interval of values should be used to estimate parameters, in order to account for uncertainty.

Learning Objective UNC-4.Z: Interpret a confidence interval for a difference of population means. [Skill 4.B]

  • UNC-4.Z.1 In repeated random sampling with the same sample size, approximately C% of confidence intervals created will capture the difference of population means.
  • UNC-4.Z.2 An interpretation for a confidence interval for the difference of two population means should include a reference to the samples taken and details about the populations they represent.
    • Illustrative examples for UNC-4.Z.2: For interpreting a confidence interval for a difference between mean response times for two fire stations (northern - southern): "Based on these samples, one can be 95 percent confident that the difference in the population mean response times (northern - southern) is between -2.37 minutes and 0.37 minutes" (2009 FRQ 4).

Learning Objective UNC-4.AA: Justify a claim based on a confidence interval for a difference of population means. [Skill 4.D]

  • UNC-4.AA.1 A confidence interval for a difference of population means provides an interval of values that may provide sufficient evidence to support a particular claim in context.

Learning Objective UNC-4.AB: Identify the effects of sample size on the width of a confidence interval for the difference of two means. [Skill 4.A]

  • UNC-4.AB.1 When all other things remain the same, the width of the confidence interval for the difference of two means tends to decrease as the sample sizes increase.
العربية

الفهم الدائم (UNC-4): يجب استخدام فترة من القيم لتقدير المعايير، وذلك لحساب عدم اليقين.

الهدف التعليمي UNC-4.Z: تفسير فترة ثقة للفرق بين متوسطين لسكان. [مهارة 4.B]

  • UNC-4.Z.1 في العينات العشوائية المتكررة بنفس حجم العينة، ستحتوي تقريبًا نسبة C% من فترات الثقة المُنشأة على الفرق بين متوسطين للسكان.
  • UNC-4.Z.2 يجب أن يتضمن التفسير لفترة ثقة للفرق بين متوسطين لسكان الإشارة إلى العينات المُسحوبة والتفاصيل حول السكان الذين يمثلونها.
    • أمثلة توضيحية لـ UNC-4.Z.2: لتفسير فترة الثقة لفرق متوسطات أوقات الاستجابة لمحطتي إطفاء (الشمالية - الجنوبية): "بناءً على هذه العينات، يمكن للمرء أن يكون مطمئناً بنسبة 95٪ أن فرق متوسطات أوقات الاستجابة في المجتمع (الشمالية - الجنوبية) يقع بين -2.37 دقيقة و0.37 دقيقة" (2009 FRQ 4).

الهدف التعليمي UNC-4.AA: تبرير ادعاء بناءً على فترة ثقة للفرق بين متوسطين لسكان. [مهارة 4.D]

  • UNC-4.AA.1 توفر فترة الثقة للفرق بين متوسطين لسكان نطاقًا من القيم التي قد تقدم دليلًا كافيًا لدعم ادعاء معين في السياق.

الهدف التعليمي UNC-4.AB: تحديد تأثيرات حجم العينة على عرض فترة الثقة للفرق بين متوسلين. [مهارة 4.A]

  • UNC-4.AB.1 عندما تبقى جميع العوامل الأخرى ثابتة، يميل عرض فترة الثقة للفرق بين متوسلين إلى الانخفاض كلما زادت أحجام العينات.

Source: College Board AP Course and Exam Description · ⁨المصدر: وصف دورة وامتحان College Board AP⁩

English

If the interval for $\mu_1-\mu_2$ contains $0$, the data are consistent with equal means; if it excludes $0$, there is evidence of a difference in that direction. Interpret in context.

العربية

إذا كان مجال $\mu_1-\mu_2$ يحتوي على $0$، فإن البيانات متسقة مع تساوي المتوسطات؛ وإذا استبعد $0$، فهناك دليل على وجود فرق في هذا الاتجاه. تُفسر النتائج في السياق.

7.8

Setting Up a Test for a Difference of Means · ⁨إعداد اختبار لفرق المتوسطات⁩

Syllabus · ⁨المنهج⁩
English

Enduring Understanding (VAR-7): The $t$-distribution may be used to model variation.

Learning Objective VAR-7.F: Identify an appropriate selection of a testing method for a difference of two population means. [Skill 1.E]

  • VAR-7.F.1 For a quantitative variable, the appropriate test for a difference of two population means is a two-sample $t$-test for a difference of two population means.

Learning Objective VAR-7.G: Identify the null and alternative hypotheses for a difference of two population means. [Skill 1.F]

  • VAR-7.G.1 The null hypothesis for a two-sample $t$-test for a difference of two population means, $\mu_1$ and $\mu_2$, is: $H_0 : \mu_1 - \mu_2 = 0$, or $H_0 : \mu_1 = \mu_2$. The alternative hypothesis is $H_a : \mu_1 - \mu_2 < 0$, or $H_a : \mu_1 - \mu_2 > 0$, or $H_a : \mu_1 - \mu_2 \neq 0$, or $H_a : \mu_1 > \mu_2$, or $H_a : \mu_1 < \mu_2$, or $H_a : \mu_1 \neq \mu_2$.

Learning Objective VAR-7.H: Verify the conditions for the significance test for the difference of two population means. [Skill 4.C]

  • VAR-7.H.1 In order to make statistical inferences when testing a difference between population means, we must check for independence and that the sampling distribution is approximately normal:
    • a. Individual observations should be independent:
      • i. Data should be collected using simple random samples or a randomized experiment.
      • ii. When sampling without replacement, check that $n_1 \leq 10\%N_1$ and $n_2 \leq 10\%N_2$.
    • b. The sampling distribution of $\overline{x}_1 - \overline{x}_2$ should be approximately normal (shape).
      • i. If the observed distribution is skewed, both $n_1$ and $n_2$ should be greater than 30.
      • ii. If the sample size is less than 30, the distribution of the sample data should be free from strong skewness and outliers. This should be checked for BOTH samples.
العربية

الفهم الدائم (VAR-7): يمكن استخدام توزيع $t$ لنمذجة التباين.

الهدف التعليمي VAR-7.F: تحديد اختيار مناسب لطريقة الاختبار للفرق بين متوسلين لسكان. [مهارة 1.E]

  • VAR-7.F.1 للمتغير الكمي، الاختبار المناسب لفرق معدلي مجتمعين هو اختبار $t$ ثنائي العينة لفرق معدلي مجتمعين.

الهدف التعليمي VAR-7.G: تحديد الفرضية الصفرية والبديلة للفرق بين متوسلين لسكان. [مهارة 1.F]

  • VAR-7.G.1 الفرضية الصفرية لاختبار $t$ ثنائي العينة لفرق معدلي مجتمعين، $\mu_1$ و$\mu_2$، هي: $H_0 : \mu_1 - \mu_2 = 0$، أو $H_0 : \mu_1 = \mu_2$. الفرضية البديلة هي $H_a : \mu_1 - \mu_2 < 0$، أو $H_a : \mu_1 - \mu_2 > 0$، أو $H_a : \mu_1 - \mu_2 \neq 0$، أو $H_a : \mu_1 > \mu_2$، أو $H_a : \mu_1 < \mu_2$، أو $H_a : \mu_1 \neq \mu_2$.

الهدف التعليمي VAR-7.H: التحقق من شروط اختبار الدلالة للفرق بين متوسلين لسكان. [مهارة 4.C]

  • VAR-7.H.1 لإجراء استدلالات إحصائية عند اختبار الفرق بين متوسلي السكان، يجب التحقق من الاستقلالية وأن التوزيع العيني تقريبي طبيعي:
    • أ. يجب أن تكون الملاحظات الفردية مستقلة:
      • i. يجب جمع البيانات باستخدام عينات عشوائية بسيطة أو تجربة عشوائية.
      • ii. عند السحب بدون إرجاع، تحقق من أن $n_1 \leq 10\%N_1$ و $n_2 \leq 10\%N_2$.
    • ب. يجب أن يكون التوزيع العيني لـ $\overline{x}_1 - \overline{x}_2$ تقريبي الطبيعي (الشكل).
      • i. إذا كانت التوزيع المرصود منحرفًا، فيجب أن يكون كل من $n_1$ و$n_2$ أكبر من 30.
      • ii. إذا كان حجم العينة أقل من 30، فيجب أن يكون توزيع بيانات العينة خاليًا من الانحراف القوي والقيم الشاذة. يجب التحقق من ذلك لكلا العينتين.

Source: College Board AP Course and Exam Description · ⁨المصدر: وصف دورة وامتحان College Board AP⁩

English

Hypotheses: $H_0:\mu_1=\mu_2$ versus $H_a:\mu_1\neq\mu_2$ (or $<,>$). Distinguish two independent samples from paired data 配对数据 – for paired data (before/after, matched subjects), first take the differences and run a one-sample $t$ procedure on them.

العربية

الفرضيات: $H_0:\mu_1=\mu_2$ مقابل $H_a:\mu_1\neq\mu_2$ (أو $<,>$). افرق بين عينةين مستقلتين وبيانات مزدوجة – بالنسبة للبيانات المزدوجة (قبل/بعد، أو موضوعات مطابقة)، قم أولاً بحساب الفروقات ثم نفذ إجراءً عينة واحدة $t$ عليها.

7.9

Carrying Out a Test for a Difference of Means · ⁨تنفيذ اختبار لفرق المتوسطات⁩

Syllabus · ⁨المنهج⁩
English

Enduring Understanding (VAR-7): The $t$-distribution may be used to model variation.

Learning Objective VAR-7.I: Calculate an appropriate test statistic for a difference of two means. [Skill 3.E]

  • VAR-7.I.1 For a single quantitative variable, data collected using independent random samples or a randomized experiment from two populations, each of which can be modeled with a normal distribution, the sampling distribution of $t = \dfrac{(\overline{x}_1 - \overline{x}_2) - (\mu_1 - \mu_2)}{\sqrt{\dfrac{s_1^2}{n_1} + \dfrac{s_2^2}{n_2}}}$ is an approximate $t$-distribution with degrees of freedom that can be found using technology. The degrees of freedom fall between the smaller of $n_1 - 1$ and $n_2 - 1$ and $n_1 + n_2 - 2$.
    • Illustrative examples for VAR-7.I.1: In a study comparing mean recovery times for two surgical procedures to repair a torn anterior cruciate ligament (ACL), the group receiving one procedure had a sample size of 110, while the group receiving the other procedure had a sample size of 100. The degrees of freedom fall between 100 (the smaller of 110 and 100) and 208 (110 + 100 - 2). The degrees of freedom may be determined using technology. If the test statistic for this study is $t \approx 7.13$, then the $p$-value is the area greater than 7.13 for a $t$-distribution with $df = 207.18$ (2018 FRQ 4).

Boundary statement: The formulas for test statistics do not appear explicitly on the AP Statistics Formula Sheet provided with the AP Statistics Exam. However, these formulas do not need to be memorized, as they can be constructed based on the general test statistic formula and the standard error formulas for each of the relevant test statistics that are provided on the formula sheet.

Enduring Understanding (DAT-3): Significance testing allows us to make decisions about hypotheses within a particular context.

Learning Objective DAT-3.G: Interpret the $p$-value of a significance test for a difference of population means. [Skill 4.B]

  • DAT-3.G.1 An interpretation of the $p$-value of a significance test for a two-sample difference of population means should recognize that the $p$-value is computed by assuming that the null hypothesis is true, i.e., by assuming that the true population means are equal to each other.

Learning Objective DAT-3.H: Justify a claim about the population based on the results of a significance test for a difference of two population means in context. [Skill 4.E]

  • DAT-3.H.1 A formal decision explicitly compares the $p$-value to the significance $\alpha$. If the $p$-value $\leq \alpha$, then reject the null hypothesis, $H_0 : \mu_1 - \mu_2 = 0$, or $H_0 : \mu_1 = \mu_2$. If the $p$-value $> \alpha$, then fail to reject the null hypothesis.
  • DAT-3.H.2 The results of a significance test for a two-sample test for a difference between two population means can serve as the statistical reasoning to support the answer to a research question about the populations that were sampled.
العربية

الفهم الدائم (VAR-7): يمكن استخدام توزيع $t$ لنمذجة التباين.

الهدف التعليمي VAR-7.I: حساب إحصائية اختبار مناسبة للفرق بين متوسلين. [مهارة 3.E]

  • VAR-7.I.1 للمتغير الكمي الواحد، البيانات المُجمعة باستخدام عينات عشوائية مستقلة أو تجربة عشوائية من سكاكن، كل منهما يمكن نمذجته بتوزيع طبيعي، فإن التوزيع العيني لـ $t = \dfrac{(\overline{x}_1 - \overline{x}_2) - (\mu_1 - \mu_2)}{\sqrt{\dfrac{s_1^2}{n_1} + \dfrac{s_2^2}{n_2}}}$ هو توزيع t تقريبي $t$ بدرجات حرية يمكن العثور عليها باستخدام التكنولوجيا. تقع درجات الحرية بين الأصغر من $n_1 - 1$ و$n_2 - 1$ و$n_1 + n_2 - 2$.
    • أمثلة توضيحية لـ VAR-7.I.1: في دراسة تقارن متوسطات أوقات التعافي لإجراءين جراحيين لإصلاح الرباط الصليبي الأمامي الممزق (ACL)، كان حجم العينة للمجموعة التي تلقى أحد الإجراءين 110، بينما كان حجم العينة للمجموعة التي تلقى الإجراء الآخر 100. تتراوح درجات الحرية بين 100 (الأصغر بين 110 و100) و208 (110 + 100 - 2). يمكن تحديد درجات الحرية باستخدام التكنولوجيا. إذا كانت إحصاءة الاختبار لهذه الدراسة تساوي $t \approx 7.13$، فإن قيمة $p$ هي المساحة الأكبر من 7.13 لتوزيع $t$ بـ $df = 207.18$ درجة حرية (2018 FRQ 4).

عبارة حدودية: لا تظهر صيغ إحصائيات الاختبار بشكل صريح في ورقة صيغ امتحان AP للإحصاء المرفقة باختبار AP للإحصاء. ومع ذلك، لا حاجة لحفظها لأنها يمكن بناؤها بناءً على صيغة إحصائية الاختبار العامة وصيغ الخطأ المعياري لكل من إحصائيات الاختبار ذات الصلة الموجودة في ورقة الصيغ.

الفهم الدائم (DAT-3): يسمح اختبار الأهمية باتخاذ قرارات بشأن الفرضيات ضمن سياق معين.

الهدف التعليمي DAT-3.G: تفسير قيمة p$p$ لاختبار دلالة للفرق بين متوسلي السكان. [مهارة 4.B]

  • DAT-3.G.1 يجب أن يدرك تفسير قيمة $p$ لاختبار دلالة لفرق في متوسطات مجتمعين ثنائيي العينة أن قيمة $p$ تُحسب بافتراض صحة الفرضية الصفرية، أي بافتراض أن متوسطات المجتمع الحقيقية متساوية.

هدف التعلم DAT-3.H: تبرير ادعاء حول المجتمع بناءً على نتائج اختبار دلالة لفرق في متوسطات مجتمعين ثنائيي العينة في السياق. [مهارة 4.E]

  • DAT-3.H.1 المقارنة الرسمية تقارن صراحة بين قيمة $p$ ومستوى الدلالة $\alpha$. إذا كانت قيمة $p$ $\leq \alpha$، فإننا نرفض الفرضية الصفرية، $H_0 : \mu_1 - \mu_2 = 0$، أو $H_0 : \mu_1 = \mu_2$. وإذا كانت قيمة $p$ $> \alpha$، فإننا نفشل في رفض الفرضية الصفرية.
  • DAT-3.H.2 يمكن أن تعمل نتائج اختبار دلالة لفرق في متوسطات مجتمعين ثنائيي العينة كأساس استدلالي إحصائي لدعم الإجابة على سؤال بحثي يتعلق بالمجتمعات التي تم أخذ العينات منها.

Source: College Board AP Course and Exam Description · ⁨المصدر: وصف دورة وامتحان College Board AP⁩

English

The two-sample $t$ statistic:

$$t=\frac{(\bar{x}_1-\bar{x}_2)-0}{\sqrt{\frac{s_1^2}{n_1}+\frac{s_2^2}{n_2}}}.$$
Get the $p$-value (technology for $df$), compare to $\alpha$, conclude in context.

العربية

إحصاء العينة الثنائية $t$:

$$t=\frac{(\bar{x}_1-\bar{x}_2)-0}{\sqrt{\frac{s_1^2}{n_1}+\frac{s_2^2}{n_2}}}.$$
احصل على قيمة $p$ (باستخدام التقنية لـ $df$)، قارنها بـ $\alpha$، واستنتج في السياق.

7.10

Selecting and Communicating a Procedure · ⁨اختيار وإبلاغ الإجراء المناسب⁩

Syllabus · ⁨المنهج⁩
English

This topic is intended to focus on the skill of selecting an appropriate inference procedure, now that students have a range of options. Students should be given opportunities to practice when and how to apply all learning objectives relating to inference involving proportions or means.

العربية

هذا الموضوع مخصص للتركيز على مهارة اختيار إجراء استدلال مناسب، الآن بعد أن أصبح لدى الطلاب مجموعة من الخيارات. يجب منح الطلاب فرصًا للتدريب على متى وكيف تطبيق جميع الأهداف التعليمية المتعلقة بالاستدلال الذي يتضمن نسب أو متوسطات.

Source: College Board AP Course and Exam Description · ⁨المصدر: وصف دورة وامتحان College Board AP⁩

English

The hardest exam skill is choosing the right procedure: one or two samples? proportion or mean? paired or independent? confidence interval or test? Read the question for what is being estimated or claimed, then name the procedure, check its conditions, carry it out, and communicate the conclusion clearly with numbers and context.

العربية

أصعب مهارة امتحان هي اختيار الإجراء الصحيح: عينة واحدة أم اثنتين؟ نسبة أم متوسط؟ بيانات مزدوجة أم مستقلة؟ مجال ثقة أم اختبار؟ اقرأ السؤال لمعرفة ما يتم تقديره أو الادعاء به، ثم حدد الإجراء، تحقق من شروطه، تنفيذه، وأبلغ عن الاستنتاج بوضوح بالأرقام والسياق.

7.10

Exam tips · ⁨نصائح للامتحان⁩

English
  • Use t-procedures for means (population $\sigma$ unknown) — the t-distribution has heavier tails than normal.
  • Check conditions: random, independent, and roughly normal (or large $n$).
  • Interpret an interval and a test in context, always tied to the parameter (the true mean).
  • Match the right procedure: one-sample, two-sample, or paired (look for a natural pairing).
  • State the degrees of freedom; for a two-sample $t$-test use technology's value (or, by hand, the conservative smaller $n-1$).
العربية
  • استخدم إجراءات t للمتوسطات (مجهول $\sigma$ للسكان) — حيث أن توزيع t له ذيول أثقل من التوزيع الطبيعي.
  • تحقق من الشروط: عشوائية، استقلالية، وتوزيع طبيعي تقريبياً (أو حجم $n$ كبير).
  • فسر مجالاً واختباراً في السياق، مرتبطين دائماً بالمعامل (المتوسط الحقيقي).
  • طابق الإجراء الصحيح: عينة واحدة، عينة ثنائية، أو مزدوجة (ابحث عن ارتباط طبيعي).
  • حدد درجات الحرية؛ لاختبار $t$ العينة الثنائية استخدم قيمة التقنية (أو، بالحساب اليدوي، الأصغر تحفظياً $n-1$).

Interactive lessons on this topic · ⁨دروس تفاعلية حول هذا الموضوع⁩

Work through it step by step, with instant-check exercises. · ⁨ا-working عليه خطوة بخطوة، مع تمارين تحقق فوري.⁩

Past Papers · ⁨أوراق الامتحانات السابقة⁩

More topics in AP Statistics · ⁨AP الإحصاء⁩ · ⁨المزيد من المواضيع في AP Statistics · ⁨AP الإحصاء⁩⁩

Log in or create account · ⁨تسجيل الدخول أو إنشاء حساب⁩

IGCSE, A-Level & AP