Skip to content · ⁨Bỏ qua nội dung⁩

Sampling Distributions · ⁨Phân phối Lấy mẫu⁩

AP Statistics · ⁨AP Thống kê⁩ · Topic 5 · ⁨Chủ đề 5⁩

Video lesson for this topic · ⁨Bài học video cho chủ đề này⁩ Open the video page · ⁨Mở trang video⁩
7:32

Phân phối Lấy mẫu

Hai nghìn học sinh theo học trường này, và một số trong họ đi xe đạp đến đây. Chúng ta muốn biết tỷ lệ phần trăm. Không ai có thể hỏi tất cả hai nghìn người, vì vậy chúng ta hỏi ngẫu nhiên một trăm người.…

English narration · English + 中文 subtitles burned in · ⁨Giọng đọc tiếng Anh · phụ đề tiếng Anh + 中文 được ghi trực tiếp⁩

5.1

Why Two Samples Never Match: Sampling Variability · ⁨Tại sao Hai mẫu Không Bao giờ Trùng Khớp: Biến động Lấy mẫu⁩

Syllabus · ⁨Chương trình⁩
English

Enduring Understanding (VAR-1): Given that variation may be random or not, conclusions are uncertain.

Learning Objective VAR-1.G: Identify questions suggested by variation in statistics for samples collected from the same population. [Skill 1.A]

  • VAR-1.G.1 Variation in statistics for samples taken from the same population may be random or not.
Tiếng Việt

Hiểu biết bền vững (VAR-1): Vì sự biến thiên có thể ngẫu nhiên hoặc không, nên những kết luận đều mang tính bất định.

Mục tiêu học tập VAR-1.G: Xác định các câu hỏi gợi ý từ sự biến thiên trong thống kê đối với các mẫu thu thập từ cùng một quần thể. [Kỹ năng 1.A]

  • VAR-1.G.1 Sự biến thiên trong thống kê của các mẫu lấy từ cùng một quần thể có thể do ngẫu nhiên hoặc không.
Source: College Board AP Course and Exam Description · ⁨Nguồn: Mô tả Khóa học và Bài thi College Board AP⁩

English

A statistic 统计量 (like a sample mean $\bar{x}$ or sample proportion $\hat{p}$) is computed from a sample and varies from sample to sample – this is sampling variability 抽样变异. A parameter 参数 ($\mu$ or $p$) is the fixed truth about the population. The sampling distribution 抽样分布 is the distribution of a statistic over all possible samples of a given size – it is the bridge from one sample to inference.

Tiếng Việt

Một thống kê (như trung bình mẫu $\bar{x}$ hay tỷ lệ mẫu $\hat{p}$) được tính toán từ một mẫu và dao động từ mẫu này sang mẫu khác – đây là biến động lấy mẫu. Một tham số ($\mu$ hoặc $p$) là chân lý cố định về quần thể. Phân phối lấy mẫu là phân phối của một thống kê trên tất cả các mẫu có thể có với kích thước cho trước – nó đóng vai trò cầu nối từ một mẫu sang suy luận.

5.2

The Normal Curve as a Model for a Statistic · ⁨Đường cong Chuẩn như một Mô hình cho Thống kê⁩

Syllabus · ⁨Chương trình⁩
Enduring UnderstandingLearning ObjectiveEssential Knowledge

VAR-6
The normal distribution may be used to model variation.

VAR-6.A
Calculate the probability that a particular value lies in a given interval of a normal distribution. [Skill 3.A]

  • VAR-6.A.1 A continuous random variable is a variable that can take on any value within a specified domain. Every interval within the domain has a probability associated with it.
  • VAR-6.A.2 A continuous random variable with a normal distribution is commonly used to describe populations. The distribution of a normal random variable can be described by a normal, or "bell-shaped," curve.
  • VAR-6.A.3 The area under a normal curve over a given interval represents the probability that a particular value lies in that interval.
    • Illustrative examples for VAR-6.A: Continuous random variable: If one looks at a clock at a random time, the probability that the minute hand is between the 3 and the 6 is one fourth.

VAR-6.B
Determine the interval associated with a given area in a normal distribution. [Skill 3.A]

  • VAR-6.B.1 The boundaries of an interval associated with a given area in a normal distribution can be determined using $z$-scores or technology, such as a calculator, a standard normal table, or computer-generated output.
  • VAR-6.B.2 Intervals associated with a given area in a normal distribution can be determined by assigning appropriate inequalities to the boundaries of the intervals:
    • a. $P(X < x_a) = \dfrac{p}{100}$ means that the lowest $p\%$ of values lie to the left of $x_a$.
    • b. $P(x_a < X < x_b) = \dfrac{p}{100}$ means that $p\%$ of values lie between $x_a$ and $x_b$.
    • c. $P(X > x_b) = \dfrac{p}{100}$ means that the highest $p\%$ of values lie to the right of $x_b$.
    • d. To determine the most extreme $p\%$ of values requires dividing the area associated with $p\%$ into two equal areas on either extreme of the distribution: $P(X < x_a) = \dfrac{1}{2}\dfrac{p}{100}$ and $P(X > x_b) = \dfrac{1}{2}\dfrac{p}{100}$ means that half of the $p\%$ most extreme values lie to the left of $x_a$ and half of the $p\%$ most extreme values lie to the right of $x_b$.

VAR-6.C
Determine the appropriateness of using the normal distribution to approximate probabilities for unknown distributions. [Skill 3.C]

  • VAR-6.C.1 Normal distributions are symmetrical and "bell-shaped." As a result, normal distributions can be used to approximate distributions with similar characteristics.

Source: College Board AP Course and Exam Description · ⁨Nguồn: Mô tả Khóa học và Bài thi College Board AP⁩

English
The normal distribution

For large enough samples, many sampling distributions are approximately normal. That lets us describe a statistic by a center (its mean), a spread (its standard error 标准误), and a normal shape – and then compute how likely a given sample result is.

Tiếng Việt
Phân phối chuẩn

Đối với các mẫu đủ lớn, nhiều phân phối lấy mẫu xấp xỉ chuẩn. Điều đó cho phép chúng ta mô tả một thống kê bằng một trung tâm (kỳ vọng của nó), một độ phân tán (sai số chuẩn) và hình dạng chuẩn – rồi từ đó tính toán khả năng xảy ra của một kết quả mẫu cụ thể.

Explore · ⁨Khám phá⁩

Use the normal curve to find a proportion · ⁨Sử dụng đường cong chuẩn để tìm tỷ lệ⁩

A normal model turns a range of values into an area = a proportion. Shade a band to read off the fraction of samples falling within it (the 68-95-99.7 rule). · ⁨Mô hình chuẩn hóa chuyển một tập hợp các giá trị thành một diện tích = một tỷ lệ. Tô đậm một dải region để đọc được phần trăm mẫu nằm trong khoảng đó (quy tắc 68-95-99.7).⁩

5.3

The Central Limit Theorem · ⁨Định giới hạn Trung tâm⁩

Syllabus · ⁨Chương trình⁩
English

Enduring Understanding (UNC-3): Probabilistic reasoning allows us to anticipate patterns in data.

Learning Objective UNC-3.H: Estimate sampling distributions using simulation. [Skill 3.C]

  • UNC-3.H.1 A sampling distribution of a statistic is the distribution of values for the statistic for all possible samples of a given size from a given population.
  • UNC-3.H.2 The central limit theorem (CLT) states that when the sample size is sufficiently large, a sampling distribution of the mean of a random variable will be approximately normally distributed.
  • UNC-3.H.3 The central limit theorem requires that the sample values are independent of each other and that $n$ is sufficiently large.
  • UNC-3.H.4 A randomization distribution is a collection of statistics generated by simulation assuming known values for the parameters. For a randomized experiment, this means repeatedly randomly reallocating/reassigning the response values to treatment groups.
  • UNC-3.H.5 The sampling distribution of a statistic can be simulated by generating repeated random samples from a population.
Tiếng Việt

Hiểu biết Bền vững (UNC-3): Lập luận xác suất cho phép chúng ta dự đoán các mẫu trong dữ liệu.

Mục tiêu học tập UNC-3.H: Ước lượng phân phối mẫu bằng cách mô phỏng. [Kỹ năng 3.C]

  • UNC-3.H.1 Phân phối mẫu của một thống kê là phân phối các giá trị của thống kê đó đối với tất cả các mẫu có kích thước cho trước từ một quần thể cho trước.
  • UNC-3.H.2 Định lý giới hạn trung tâm (CLT) phát biểu rằng khi kích thước mẫu đủ lớn, phân phối mẫu của trung bình một biến ngẫu nhiên sẽ xấp xỉ phân phối chuẩn.
  • UNC-3.H.3 Định lý giới hạn trung tâm yêu cầu các giá trị mẫu phải độc lập với nhau và $n$ phải đủ lớn.
  • UNC-3.H.4 Phân phối ngẫu nhiên hóa là tập hợp các thống kê được sinh ra từ quá trình mô phỏng dựa trên giả thiết các giá trị tham số đã biết. Đối với thí nghiệm ngẫu nhiên hóa, điều này có nghĩa là lặp lại việc phân bổ lại/gián phân ngẫu nhiên các giá trị phản hồi vào các nhóm xử lý.
  • UNC-3.H.5 Phân phối mẫu của một thống kê có thể được mô phỏng bằng cách tạo ra các mẫu ngẫu nhiên lặp lại từ một quần thể.

Source: College Board AP Course and Exam Description · ⁨Nguồn: Mô tả Khóa học và Bài thi College Board AP⁩

English
The Central Limit Theorem

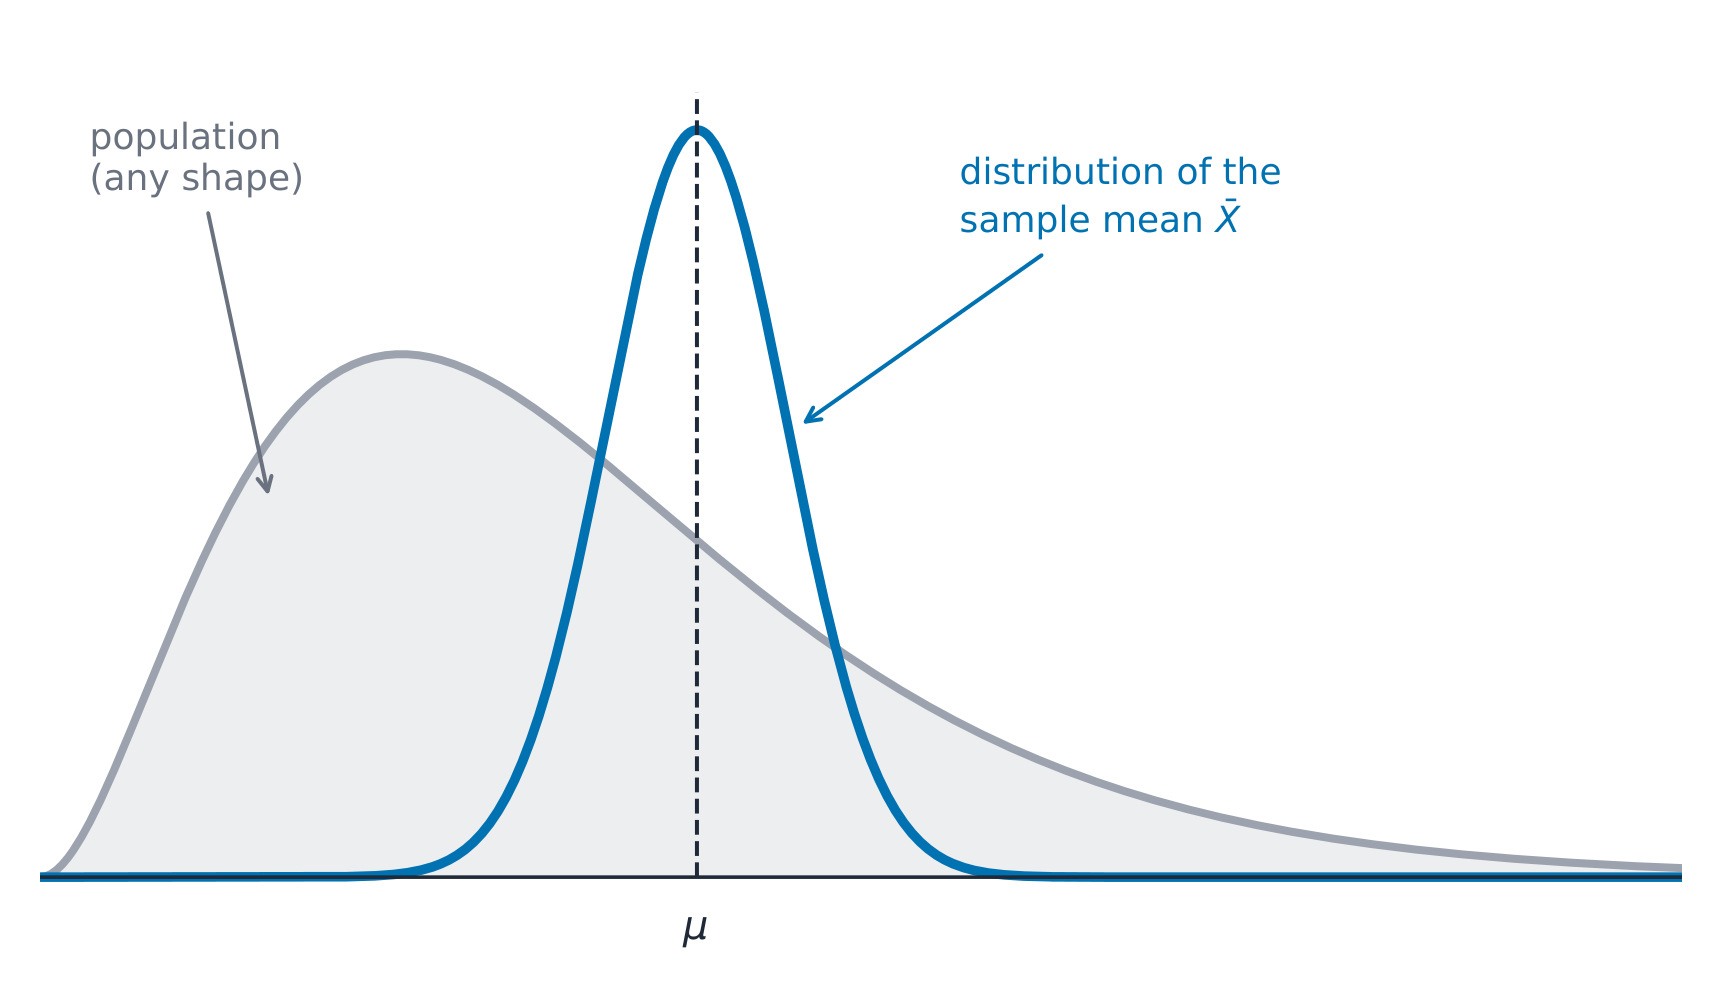
The Central Limit Theorem 中心极限定理 (CLT): for a sample mean, if the sample size $n$ is large enough (a common rule is $n\ge 30$), the sampling distribution of $\bar{x}$ is approximately normal, regardless of the population's shape. The larger $n$, the more normal and the tighter the distribution.

Tiếng Việt
Định lý giới hạn trung tâm

Định giới hạn Trung tâm (CLT): đối với trung bình mẫu, nếu kích thước mẫu $n$ đủ lớn (một quy tắc phổ biến là $n\ge 30$), phân phối lấy mẫu của $\bar{x}$ xấp xỉ chuẩn, bất kể hình dạng của quần thể. Kích thước $n$ càng lớn, phân phối càng gần chuẩn và tập trung chặt chẽ hơn.

Trung bình mẫu gần như chuẩn bất kể hình dạng của quần thể
Explore · ⁨Khám phá⁩

Watch a sampling distribution turn normal · ⁨Xem phân phối mẫu trở thành chuẩn⁩

The Central Limit Theorem: for a large enough sample, the distribution of the sample mean is approximately normal — whatever the shape of the population. · ⁨Định lý giới hạn trung tâm: với mẫu đủ lớn, phân phối của trung bình mẫu xấp xỉ chuẩn — bất kể hình dạng của tổng thể.⁩

Vocabulary · ⁨Từ vựng⁩ Train · ⁨Luyện tập⁩
English Tiếng Việt
statistic/stəˈtɪstɪk/ thống kê
sampling variability/ˈsæmplɪŋ ˌveərɪəˈbɪlɪti/ biến thiên trong lấy mẫu
parameter/pəˈræmɪtə/ parameter
sampling distribution/ˈsæmplɪŋ ˌdɪstrɪˈbjuːʃn/ phân phối mẫu
standard error/ˈstændəd ˈerə/ sai số chuẩn
Central Limit Theorem/ˈsentrəl ˈlɪmɪt ˈθɪərəm/ Định lý Giới hạn Trung tâm
unbiased/ʌnˈbaɪəst/ không thiên lệch
5.4

Good Guesses and Bad Guesses: Bias · ⁨Dự đoán Tốt và Dự đoán Xấu: Độ thiên lệch⁩

Syllabus · ⁨Chương trình⁩
English

Enduring Understanding (UNC-3): Probabilistic reasoning allows us to anticipate patterns in data.

Learning Objective UNC-3.I: Explain why an estimator is or is not unbiased. [Skill 4.B]

  • UNC-3.I.1 When estimating a population parameter, an estimator is unbiased if, on average, the value of the estimator is equal to the population parameter.

Learning Objective UNC-3.J: Calculate estimates for a population parameter. [Skill 3.B]

  • UNC-3.J.1 When estimating a population parameter, an estimator exhibits variability that can be modeled using probability.
  • UNC-3.J.2 A sample statistic is a point estimator of the corresponding population parameter.
Tiếng Việt

Hiểu biết Bền vững (UNC-3): Lập luận xác suất cho phép chúng ta dự đoán các mẫu trong dữ liệu.

Mục tiêu học tập UNC-3.I: Giải thích tại sao một ước lượng viên là không thiên hoặc có thiên. [Kỹ năng 4.B]

  • UNC-3.I.1 Khi ước lượng tham số quần thể, một ước lượng viên được coi là không thiên nếu, về mặt trung bình, giá trị của ước lượng viên bằng với tham số quần thể.

Mục tiêu học tập UNC-3.J: Tính toán các ước lượng cho một tham số quần thể. [Kỹ năng 3.B]

  • UNC-3.J.1 Khi ước lượng tham số của quần thể, một ước lượng viên thể hiện sự biến thiên có thể được mô hình hóa bằng xác suất.
  • UNC-3.J.2 Một thống kê mẫu là một ước lượng điểm cho tham số tương ứng của quần thể.

Source: College Board AP Course and Exam Description · ⁨Nguồn: Mô tả Khóa học và Bài thi College Board AP⁩

English

A statistic is unbiased 无偏 if the mean of its sampling distribution equals the parameter – it is correct on average. Bias is about the center being off; variability is about the spread. A good estimator is both unbiased (centered right) and low-variability (precise); larger samples reduce variability but do not fix bias from bad sampling.

Tiếng Việt

Một thống kê được gọi là không thiên lệch nếu kỳ vọng của phân phối lấy mẫu của nó bằng tham số – nghĩa là nó chính xác trung bình. Độ thiên lệch liên quan đến việc trung tâm bị lệch; biến động liên quan đến độ phân tán. Một ước lượng tốt vừa không thiên lệch (trung tâm đúng) vừa có độ biến động thấp (chính xác); mẫu lớn hơn giảm độ biến động nhưng không khắc phục được độ thiên lệch do lấy mẫu kém.

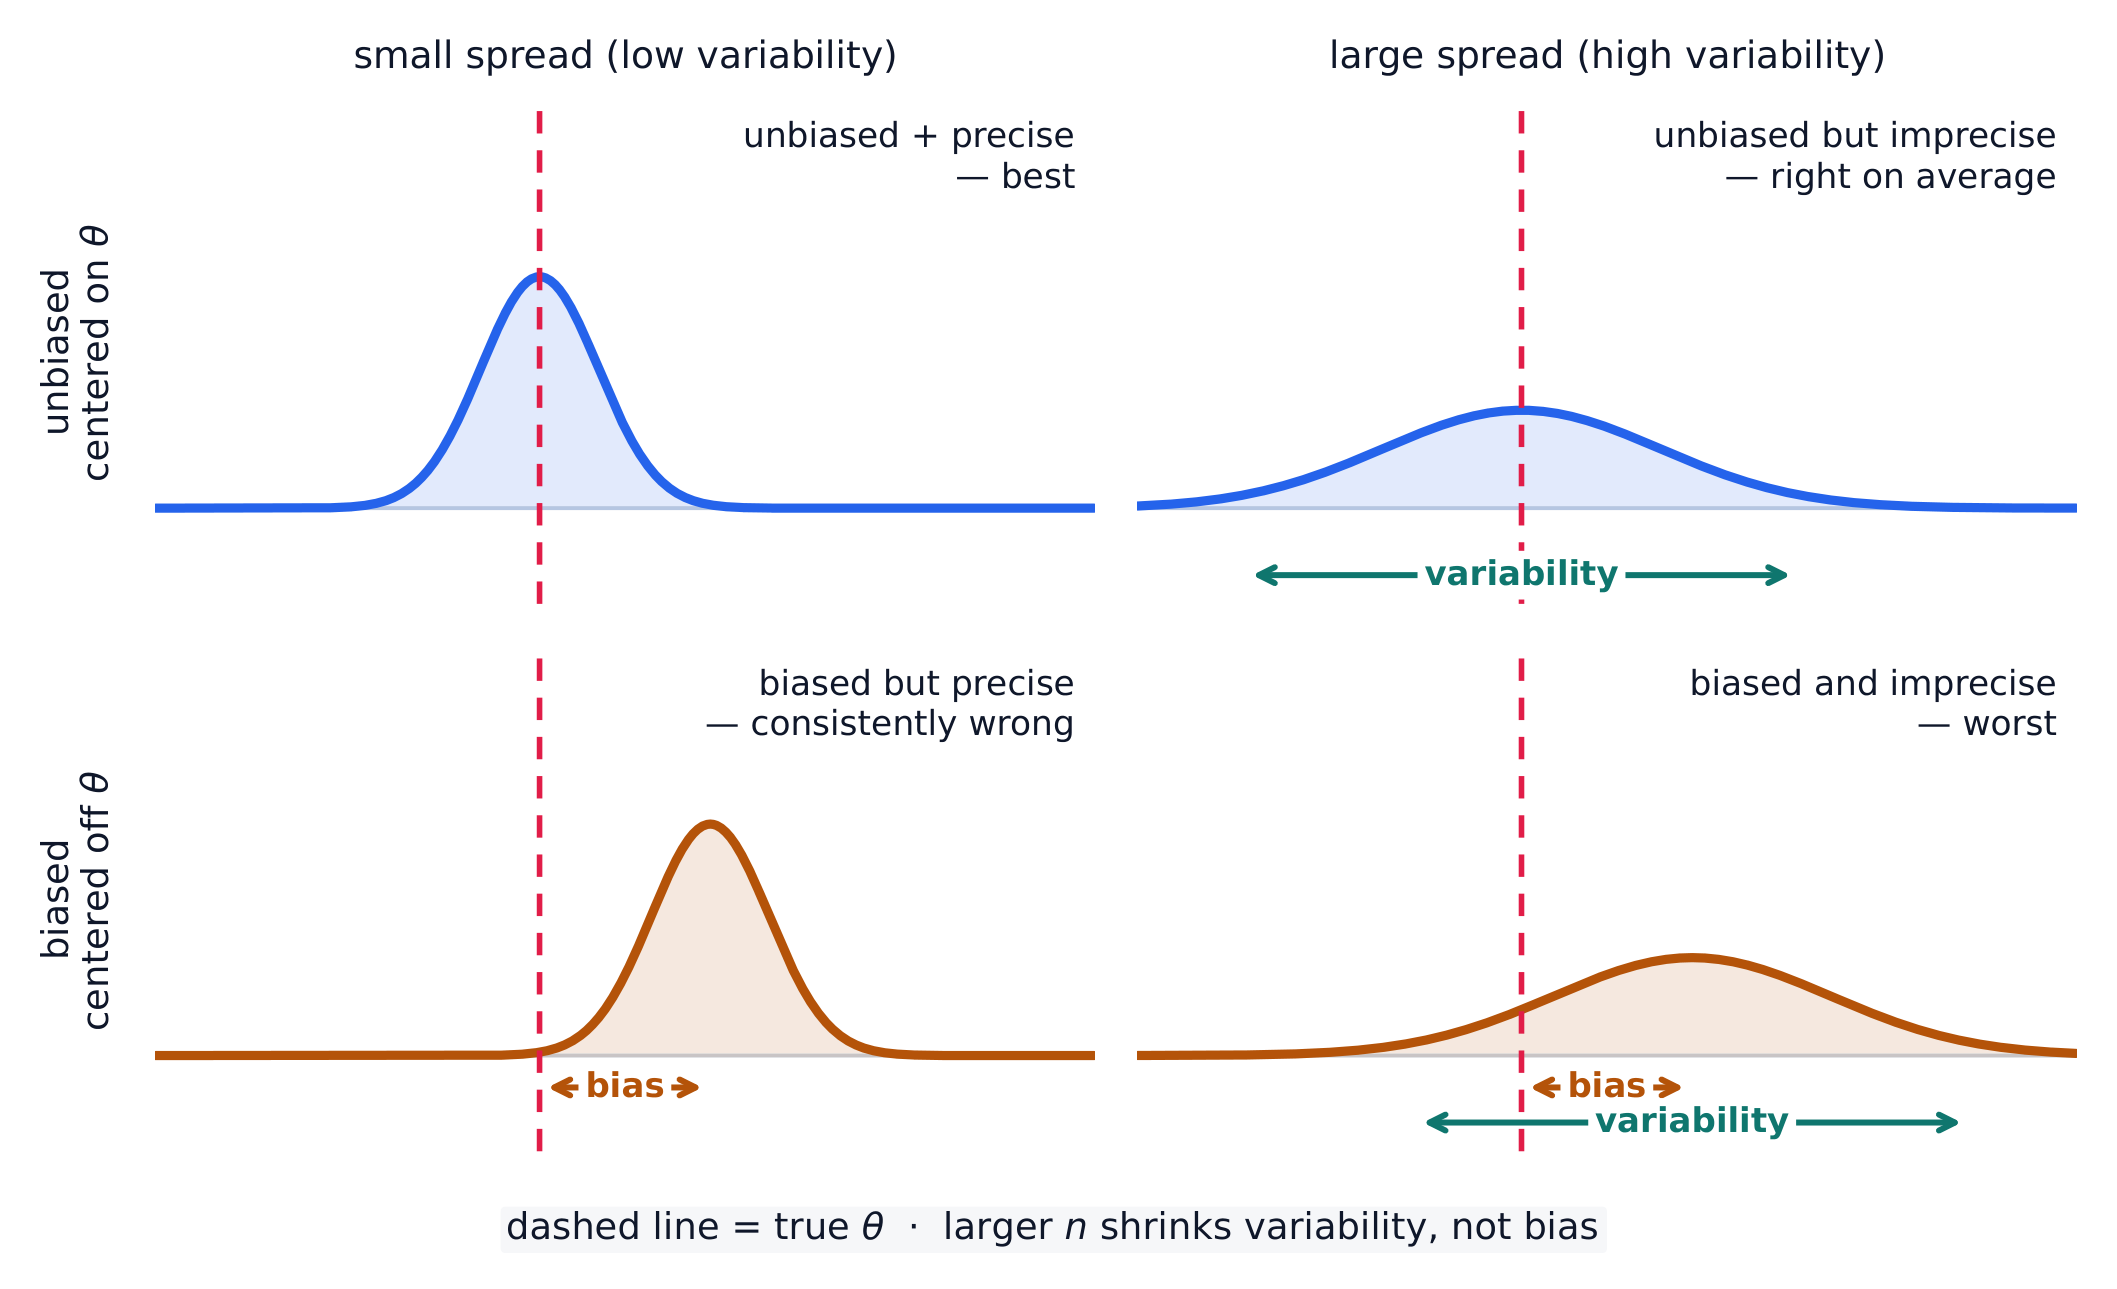
Bốn phân phối lấy mẫu cắt ngang giữa độ thiên lệch và biến động, so với tham số thực tế
Độ lệch và độ biến thiên là hai lỗi riêng biệt. Chỉ có ước lượng ở góc trên bên trái vừa nằm chính giữa $\theta$, vừa tập trung; còn ước lượng ở góc dưới bên trái thì chính xác nhưng luôn luôn sai, điều mà không một lượng dữ liệu nào thêm vào cũng có thể khắc phục được.
5.5

The Sampling Distribution of a Sample Proportion · ⁨Phân phối lấy mẫu của tỷ lệ mẫu⁩

Syllabus · ⁨Chương trình⁩
English

Enduring Understanding (UNC-3): Probabilistic reasoning allows us to anticipate patterns in data.

Learning Objective UNC-3.K: Determine parameters of a sampling distribution for sample proportions. [Skill 3.B]

  • UNC-3.K.1 For independent samples (sampling with replacement) of a categorical variable from a population with population proportion, $p$, the sampling distribution of the sample proportion, $\hat{p}$, has a mean, $\mu_{\hat{p}} = p$ and a standard deviation, $\sigma_{\hat{p}} = \sqrt{\dfrac{p(1-p)}{n}}$.
  • UNC-3.K.2 If sampling without replacement, the standard deviation of the sample proportion is smaller than what is given by the formula above. If the sample size is less than 10% of the population size, the difference is negligible.

Learning Objective UNC-3.L: Determine whether a sampling distribution for a sample proportion can be described as approximately normal. [Skill 3.C]

  • UNC-3.L.1 For a categorical variable, the sampling distribution of the sample proportion, $\hat{p}$, will have an approximate normal distribution, provided the sample size is large enough: $np \geq 10$ and $n(1-p) \geq 10$

Learning Objective UNC-3.M: Interpret probabilities and parameters for a sampling distribution for a sample proportion. [Skill 4.B]

  • UNC-3.M.1 Probabilities and parameters for a sampling distribution for a sample proportion should be interpreted using appropriate units and within the context of a specific population.
Tiếng Việt

Hiểu biết Bền vững (UNC-3): Lập luận xác suất cho phép chúng ta dự đoán các mẫu trong dữ liệu.

Mục tiêu học tập UNC-3.K: Xác định các tham số của phân phối mẫu cho tỷ lệ mẫu. [Kỹ năng 3.B]

  • UNC-3.K.1 Đối với mẫu độc lập (lấy mẫu có hoàn lại) của một biến phân loại từ một quần thể có tỷ lệ quần thể $p$, phân phối mẫu của tỷ lệ mẫu, $\hat{p}$, có trung bình $\mu_{\hat{p}} = p$ và độ lệch chuẩn $\sigma_{\hat{p}} = \sqrt{\dfrac{p(1-p)}{n}}$.
  • UNC-3.K.2 Nếu lấy mẫu không hoàn lại, độ lệch chuẩn của tỷ lệ mẫu sẽ nhỏ hơn so với công thức trên. Nếu kích thước mẫu nhỏ hơn 10% kích thước quần thể, sự chênh lệch này là không đáng kể.

Mục tiêu học tập UNC-3.L: Xác định xem phân phối mẫu cho tỷ lệ mẫu có thể được mô tả xấp xỉ theo phân phối chuẩn hay không. [Kỹ năng 3.C]

  • UNC-3.L.1 Đối với một biến phân loại, phân phối mẫu của tỷ lệ mẫu, $\hat{p}$, sẽ có phân phối chuẩn xấp xỉ, miễn là kích thước mẫu đủ lớn: $np \geq 10$ và $n(1-p) \geq 10$

Mục tiêu học tập UNC-3.M: Giải thích xác suất và tham số cho phân phối mẫu của tỷ lệ mẫu. [Kỹ năng 4.B]

  • UNC-3.M.1 Xác suất và tham số cho phân phối mẫu của tỷ lệ mẫu nên được giải thích sử dụng đơn vị phù hợp và trong ngữ cảnh của một quần thể cụ thể.

Source: College Board AP Course and Exam Description · ⁨Nguồn: Mô tả Khóa học và Bài thi College Board AP⁩

English

For a sample proportion $\hat{p}$ from an SRS: the mean is $p$ (unbiased), and the standard deviation is

$$\sigma_{\hat p}=\sqrt{\frac{p(1-p)}{n}}.$$
This spread has two names: it is the standard deviation of the sampling distribution, and it is called the standard error once you must estimate it from the sample (replacing $p$ by $\hat p$) — which is exactly what the later inference units do. It is approximately normal when $np\ge 10$ and $n(1-p)\ge 10$ (the Large Counts condition), and the $10\%$ condition ($n\le 0.10N$) keeps the observations near-independent.

Worked example. Suppose $40\%$ of voters favor a measure ($p=0.4$) and you sample $n=100$. The standard error is $\sigma_{\hat p}=\sqrt{\dfrac{0.4(0.6)}{100}}=0.049$. The chance a sample gives $\hat{p}>0.5$ is $z=\dfrac{0.5-0.4}{0.049}=2.04$, so $P(\hat p>0.5)\approx0.02$ – a majority in the sample would be surprising.

Tiếng Việt

Đối với tỷ lệ mẫu $\hat{p}$ từ một mẫu ngẫu nhiên đơn (SRS): kỳ vọng là $p$ (không thiên lệch), và độ tiêu chuẩn là

$$\sigma_{\hat p}=\sqrt{\frac{p(1-p)}{n}}.$$
Độ phân tán này có hai tên: nó là độ tiêu chuẩn của phân phối lấy mẫu, và được gọi là sai số chuẩn khi bạn phải ước lượng nó từ mẫu (thay thế $p$ bằng $\hat p$) — đây chính là những gì các đơn vị suy luận sau này thực hiện. Nó xấp xỉ phân phối chuẩn khi $np\ge 10$ và $n(1-p)\ge 10$ (điều kiện Số lượng lớn), và điều kiện $10\%$ ($n\le 0.10N$) giữ cho các quan sát gần như độc lập.

Ví dụ minh họa. Giả sử $40\%$ cử tri ủng hộ một dự luật ($p=0.4$) và bạn lấy mẫu $n=100$. Sai số chuẩn là $\sigma_{\hat p}=\sqrt{\dfrac{0.4(0.6)}{100}}=0.049$. Xác suất để một mẫu đưa ra kết quả $\hat{p}>0.5$ là $z=\dfrac{0.5-0.4}{0.049}=2.04$, vì vậy $P(\hat p>0.5)\approx0.02$ – việc một đa số xuất hiện trong mẫu sẽ là điều đáng ngạc nhiên.

5.6

Comparing Two Groups: Difference of Sample Proportions · ⁨So sánh hai nhóm: Sự chênh lệch tỷ lệ mẫu⁩

Syllabus · ⁨Chương trình⁩
English

Enduring Understanding (UNC-3): Probabilistic reasoning allows us to anticipate patterns in data.

Learning Objective UNC-3.N: Determine parameters of a sampling distribution for a difference in sample proportions. [Skill 3.B]

  • UNC-3.N.1 For a categorical variable, when randomly sampling with replacement from two independent populations with population proportions $p_1$ and $p_2$, the sampling distribution of the difference in sample proportions $\hat{p}_1 - \hat{p}_2$ has mean, $\mu_{\hat{p}_1 - \hat{p}_2} = p_1 - p_2$ and standard deviation, $\sigma_{\hat{p}_1 - \hat{p}_2} = \sqrt{\dfrac{p_1(1-p_1)}{n_1} + \dfrac{p_2(1-p_2)}{n_2}}$.
  • UNC-3.N.2 If sampling without replacement, the standard deviation of the difference in sample proportions is smaller than what is given by the formula above. If the sample sizes are less than 10% of the population sizes, the difference is negligible.

Learning Objective UNC-3.O: Determine whether a sampling distribution for a difference of sample proportions can be described as approximately normal. [Skill 3.C]

  • UNC-3.O.1 The sampling distribution of the difference in sample proportions $\hat{p}_1 - \hat{p}_2$ will have an approximate normal distribution provided the sample sizes are large enough: $n_1 p_1 \geq 10, n_1(1-p_1) \geq 10, n_2 p_2 \geq 10, n_2(1-p_2) \geq 10$.

Learning Objective UNC-3.P: Interpret probabilities and parameters for a sampling distribution for a difference in proportions. [Skill 4.B]

  • UNC-3.P.1 Parameters for a sampling distribution for a difference of proportions should be interpreted using appropriate units and within the context of a specific populations.
Tiếng Việt

Hiểu biết Bền vững (UNC-3): Lập luận xác suất cho phép chúng ta dự đoán các mẫu trong dữ liệu.

Mục tiêu học tập UNC-3.N: Xác định các tham số của phân phối mẫu cho hiệu số tỷ lệ mẫu. [Kỹ năng 3.B]

  • UNC-3.N.1 Đối với một biến phân loại, khi lấy mẫu ngẫu nhiên có hoàn lại từ hai quần thể độc lập có tỷ lệ quần thể $p_1$ và $p_2$, phân phối mẫu của hiệu số tỷ lệ mẫu $\hat{p}_1 - \hat{p}_2$ có trung bình $\mu_{\hat{p}_1 - \hat{p}_2} = p_1 - p_2$ và độ lệch chuẩn $\sigma_{\hat{p}_1 - \hat{p}_2} = \sqrt{\dfrac{p_1(1-p_1)}{n_1} + \dfrac{p_2(1-p_2)}{n_2}}$.
  • UNC-3.N.2 Nếu lấy mẫu không hoàn lại, độ lệch chuẩn của hiệu số tỷ lệ mẫu sẽ nhỏ hơn so với công thức trên. Nếu kích thước mẫu nhỏ hơn 10% kích thước quần thể, sự chênh lệch này là không đáng kể.

Mục tiêu học tập UNC-3.O: Xác định xem phân phối mẫu cho hiệu số tỷ lệ mẫu có thể được mô tả xấp xỉ theo phân phối chuẩn hay không. [Kỹ năng 3.C]

  • UNC-3.O.1 Phân phối mẫu của hiệu số tỷ lệ mẫu $\hat{p}_1 - \hat{p}_2$ sẽ có phân phối chuẩn xấp xỉ, miễn là kích thước mẫu đủ lớn: $n_1 p_1 \geq 10, n_1(1-p_1) \geq 10, n_2 p_2 \geq 10, n_2(1-p_2) \geq 10$.

Mục tiêu học tập UNC-3.P: Giải thích xác suất và tham số cho phân phối mẫu của hiệu số tỷ lệ. [Kỹ năng 4.B]

  • UNC-3.P.1 Tham số cho phân phối mẫu của hiệu số tỷ lệ nên được giải thích sử dụng đơn vị phù hợp và trong ngữ cảnh của các quần thể cụ thể.

Source: College Board AP Course and Exam Description · ⁨Nguồn: Mô tả Khóa học và Bài thi College Board AP⁩

English

For $\hat{p}_1-\hat{p}_2$ from two independent samples: the mean is $p_1-p_2$, and because the samples are independent the variances add:

$$\sigma_{\hat p_1-\hat p_2}=\sqrt{\frac{p_1(1-p_1)}{n_1}+\frac{p_2(1-p_2)}{n_2}}.$$
It is approximately normal when the Large Counts condition holds in both samples.

Tiếng Việt

Đối với $\hat{p}_1-\hat{p}_2$ từ hai mẫu độc lập: kỳ vọng là $p_1-p_2$, và do các mẫu độc lập nên biến cộng lại:

$$\sigma_{\hat p_1-\hat p_2}=\sqrt{\frac{p_1(1-p_1)}{n_1}+\frac{p_2(1-p_2)}{n_2}}.$$
Nó xấp xỉ phân phối chuẩn khi điều kiện Số lượng lớn được thỏa mãn ở cả hai mẫu.

5.7

The Sampling Distribution of a Sample Mean · ⁨Phân phối lấy mẫu của trung bình mẫu⁩

Syllabus · ⁨Chương trình⁩
English

Enduring Understanding (UNC-3): Probabilistic reasoning allows us to anticipate patterns in data.

Learning Objective UNC-3.Q: Determine parameters for a sampling distribution for sample means. [Skill 3.B]

  • UNC-3.Q.1 For a numerical variable, when random sampling with replacement from a population with mean $\mu$ and standard deviation, $\sigma$, the sampling distribution of the sample mean has mean $\mu_{\bar{x}} = \mu$ and standard deviation $\sigma_{\bar{x}} = \dfrac{\sigma}{\sqrt{n}}$.
  • UNC-3.Q.2 If sampling without replacement, the standard deviation of the sample mean is smaller than what is given by the formula above. If the sample size is less than 10% of the population size, the difference is negligible.

Learning Objective UNC-3.R: Determine whether a sampling distribution of a sample mean can be described as approximately normal. [Skill 3.C]

  • UNC-3.R.1 For a numerical variable, if the population distribution can be modeled with a normal distribution, the sampling distribution of the sample mean, $\bar{x}$, can be modeled with a normal distribution.
  • UNC-3.R.2 For a numerical variable, if the population distribution cannot be modeled with a normal distribution, the sampling distribution of the sample mean, $\bar{x}$, can be modeled approximately by a normal distribution, provided the sample size is large enough, e.g., greater than or equal to 30.

Learning Objective UNC-3.S: Interpret probabilities and parameters for a sampling distribution for a sample mean. [Skill 4.B]

  • UNC-3.S.1 Probabilities and parameters for a sampling distribution for a sample mean should be interpreted using appropriate units and within the context of a specific population.
Tiếng Việt

Hiểu biết Bền vững (UNC-3): Lập luận xác suất cho phép chúng ta dự đoán các mẫu trong dữ liệu.

Mục tiêu học tập UNC-3.Q: Xác định các tham số cho phân phối mẫu của trung bình mẫu. [Kỹ năng 3.B]

  • UNC-3.Q.1 Đối với một biến định lượng, khi lấy mẫu ngẫu nhiên có hoàn lại từ một quần thể có trung bình $\mu$ và độ lệch chuẩn $\sigma$, phân phối mẫu của trung bình mẫu có trung bình $\mu_{\bar{x}} = \mu$ và độ lệch chuẩn $\sigma_{\bar{x}} = \dfrac{\sigma}{\sqrt{n}}$.
  • UNC-3.Q.2 Nếu lấy mẫu không hoàn lại, độ lệch chuẩn của trung bình mẫu sẽ nhỏ hơn so với công thức trên. Nếu kích thước mẫu nhỏ hơn 10% kích thước quần thể, sự chênh lệch này là không đáng kể.

Mục tiêu học tập UNC-3.R: Xác định xem phân phối mẫu của trung bình mẫu có thể được mô tả xấp xỉ theo phân phối chuẩn hay không. [Kỹ năng 3.C]

  • UNC-3.R.1 Đối với một biến định lượng, nếu phân phối quần thể có thể được mô hình hóa bằng phân phối chuẩn, thì phân phối mẫu của trung bình mẫu, $\bar{x}$, cũng có thể được mô hình hóa bằng phân phối chuẩn.
  • UNC-3.R.2 Đối với một biến định lượng, nếu phân phối quần thể không thể được mô hình hóa bằng phân phối chuẩn, thì phân phối mẫu của trung bình mẫu, $\bar{x}$, có thể được mô hình hóa xấp xỉ bởi phân phối chuẩn, miễn là kích thước mẫu đủ lớn, ví dụ: lớn hơn hoặc bằng 30.

Mục tiêu học tập UNC-3.S: Giải thích xác suất và tham số cho phân phối mẫu của trung bình mẫu. [Kỹ năng 4.B]

  • UNC-3.S.1 Xác suất và tham số cho phân phối mẫu của trung bình mẫu nên được giải thích sử dụng đơn vị phù hợp và trong ngữ cảnh của một quần thể cụ thể.

Source: College Board AP Course and Exam Description · ⁨Nguồn: Mô tả Khóa học và Bài thi College Board AP⁩

English

For a sample mean $\bar{x}$ from an SRS: the mean is $\mu$ (unbiased), and the standard deviation is

$$\sigma_{\bar x}=\frac{\sigma}{\sqrt{n}}.$$
Its shape is normal if the population is normal, or approximately normal for large $n$ by the CLT. Note the spread shrinks like $\sqrt{n}$ – quadrupling the sample halves the standard error.

Worked example. A population has $\mu=70$ and $\sigma=12$. For samples of $n=36$, the sampling distribution of $\bar{x}$ is centered at $70$ with standard error $\dfrac{12}{\sqrt{36}}=2$. The chance a sample mean exceeds $73$ is $z=\dfrac{73-70}{2}=1.5$, so $P(\bar x>73)\approx0.067$.

Tiếng Việt

Đối với trung bình mẫu $\bar{x}$ từ một mẫu ngẫu nhiên đơn (SRS): kỳ vọng là $\mu$ (không thiên lệch), và độ tiêu chuẩn là

$$\sigma_{\bar x}=\frac{\sigma}{\sqrt{n}}.$$
Phân bố của nó là chuẩn nếu tổng thể phân phối chuẩn, hoặc xấp xỉ chuẩn đối với mẫu lớn $n$ theo Định lý Giới hạn Trung tâm. Lưu ý độ phân tán co lại theo tỷ lệ $\sqrt{n}$ – nhân bốn kích thước mẫu thì sai số chuẩn giảm đi một nửa.

Ví dụ minh họa. Một tổng thể có $\mu=70$ và $\sigma=12$. Đối với các mẫu có $n=36$, phân phối lấy mẫu của $\bar{x}$ được đặt tại $70$ với sai số chuẩn là $\dfrac{12}{\sqrt{36}}=2$. Xác suất để trung bình mẫu vượt quá $73$ là $z=\dfrac{73-70}{2}=1.5$, vì vậy $P(\bar x>73)\approx0.067$.

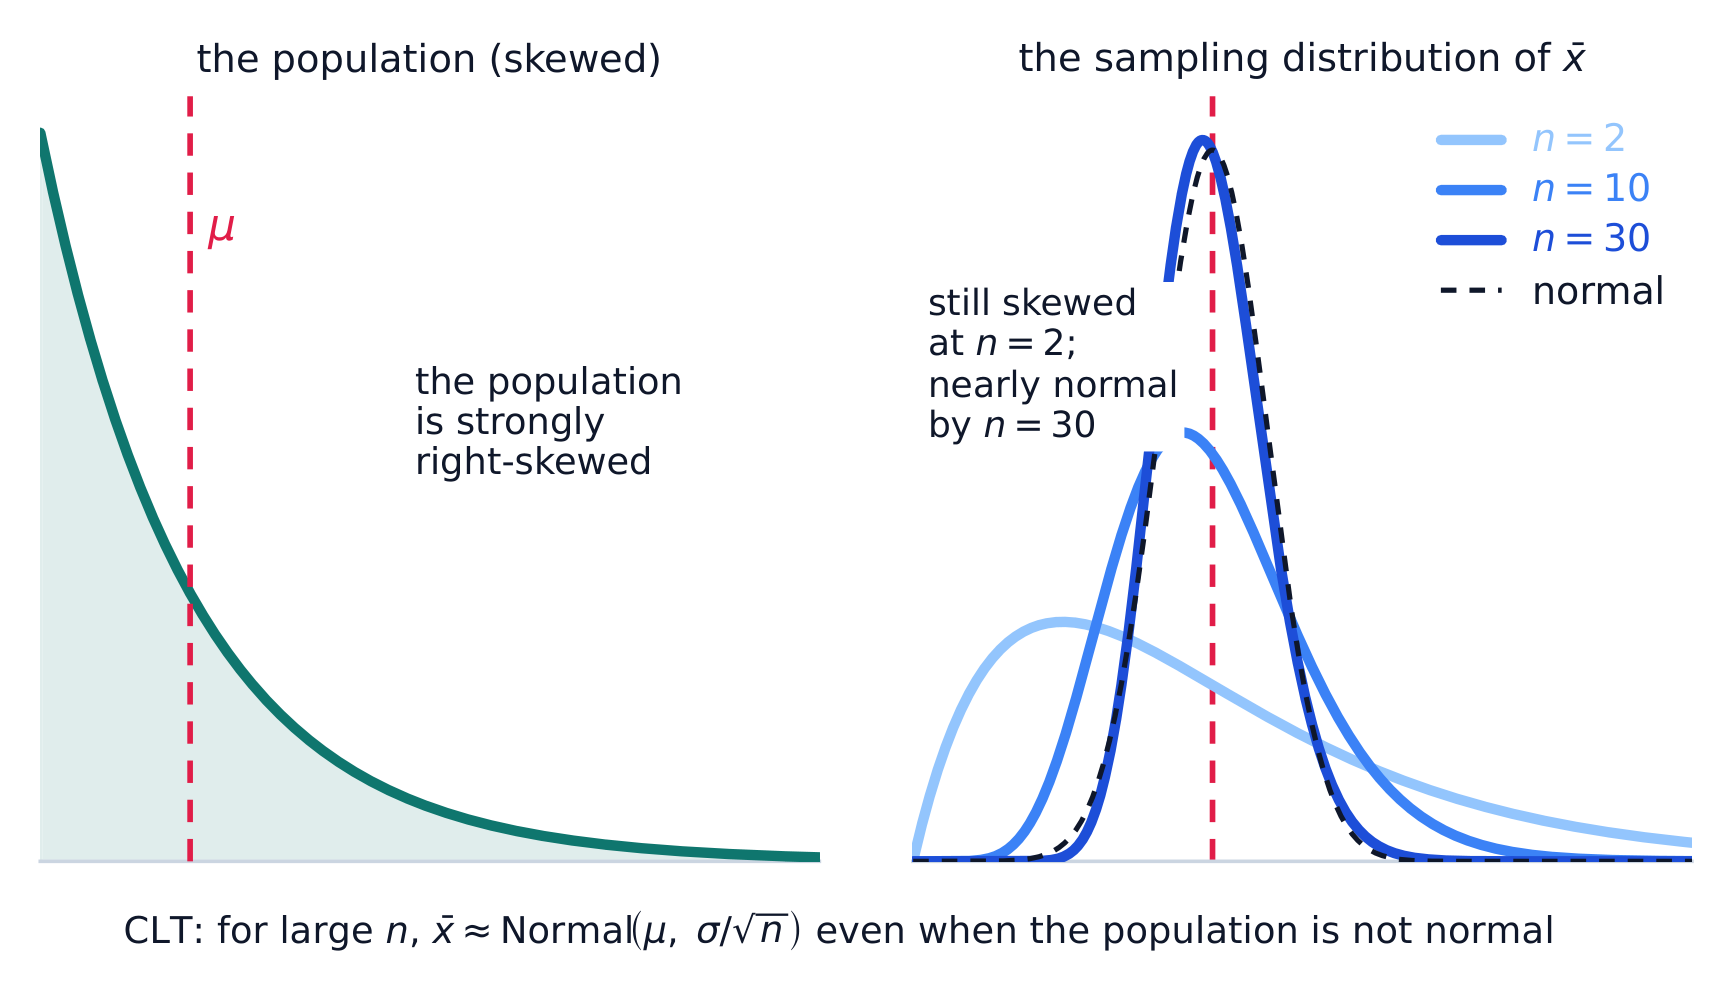
Phân phối lấy mẫu của trung bình thu hẹp lại và trở nên chuẩn hơn khi n tăng
Tổng thể ở bên trái bị lệch mạnh, nhưng mọi phân phối lấy mẫu của $\bar{x}$ đều được đặt tại $\mu$. Một sample size $n$ lớn hơn làm co lại sai số chuẩn $\sigma/\sqrt{n}$, vì vậy đường cong trở nên cao hơn và hẹp hơn – và nó cũng thẳng hơn: vẫn rõ ràng bị lệch ở $n=2$, gần như hoàn toàn chuẩn (nét đứt) đến $n=30$.
5.8

Comparing Two Groups: Difference of Sample Means · ⁨So sánh hai nhóm: Sự chênh lệch trung bình mẫu⁩

Syllabus · ⁨Chương trình⁩
English

Enduring Understanding (UNC-3): Probabilistic reasoning allows us to anticipate patterns in data.

Learning Objective UNC-3.T: Determine parameters of a sampling distribution for a difference in sample means. [Skill 3.B]

  • UNC-3.T.1 For a numerical variable, when randomly sampling with replacement from two independent populations with population means $\mu_1$ and $\mu_2$ and population standard deviations $\sigma_1$ and $\sigma_2$, the sampling distribution of the difference in sample means $\bar{x}_1 - \bar{x}_2$ has mean $\mu_{(\bar{x}_1 - \bar{x}_2)} = \mu_1 - \mu_2$ and standard deviation, $\sigma_{(\bar{x}_1 - \bar{x}_2)} = \sqrt{\dfrac{\sigma_1^2}{n_1} + \dfrac{\sigma_2^2}{n_2}}$.
  • UNC-3.T.2 If sampling without replacement, the standard deviation of the difference in sample means is smaller than what is given by the formula above. If the sample sizes are less than 10% of the population sizes, the difference is negligible.

Learning Objective UNC-3.U: Determine whether a sampling distribution of a difference in sample means can be described as approximately normal. [Skill 3.C]

  • UNC-3.U.1 The sampling distribution of the difference in sample means $\bar{x}_1 - \bar{x}_2$ can be modeled with a normal distribution if the two population distributions can be modeled with a normal distribution.
  • UNC-3.U.2 The sampling distribution of the difference in sample means $\bar{x}_1 - \bar{x}_2$ can be modeled approximately by a normal distribution if the two population distributions cannot be modeled with a normal distribution but both sample sizes are greater than or equal to 30.

Learning Objective UNC-3.V: Interpret probabilities and parameters for a sampling distribution for a difference in sample means. [Skill 4.B]

  • UNC-3.V.1 Probabilities and parameters for a sampling distribution for a difference of sample means should be interpreted using appropriate units and within the context of a specific populations.
Tiếng Việt

Hiểu biết Bền vững (UNC-3): Lập luận xác suất cho phép chúng ta dự đoán các mẫu trong dữ liệu.

Mục tiêu học tập UNC-3.T: Xác định các tham số của phân phối mẫu cho hiệu số trung bình mẫu. [Kỹ năng 3.B]

  • UNC-3.T.1 Đối với một biến định lượng, khi lấy mẫu ngẫu nhiên có hoàn lại từ hai quần thể độc lập có trung bình quần thể $\mu_1$ và $\mu_2$ cùng độ lệch chuẩn quần thể $\sigma_1$ và $\sigma_2$, phân phối mẫu của hiệu số trung bình mẫu $\bar{x}_1 - \bar{x}_2$ có trung bình $\mu_{(\bar{x}_1 - \bar{x}_2)} = \mu_1 - \mu_2$ và độ lệch chuẩn $\sigma_{(\bar{x}_1 - \bar{x}_2)} = \sqrt{\dfrac{\sigma_1^2}{n_1} + \dfrac{\sigma_2^2}{n_2}}$.
  • UNC-3.T.2 Nếu lấy mẫu không hoàn lại, độ lệch chuẩn của hiệu số trung bình mẫu sẽ nhỏ hơn so với công thức trên. Nếu kích thước mẫu nhỏ hơn 10% kích thước quần thể, sự chênh lệch này là không đáng kể.

Mục tiêu học tập UNC-3.U: Xác định xem phân phối mẫu của hiệu số trung bình mẫu có thể được mô tả xấp xỉ theo phân phối chuẩn hay không. [Kỹ năng 3.C]

  • UNC-3.U.1 Phân phối lấy mẫu của hiệu số trung bình mẫu $\bar{x}_1 - \bar{x}_2$ có thể được mô hình hóa bằng phân phối chuẩn nếu hai phân phối tổng thể đều có thể được mô hình hóa bằng phân phối chuẩn.
  • UNC-3.U.2 Phân phối lấy mẫu của hiệu số trung bình mẫu $\bar{x}_1 - \bar{x}_2$ có thể được xấp xỉ bởi một phân phối chuẩn nếu hai phân phối tổng thể không thể được mô hình hóa bằng phân phối chuẩn nhưng cả hai kích thước mẫu đều lớn hơn hoặc bằng 30.

Mục tiêu học tập UNC-3.V: Giải thích xác suất và tham số cho phân phối lấy mẫu của hiệu số trung bình mẫu. [Kỹ năng 4.B]

  • UNC-3.V.1 Xác suất và tham số cho phân phối lấy mẫu của hiệu số trung bình mẫu cần được giải thích sử dụng đơn vị phù hợp và trong ngữ cảnh của các tổng thể cụ thể.

Source: College Board AP Course and Exam Description · ⁨Nguồn: Mô tả Khóa học và Bài thi College Board AP⁩

English

For $\bar{x}_1-\bar{x}_2$ from two independent samples: the mean is $\mu_1-\mu_2$, and (independent, so variances add)

$$\sigma_{\bar x_1-\bar x_2}=\sqrt{\frac{\sigma_1^2}{n_1}+\frac{\sigma_2^2}{n_2}}.$$
This is the foundation for two-sample inference in the next units.

Tiếng Việt

Đối với $\bar{x}_1-\bar{x}_2$ từ hai mẫu độc lập: kỳ vọng là $\mu_1-\mu_2$, và (độc lập, nên biến cộng lại)

$$\sigma_{\bar x_1-\bar x_2}=\sqrt{\frac{\sigma_1^2}{n_1}+\frac{\sigma_2^2}{n_2}}.$$
Đây là nền tảng cho suy luận hai mẫu trong các đơn vị tiếp theo.

5.8

Exam tips · ⁨Mẹo làm bài thi⁩

English
  • A sampling distribution is the distribution of a statistic over many samples, centered on the true parameter.
  • The Central Limit Theorem: for a large enough sample the sample mean is approximately normal, even if the population is not.
  • Larger samples give less variability (a smaller standard error).
  • Check the conditions (random, independent/10%, large enough) before using a normal model.
  • Keep straight what varies — the statistic — versus the fixed parameter.
Tiếng Việt
  • Một phân phối lấy mẫu là sự phân phối của một thống kê qua nhiều mẫu, được đặt tại tham số thực tế.
  • Định lý Giới hạn Trung tâm: đối với một mẫu đủ lớn, trung bình mẫu sẽ xấp xỉ phân phối chuẩn, ngay cả khi tổng thể không phải là phân phối chuẩn.
  • Mẫu lớn hơn tạo ra ít biến thiên hơn (một sai số chuẩn nhỏ hơn).
  • Kiểm tra các điều kiện (ngẫu nhiên, độc lập/10%, đủ lớn) trước khi sử dụng mô hình chuẩn.
  • Phân biệt rõ những gì thay đổi — thống kê — so với tham số cố định.

Interactive lessons on this topic · ⁨Bài học tương tác về chủ đề này⁩

Work through it step by step, with instant-check exercises. · ⁨Làm theo từng bước, kèm theo bài tập kiểm tra ngay lập tức.⁩

Past Papers · ⁨Đề thi cũ⁩

More topics in AP Statistics · ⁨AP Thống kê⁩ · ⁨Nhiều chủ đề hơn trong AP Statistics · ⁨AP Thống kê⁩⁩

Log in or create account · ⁨Đăng nhập hoặc tạo tài khoản⁩

IGCSE, A-Level & AP