Source: College Board AP Course and Exam Description · แหล่งที่มา: คำอธิบายหลักสูตรและข้อสอบ College Board AP
English
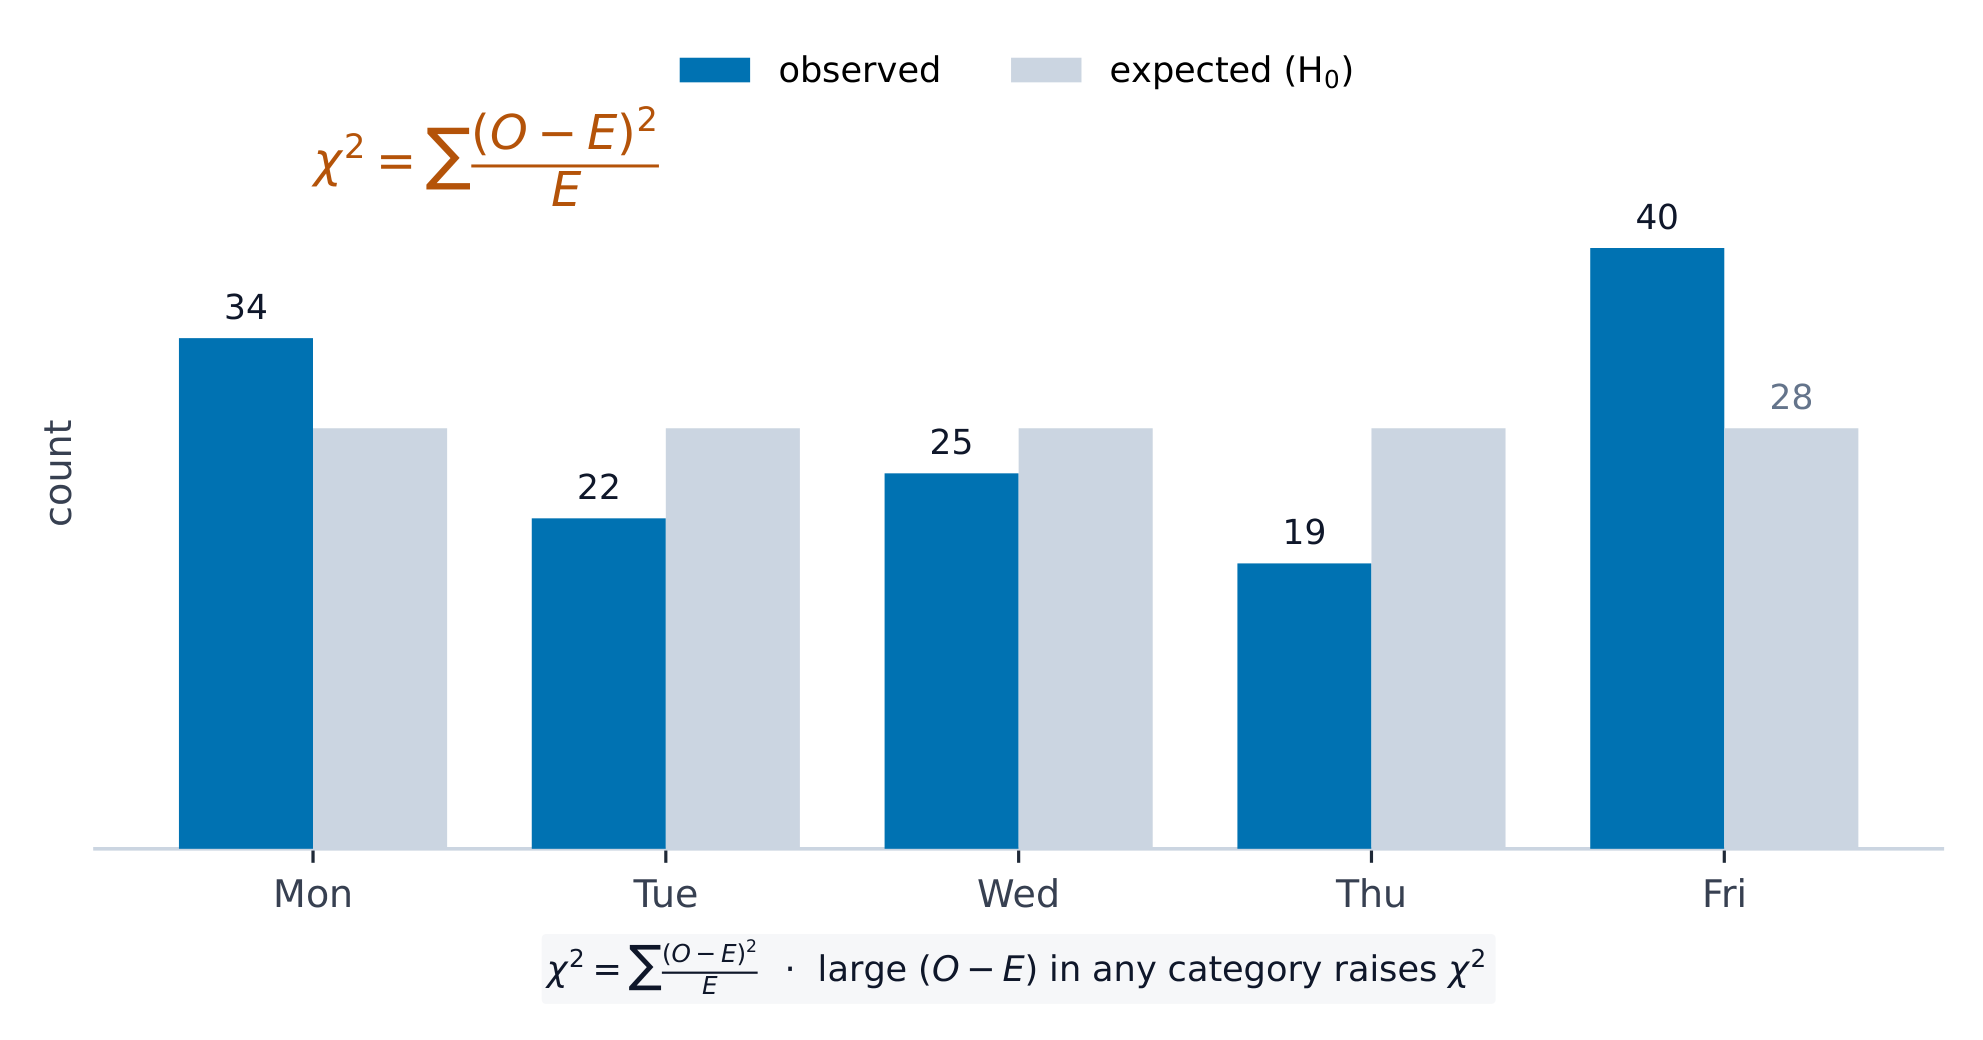
When data are counts spread across several categories, we test whether the observed counts differ from what a claim predicts. The tool is the chi-square 卡方 ($\chi^2$) statistic, which adds up the standardized gaps between observed and expected counts:
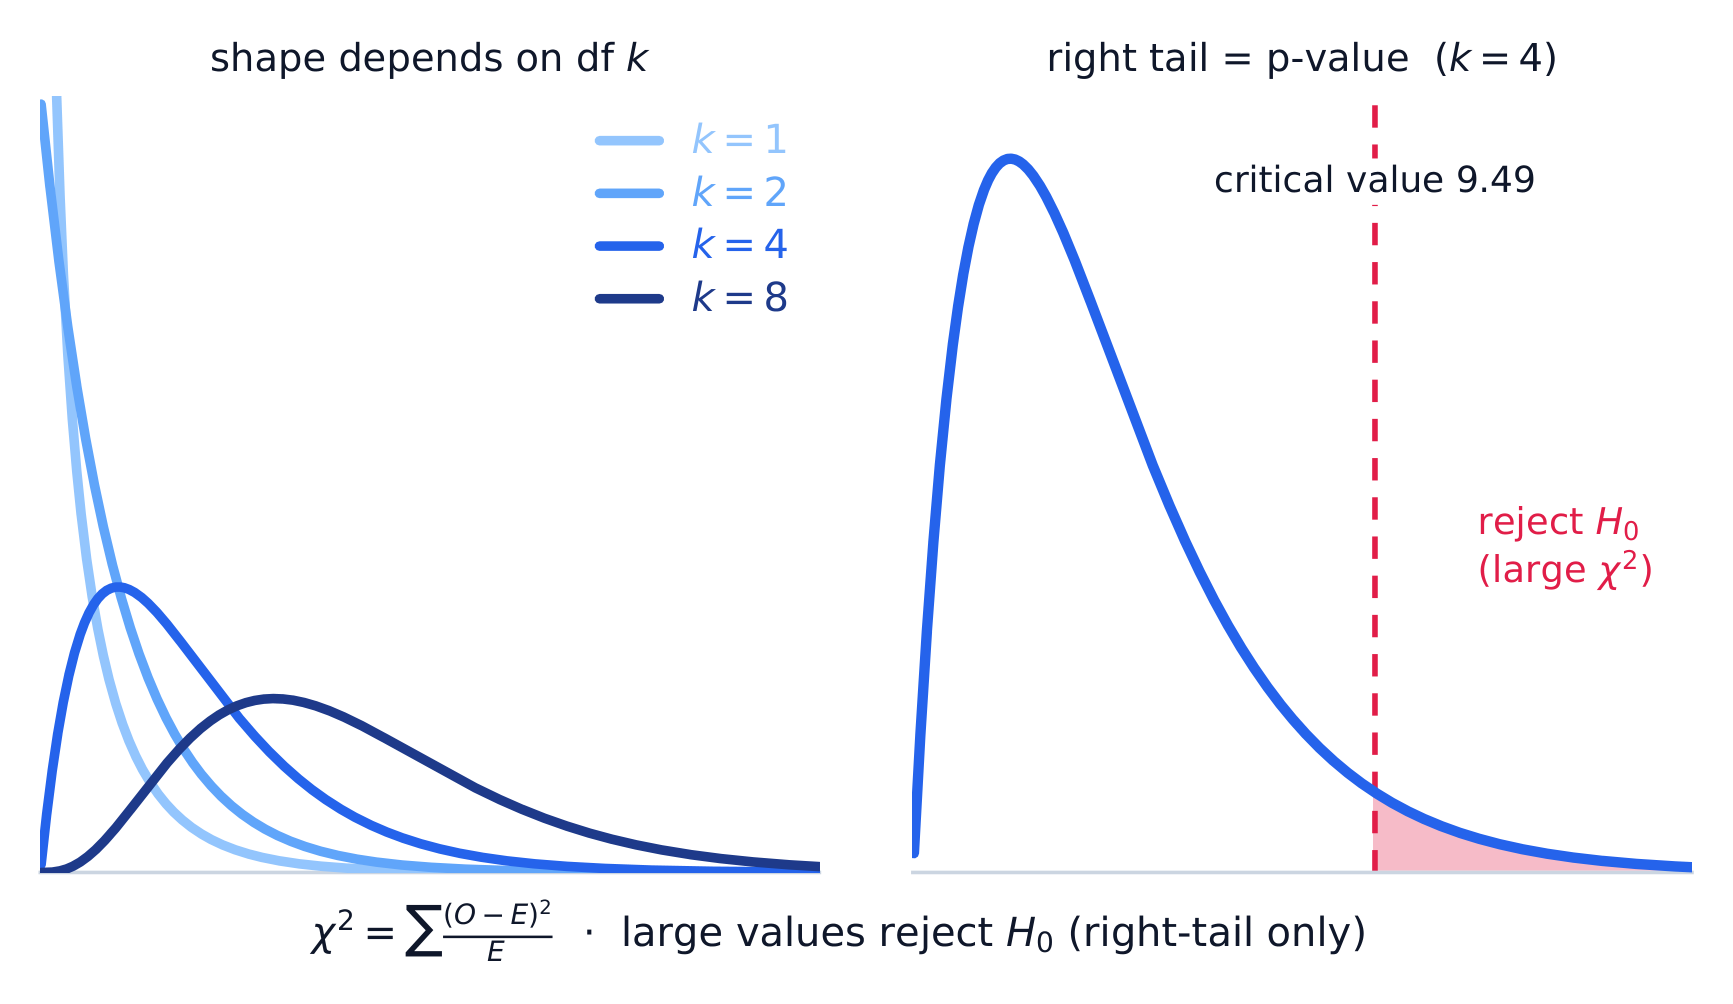
A large $\chi^2$ means the observed counts are far from expected – evidence against the claim. The chi-square distribution is right-skewed and depends on its degrees of freedom 自由度.
VAR-8.A.1 Expected counts of categorical data are counts consistent with the null hypothesis. In general, an expected count is a sample size times a probability.
The chi-square statistic measures the distance between observed and expected counts relative to expected counts.
Chi-square distributions have positive values and are skewed right. Within a family of density curves, the skew becomes less pronounced with increasing degrees of freedom.
Learning Objective VAR-8.B: Identify the null and alternative hypotheses in a test for a distribution of proportions in a set of categorical data. [Skill 1.F]
VAR-8.B.1 For a chi-square goodness-of-fit test, the null hypothesis specifies null proportions for each category, and the alternative hypothesis is that at least one of these proportions is not as specified in the null hypothesis.
Learning Objective VAR-8.C: Identify an appropriate testing method for a distribution of proportions in a set of categorical data. [Skill 1.E]
VAR-8.C.1 When considering a distribution of proportions for one categorical variable, the appropriate test is the chi-square test for goodness of fit.
Learning Objective VAR-8.D: Calculate expected counts for the chi-square test for goodness of fit. [Skill 3.A]
VAR-8.D.1 Expected counts for a chi-square goodness-of-fit test are (sample size)(null proportion).
Learning Objective VAR-8.E: Verify the conditions for making statistical inferences when testing goodness of fit for a chi-square distribution. [Skill 4.C]
VAR-8.E.1 In order to make statistical inferences for a chi-square test for goodness of fit we must check the following:
a. To check for independence:
i. Data should be collected using a random sample or randomized experiment.
ii. When sampling without replacement, check that $n \leq 10\%N$.
b. The chi-square test for goodness of fit becomes more accurate with more observations, so large counts should be used (shape).
i. A conservative check for large counts is that all expected counts should be greater than 5.
VAR-8.F.2 The distribution of the test statistic assuming the null hypothesis is true (null distribution) can be either a randomization distribution or, when a probability model is assumed to be true, a theoretical distribution (chi-square).
Learning Objective VAR-8.G: Determine the $p$-value for chi-square test for goodness of fit significance test. [Skill 3.E]
VAR-8.G.1 The $p$-value for a chi-square test for goodness of fit for a number of degrees of freedom is found using the appropriate table or computer generated output.
Enduring Understanding (DAT-3): Significance testing allows us to make decisions about hypotheses within a particular context.
Learning Objective DAT-3.I: Interpret the $p$-value for the chi-square test for goodness of fit. [Skill 4.B]
DAT-3.I.1 An interpretation of the $p$-value for the chi-square test for goodness of fit is the probability, given the null hypothesis and probability model are true, of obtaining a test statistic as, or more, extreme than the observed value.
Learning Objective DAT-3.J: Justify a claim about the population based on the results of a chi-square test for goodness of fit. [Skill 4.E]
DAT-3.J.1 A decision to either reject or fail to reject the null hypothesis is based on comparison of the $p$-value to the significance level, $\alpha$.
DAT-3.J.2 The results of a chi-square test for goodness of fit can serve as the statistical reasoning to support the answer to a research question about the population that was sampled.
Source: College Board AP Course and Exam Description · แหล่งที่มา: คำอธิบายหลักสูตรและข้อสอบ College Board AP
English
Compute $\chi^2=\sum\dfrac{(O-E)^2}{E}$ with $df=(\text{number of categories})-1$. Find the $p$-value from the chi-square distribution (upper tail), compare to $\alpha$, and conclude in context. A large component of the sum points to the category that deviates most.
Worked example. A die rolled $60$ times gives counts $8,10,12,9,11,10$. If it is fair, each expected count is $60/6=10$, so
with $df=6-1=5$. Write out every category, including the two that match their expected count exactly and so add $0$ – the sum runs over all six categories, and $df$ counts categories, not just the ones that differ. This $\chi^2$ is small (a large $p$-value), so we fail to reject$H_0$ – no evidence the die is unfair.
ไทย
คำนวณ $\chi^2=\sum\dfrac{(O-E)^2}{E}$ ด้วย $df=(\text{number of categories})-1$. หาค่า $p$-value จาก chi-square distribution (หางบน), เปรียบเทียบกับ $\alpha$, และสรุปผลในบริบท ส่วนประกอบที่มีค่าสูงของผลรวมชี้ไปที่หมวดหมู่ที่เบี่ยงเบนมากที่สุด
Explore the chi-square distribution and its p-value · สำรวจการแจกแจง chi-square และ p-value ของมัน
The p-value is the area in the right tail beyond your test statistic, so a larger$\chi^2$ means a smaller p-value. Drag $\chi^2$ to watch that area shrink, and drag df to see the whole family change shape — strongly right-skewed at small df, more symmetric as df grows. · p-value คือพื้นที่ใน หางขวา ที่เกินค่าสถิติทดสอบของคุณ ดังนั้น ค่า$\chi^2$ ที่ มากขึ้น จะทำให้ p-value น้อยลง ลาก $\chi^2$ เพื่อดูพื้นที่นั้นหดตัวลง และลาก df เพื่อดูการเปลี่ยนแปลงรูปร่างของทั้งครอบครัว — บิดเบี้ยวไปทางขวาอย่างชัดเจนเมื่อ df มีค่าน้อย และมีความสมมาตรมากขึ้นเมื่อ df เพิ่มขึ้น
8.4
Expected Counts in Two-Way Tables · จำนวนนับที่คาดหวังในตารางสองมิติ
Syllabus · หลักสูตร
English
Enduring Understanding (VAR-8): The chi-square distribution may be used to model variation.
Learning Objective VAR-8.H: Calculate expected counts for two-way tables of categorical data. [Skill 3.A]
VAR-8.H.1 The expected count in a particular cell of a two-way table of categorical data can be calculated using the formula:
This is the count you would see if the row and column variables were unrelated.
Worked example. In a two-way table a cell's row total is $40$, its column total is $50$, and the grand total is $200$. Its expected count is $E=\dfrac{40\times50}{200}=10$. Repeating for every cell gives the expected table to compare against the observed one.
Homogeneity or Independence? · Homogeneity หรือ Independence?
Syllabus · หลักสูตร
English
Enduring Understanding (VAR-8): The chi-square distribution may be used to model variation.
Learning Objective VAR-8.I: Identify the null and alternative hypotheses for a chi-square test for homogeneity or independence. [Skill 1.F]
VAR-8.I.1 The appropriate hypotheses for a chi-square test for homogeneity are:
$H_0$: There is no difference in distributions of a categorical variable across populations or treatments.
$H_a$: There is a difference in distributions of a categorical variable across populations or treatments.
VAR-8.I.2 The appropriate hypotheses for a chi-square test for independence are:
$H_0$: There is no association between two categorical variables in a given population or the two categorical variables are independent.
$H_a$: Two categorical variables in a population are associated or dependent.
Learning Objective VAR-8.J: Identify an appropriate testing method for comparing distributions in two-way tables of categorical data. [Skill 1.E]
VAR-8.J.1 When comparing distributions to determine whether proportions in each category for categorical data collected from different populations are the same, the appropriate test is the chi-square test for homogeneity.
VAR-8.J.2 To determine whether row and column variables in a two-way table of categorical data might be associated in the population from which the data were sampled, the appropriate test is the chi-square test for independence.
Learning Objective VAR-8.K: Verify the conditions for making statistical inferences when testing a chi-square distribution for independence or homogeneity. [Skill 4.C]
VAR-8.K.1 In order to make statistical inferences for a chi-square test for two-way tables (homogeneity or independence), we must verify the following:
a. To check for independence:
i. For a test for independence: Data should be collected using a simple random sample.
ii. For a test for homogeneity: Data should be collected using a stratified random sample or randomized experiment.
iii. When sampling without replacement, check that $n \leq 10\%N$.
b. The chi-square tests for independence and homogeneity become more accurate with more observations, so large counts should be used (shape).
i. A conservative check for large counts is that all expected counts should be greater than 5.
i. สำหรับการทดสอบความเป็นอิสระ: ข้อมูลควรเก็บด้วยวิธีสุ่มตัวอย่างแบบง่าย
ii. สำหรับการทดสอบความสม่ำเสมอ: ข้อมูลควรเก็บด้วยวิธีสุ่มตัวอย่างแบบแบ่งชั้นหรือการทดลองแบบสุ่ม
iii. เมื่อสุ่มโดยไม่แทนที่ ให้ตรวจสอบว่า $n \leq 10\%N$
b. การทดสอบ chi-square เพื่อความเป็นอิสระและความสม่ำเสมอจะแม่นยำขึ้นเมื่อมีจำนวนการสังเกตมากขึ้น ดังนั้นควรใช้ค่านับที่สูง (รูปร่าง)
i. การตรวจสอบแบบระมัดระวังสำหรับจำนวนที่มากคือจำนวนที่คาดหวังทั้งหมดควรมากกว่า 5
Source: College Board AP Course and Exam Description · แหล่งที่มา: คำอธิบายหลักสูตรและข้อสอบ College Board AP
English
Two tests use the same $\chi^2$ math but answer different questions:
Test for homogeneity 同质性: are the distributions of one categorical variable the same across several populations or groups (separate samples/treatments)?
Test for independence 独立性: are two categorical variables associated within a single population (one sample, two variables measured)?
The design (several samples vs one sample) decides which name and hypotheses to use.
Carrying Out a Test for Homogeneity or Independence · การดำเนินการทดสอบ Homogeneity หรือ Independence
Syllabus · หลักสูตร
English
Enduring Understanding (VAR-8): The chi-square distribution may be used to model variation.
Learning Objective VAR-8.L: Calculate the appropriate statistic for a chi-square test for homogeneity or independence. [Skill 3.E]
VAR-8.L.1 The appropriate test statistic for a chi-square test for homogeneity or independence is the chi-square statistic:
Equation:$\chi^2 = \sum \dfrac{(Observed\ count - Expected\ count)^2}{Expected\ count}$, with degrees of freedom equal to: $(number\ of\ rows - 1)(number\ of\ columns - 1)$.
Learning Objective VAR-8.M: Determine the $p$-value for a chi-square significance test for independence or homogeneity. [Skill 3.E]
VAR-8.M.1 The $p$-value for a chi-square test for independence or homogeneity for a number of degrees of freedom is found using the appropriate table or technology.
VAR-8.M.2 For a test of independence or homogeneity for a two-way table, the $p$-value is the proportion of values in a chi-square distribution with appropriate degrees of freedom that are equal to or larger than the test statistic.
Enduring Understanding (DAT-3): Significance testing allows us to make decisions about hypotheses within a particular context.
Learning Objective DAT-3.K: Interpret the $p$-value for the chi-square test for homogeneity or independence. [Skill 4.B]
DAT-3.K.1 An interpretation of the $p$-value for the chi-square test for homogeneity or independence is the probability, given the null hypothesis and probability model are true, of obtaining a test statistic as, or more, extreme than the observed value.
Learning Objective DAT-3.L: Justify a claim about the population based on the results of a chi-square test for homogeneity or independence. [Skill 4.E]
DAT-3.L.1 A decision to either reject or fail to reject the null hypothesis for a chi-square test for homogeneity or independence is based on comparison of the $p$-value to the significance level, $\alpha$.
DAT-3.L.2 The results of a chi-square test for homogeneity or independence can serve as the statistical reasoning to support the answer to a research question about the population that was sampled (independence) or the populations that were sampled (homogeneity).
Source: College Board AP Course and Exam Description · แหล่งที่มา: คำอธิบายหลักสูตรและข้อสอบ College Board AP
English
Compute expected counts, then $\chi^2=\sum\dfrac{(O-E)^2}{E}$ over all cells, with
$$df=(\text{rows}-1)(\text{columns}-1).$$
Conditions: random data, all expected counts $\ge 5$, 10% condition. Find the $p$-value, compare to $\alpha$, and conclude in context – evidence of a difference between groups (homogeneity) or of an association (independence).
Choosing the Right Categorical Procedure · การเลือกวิธีการเชิงประจักษ์ที่เหมาะสม
Syllabus · หลักสูตร
English
This topic is intended to focus on the skill of selecting an appropriate inference procedure now that students have a range of options. Students should be given opportunities to practice when and how to apply all learning objectives relating to inference for categorical data.
Source: College Board AP Course and Exam Description · แหล่งที่มา: คำอธิบายหลักสูตรและข้อสอบ College Board AP
English
Decide by the setup: one categorical variable against a claimed distribution $\Rightarrow$goodness-of-fit; one sample cross-classified by two variables $\Rightarrow$independence; several samples/groups compared $\Rightarrow$homogeneity. Comparing just two proportions can use either a two-proportion $z$-test or a chi-square test, but only for a two-tailed alternative, where they agree exactly ($\chi^2=z^2$). A chi-square test is always two-tailed, so it cannot give a directional conclusion: if $H_a$ is one-tailed (say $p_1>p_2$), use the $z$-test.
Which chi-square test is this? · นี่คือการทดสอบ chi-square哪一种?
All three tests use the same $\chi^2$ arithmetic, so the marks are won by naming the right one. The design decides — how many samples were taken, and how many variables were measured on each unit. · การทดสอบทั้งสามใช้ $\chi^2$ Arithmetic เดียวกัน ดังนั้นคะแนนจะอยู่ที่การระบุชื่อให้ถูกต้อง การออกแบบ เป็นตัวกำหนด — มีการเก็บตัวอย่างกี่กลุ่ม และวัดตัวแปรกี่ตัวต่อหน่วย
8.7
Exam tips · ข้อแนะนำสำหรับการสอบ
English
Use $\chi^2=\sum\tfrac{(O-E)^2}{E}$ for categorical data; always divide by the expected count.
Pick the right test: goodness-of-fit (one variable), independence, or homogeneity (two-way table).
Compute expected counts as $\tfrac{\text{row total}\times\text{column total}}{\text{grand total}}$ and check each is $\ge5$.
A large $\chi^2$ (small p-value) means observed counts differ from expected by more than chance.
State degrees of freedom correctly (categories $-1$, or $(r-1)(c-1)$).
Pick one and the site follows you — notes, papers, videos and practice all open on it. · เลือกหนึ่งตัว และเว็บจะติดตามคุณ — หมายเหตุ, ใบงาน, วิดีโอ และการฝึกฝนจะเปิดอยู่ที่นั้น
Type to search notes, lessons, code, vocabulary and past-paper questions across every subject. · พิมพ์เพื่อค้นหาบันทึก, บทเรียน, โค้ด, คำศัพท์ และคำถามข้อสอบเก่าในทุกวิชา