Skip to content · ⁨ข้ามไปยังเนื้อหา⁩

Supply and Demand · ⁨อุปสงค์และอุปทาน⁩

AP Microeconomics · ⁨AP เศรษฐศาสตร์จุลภาค⁩ · Topic 2 · ⁨หัวข้อ 2⁩

Video lesson for this topic · ⁨บทเรียนวิดีโอสำหรับหัวข้อนี้⁩ Open the video page · ⁨เปิดหน้าวิดีโอ⁩
10:39

อุปสงค์และอุปทาน

ทำไมกาแฟหนึ่งแก้วถึงมีราคาเท่าที่เห็น? ไม่มีใครตัดสินใจมัน ไม่มีคณะกรรมการหรือรายการราคาอย่างเป็นทางการ มีแต่ผู้ซื้อ ซึ่งต้องการมากขึ้นเมื่อราคา…

English narration · English + 中文 subtitles burned in · ⁨การบรรยายภาษาอังกฤษ · คำบรรยายภาษาอังกฤษ + 中文 ลอยตัวบนภาพ⁩

2.1

Demand · ⁨ความต้องการ⁩

Syllabus · ⁨หลักสูตร⁩
English

Enduring Understanding (MKT-3): Individuals and firms respond to incentives and face constraints.

Learning Objective MKT-3.A: a. Define (using graphs as appropriate) key terms and factors related to consumer decision making and the law of demand. b. Explain (using graphs as appropriate) the relationship between price and quantity demanded and how buyers respond to incentives and constraints.

  • MKT-3.A.1 A well-defined system of property rights is necessary for the market system to function well.
  • MKT-3.A.2 Economic agents respond to incentives.
  • MKT-3.A.3 Individuals often respond to incentives, such as those presented by prices, but also face constraints, such as income, time, and legal and regulatory frameworks.
  • MKT-3.A.4 The law of demand suggests that a change in the own-price causes a change in quantity demanded in the opposite direction and a movement along a demand (marginal benefit) curve.
  • MKT-3.A.5 The conceptual relationship between price and quantity stated by the law of demand leads to downward-sloping demand curves explained by the income effect and substitution effect and/or by diminishing marginal utility.
  • MKT-3.A.6 The market demand curve (schedule) is derived from the summation of individual demand curves (schedules).

Learning Objective MKT-3.B: Explain (using graphs as appropriate) buyers' responses to changes in incentives and constraints.

  • MKT-3.B.1 Changes in the determinants of consumer demand can cause the demand curve to shift.
ไทย

ความเข้าใจที่ยั่งยืน (MKT-3): บุคคลและองค์กรตอบสนองต่อแรงจูงใจและเผชิญกับข้อจำกัด

วัตถุประสงค์การเรียนรู้ MKT-3.A: ก. นิยาม (โดยใช้กราฟเมื่อเหมาะสม) คำศัพท์สำคัญและปัจจัยที่เกี่ยวข้องกับการตัดสินใจของผู้บริโภคและกฎแห่งการสงค์ ข. อธิบาย (โดยใช้กราฟเมื่อเหมาะสม) ความสัมพันธ์ระหว่างราคาและปริมาณที่ต้องการ以及如何ที่ผู้ซื้อตอบสนองต่อแรงจูงใจและข้อจำกัด

  • MKT-3.A.1 ระบบสิทธิ์ในทรัพย์สินที่ชัดเจนเป็นสิ่งที่จำเป็นต่อการทำงานที่มีประสิทธิภาพของระบบตลาด
  • MKT-3.A.2 ตัวกระทำทางเศรษฐกิจตอบสนองต่อแรงจูงใจ
  • MKT-3.A.3 บุคคลมักตอบสนองต่อแรงจูงใจ เช่น ที่เสนอโดยราคา แต่ такжеเผชิญกับข้อจำกัด เช่น รายได้ เวลา และกรอบกฎหมายและระเบียบ
  • MKT-3.A.4 กฎแห่งการสงค์ชี้ให้เห็นว่าการเปลี่ยนแปลงในราคาตัวเอง会引起การเปลี่ยนแปลงในปริมาณต้องการในทิศทางตรงกันข้ามและการเคลื่อนที่ตามเส้นโค้งการสงค์ (ผลประโยชน์ส่วนเพิ่ม)
  • MKT-3.A.5 ความสัมพันธ์เชิงแนวคิดระหว่างราคาและปริมาณตามที่กฎแห่งการสงค์ระบุ นำไปสู่เส้นโค้งการสงค์ที่ชันลง ซึ่งอธิบายได้ด้วยผลด้านรายได้ ผลการแทนที่ และ/หรือประโยชน์ส่วนเพิ่มที่ลดลง
  • MKT-3.A.6 เส้นโค้งการสงค์ของตลาด (ตาราง) มาจากการรวมเส้นโค้งการสงค์รายบุคคล (ตาราง)

วัตถุประสงค์การเรียนรู้ MKT-3.B: อธิบาย (โดยใช้กราฟเมื่อเหมาะสม) การตอบสนองของผู้ซื้อต่อการเปลี่ยนแปลงในแรงจูงใจและข้อจำกัด

  • MKT-3.B.1 การเปลี่ยนแปลงในตัวกำหนดของการสงค์ของผู้บริโภคสามารถทำให้เส้นโค้งการสงค์เลื่อนไป
Source: College Board AP Course and Exam Description · ⁨แหล่งที่มา: คำอธิบายหลักสูตรและข้อสอบ College Board AP⁩

English
Supply & demand: a shift raises P and Q

A market works only where property rights 产权 are well defined – owners can use, exclude others from, and trade their resources; without them, prices cannot coordinate exchange. Within that framework, the two forces are demand and supply.

Demand 需求 is the relationship between the price of a good and the quantity buyers are willing and able to buy. The law of demand 需求定律 says price and quantity demanded move in opposite directions, so the demand curve slopes downward. Two reasons: the substitution effect 替代效应 (when a good gets pricier, buyers switch to alternatives) and the income effect 收入效应 (a higher price shrinks real purchasing power).

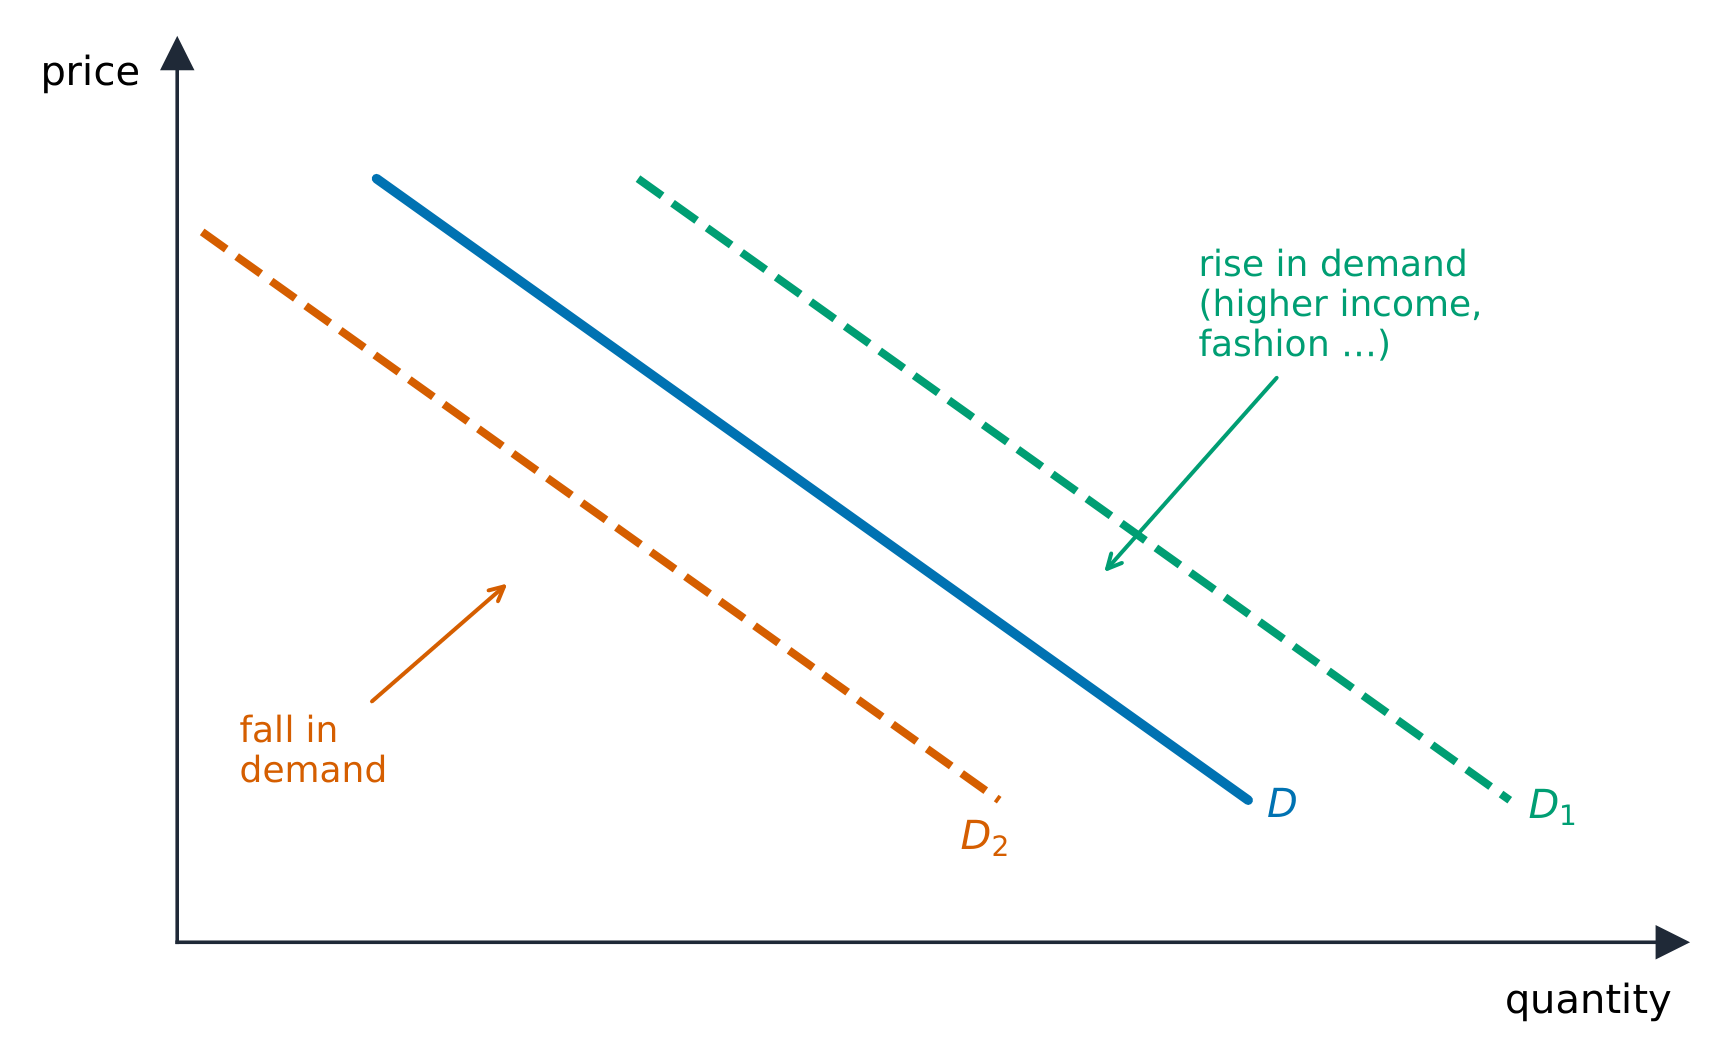
Distinguish a change in quantity demanded (a move along the curve, caused only by the good's own price) from a change in demand (a shift of the whole curve). Demand shifts with the determinants 决定因素, remembered as TRIBE:

  • Tastes/preferences,
  • Related goods – a rise in the price of a substitute 替代品 raises demand; a rise in the price of a complement 互补品 lowers it,
  • Income – for a normal good 正常商品 more income raises demand; for an inferior good 低档商品 it lowers it,
  • Buyers (number of consumers),
  • Expectations of future price or income.

The market demand curve is the horizontal summation 水平相加 of every individual buyer's demand curve – at each price, add up the quantities all buyers want. That is why more buyers (the B above) shifts the whole market curve to the right.

ไทย
ผู้ซื้อในตลาด: ความต้องการแสดงhowปริมาณที่ต้องการตอบสนองต่อราคา
อุปสงค์ & อุปทาน: การ SHIFT จะทำให้ P และ Q สูงขึ้น

ตลาดทำงานได้ก็ต่อเมื่อ สิทธิในทรัพย์สิน ถูกกำหนดไว้อย่างชัดเจน – เจ้าของสามารถใช้, ขัดขวางผู้อื่น, และแลกเปลี่ยนทรัพยากรของตน; หากไม่มีสิ่งเหล่านี้ ราคาไม่สามารถประสานการซื้อขายได้ ภายในกรอบนี้ แรงสองอย่างคือความต้องการและอุปทาน

ความต้องการ คือความสัมพันธ์ระหว่างราคาสินค้ากับปริมาณที่ผู้ซื้อยินดีและสามารถซื้อได้ กฎแห่งความต้องการ กล่าวว่าราคาและปริมาณที่ต้องการเคลื่อนที่ในทิศทาง ตรงข้าม ดังนั้น curve ความต้องการจึงเอียงลง downward. สองเหตุผล: ผลของการแทนที่ (เมื่อสินค้าแพงขึ้น ผู้ซื้อเปลี่ยนไปใช้ทางเลือกอื่น) และ ผลทางรายได้ (ราคาสูงขึ้นลดอำนาจซื้อจริง)

เส้นโค้งความต้องการชันลง; รายได้ รสนิยม และราคาสินค้าที่เกี่ยวข้องเลื่อนเส้นโค้ง

แยกแยะระหว่าง การเปลี่ยนแปลงปริมาณต้องการ (การเคลื่อนที่ ตาม curve, เกิดจาก ราคาของสินค้านั้นเอง) จาก การเปลี่ยนแปลงความต้องการ (การ เลื่อน ของทั้งcurve). ความต้องการเลื่อนด้วย ปัจจัยกำหนด, จำเป็นต้องจำว่า TRIBE:

  • Taste/ความชอบ,
  • Related goods – ราคานี้ของ substitute เพิ่มขึ้นทำให้ความต้องการเพิ่มขึ้น; ราคานี้ของ complement เพิ่มขึ้นทำให้ลดลง,
  • Income – สำหรับ normal good รายได้เพิ่มขึ้นทำให้ความต้องการเพิ่มขึ้น; สำหรับ inferior good ทำให้ลดลง,
  • Buyers (จำนวนผู้บริโภค),
  • Expectations of ราคาล่วงหน้าหรือรายได้

Market demand curve คือ การบวกแบบแนวนอน ของ curve ความต้องการของผู้ซื้อแต่ละคน – ที่ราคาใดๆ, บวกปริมาณที่ผู้ซื้อทุกคนต้องการทั้งหมด นั่นคือเหตุผลที่ผู้ซื้อมากขึ้น (B ด้านบน) เลื่อนทั้ง curve ตลาดไปทางขวา

Explore · ⁨สำรวจ⁩

Shift demand and watch price and quantity · ⁨ย้ายเส้นอุปสงค์และดูผลลัพธ์ที่ราคาและปริมาณ⁩

The demand curve slopes down: lower price, more wanted. A change in income, tastes or related-good prices shifts the whole curve, moving the equilibrium. · ⁨เส้น อุปสงค์ มีแนวโน้มลดลง: ราคาลงมา ความต้องการก็มากขึ้น การเปลี่ยนแปลงรายได้ รสนิยม หรือราคาสินค้าที่เกี่ยวข้อง จะย้ายทั้งเส้น ทำให้จุดสมดุลเปลี่ยนไป⁩

Vocabulary · ⁨คำศัพท์⁩ Train · ⁨ฝึกฝน⁩
English ไทย
property rights/ˈprɒpəti raɪts/ สิทธิในทรัพย์สิน
Demand/dɪˈmænd/ อุปสงค์
law of demand/lɔː ɒv dɪˈmænd/ กฎแห่งการต้องการ
substitution effect/ˌsʌbstɪˈtjuːʃn ɪˈfekt/ ผลของการทดแทน
income effect/ˈɪŋkʌm ɪˈfekt/ income effect
determinants/dɪˈtɜːmɪnənts/ ปัจจัยกำหนด
substitute/ˈsʌbstɪtjuːt/ แทนที่
complement/ˈkɒmplɪmənt/ คอมพลีเมนต์
normal good/ˈnɔːml ɡʊd/ สินค้าปกติ (normal good)
inferior good/ɪnˈfɪərɪə ɡʊd/ สินค้าด้อยคุณภาพ (inferior good)
horizontal summation/ˌhɒrɪˈzɒntl sʌˈmeɪʃn/ การบวกแนวนอน
Supply/səˈplaɪ/ อุปทาน
law of supply/lɔː ɒv səˈplaɪ/ กฎแห่งการเสนอขาย
subsidies/ˈsʌbsɪdiz/ เงินอุดหนุน
Price elasticity of demand/praɪs ɪlæˈstɪsɪti ɒv dɪˈmænd/ ความยืดหยุ่นของอุปสงค์ต่อราคา (Price elasticity of demand)
2.2

Supply · ⁨Offer⁩

Syllabus · ⁨หลักสูตร⁩
English

Enduring Understanding (MKT-3): Individuals and firms respond to incentives and face constraints.

Learning Objective MKT-3.C: a. Define (using graphs as appropriate) the law of supply. b. Explain (using graphs as appropriate) the relationship between price and quantity supplied.

  • MKT-3.C.1 A change in own-price causes a change in quantity supplied in the same direction and a movement along a supply curve.
  • MKT-3.C.2 The market supply curve (schedule) is derived from the summation of individual supply curves (schedules). The market supply curve is upward-sloping.

Learning Objective MKT-3.D: Explain (using graphs as appropriate) producers' (sellers') responses to changes in incentives and technology.

  • MKT-3.D.1 Changes in the determinants of supply can cause the supply curve to shift.
ไทย

ความเข้าใจที่ยั่งยืน (MKT-3): บุคคลและองค์กรตอบสนองต่อแรงจูงใจและเผชิญกับข้อจำกัด

วัตถุประสงค์การเรียนรู้ MKT-3.C: ก. นิยาม (โดยใช้กราฟเมื่อเหมาะสม) กฎของอุปทาน ข. อธิบาย (โดยใช้กราฟเมื่อเหมาะสม) ความสัมพันธ์ระหว่างราคาและปริมาณเสนอขาย

  • MKT-3.C.1 การเปลี่ยนแปลงในราคาตัวเอง会引起การเปลี่ยนแปลงในปริมาณเสนอขายในทิศทางเดียวกันและการเคลื่อนที่ตามเส้นโค้งการเสนอขาย
  • MKT-3.C.2 เส้นโค้งการเสนอขายของตลาด (ตาราง) มาจากการรวมเส้นโค้งการเสนอขายรายบุคคล (ตาราง) เส้นโค้งการเสนอขายของตลาดมีความชันขึ้น

วัตถุประสงค์การเรียนรู้ MKT-3.D: อธิบาย (โดยใช้กราฟเมื่อเหมาะสม) การตอบสนองของผู้ผลิต (ผู้ขาย) ต่อการเปลี่ยนแปลงในแรงจูงใจและเทคโนโลยี

  • MKT-3.D.1 การเปลี่ยนแปลงในตัวกำหนดของการเสนอขายสามารถทำให้เส้นโค้งการเสนอขายเลื่อนไป

Source: College Board AP Course and Exam Description · ⁨แหล่งที่มา: คำอธิบายหลักสูตรและข้อสอบ College Board AP⁩

English
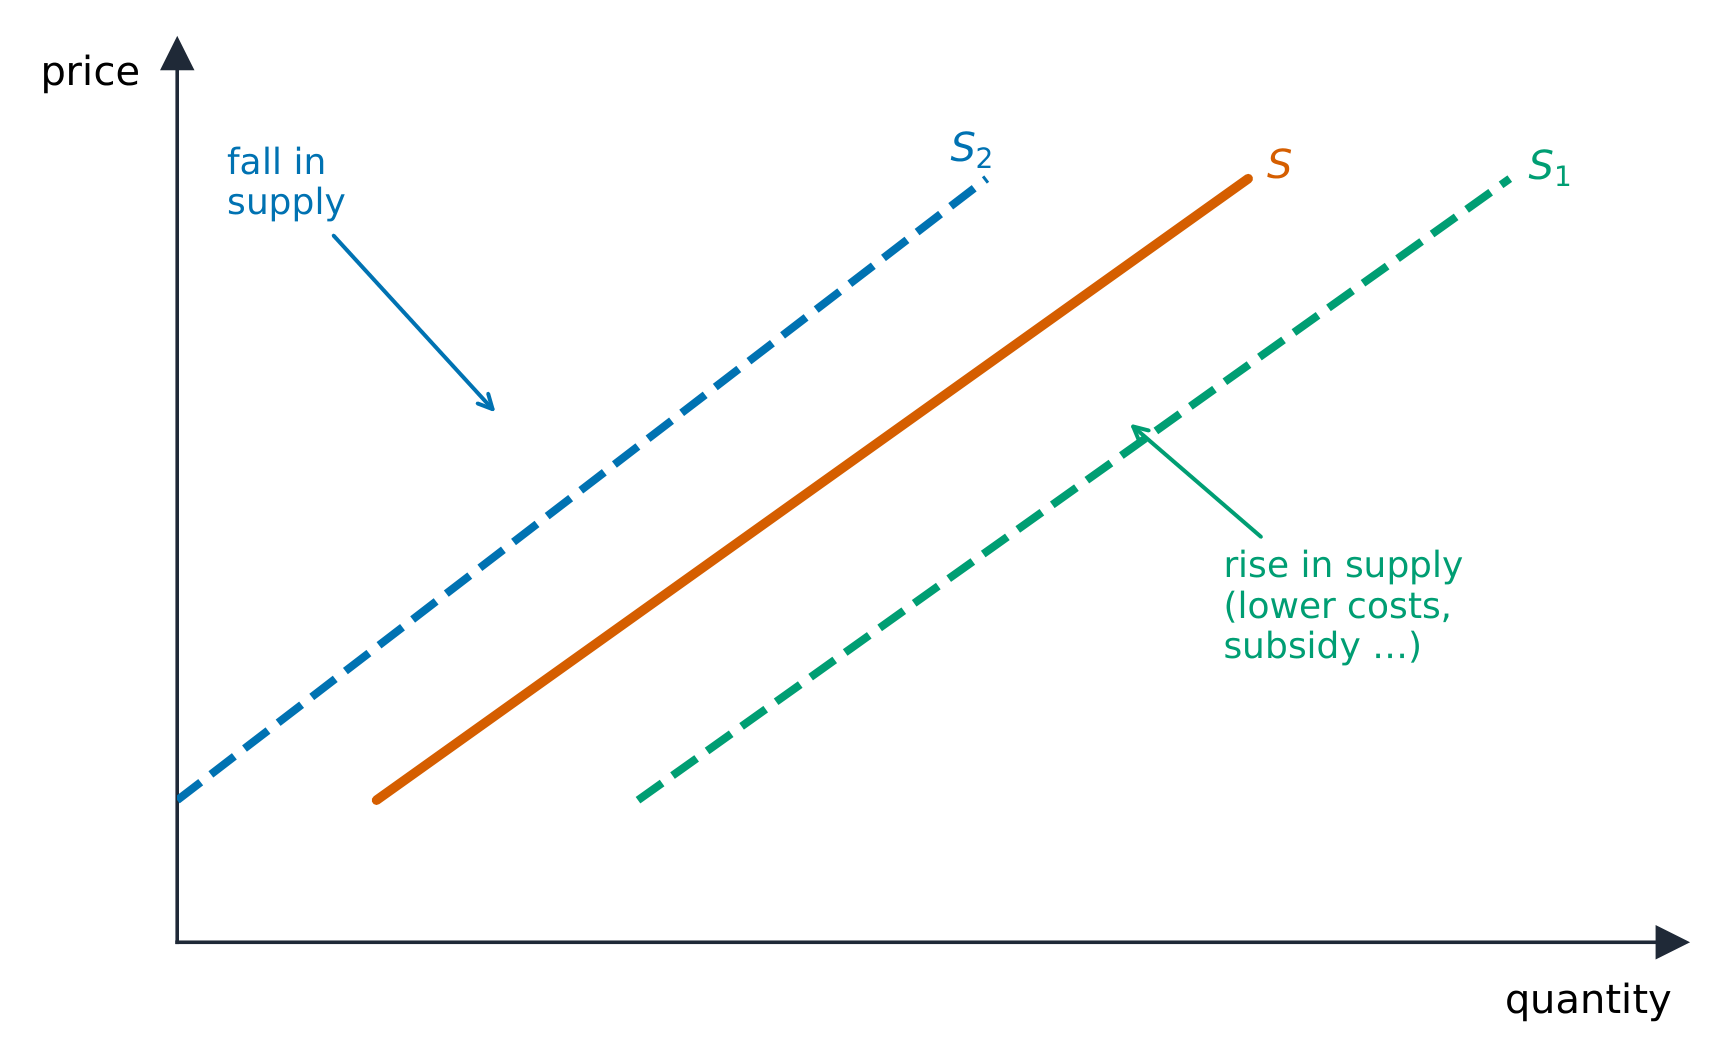
A shift in supply

Supply 供给 is the relationship between price and the quantity sellers will offer. The law of supply 供给定律: price and quantity supplied move in the same direction, so the supply curve slopes upward (higher prices cover higher marginal costs and reward more output).

Again separate a change in quantity supplied (movement along the curve, from the good's own price) from a change in supply (a shift). Supply shifts with input prices, technology, taxes and subsidies 补贴, prices of other goods a firm could make, number of sellers, and expectations. Just like demand, the market supply curve is the horizontal sum of individual firms' supply curves – add the quantities all firms offer at each price – so more sellers shifts market supply to the right.

Exam skill: on the free-response section you must draw correctly labeled supply-and-demand graphs and shift the right curve in the right direction – decide first whether the event changes an "own price" (move along) or a determinant (shift).

ไทย
การเลื่อนของอุปทาน

อุปทาน คือความสัมพันธ์ระหว่างราคาและปริมาณที่ผู้ขายจะเสนอขาย กฎแห่งอุปทาน: ราคาและปริมาณอุปทานเคลื่อนที่ในทิศทาง เดียวกัน ดังนั้น curve อุปทานจึงเอียงขึ้น upward (ราคาสูงครอบคลุมต้นทุนส่วนเพิ่มที่สูงกว่าและให้รางวัลต่อการผลิตมากขึ้น)

เส้นโค้ง عرضهชันขึ้น; ต้นทุน เทคโนโลยี ภาษี และการอุดหนุนเลื่อนเส้นโค้ง

อีกครั้ง แยก การเปลี่ยนแปลงปริมาณอุปทาน (การเคลื่อนที่ตาม curve, จากราคาของสินค้านั้นเอง) จาก การเปลี่ยนแปลงอุปทาน (การเลื่อน). อุปทานเลื่อนด้วย ราคาปัจจัยการผลิต, เทคโนโลยี, ภาษีและ เงินอุดหนุน, ราคาของสินค้าอื่นๆ ที่บริษัทอาจผลิตได้, จำนวนผู้ขาย, และ ความคาดหวัง เหมือนกับความต้องการ market supply curve คือผลรวมแบบแนวนอนของ curve อุปทานของบริษัทแต่ละแห่ง – บวกปริมาณที่บริษัททั้งหมดเสนอขายที่ราคาใดๆ – ดังนั้นผู้ขาย越多则 market supply เลื่อนไปทางขวา

ทักษะการสอบ: ในส่วนคำตอบเปิด คุณต้องวาดกราฟอุปทานและความต้องการที่มีฉลากถูกต้องและเลื่อน right curve ในทิศทางที่ ถูก – ตัดสินใจก่อนว่าเหตุการณ์เปลี่ยน "own price" (เคลื่อนที่ตาม) หรือปัจจัยกำหนด (เลื่อน)

2.3

Price Elasticity of Demand · ⁨ความยืดหยุ่นของความต้องการตามราคา⁩

Syllabus · ⁨หลักสูตร⁩
English

Enduring Understanding (MKT-3): Individuals and firms respond to incentives and face constraints.

Learning Objective MKT-3.E: a. Define measures of elasticity. b. Explain (using graphs where appropriate) measures of elasticity and the impact of a given price change on total revenue or total expenditure. c. Calculate (using data from a graph or a table as appropriate) measures of elasticity.

  • MKT-3.E.1 Economists use the concept of elasticity to measure the magnitude of percentage changes in quantity owing to any given changes in the own-price, income, and prices of related goods.
  • MKT-3.E.2 Price elasticity of demand is measured by the percentage change in quantity demanded divided by the percentage change in price or the responsiveness of the quantity demanded to changes in price. Elasticity varies along a linear demand curve, meaning slope is not elasticity.
  • MKT-3.E.3 Ranges of values of elasticity of demand are described as elastic or inelastic with the separating benchmark being a magnitude of 1, where the change in the price and the change in the quantity demanded are proportional.
    • a. When the magnitude of the value of elasticity is greater than 1, the demand is described as being elastic with respect to that price in the range of the given change.
    • b. When the magnitude of the value of elasticity is less than 1, the demand is described as being inelastic with respect to that price in the range of the given change.
    • c. When the magnitude of the value of elasticity is equal to 1, the demand is described as being unit elastic with respect to that price in the range of the given change.
  • MKT-3.E.4 The price elasticity of demand depends on certain factors such as the availability of substitutes.
  • MKT-3.E.5 The impact of a given price change on total revenue or total expenditure will depend on whether demand is elastic, inelastic, or unit elastic.
ไทย

ความเข้าใจที่ยั่งยืน (MKT-3): บุคคลและองค์กรตอบสนองต่อแรงจูงใจและเผชิญกับข้อจำกัด

วัตถุประสงค์การเรียนรู้ MKT-3.E: ก. นิยามวัดความยืดหยุ่น ข. อธิบาย (โดยใช้กราฟเมื่อเหมาะสม) วัดความยืดหยุ่นและผลกระทบของการเปลี่ยนแปลงราคาที่กำหนดต่อรายได้รวมหรือค่าใช้จ่ายรวม ค. คำนวณ (โดยใช้ข้อมูลจากกราฟหรือตารางเมื่อเหมาะสม) วัดความยืดหยุ่น

  • MKT-3.E.1 นักเศรษฐศาสตร์ใช้แนวคิดเรื่องความยืดหยุ่นเพื่อวัดขนาดของการเปลี่ยนแปลงเป็นเปอร์เซ็นต์ในปริมาณเนื่องจาก任何การเปลี่ยนแปลงที่กำหนดในราคาตัวเอง รายได้ และราคาของสินค้าที่เกี่ยวข้อง
  • MKT-3.E.2 ความยืดหยุ่นของราคาต่อความต้องการวัดโดยการเปลี่ยนแปลงเป็นเปอร์เซ็นต์ในปริมาณต้องการหารด้วยการเปลี่ยนแปลงเป็นเปอร์เซ็นต์ในราคา หรือความไวของปริมาณต้องการต่อการเปลี่ยนแปลงในราคา ความยืดหยุ่นแปรผันตามเส้นโค้งการสงค์เชิงเส้น หมายความว่าความชันไม่ใช่ความยืดหยุ่น
  • MKT-3.E.3 ช่วงค่าของความยืดหยุ่นของราคาต่อความต้องการถูกอธิบายว่าเป็นแบบยืดหยุ่นหรือแบบไม่ยืดหยุ่น โดยเกณฑ์แบ่งคือขนาดของ 1 ที่ซึ่งการเปลี่ยนแปลงในราคาและการเปลี่ยนแปลงในปริมาณต้องการเป็นสัดส่วนกัน
    • ก. เมื่อขนาดของค่าความยืดหยุ่นมีมากกว่า 1 การสงค์จะถูกอธิบายว่าเป็นแบบยืดหยุ่นเทียบกับราคานั้นในช่วงของการเปลี่ยนแปลงที่กำหนด
    • ข. เมื่อขนาดของค่าความยืดหยุ่นมีน้อยกว่า 1 การสงค์จะถูกอธิบายว่าเป็นแบบไม่ยืดหยุ่นเทียบกับราคานั้นในช่วงของการเปลี่ยนแปลงที่กำหนด
    • ค. เมื่อขนาดของค่าความยืดหยุ่นเท่ากับ 1 การสงค์จะถูกอธิบายว่าเป็นแบบยืดหยุ่นเท่ากันเทียบกับราคานั้นในช่วงของการเปลี่ยนแปลงที่กำหนด
  • MKT-3.E.4 ความยืดหยุ่นของราคาต่อความต้องการขึ้นอยู่กับปัจจัยบางประการ เช่น ความพร้อมของสินค้าทดแทน
  • MKT-3.E.5 ผลกระทบของการเปลี่ยนแปลงราคาที่กำหนดต่อรายได้รวมหรือค่าใช้จ่ายรวมจะขึ้นอยู่กับว่าการสงค์เป็นแบบยืดหยุ่น แบบไม่ยืดหยุ่น หรือแบบยืดหยุ่นเท่ากัน

Source: College Board AP Course and Exam Description · ⁨แหล่งที่มา: คำอธิบายหลักสูตรและข้อสอบ College Board AP⁩

English
Price elasticity of demand

Price elasticity of demand 需求价格弹性 measures how responsive quantity demanded is to a price change:

$$E_d=\left|\frac{\%\ \Delta\ \text{quantity demanded}}{\%\ \Delta\ \text{price}}\right|.$$

  • $E_d>1$: elastic 富有弹性 (quantity responds strongly);
  • $E_d<1$: inelastic 缺乏弹性 (quantity barely responds);
  • $E_d=1$: unit elastic.

Demand is more elastic when there are more substitutes, the good is a luxury, it takes a large share of income, or buyers have more time to adjust. Elasticity links to total revenue 总收入 ($P\times Q$): if demand is elastic, a price cut raises revenue; if inelastic, a price cut lowers it. Along a straight-line demand curve, elasticity falls as you move down (elastic on top, inelastic at the bottom).

Worked example. A price rise from $\$10$ to $\$12$ (a $+20\%$ change) cuts quantity demanded from $100$ to $85$ (a $-15\%$ change). Then $E_d=\left|\dfrac{-15\%}{20\%}\right|=0.75<1$, so demand is inelastic. Because it is inelastic, the price rise raises total revenue: from $\$10\times100=\$1000$ to $\$12\times85=\$1020$.

ไทย
ความยืดหยุ่นของความต้องการตามราคา

ความยืดหยุ่นของความต้องการตามราคา วัด how responsive quantity demanded เป็นต่อ price change:

$$E_d=\left|\frac{\%\ \Delta\ \text{quantity demanded}}{\%\ \Delta\ \text{price}}\right|.$$

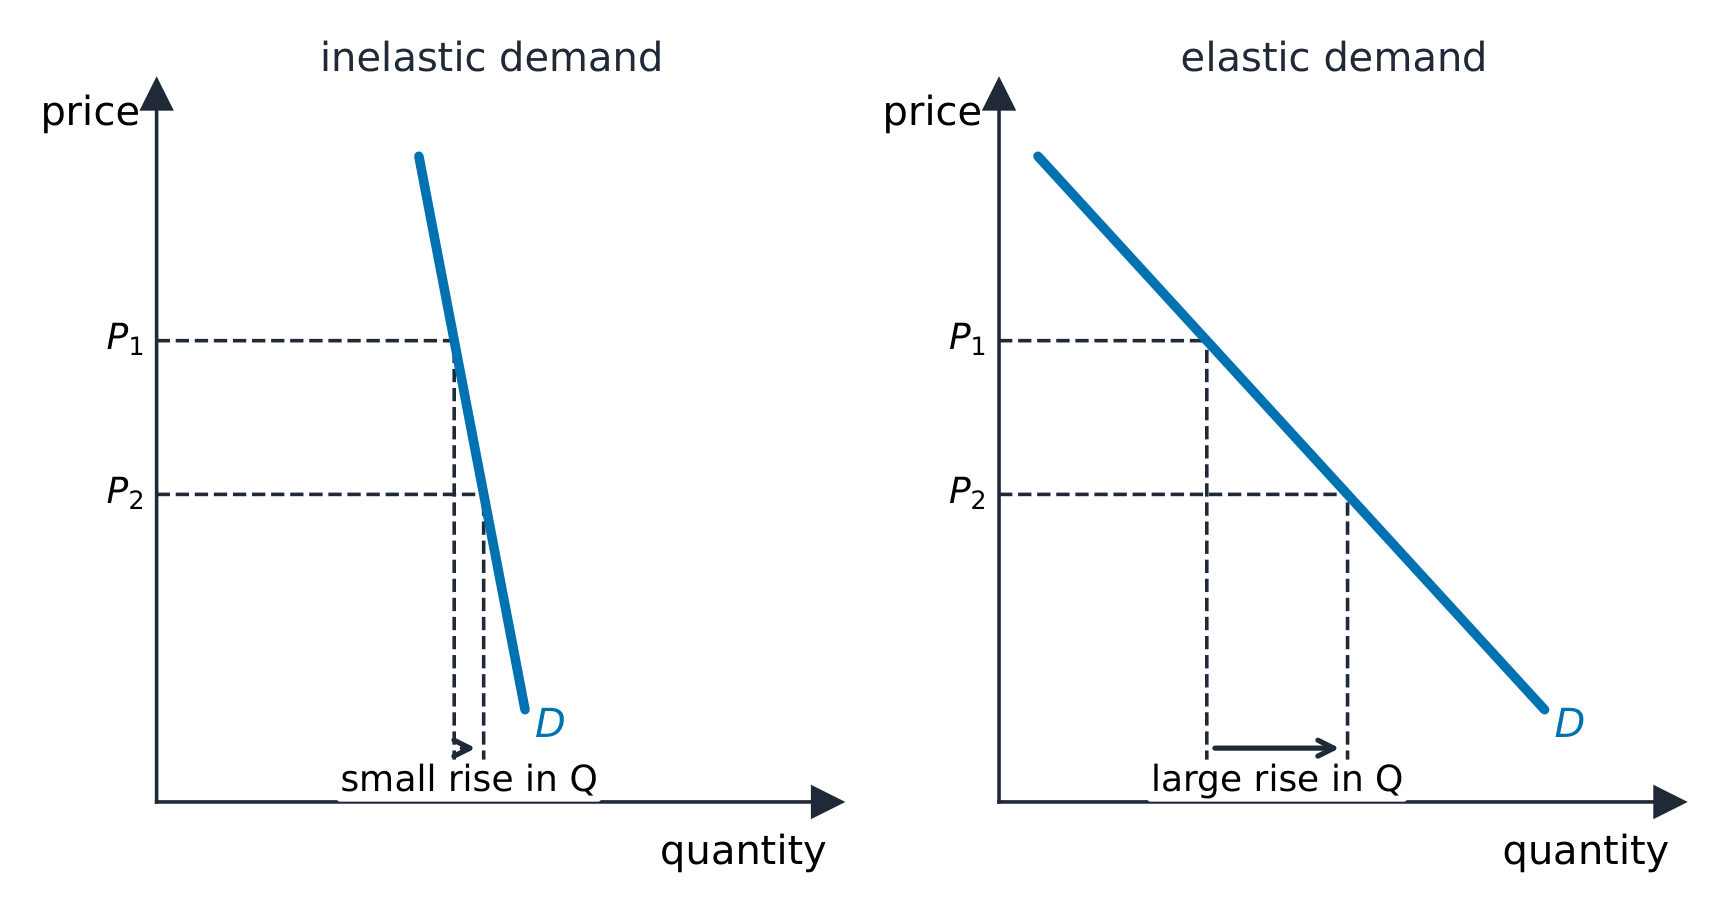
Inelastic versus elastic demand:一个小 versus一个大response to a price change
  • $E_d>1$: elastic (quantity responds strongly);
  • $E_d<1$: inelastic (quantity barely responds);
  • $E_d=1$: unit elastic.

Demand is more elastic when there are more substitutes, the good is a luxury, it takes a large share of income, or buyers have more time to adjust. Elasticity links to total revenue ($P\times Q$): if demand is elastic, a price cut raises revenue; if inelastic, a price cut lowers it. Along a straight-line demand curve, elasticity falls as you move down (elastic on top, inelastic at the bottom).

Worked example. A price rise from $\$10$ to $\$12$ (a $+20\%$ change) cuts quantity demanded from $100$ to $85$ (a $-15\%$ change). Then $E_d=\left|\dfrac{-15\%}{20\%}\right|=0.75<1$, so demand is inelastic. Because it is inelastic, the price rise raises total revenue: from $\$10\times100=\$1000$ to $\$12\times85=\$1020$.

Explore · ⁨สำรวจ⁩

Stretch price and measure elasticity · ⁨ยืดราคาและวัดความยืดหยุ่น⁩

Price elasticity of demand is how strongly quantity responds to price. A steep curve is inelastic (small response); a shallow one is elastic (large response). · ⁨ความยืดหยุ่นของอุปสงค์ต่อราคา คือความแข็งแกร่งที่ปริมาณตอบสนองต่อราคา เส้นชันแสดงว่าเป็น ไม่ยืดหยุ่น (ตอบสนองน้อย); เส้นแบนแสดงว่าเป็น ยืดหยุ่น (ตอบสนองมาก)⁩

Vocabulary · ⁨คำศัพท์⁩ Train · ⁨ฝึกฝน⁩
English ไทย
elastic/ɪˈlæstɪk/ ยืดหยุ่น
inelastic/ɪnɪˈlæstɪk/ ไม่ยืดหยุ่น (inelastic)
total revenue/ˈtəʊtl ˈrevənjuː/ รายได้รวม
2.4

Price Elasticity of Supply · ⁨ความยืดหยุ่นของอุปทานตามราคา⁩

Syllabus · ⁨หลักสูตร⁩
English

Enduring Understanding (MKT-3): Individuals and firms respond to incentives and face constraints.

Learning Objective MKT-3.E: a. Define measures of elasticity. b. Explain (using graphs where appropriate) measures of elasticity and the impact of a given price change on total revenue or total expenditure. c. Calculate (using data from a graph or a table as appropriate) measures of elasticity.

  • MKT-3.E.6 Price elasticity of supply is measured by the percentage change in quantity supplied divided by the percentage change in price, or the responsiveness of the quantity supplied to changes in price.
  • MKT-3.E.7 Ranges of values of elasticity of supply are described as elastic or inelastic with the separating benchmark being a magnitude of 1, where the change in the price and the change in the quantity supplied are proportional.
    • a. When the magnitude of the value of elasticity is greater than 1, the supply is described as being elastic with respect to that price in the range of the given change.
    • b. When the magnitude of the value of elasticity is less than 1, the supply is described as being inelastic with respect to that price in the range of the given change.
    • c. When the magnitude of the value of elasticity is equal to 1, the supply is described as being unit elastic with respect to that price in the range of the given change.
  • MKT-3.E.8 The price elasticity of supply depends on certain factors such as the price of alternative inputs.
ไทย

ความเข้าใจที่ยั่งยืน (MKT-3): บุคคลและองค์กรตอบสนองต่อแรงจูงใจและเผชิญกับข้อจำกัด

วัตถุประสงค์การเรียนรู้ MKT-3.E: ก. นิยามวัดความยืดหยุ่น ข. อธิบาย (โดยใช้กราฟเมื่อเหมาะสม) วัดความยืดหยุ่นและผลกระทบของการเปลี่ยนแปลงราคาที่กำหนดต่อรายได้รวมหรือค่าใช้จ่ายรวม ค. คำนวณ (โดยใช้ข้อมูลจากกราฟหรือตารางเมื่อเหมาะสม) วัดความยืดหยุ่น

  • MKT-3.E.6 ความยืดหยุ่นของราคาต่อการเสนอขายวัดโดยการเปลี่ยนแปลงเป็นเปอร์เซ็นต์ในปริมาณเสนอขายหารด้วยการเปลี่ยนแปลงเป็นเปอร์เซ็นต์ในราคา หรือความไวของปริมาณเสนอขายต่อการเปลี่ยนแปลงในราคา
  • MKT-3.E.7 ช่วงค่าของความยืดหยุ่นของราคาต่อการเสนอขายถูกอธิบายว่าเป็นแบบยืดหยุ่นหรือแบบไม่ยืดหยุ่น โดยเกณฑ์แบ่งคือขนาดของ 1 ที่ซึ่งการเปลี่ยนแปลงในราคาและการเปลี่ยนแปลงในปริมาณเสนอขายเป็นสัดส่วนกัน
    • ก. เมื่อขนาดของค่าความยืดหยุ่นมีมากกว่า 1 การเสนอขายจะถูกอธิบายว่าเป็นแบบยืดหยุ่นเทียบกับราคานั้นในช่วงของการเปลี่ยนแปลงที่กำหนด
    • ข. เมื่อขนาดของค่าความยืดหยุ่นมีน้อยกว่า 1 การเสนอขายจะถูกอธิบายว่าเป็นแบบไม่ยืดหยุ่นเทียบกับราคานั้นในช่วงของการเปลี่ยนแปลงที่กำหนด
    • ค. เมื่อขนาดของค่าความยืดหยุ่นเท่ากับ 1 การเสนอขายจะถูกอธิบายว่าเป็นแบบยืดหยุ่นเท่ากันเทียบกับราคานั้นในช่วงของการเปลี่ยนแปลงที่กำหนด
  • MKT-3.E.8 ความยืดหยุ่นของราคาต่อการเสนอขายขึ้นอยู่กับปัจจัยบางประการ เช่น ราคาของปัจจัยการผลิตทางเลือก

Source: College Board AP Course and Exam Description · ⁨แหล่งที่มา: คำอธิบายหลักสูตรและข้อสอบ College Board AP⁩

English

Price elasticity of supply 供给价格弹性, $E_s=\dfrac{\%\ \Delta\ Q_s}{\%\ \Delta\ P}$, measures how responsive sellers are. Supply is more elastic when firms can adjust output easily – spare capacity, storable goods, and above all more time (supply is more elastic in the long run than the short run).

ไทย

Price elasticity of supply, $E_s=\dfrac{\%\ \Delta\ Q_s}{\%\ \Delta\ P}$, measures how responsive sellers are. Supply is more elastic when firms can adjust output easily – spare capacity, storable goods, and above all more time (supply is more elastic in the long run than the short run).

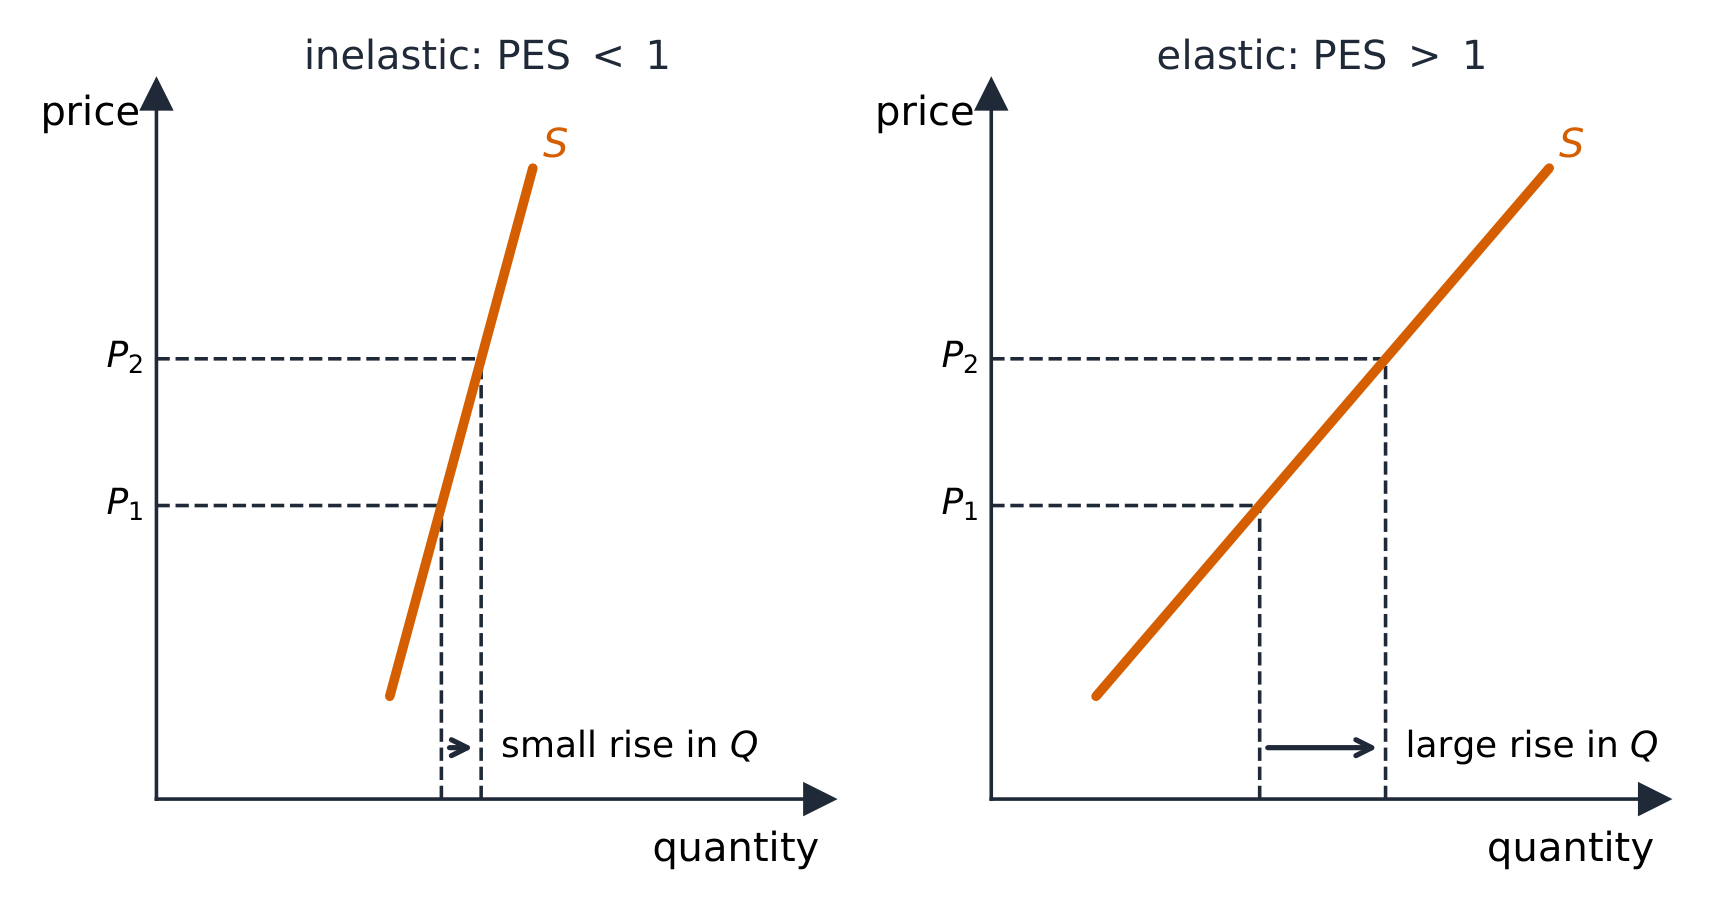
The same price rise gives a small supply response when PES is below 1, a large one above 1
Vocabulary · ⁨คำศัพท์⁩ Train · ⁨ฝึกฝน⁩
English ไทย
Price elasticity of supply/praɪs ɪlæˈstɪsɪti ɒv səˈplaɪ/ ความยืดหยุ่นของอุปทานต่อราคา (Price elasticity of supply)
2.5

Other Elasticities

Syllabus · ⁨หลักสูตร⁩
English

Enduring Understanding (MKT-3): Individuals and firms respond to incentives and face constraints.

Learning Objective MKT-3.E: a. Define measures of elasticity. b. Explain (using graphs where appropriate) measures of elasticity and the impact of a given price change on total revenue or total expenditure. c. Calculate (using data from a graph or a table as appropriate) measures of elasticity.

  • MKT-3.E.9 Elasticity can be measured for any determinant of demand or supply, not just the price.
  • MKT-3.E.10 Income elasticity of demand is measured by the percentage change in the quantity demanded divided by the percentage change in consumers' income. Economists use the income elasticity of demand to determine whether a good is normal or inferior.
  • MKT-3.E.11 Cross-price elasticity of demand is measured by the percentage change in the quantity demanded of one good divided by the percentage change in the price of another good. Economists use the cross-price elasticity of demand to determine whether goods are substitutes, complements, or not related.
ไทย

ความเข้าใจที่ยั่งยืน (MKT-3): บุคคลและองค์กรตอบสนองต่อแรงจูงใจและเผชิญกับข้อจำกัด

วัตถุประสงค์การเรียนรู้ MKT-3.E: ก. นิยามวัดความยืดหยุ่น ข. อธิบาย (โดยใช้กราฟเมื่อเหมาะสม) วัดความยืดหยุ่นและผลกระทบของการเปลี่ยนแปลงราคาที่กำหนดต่อรายได้รวมหรือค่าใช้จ่ายรวม ค. คำนวณ (โดยใช้ข้อมูลจากกราฟหรือตารางเมื่อเหมาะสม) วัดความยืดหยุ่น

  • MKT-3.E.9 ความยืดหยุ่นสามารถวัดได้จากตัวกำหนดของการสงค์หรือการเสนอขายใดๆ ไม่ใช่เฉพาะราคาเท่านั้น
  • MKT-3.E.10 ความยืดหยุ่นของรายได้ต่อความต้องการวัดโดยการเปลี่ยนแปลงเป็นเปอร์เซ็นต์ในปริมาณต้องการหารด้วยการเปลี่ยนแปลงเป็นเปอร์เซ็นต์ในรายได้ของผู้บริโภค นักเศรษฐศาสตร์ใช้ความยืดหยุ่นของรายได้ต่อความต้องการเพื่อกำหนดว่าสินค้าเป็นแบบปกติหรือแบบต่ำ
  • MKT-3.E.11 ความยืดหยุ่นของความต้องการต่อราคาสินค้าอื่น วัดจากเปอร์เซ็นต์การเปลี่ยนแปลงในปริมาณต้องการของสินค้าหนึ่ง หารด้วยเปอร์เซ็นต์การเปลี่ยนแปลงในราคาของสินค้านั้น นักเศรษฐศาสตร์ใช้ความยืดหยุ่นของความต้องการต่อราคาสินค้าอื่นเพื่อพิจารณาว่าสินค้าเหล่านั้นเป็น替代品 (substitutes), สินค้าที่ Consumed together (complements) หรือไม่มีความสัมพันธ์กัน

Source: College Board AP Course and Exam Description · ⁨แหล่งที่มา: คำอธิบายหลักสูตรและข้อสอบ College Board AP⁩

English
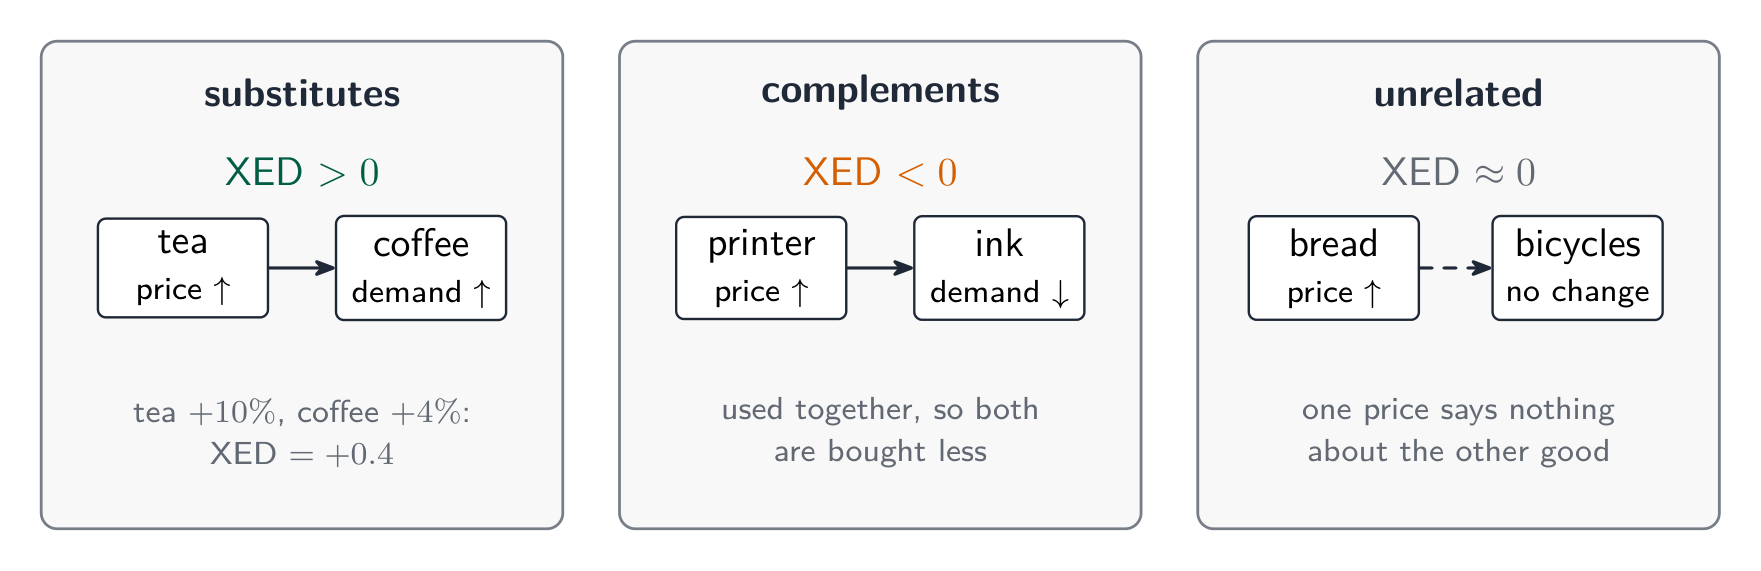
  • Cross-price elasticity 交叉价格弹性 $=\dfrac{\%\ \Delta\ Q_x}{\%\ \Delta\ P_y}$: positive for substitutes, negative for complements – the sign tells you the relationship.
  • Income elasticity 收入弹性 $=\dfrac{\%\ \Delta\ Q}{\%\ \Delta\ \text{income}}$: positive for normal goods (and $>1$ for luxuries), negative for inferior goods.

Worked example. When the price of coffee rises $10\%$, the quantity of tea demanded rises $6\%$: cross-price elasticity $=\dfrac{+6\%}{+10\%}=+0.6$. The positive sign confirms coffee and tea are substitutes. If instead a $5\%$ rise in incomes raised restaurant-meal demand $10\%$, income elasticity $=\dfrac{10\%}{5\%}=+2$ – a normal good, and a luxury since it exceeds $1$.

Exam skill: you are expected to compute an elasticity, classify it, and read a sign as evidence of substitute/complement or normal/inferior.

ไทย
  • Cross-price elasticity $=\dfrac{\%\ \Delta\ Q_x}{\%\ \Delta\ P_y}$: positive for substitutes, negative for complements – the sign tells you the relationship.
  • Income elasticity $=\dfrac{\%\ \Delta\ Q}{\%\ \Delta\ \text{income}}$: positive for normal goods (and $>1$ for luxuries), negative for inferior goods.

ตัวอย่างวิธีทำ: เมื่อราคากาแฟเพิ่มขึ้น $10\%$ ปริมาณชาที่ consumers ต้องการเพิ่มขึ้น $6\%$: ความยืดหยุ่นต่อราคาสัมพันธ์ $=\dfrac{+6\%}{+10\%}=+0.6$. ค่า บวก ยืนยันว่ากาแฟและชาเป็นสินค้า ทดแทนกัน. หากในทางกลับกัน การเพิ่มขึ้นของรายได้ $5\%$ ทำให้ความต้องการอาหารในร้านอาหารเพิ่มขึ้น $10\%$, ความยืดหยุ่นต่อรายได้ $=\dfrac{10\%}{5\%}=+2$ – เป็นสินค้าปกติ, และเป็นสินค้า ฟุ่มเฟือย เนื่องจากมีค่าเกิน $1$.

ความยืดหยุ่นต่อราคาสัมพันธ์: บวกสำหรับสินค้าทดแทนกัน, ลบสำหรับสินค้าประกอบกัน

ทักษะการสอบ: คุณควรมีความสามารถในการคำนวณความยืดหยุ่น, จำแนกประเภท, และอ่าน เครื่องหมาย เพื่อใช้หลักฐานยืนยันว่าเป็นสินค้าทดแทน/ประกอบกัน หรือสินค้าปกติ/ด้อยคุณภาพ

Vocabulary · ⁨คำศัพท์⁩ Train · ⁨ฝึกฝน⁩
English ไทย
Cross-price elasticity/krɒs praɪs ɪlæˈstɪsɪti/ ความยืดหยุ่นของราคาข้าม
Income elasticity/ˈɪŋkʌm ɪlæˈstɪsɪti/ ความยืดหยุ่นของรายได้
2.6

Market Equilibrium, Consumer Surplus, and Producer Surplus · ⁨จุดสมดุลตลาด, ส่วนต่างของผู้บริโภค, และส่วนต่างของผู้ผลิต⁩

Syllabus · ⁨หลักสูตร⁩
English

Enduring Understanding (MKT-4): Although equilibria are stable, an economy can move from one equilibrium to another if market conditions change.

Learning Objective MKT-4.A: a. Define (using graphs as appropriate) market equilibrium, consumer surplus, and producer surplus. b. Explain (using graphs as appropriate) how equilibrium price, quantity, consumer surplus, and producer surplus for a good or service are determined. c. Calculate (using data from a graph or table as appropriate) areas of consumer surplus and producer surplus at equilibrium.

  • MKT-4.A.1 The supply-demand model is a tool for understanding what factors influence prices and quantities and why prices and quantities might differ across markets or change over time.
  • MKT-4.A.2 In a perfectly competitive market, equilibrium is achieved (and markets clear with no shortages or surpluses) when the price of a good or service brings the quantity supplied and quantity demanded into balance, in the sense that buyers wish to purchase the same quantity that sellers wish to provide.
  • MKT-4.A.3 Equilibrium price provides information to economic decision-makers to guide resource allocation.
  • MKT-4.A.4 Economists use consumer surplus and producer surplus to measure the benefits markets create to buyers and sellers and understand market efficiency.
  • MKT-4.A.5 Market equilibrium maximizes total economic surplus in the absence of market failures, meaning that perfectly competitive markets are efficient.
ไทย

ความเข้าใจที่ยั่งยืน (MKT-4): แม้สมดุลจะมีความเสถียร แต่เศรษฐกิจสามารถเปลี่ยนผ่านจากจุดสมดุลหนึ่งไปยังอีกจุดหนึ่งได้หากสภาพตลาดเปลี่ยนแปลง

วัตถุประสงค์การเรียนรู้ MKT-4.A: ก. นิยาม (โดยใช้กราฟเมื่อเหมาะสม) ความสมดุลของตลาด ส่วนเกินของผู้บริโภค และส่วนเกินของผู้ผลิต ข. อธิบาย (โดยใช้กราฟเมื่อเหมาะสม) ว่าราคาสมดุล ปริมาณ平衡, ส่วนเกินของผู้บริโภค และส่วนเกินของผู้ผลิตสำหรับสินค้าหรือบริการใด ๆ ถูกกำหนดอย่างไร ค. คำนวณ (โดยใช้ข้อมูลจากกราฟหรือตารางเมื่อเหมาะสม) พื้นที่ของส่วนเกินของผู้บริโภคและส่วนเกินของผู้ผลิตที่จุดสมดุล

  • MKT-4.A.1 โมเดลอุปสงค์-อุปทานคือเครื่องมือในการทำความเข้าใจปัจจัยที่มีผลต่อราคาและปริมาณ以及如何使不同ตลาดหรือตามเวลา differs in prices and quantities.
  • MKT-4.A.2 ในตลาดแข่งขันสมบูรณ์ จุดสมดุลจะถูกบรรลุ (และตลาด clears with no shortages or surpluses) เมื่อราคาของสินค้าหรือบริการทำให้ปริมาณเสนอขายและปริมาณต้องการอยู่ในสภาวะสมดุล โดยผู้ซื้อต้องการซื้อจำนวนเท่าที่ผู้ขายต้องการจำหน่าย
  • MKT-4.A.3 ราคาสมดุลให้ข้อมูลแก่ผู้ตัดสินใจทางเศรษฐกิจเพื่อوجيهการจัดสรรทรัพยากร
  • MKT-4.A.4 นักเศรษฐศาสตร์ใช้ส่วนเกินของผู้บริโภคและส่วนเกินของผู้ผลิตเพื่อวัดประโยชน์ที่ตลาดสร้างให้กับผู้ซื้อและผู้ขายและทำความเข้าใจประสิทธิภาพของตลาด
  • MKT-4.A.5 ความสมดุลของตลาดเพิ่มส่วนเกินทางเศรษฐกิจรวมสูงสุดเมื่อไม่มีการล้มเหลวของตลาด ซึ่งหมายความว่าตลาดแข่งขันสมบูรณ์มีประสิทธิภาพ

Source: College Board AP Course and Exam Description · ⁨แหล่งที่มา: คำอธิบายหลักสูตรและข้อสอบ College Board AP⁩

English
Consumer & producer surplus

Equilibrium 均衡 is where supply meets demand: the equilibrium price clears the market, so quantity demanded equals quantity supplied and there is no shortage or surplus.

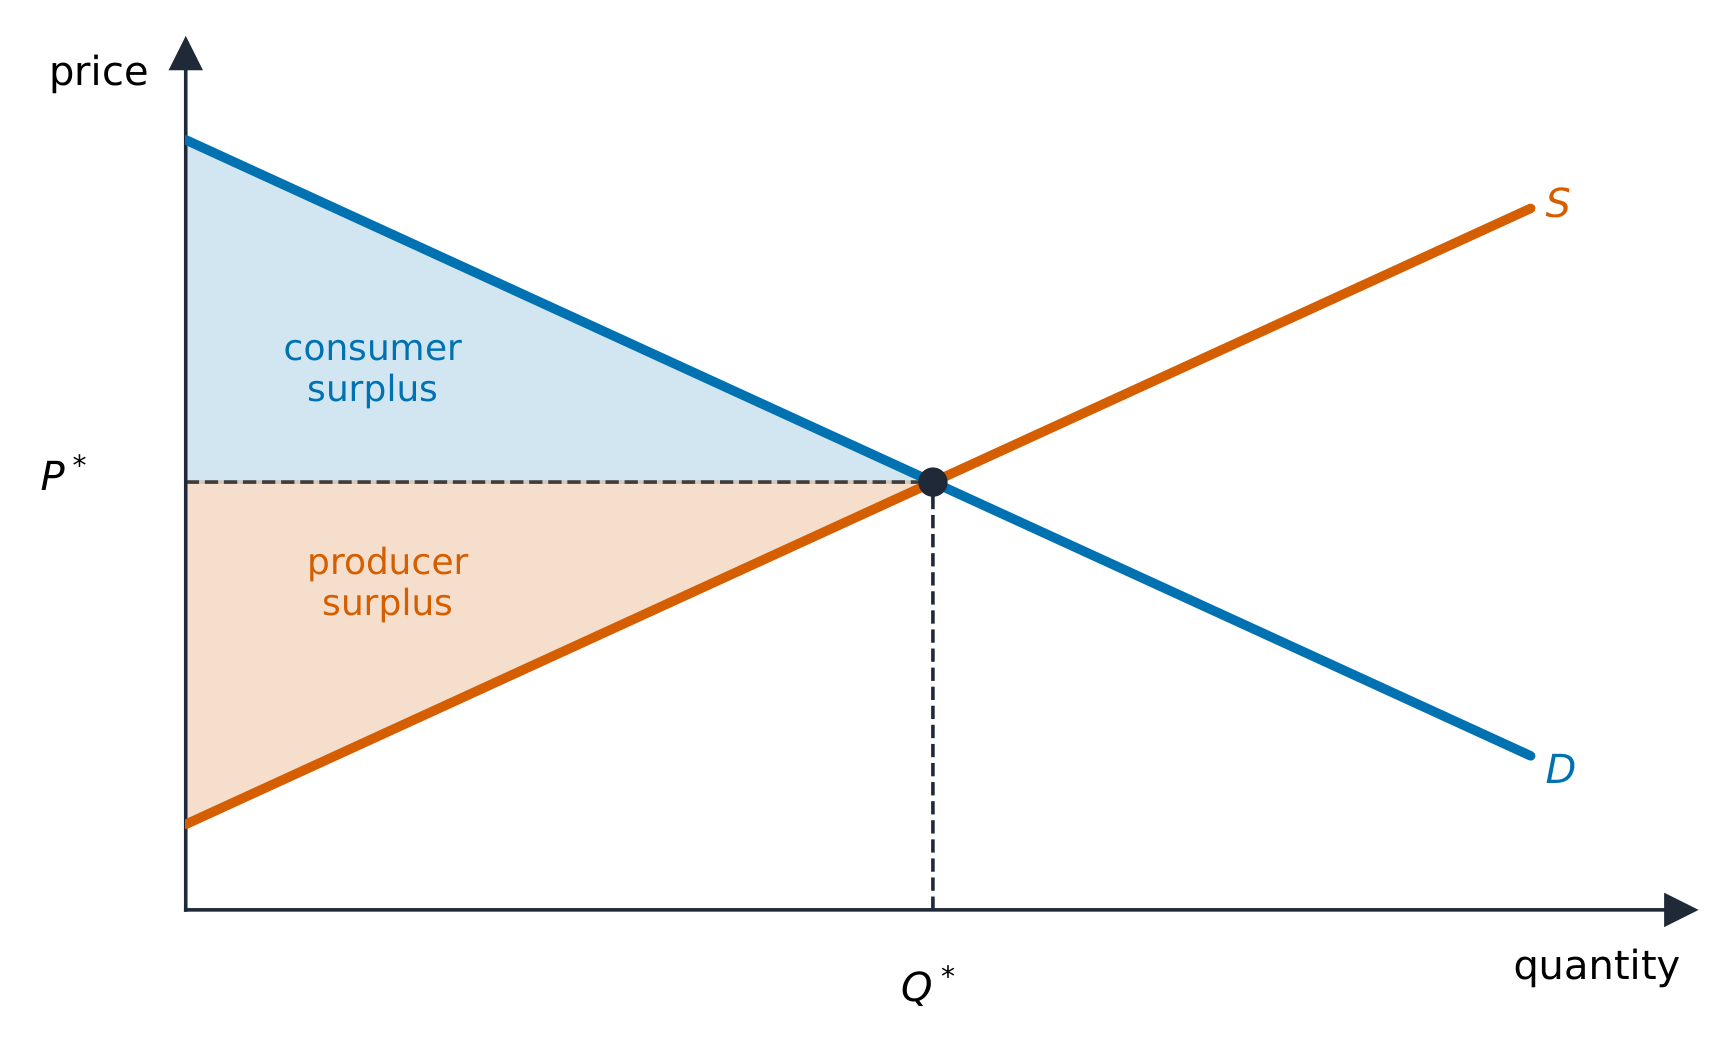
  • Consumer surplus 消费者剩余 is the area below the demand curve and above the price – the gap between what buyers would pay and what they do pay.
  • Producer surplus 生产者剩余 is the area above the supply curve and below the price – the gap between the price and sellers' minimum acceptable price.
  • Their sum is total surplus 总剩余, and the competitive equilibrium maximizes it – this is why free markets are called allocatively efficient 配置有效率.
ไทย
ส่วนเกินของผู้บริโภคและผู้ผลิต

จุดสมดุล คือจุดที่_supply_碰到了_demand_: ราคาสมดุล ช่วยเคลียร์ตลาด ทำให้ปริมาณที่ต้องการเท่ากับปริมาณที่เสนอขาย และไม่มีการขาดแคลนหรือ surplus

Consumer surplus and producer surplus at the market equilibrium
Consumer surplus และ producer surplus ที่จุดสมดุลของตลาด
  • ส่วนต่างของผู้บริโภค (Consumer surplus) คือพื้นที่ ใต้เส้น demand และเหนือราคา –也就是差 between ผู้ซื้อยินดีจ่ายและผู้ซื้อจ่ายจริง
  • ส่วนต่างของผู้ผลิต (Producer surplus) คือพื้นที่ เหนือเส้น supply และใต้ราคา –也就是差 between ราคาและ最低 acceptable price ของผู้ขาย
  • ผลรวมของทั้งสองคือ ส่วนต่างรวม (Total surplus), และจุดสมดุลแบบแข่งขันจะ เพิ่มสูงสุด มันนี่เอง – นี่คือเหตุผลที่ตลาดเสรีถูกเรียกว่า allocatively efficient
ร้านขายผลไม้และผักในตลาด
ตลาดจริง: ผู้ซื้อและผู้ขายจำนวนมากมาพบกัน, และราคาจะตกผลึกอยู่ที่จุดที่ปริมาณที่ต้องการเท่ากับปริมาณที่เสนอขาย
Explore · ⁨สำรวจ⁩

See consumer and producer surplus · ⁨เห็นส่วนเกินของผู้บริโภคและผู้ผลิต⁩

At equilibrium the market clears. The gap between what buyers would pay and the price is consumer surplus; the gap above sellers' costs is producer surplus. · ⁨ที่จุด สมดุล ตลาดจะ clears ส่วนต่างระหว่างสิ่งที่ผู้ซื้อยินดีจ่ายกับราคาจริงคือ ส่วนเกินของผู้บริโภค; ส่วนต่างเหนือต้นทุนของผู้ขายคือ ส่วนเกินของผู้ผลิต⁩

Vocabulary · ⁨คำศัพท์⁩ Train · ⁨ฝึกฝน⁩
English ไทย
Equilibrium/ˌiːkwɪˈlɪbrɪəm/ สมดุล
Consumer surplus/kənˈsuːmə ˈsɜːpləs/ ส่วนเกินของผู้บริโภค
Producer surplus/prəˈdjuːsə ˈsɜːpləs/ ส่วนเกินของผู้ผลิต
total surplus/ˈtəʊtl ˈsɜːpləs/ ส่วนเกินรวม
allocatively efficient/ˈæləkətɪvli ɪˈfɪʃənt/ allocatively efficient
surplus/ˈsɜːpləs/ ส่วนเกิน
2.7

Market Disequilibrium and Changes in Equilibrium · ⁨ความไม่สมดุลของตลาดและการเปลี่ยนแปลงจุดสมดุล⁩

Syllabus · ⁨หลักสูตร⁩
English

Enduring Understanding (MKT-4): Although equilibria are stable, an economy can move from one equilibrium to another if market conditions change.

Learning Objective MKT-4.B: a. Define a surplus and shortage. b. Explain (using graphs where appropriate) how changes in underlying conditions and shocks to a competitive market can alter price, quantity, consumer surplus, and producer surplus. c. Calculate (using data from a graph or table as appropriate) changes in price, quantity, consumer surplus, and producer surplus in response to changes in market conditions or market disequilibrium.

  • MKT-4.B.1 Whenever markets experience imbalances—creating disequilibrium prices and quantities, surpluses, and shortages—market forces drive price and quantity toward equilibrium.
  • MKT-4.B.2 Factors that shift the market demand and market supply curves cause price, quantity, consumer surplus, producer surplus, and total economic surplus (within that market) to change. The impact of the change depends on the price elasticities of demand and supply.
ไทย

ความเข้าใจที่ยั่งยืน (MKT-4): แม้สมดุลจะมีความเสถียร แต่เศรษฐกิจสามารถเปลี่ยนผ่านจากจุดสมดุลหนึ่งไปยังอีกจุดหนึ่งได้หากสภาพตลาดเปลี่ยนแปลง

วัตถุประสงค์การเรียนรู้ MKT-4.B: ก. นิยามส่วนเกินและส่วนขาด ข. อธิบาย (โดยใช้กราฟเมื่อเหมาะสม) การเปลี่ยนแปลงในเงื่อนไขพื้นฐานและการกระแทกต่อตลาดแข่งขันสามารถเปลี่ยนแปลงราคา ปริมาณ ส่วนเกินของผู้บริโภค และส่วนเกินของผู้ผลิตได้อย่างไร ค. คำนวณ (โดยใช้ข้อมูลจากกราฟหรือตารางเมื่อเหมาะสม) การเปลี่ยนแปลงของราคา ปริมาณ ส่วนเกินของผู้บริโภค และส่วนเกินของผู้ผลิตตอบสนองต่อการเปลี่ยนแปลงในสภาพตลาดหรือความไม่สมดุลของตลาด

  • MKT-4.B.1 ทุกครั้งที่ตลาดประสบความไม่สมดุล—ซึ่งก่อให้เกิดราคาและความไม่สมดุลของปริมาณ surplus และ shortage—แรงกดดันของตลาดจะผลักราคาและปริมาณเข้าหาจุดสมดุล
  • MKT-4.B.2 ปัจจัยที่ทำให้เส้นโค้งอุปสงค์ตลาดและอุปทานตลาด shift ทำให้ราคา ปริมาณ ส่วนเกินของผู้บริโภค ส่วนเกินของผู้ผลิต และส่วนเกินทางเศรษฐกิจรวม (ภายในตลาดนั้น) เปลี่ยนแปลง ผลกระทบของการเปลี่ยนแปลงขึ้นอยู่กับความยืดหยุ่นของราคาของอุปสงค์และอุปทาน

Source: College Board AP Course and Exam Description · ⁨แหล่งที่มา: คำอธิบายหลักสูตรและข้อสอบ College Board AP⁩

English

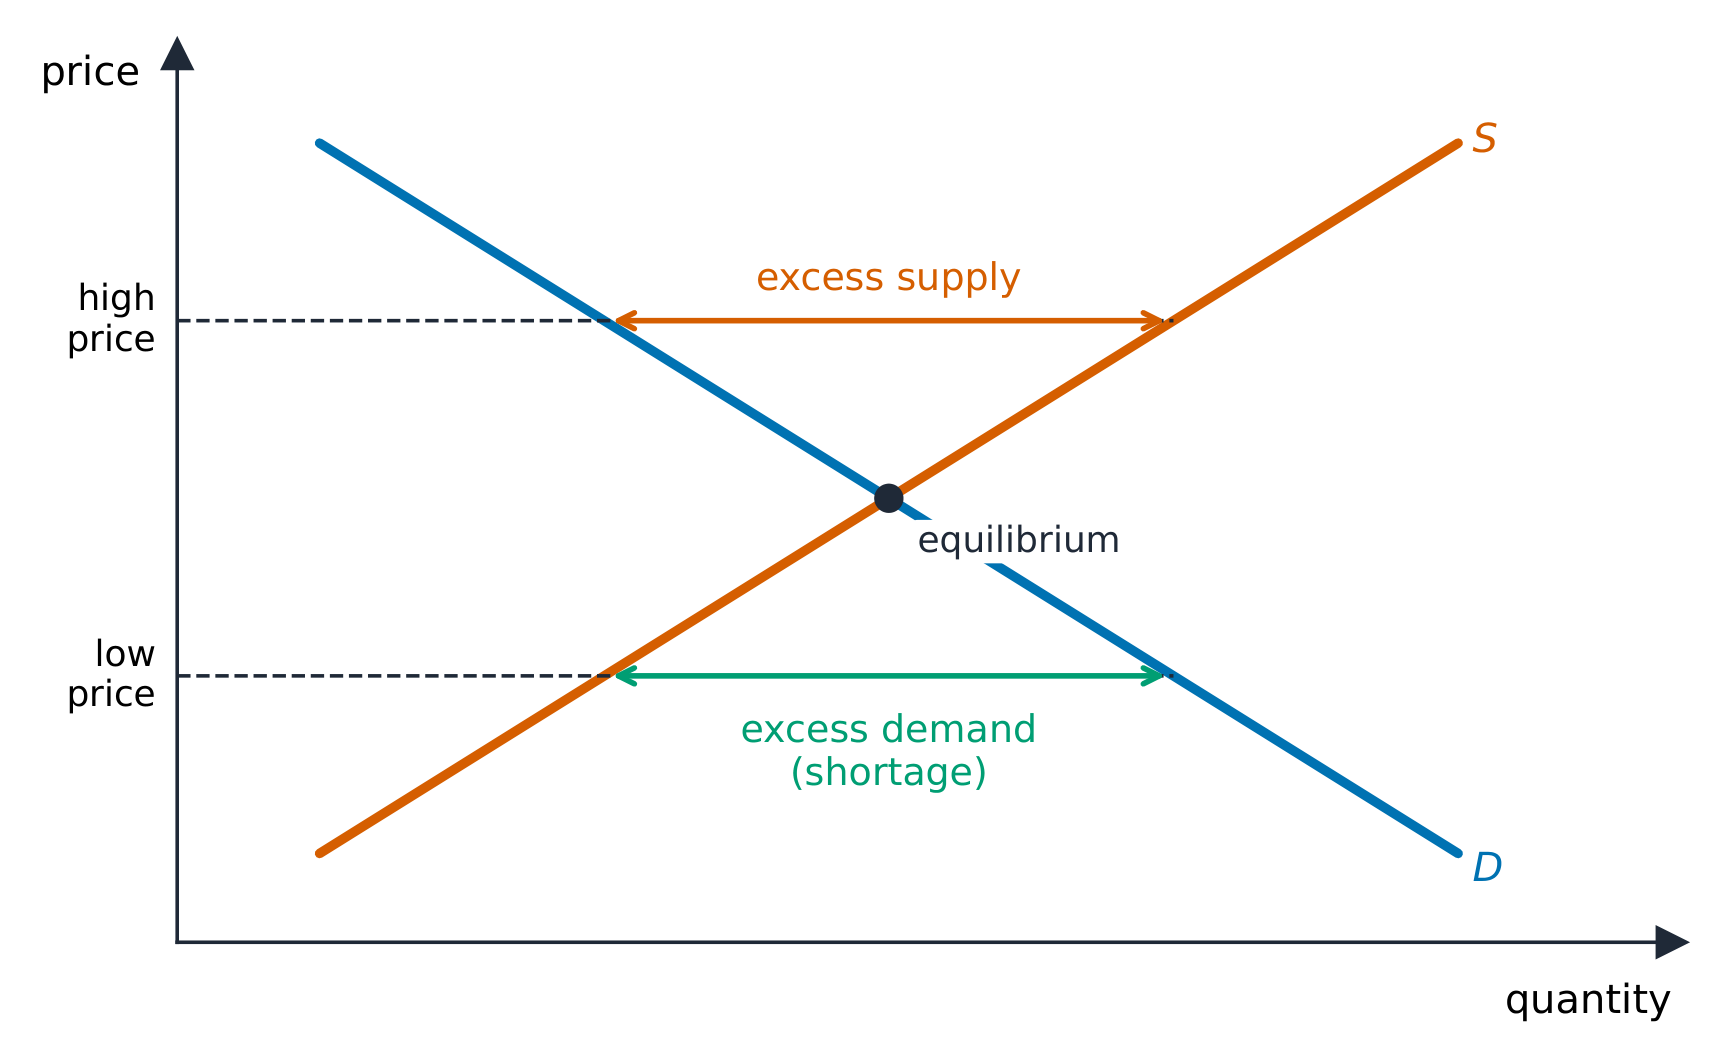
Away from equilibrium the market self-corrects: above the equilibrium price there is a surplus 过剩 (excess supply) that pushes price down; below it a shortage 短缺 (excess demand) that pushes price up.

When a determinant shifts a curve, the equilibrium moves predictably. A single shift gives a definite result for both price and quantity. When both curves shift, one of price or quantity is indeterminate (depends on the relative sizes of the shifts) – a favorite exam trap. Work these out by drawing the shifts.

ไทย

เมื่อห่างจากจุดสมดุล ตลาดจะปรับตัวเอง: เหนือราคาสมดุลจะมี surplus (excess supply) ซึ่งดันราคาให้ลดลง; ต่ำกว่านั้นจะมี shortage (excess demand) ซึ่งดันราคาให้สูงขึ้น

เหนือจุดสมดุลมี excess supply; ต่ำกว่ามี excess demand

เมื่อตัวกำหนดหนึ่งอย่างทำให้เส้น curve เคลื่อนที่ จุดสมดุลจะเคลื่อนที่ได้อย่าง predictable. การ shift เดียว ให้ผลลัพธ์ที่แน่นอนสำหรับทั้งราคาและปริมาณ. แต่เมื่อ ทั้งสอง เส้น curve เคลื่อนที่ ราคาคือปริมาณอย่างใดอย่างหนึ่งจะเป็น indeterminate (ขึ้นอยู่กับขนาดสัมพัทธ์ของการ shift) – ซึ่งเป็นกับดักการสอบยอดนิยม. ทำโจทย์เหล่านี้ได้โดยการวาดกราฟแสดงการ shift

Vocabulary · ⁨คำศัพท์⁩ Train · ⁨ฝึกฝน⁩
English ไทย
shortage/ˈʃɔːtɪdʒ/ ขาดแคลน
2.8

The Effects of Government Intervention in Markets · ⁨ผลกระทบของการแทรกแซงของรัฐบาลในตลาด⁩

Syllabus · ⁨หลักสูตร⁩
English

Enduring Understanding (POL-1): Government policies influence consumer and producer behavior and therefore affect market outcomes.

Learning Objective POL-1.A: a. Define forms of government price and quantity intervention. b. Explain (using graphs where appropriate) how government policies alter consumer and producer behaviors that influence incentives and therefore affect outcomes. c. Calculate (using data from a graph or table where appropriate) changes in market outcomes resulting from government policies.

  • POL-1.A.1 Some government policies, such as price floors, price ceilings, and other forms of price and quantity regulation, affect incentives and outcomes in all market structures.
  • POL-1.A.2 Governments use taxes and subsidies to change incentives in ways that influence consumer and producer behavior, shifting the supply and demand curves accordingly.
  • POL-1.A.3 Taxes and subsidies affect government revenues or costs.
  • POL-1.A.4 Government intervention in a market producing the efficient quantity through taxes, subsidies, price controls, or quantity controls can only decrease allocative efficiency.
  • POL-1.A.5 Deadweight loss represents the losses to buyers and sellers as a result of government intervention in an efficient market.
  • POL-1.A.6 The incidence of taxes and subsidies imposed on goods traded in perfectly competitive markets depends on the elasticity of supply and demand.
ไทย

ความเข้าใจที่ยั่งยืน (POL-1): นโยบายของรัฐบาลมีผลต่อพฤติกรรมของผู้บริโภคและผู้ผลิต ดังนั้นจึงส่งผลกระทบต่อผลลัพธ์ของตลาด

จุดประสงค์การเรียนรู้ POL-1.A: ก. นิยามรูปแบบต่างๆ ของการแทรกแซงราคาและปริมาณของรัฐบาล ข. อธิบาย (โดยใช้กราฟเมื่อเหมาะสม) นโยบายของรัฐบาลเปลี่ยนแปลงพฤติกรรมของผู้บริโภคและผู้ผลิตที่มีผลต่อแรงจูงใจอย่างไร และส่งผลต่อผลลัพธ์อย่างไร ค. คำนวณ (โดยใช้ข้อมูลจากกราฟหรือตารางเมื่อเหมาะสม) การเปลี่ยนแปลงของผลลัพธ์ในตลาดที่เกิดจากนโยบายของรัฐบาล

  • POL-1.A.1 นโยบายบางอย่างของรัฐบาล เช่น ราคาขั้นต่ำ ราคาสูงสุด และการควบคุมราคาและรูปแบบอื่นๆ มีผลต่อแรงจูงใจและผลลัพธ์ในทุกโครงสร้างตลาด
  • POL-1.A.2 รัฐบาลใช้ภาษีและเงินอุดหนุนเพื่อเปลี่ยนแปลงแรงจูงใจในลักษณะที่ส่งผลต่อพฤติกรรมของผู้บริโภคและผู้ผลิต โดย shifting เส้น供需 accordingly.
  • POL-1.A.3 ภาษีและเงินอุดหนุนมีผลต่อรายได้หรือต้นทุนของรัฐบาล
  • POL-1.A.4 การแทรกแซงของรัฐบาลในตลาดที่ผลิตปริมาณที่มีประสิทธิภาพผ่านภาษี เงินอุดหนุน การควบคุมราคา หรือการควบคุมปริมาณ สามารถลดประสิทธิภาพในการจัดสรรทรัพยากรได้เพียงอย่างเดียวเท่านั้น
  • POL-1.A.5 Deadweight loss แสดงถึงการสูญเสียของผู้ซื้อและผู้ขายอันเนื่องมาจากการแทรกแซงของรัฐบาลในตลาดที่มีประสิทธิภาพ
  • POL-1.A.6 การกระจายภาระของภาษีและเงินอุดหนุนที่เก็บกับสินค้าที่ซื้อขายในตลาดแข่งขันสมบูรณ์ขึ้นอยู่กับความยืดหยุ่นของอุปทานและอุปสงค์

Source: College Board AP Course and Exam Description · ⁨แหล่งที่มา: คำอธิบายหลักสูตรและข้อสอบ College Board AP⁩

English
A price ceiling causes a shortage
A tax and the deadweight loss

Governments intervene, usually reducing total surplus:

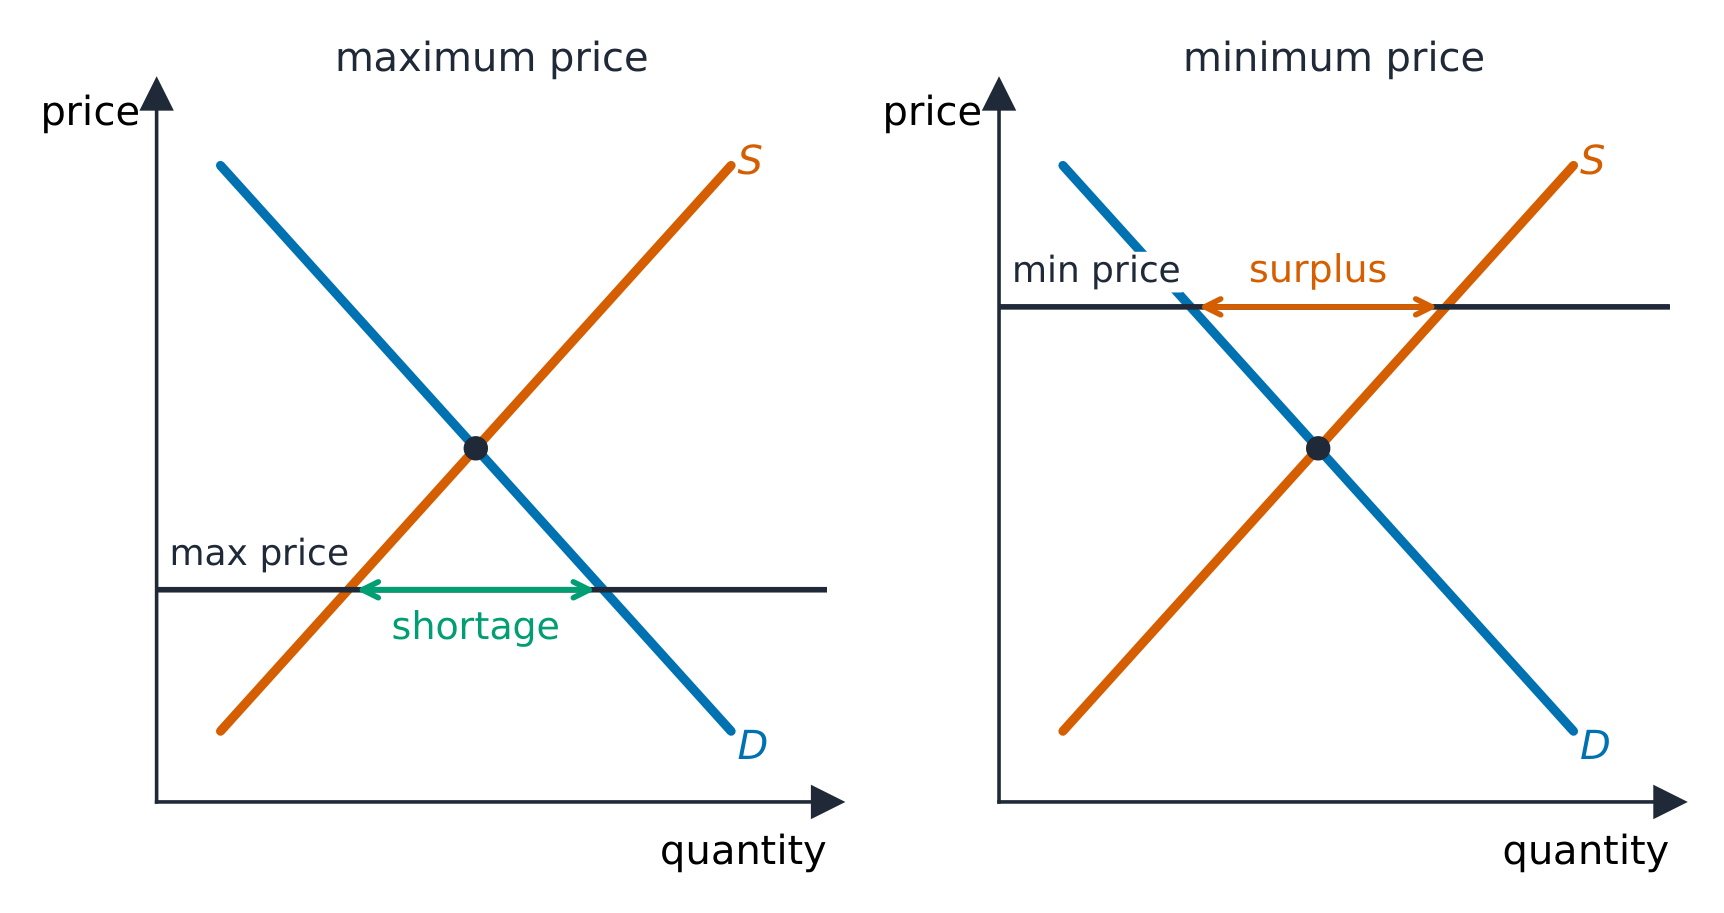
  • A price ceiling 价格上限 (a legal maximum, like rent control) below equilibrium causes a persistent shortage.
  • A price floor 价格下限 (a legal minimum, like a minimum wage) above equilibrium causes a persistent surplus.
  • An excise tax 消费税 shifts supply up by the tax; the burden (tax incidence 税收归宿) falls more heavily on whichever side is more inelastic.
  • A subsidy shifts supply down, raising quantity.

Each of these creates deadweight loss 无谓损失 – mutually beneficial trades that no longer happen, shown as a triangle between the curves at the new quantity.

Exam skill: on a graph, be able to shade consumer surplus, producer surplus, government revenue from a tax, and deadweight loss, and say who bears the tax and why.

ไทย
Price ceiling ทำให้เกิด shortage
Tax และ deadweight loss

รัฐบาลแทรกแซงตลาด โดยมักจะทำให้ total surplus ลดลง:

Price ceiling ทำให้เกิด shortage; Price floor ทำให้เกิด surplus
  • Price ceiling (限价สูงสุดตามกฎหมาย, เช่น การควบคุมค่าเช่า) ต่ำกว่าจุดสมดุลจะทำให้เกิด shortage อย่างถาวร
  • Price floor (限价最低ตามกฎหมาย, เช่น เงินเดือนขั้นต่ำ) สูงกว่าจุดสมดุลจะทำให้เกิด surplus อย่างถาวร
  • Excise tax ทำให้เส้น supply เคลื่อนขึ้นตามจำนวนภาษี; ภาระ (tax incidence) จะตกหนักไปทางฝั่งไหนก็ตามที่เป็น more inelastic
  • Subsidy ทำให้เส้น supply เคลื่อนลง เพิ่มปริมาณการผลิต

ทุกกรณีเหล่านี้สร้าง deadweight loss –也就是交易 mutually beneficial ที่ไม่เกิดขึ้นอีกต่อไป แสดงเป็นสามเหลี่ยมระหว่างเส้น curves ที่ปริมาณใหม่

ทักษะการสอบ: ในกราฟ สามารถ shading ส่วนต่างของผู้บริโภค, ส่วนต่างของผู้ผลิต, รายได้รัฐบาลจากภาษี, และ deadweight loss ได้ บอกได้ว่าใครเป็นผู้รับภาระภาษีและทำไมถึงเป็นเช่นนั้น

Explore · ⁨สำรวจ⁩

Add a tax or price control · ⁨เพิ่มภาษีหรือการควบคุมราคา⁩

A price ceiling below equilibrium causes shortages; a tax drives a wedge between what buyers pay and sellers get, shrinking the quantity traded. · ⁨เพดานราคา ที่ต่ำกว่าจุดสมดุลทำให้เกิดภาวะขาดแคลน; ภาษี สร้างช่องว่างระหว่างสิ่งที่ผู้ซื้อจ่ายและผู้ขายได้รับ ลดปริมาณการซื้อขายลง⁩

Vocabulary · ⁨คำศัพท์⁩ Train · ⁨ฝึกฝน⁩
English ไทย
price ceiling/praɪs ˈsiːlɪŋ/ เพดานราคา
price floor/praɪs flɔː/ ราคาขั้นต่ำ (price floor)
excise tax/ekˈsaɪz tæks/ ภาษี Consumption excise tax
tax incidence/tæks ˈɪnsɪdəns/ ภาระภาษี
deadweight loss/ˈdedweɪt lɒs/ deadweight loss
2.9

International Trade and Public Policy · ⁨การค้าระหว่างประเทศและนโยบายสาธารณะ⁩

Syllabus · ⁨หลักสูตร⁩
English

Enduring Understanding (POL-1): Government policies influence consumer and producer behavior and therefore affect market outcomes.

Learning Objective POL-1.B: a. Define tariffs and quotas. b. Explain (using graphs where appropriate) how markets are affected by public policy related to international trade. c. Calculate (using data from a graph or table as appropriate) changes in market outcomes resulting from public policy related to international trade.

  • POL-1.B.1 Equilibria in competitive markets may be altered by the decision to open an economy to trade with other countries; equilibrium price can be higher or lower than under autarky, and the gap between domestic supply and demand is filled by trade. Opening an economy to trade with other countries affects consumer surplus, producer surplus, and total economic surplus.
  • POL-1.B.2 Tariffs, which governments sometimes use to influence international trade, affect domestic price, quantity, government revenue, and consumer surplus and total economic surplus.
  • POL-1.B.3 Quotas can be used to alter quantities produced and therefore affect price, consumer surplus, and total economic surplus.
    • Exclusion statement: The graphing of quotas is beyond the scope of the course and the AP Exam, but understanding how quotas affect quantities produced is within the scope.
ไทย

ความเข้าใจที่ยั่งยืน (POL-1): นโยบายของรัฐบาลมีผลต่อพฤติกรรมของผู้บริโภคและผู้ผลิต ดังนั้นจึงส่งผลกระทบต่อผลลัพธ์ของตลาด

วัตถุประสงค์การเรียนรู้ POL-1.B: ก. นิยามภาษีศุลกากรและโควตา ข. อธิบาย (โดยใช้กราฟเมื่อเหมาะสม) ตลาดได้รับผลกระทบจากนโยบายสาธารณะที่เกี่ยวข้องกับการค้าระหว่างประเทศอย่างไร ค. คำนวณ (โดยใช้ข้อมูลจากกราฟหรือตารางเมื่อเหมาะสม) การเปลี่ยนแปลงของผลลัพธ์ในตลาดที่เกิดจากนโยบายสาธารณะที่เกี่ยวข้องกับการค้าระหว่างประเทศ

  • POL-1.B.1 จุดสมดุลในตลาดแข่งขันอาจถูกเปลี่ยนแปลงด้วยการตัดสินใจเปิดเศรษฐกิจให้ค้ากับประเทศอื่น; ราคาสมดุลอาจสูงกว่าหรือต่ำกว่าภายใต้ Autarky และช่องว่างระหว่างอุปทานและอุปทานในประเทศจะถูกเติมเต็มผ่านการค้า การเปิดเศรษฐกิจให้ค้ากับประเทศอื่นมีผลต่อส่วนเกินของผู้บริโภค ส่วนเกินของผู้ผลิต และส่วนเกินทางเศรษฐกิจรวม
  • POL-1.B.2 ภาษีศุลกากร ซึ่งรัฐบาลบางครั้งใช้เพื่อส่งอิทธิพลต่อการค้าระหว่างประเทศ ส่งผลต่อราคาภายในประเทศ ปริมาณ รายได้ของรัฐบาล และส่วนเกินของผู้บริโภคและส่วนเกินทางเศรษฐกิจรวม
  • POL-1.B.3 โควตาสามารถใช้เพื่อเปลี่ยนแปลงปริมาณการผลิตและดังนั้นจึงส่งผลต่อราคา ส่วนเกินของผู้บริโภค และส่วนเกินทางเศรษฐกิจรวม
    • ข้อจำกัด: การวาดกราฟของโควตานอกเหนือขอบเขตของหลักสูตรและข้อสอบ AP แต่ความเข้าใจว่าโควตามีผลต่อปริมาณการผลิตอยู่ ضمنขอบเขต

Source: College Board AP Course and Exam Description · ⁨แหล่งที่มา: คำอธิบายหลักสูตรและข้อสอบ College Board AP⁩

English

When a country opens to trade at a world price 世界价格:

  • If the world price is below the domestic price, the country imports 进口 – consumers gain more than producers lose, so total surplus rises.
  • If the world price is above the domestic price, the country exports 出口 – producers gain more than consumers lose.

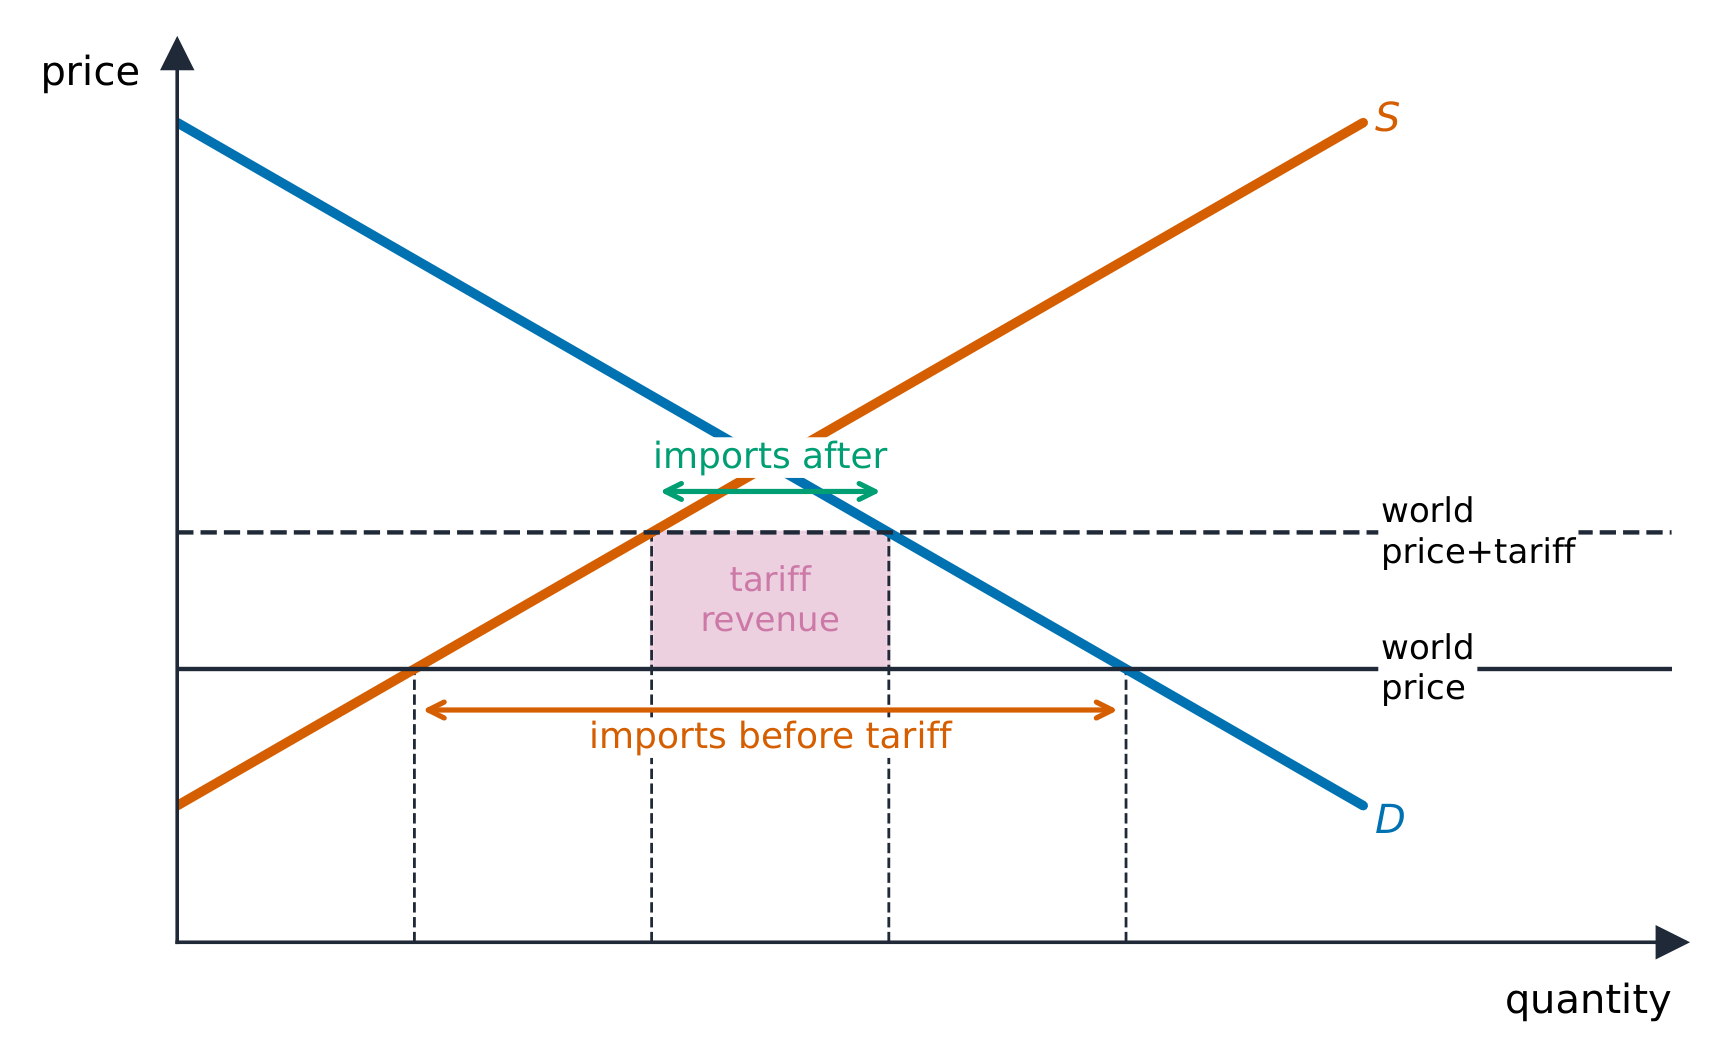
A tariff 关税 (a tax on imports) or a quota 配额 (a limit on imports) raises the domestic price, helps domestic producers, hurts consumers more, and creates deadweight loss. Free trade maximizes total surplus, which is the core efficiency argument for it.

ไทย

当一个国家เปิดการค้าที่ world price:

ภาษีศุลกากรเพิ่มการผลิตภายในประเทศ ลดความต้องการ และลดการนำเข้า
  • ถ้า world price ต่ำกว่า ราคานอกประเทศ ประเทศนั้นจะ import – ผู้บริโภคได้ประโยชน์มากกว่าผู้ผลิตเสีย利益, ดังนั้น total surplus เพิ่มขึ้น
  • ถ้า world price สูงกว่า ราคานอกประเทศ ประเทศนั้นจะ export – ผู้ผลิตได้ประโยชน์มากกว่าผู้บริโภคเสีย利益

Tariff (ภาษีนำเข้า) หรือ quota (โควตาจำกัดการนำเข้า) จะทำให้ราคานอกประเทศสูงขึ้น ช่วยผู้ผลิตภายในประเทศ ทำร้ายผู้บริโภคมากขึ้น และสร้าง deadweight loss. การค้าเสรีเพิ่ม total surplus สูงสุด ซึ่งเป็นข้อโต้แย้งด้านประสิทธิภาพหลักของการค้าเสรี

Vocabulary · ⁨คำศัพท์⁩ Train · ⁨ฝึกฝน⁩
English ไทย
world price/wɜːld praɪs/ ราคาโลก
imports/ɪmˈpɔːts/ การนำเข้า
exports/ˈekspɔːts/ การส่งออก
tariff/ˈtærɪf/ ภาษีศุลกากร
quota/ˈkwəʊtə/ โควตา
2.9

Exam tips · ⁨ข้อแนะนำสำหรับการสอบ⁩

English
  • Separate a movement along a curve (own price) from a shift (a determinant); a single shift gives a definite result, a double shift leaves one variable indeterminate.
  • Compute elasticity $E_d=|\%\Delta Q \div \%\Delta P|$; elastic ($>1$) means a price cut raises total revenue, inelastic ($<1$) lowers it.
  • Read the sign of cross-price elasticity (substitutes $+$, complements $-$) and income elasticity (normal $+$, inferior $-$).
  • Shade consumer/producer surplus and the deadweight loss from a tax or price control; incidence falls on the more inelastic side.
  • A price ceiling below equilibrium causes a shortage; a price floor above causes a surplus.
ไทย
  • แยกแยะ movement along a curve (own price) ออกจาก shift (a determinant); การ shift เดียวให้ผลลัพธ์ที่แน่นอน, การ shift สองครั้งทำให้ตัวแปรหนึ่ง indeterminate
  • คำนวณ elasticity $E_d=|\%\Delta Q \div \%\Delta P|$; elastic ($>1$) หมายความว่าลดราคาเพิ่ม total revenue, inelastic ($<1$) ลดลง
  • อ่านเครื่องหมายของความยืดหยุ่นต่อราคาสัมพันธ์ (substitutes $+$, complements $-$) และความยืดหยุ่นต่อรายได้ (normal $+$, inferior $-$)
  • Shading consumer/producer surplus และ deadweight loss จากภาษีหรือการควบคุมราคา; incidence ตกที่ฝั่งที่ inelastic มากกว่า
  • Price ceiling ต่ำกว่าจุดสมดุลทำให้เกิด shortage; Price floor สูงกว่าทำให้เกิด surplus

Interactive lessons on this topic · ⁨บทเรียนเชิงโต้ตอบสำหรับหัวข้อนี้⁩

Work through it step by step, with instant-check exercises. · ⁨ทำทีละขั้นตอน พร้อมแบบฝึกหัดตรวจสอบผลทันที⁩

Past Papers · ⁨ข้อสอบย้อนหลัง⁩

More topics in AP Microeconomics · ⁨AP เศรษฐศาสตร์จุลภาค⁩ · ⁨หัวข้อเพิ่มเติมใน AP Microeconomics · ⁨AP เศรษฐศาสตร์จุลภาค⁩⁩

Log in or create account · ⁨เข้าสู่ระบบหรือสร้างบัญชี⁩

IGCSE, A-Level & AP