| Enduring Understanding | Learning Objective | Essential Knowledge |
|---|---|---|
MKT-1 | MKT-1.A |
|
Basic Economic Concepts
AP Microeconomics · Topic 1
 8:34
8:34
Basic Economic Concepts
A day has only twenty-four hours. Think what you want to fit into one: sleep, school, homework, sport, time with friends. Add it up honestly and it comes to…
English narration · English + 中文 subtitles burned in
1.1
Scarcity

Syllabus
Source: College Board AP Course and Exam Description
Economics 经济学 begins with one stubborn fact: people's wants are effectively unlimited, but the resources 资源 to satisfy them are limited. This gap is scarcity 稀缺性, and it is why economics exists – if everything were free and endless, there would be nothing to decide.
The resources (the factors of production 生产要素) are land (natural resources), labor 劳动 (human effort), capital 资本 (tools, machines, buildings), and entrepreneurship 企业家才能 (organizing the other three and taking risks). Because these are scarce, every economy must answer three questions: what to produce, how to produce it, and for whom to produce.
Scarcity forces choice, and every choice has an opportunity cost 机会成本 – the value of the next-best alternative you give up. This single idea runs through the whole course: the true cost of anything is what you sacrifice to get it, not just the money you pay.
Example. At constant rates, one worker can pack 30 boxes or deliver 12 orders per hour. One delivery's opportunity cost is $30/12=2.5$ boxes.
Vocabulary
Train
| English |
|---|
| Economics/ˌiːkəˈnɒmɪks/ |
| resources/rɪˈzɔːsɪz/ |
| scarcity/ˈskeəsɪti/ |
| factors of production/ˈfæktəz ɒv prəˈdʌkʃn/ |
| labor/ˈleɪbə/ |
| capital/ˈkæpɪtl/ |
| entrepreneurship/ˌɒntrɪprəˈnjʊəʃɪp/ |
| opportunity cost/ɒpəˈtjuːnɪti kɒst/ |
1.2
Resource Allocation and Economic Systems
Syllabus
| Enduring Understanding | Learning Objective | Essential Knowledge |
|---|---|---|
MKT-1 | MKT-1.B |
|
Source: College Board AP Course and Exam Description
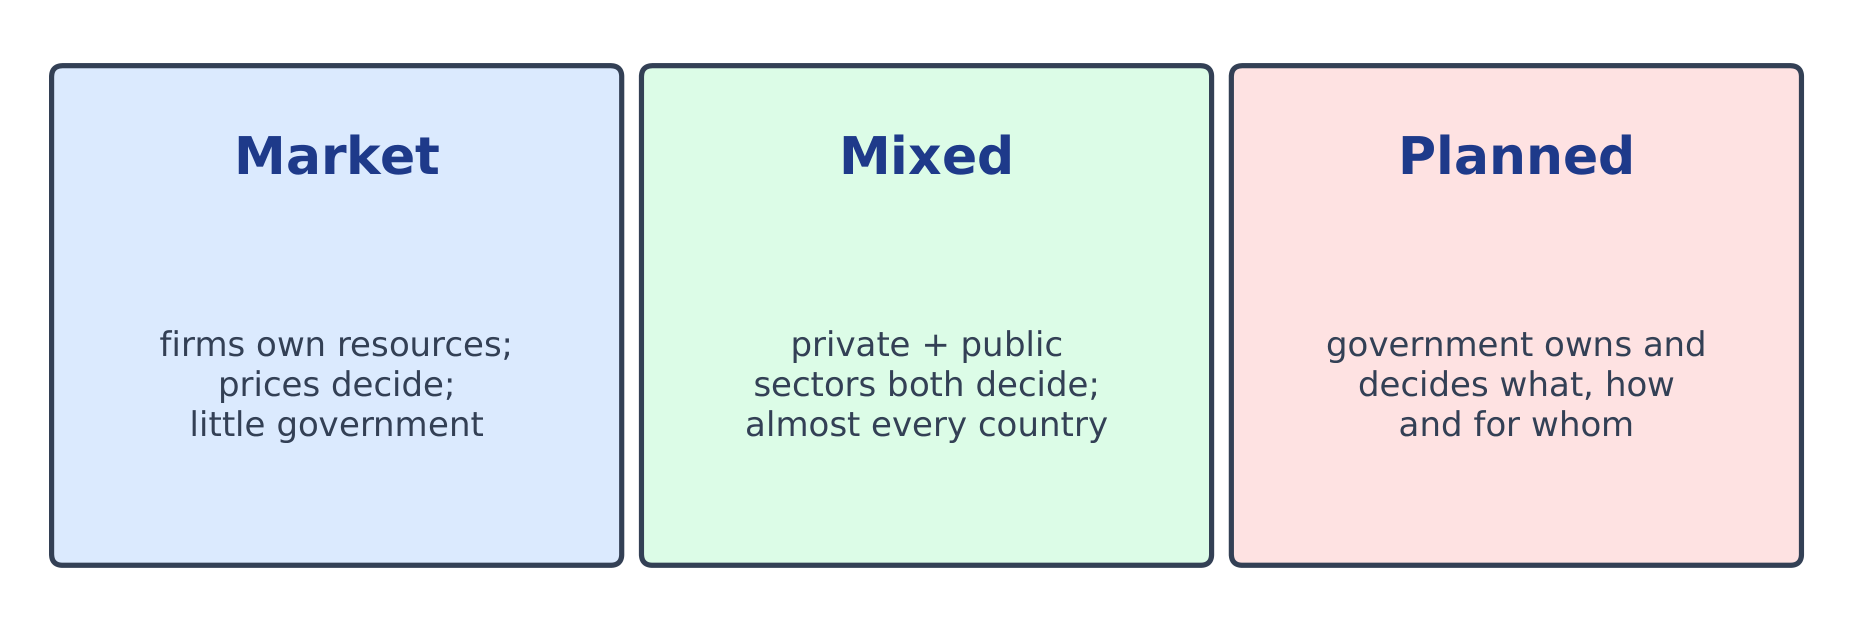
An economic system 经济体制 is a society's way of answering the three questions.
- In a market economy 市场经济, private buyers and sellers decide through prices; self-interest and competition coordinate them (the "invisible hand").
- In a command economy 计划经济, the government owns resources and plans production.
- Real economies are mixed 混合经济 – mostly markets, with government providing some goods and correcting problems.
For example, private canteens choosing menus and families buying at stated prices use a market mechanism. A public agency assigning menus and meals uses a command mechanism. Private sales plus publicly funded meals combine both. These examples illustrate allocation mechanisms, not a whole country's classification.
Prices carry information and incentives 激励. If demand for bread rises, a higher price can encourage a bakery to expand output, holding costs constant. This is not a guarantee of social efficiency: pollution or market power can weaken the outcome.
Explore
Explore how prices coordinate a market
In a market economy no one is in charge, yet the price finds the level where quantity supplied meets quantity demanded. Drag the demand and supply lines and watch the equilibrium price act as a signal and an incentive.
Vocabulary
Train
| English |
|---|
| economic system/ˌiːkəˈnɒmɪk ˈsɪstəm/ |
| market economy/ˈmɑːkɪt ɪˈkɒnəmi/ |
| command economy/kəˈmænd ɪˈkɒnəmi/ |
| mixed/mɪkst/ |
| incentives/ɪnˈsentɪvz/ |
1.3
The Production Possibilities Curve
Syllabus
| Enduring Understanding | Learning Objective | Essential Knowledge |
|---|---|---|
MKT-1 | MKT-1.C |
|
Source: College Board AP Course and Exam Description
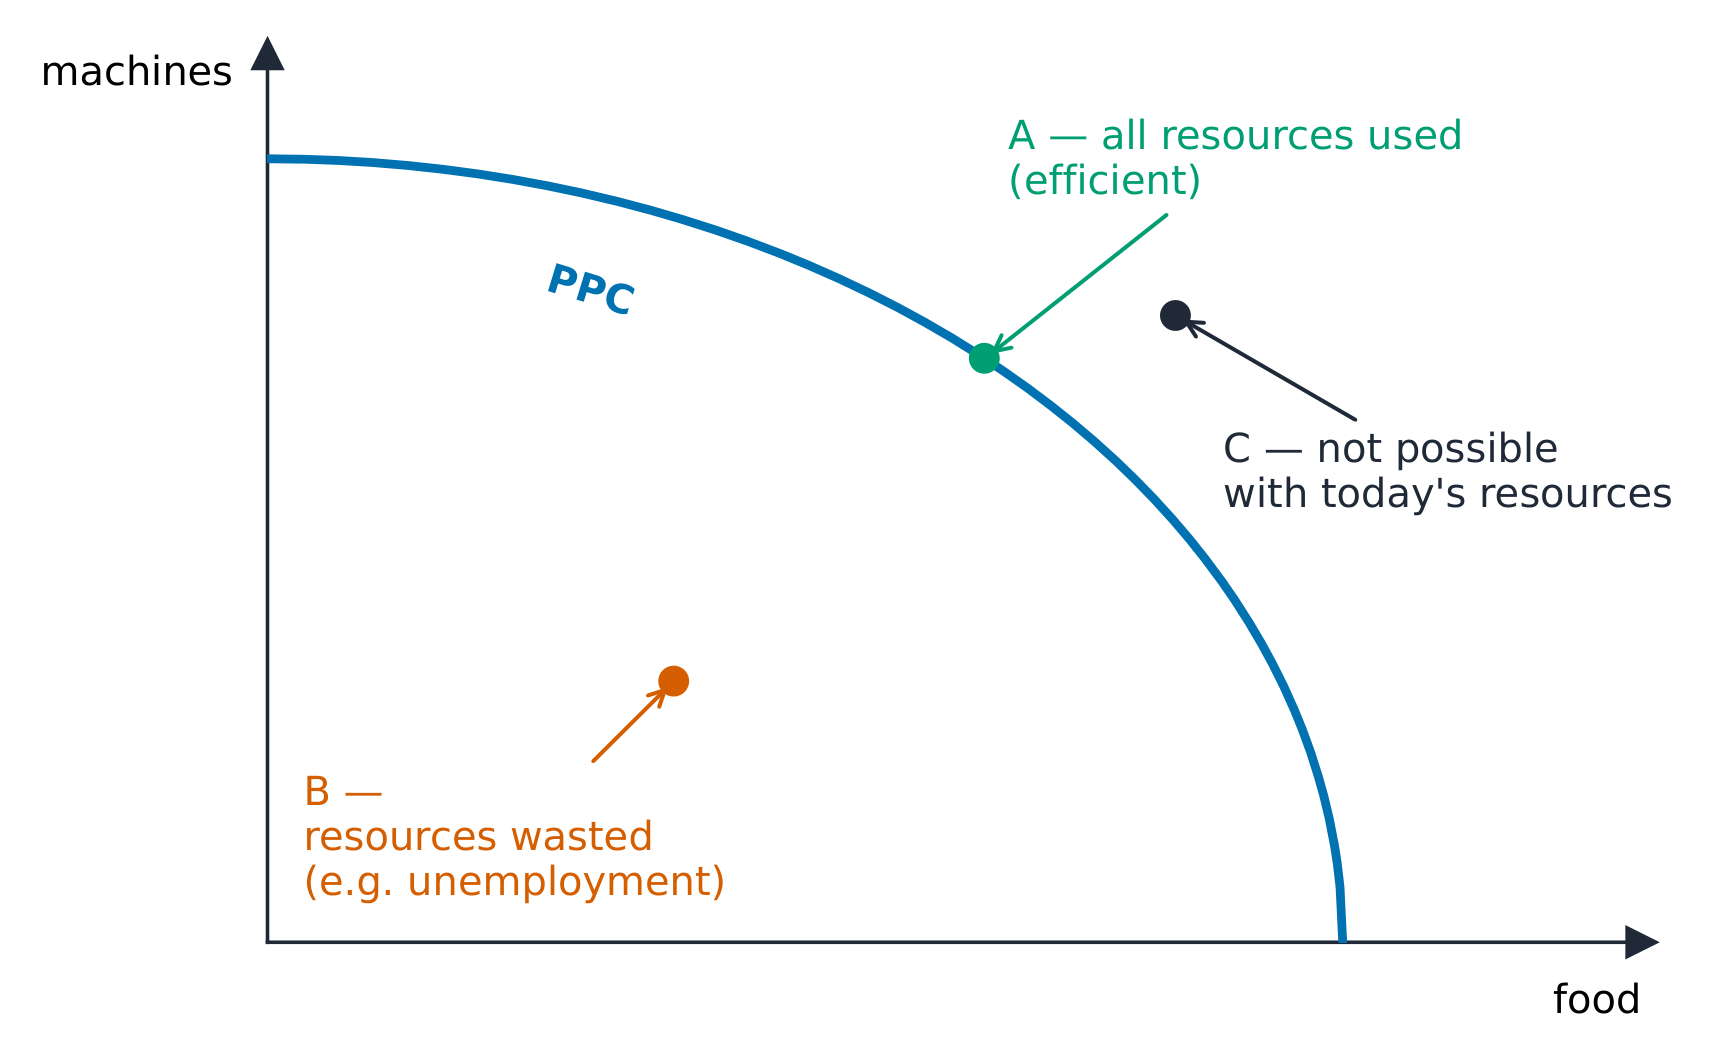
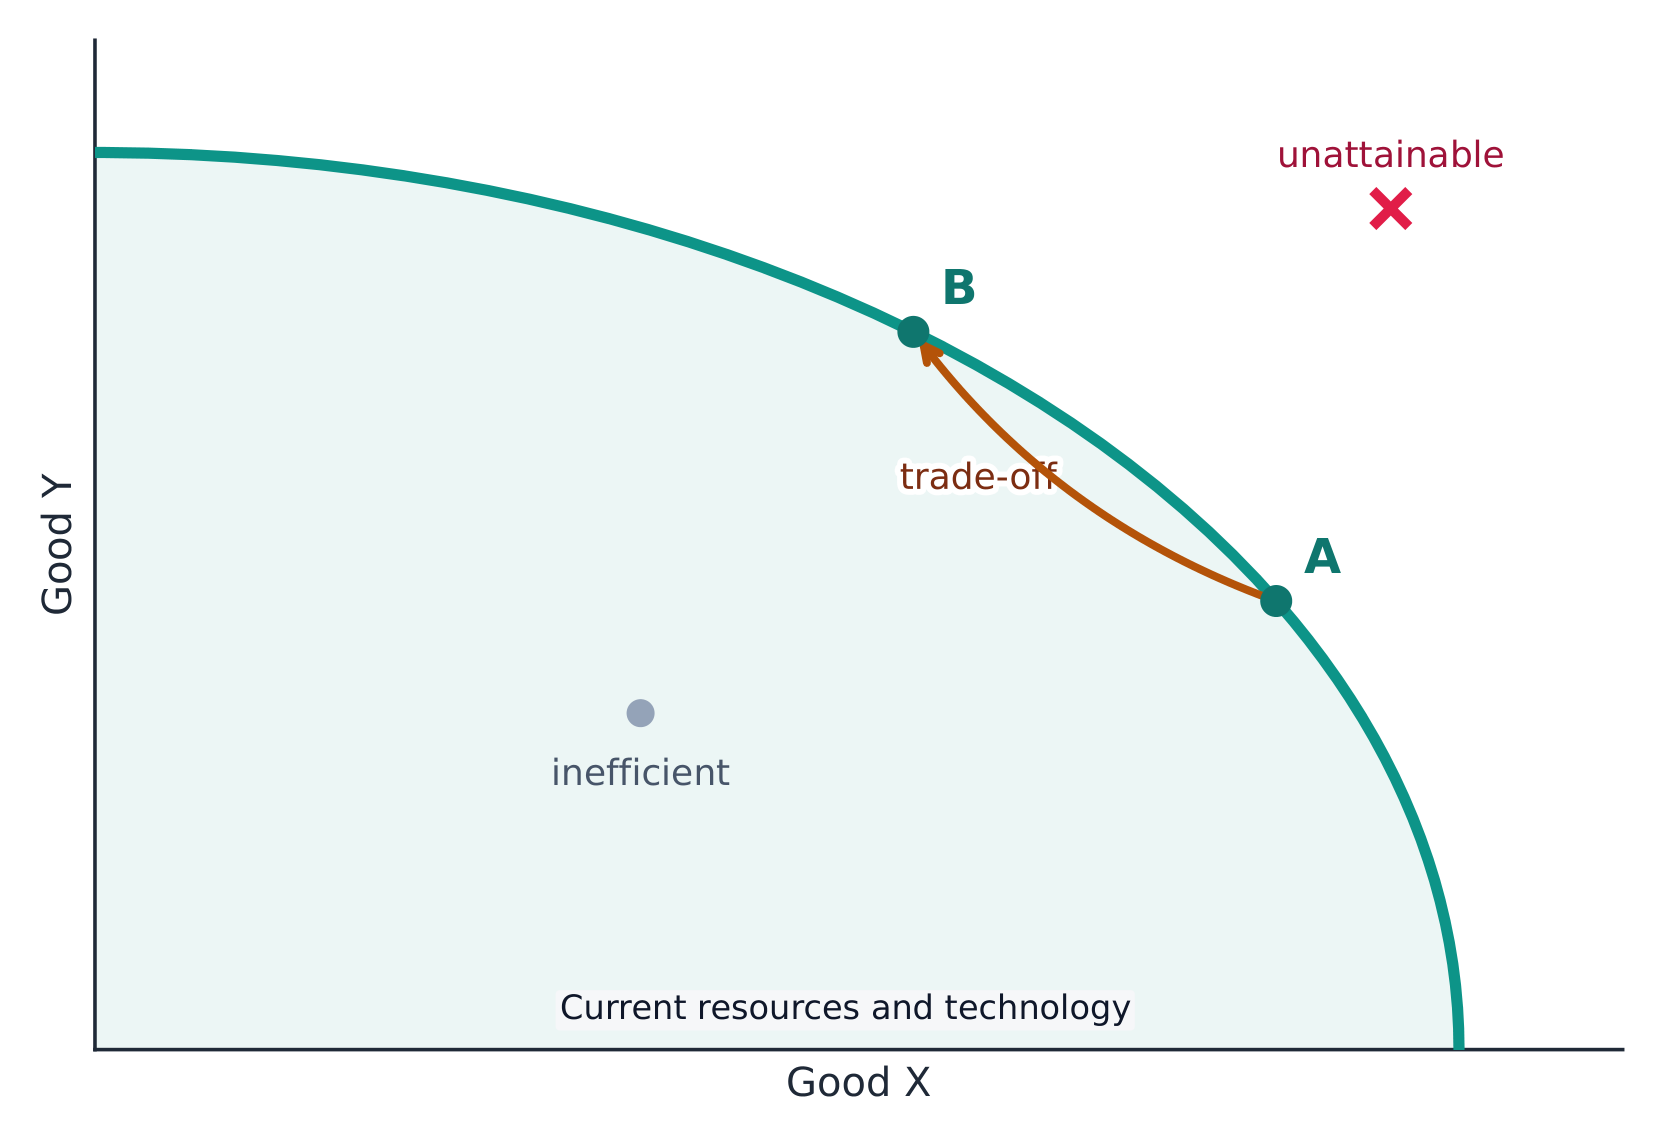
The production possibilities curve (PPC) 生产可能性曲线 shows the maximum combinations of two goods an economy can produce with its resources and technology fully and efficiently used.
- Points on the curve are productively efficient 有效率; points inside are inefficient (wasted or unemployed resources); points outside are currently unattainable 无法实现.
- The PPC's downward slope shows opportunity cost: making more of one good means making less of the other. The magnitude of the slope gives the opportunity cost of the horizontal-axis good in units of the vertical-axis good. A negative slope does not mean a negative opportunity cost.
- A bowed-out (concave) PPC shows increasing opportunity cost – resources are not equally suited to both goods, so making more of one costs ever more of the other. A straight-line PPC means constant opportunity cost; a curve bowed toward the origin represents decreasing opportunity cost.
- Economic growth 经济增长 (more resources, better technology) shifts the frontier outward. A productivity gain in only one industry can pivot the frontier rather than expand both intercepts. Moving from inside to the existing frontier uses idle resources; it does not itself increase capacity.
Worked example. Efficient combinations are A (100 wheat, 0 steel), B (80 wheat, 30 steel), and C (50 wheat, 50 steel). From A to B, steel's opportunity cost is wheat forgone divided by steel gained: $20/30=0.67$ wheat per steel. From B to C it rises to $30/20=1.5$. Resources differ in suitability. Being on the PPC shows productive efficiency, not which mix society prefers.
Explore
Explore the production possibilities curve
Making more of one good means giving up some of the other — that trade-off is the opportunity cost, and the bowed shape shows the law of increasing opportunity cost. Drag along the curve, then grow the economy to push the whole frontier out.
Vocabulary
Train
| English |
|---|
| production possibilities curve (PPC)/prəˈdʌkʃn ˌpɒsəˈbɪlɪtiz kɜːv/ |
| efficient/ɪˈfɪʃənt/ |
| unattainable/ʌnəˈteɪnəbl/ |
| Economic growth/ˌiːkəˈnɒmɪk ɡrəʊθ/ |
1.4
Comparative Advantage and Gains from Trade
Syllabus
| Enduring Understanding | Learning Objective | Essential Knowledge |
|---|---|---|
MKT-2 | MKT-2.A |
|
MKT-2.B |
|
Source: College Board AP Course and Exam Description
Two producers can both gain from trade by specializing 专业化.
- A producer has an absolute advantage 绝对优势 in a good if it can make more of it with the same resources.
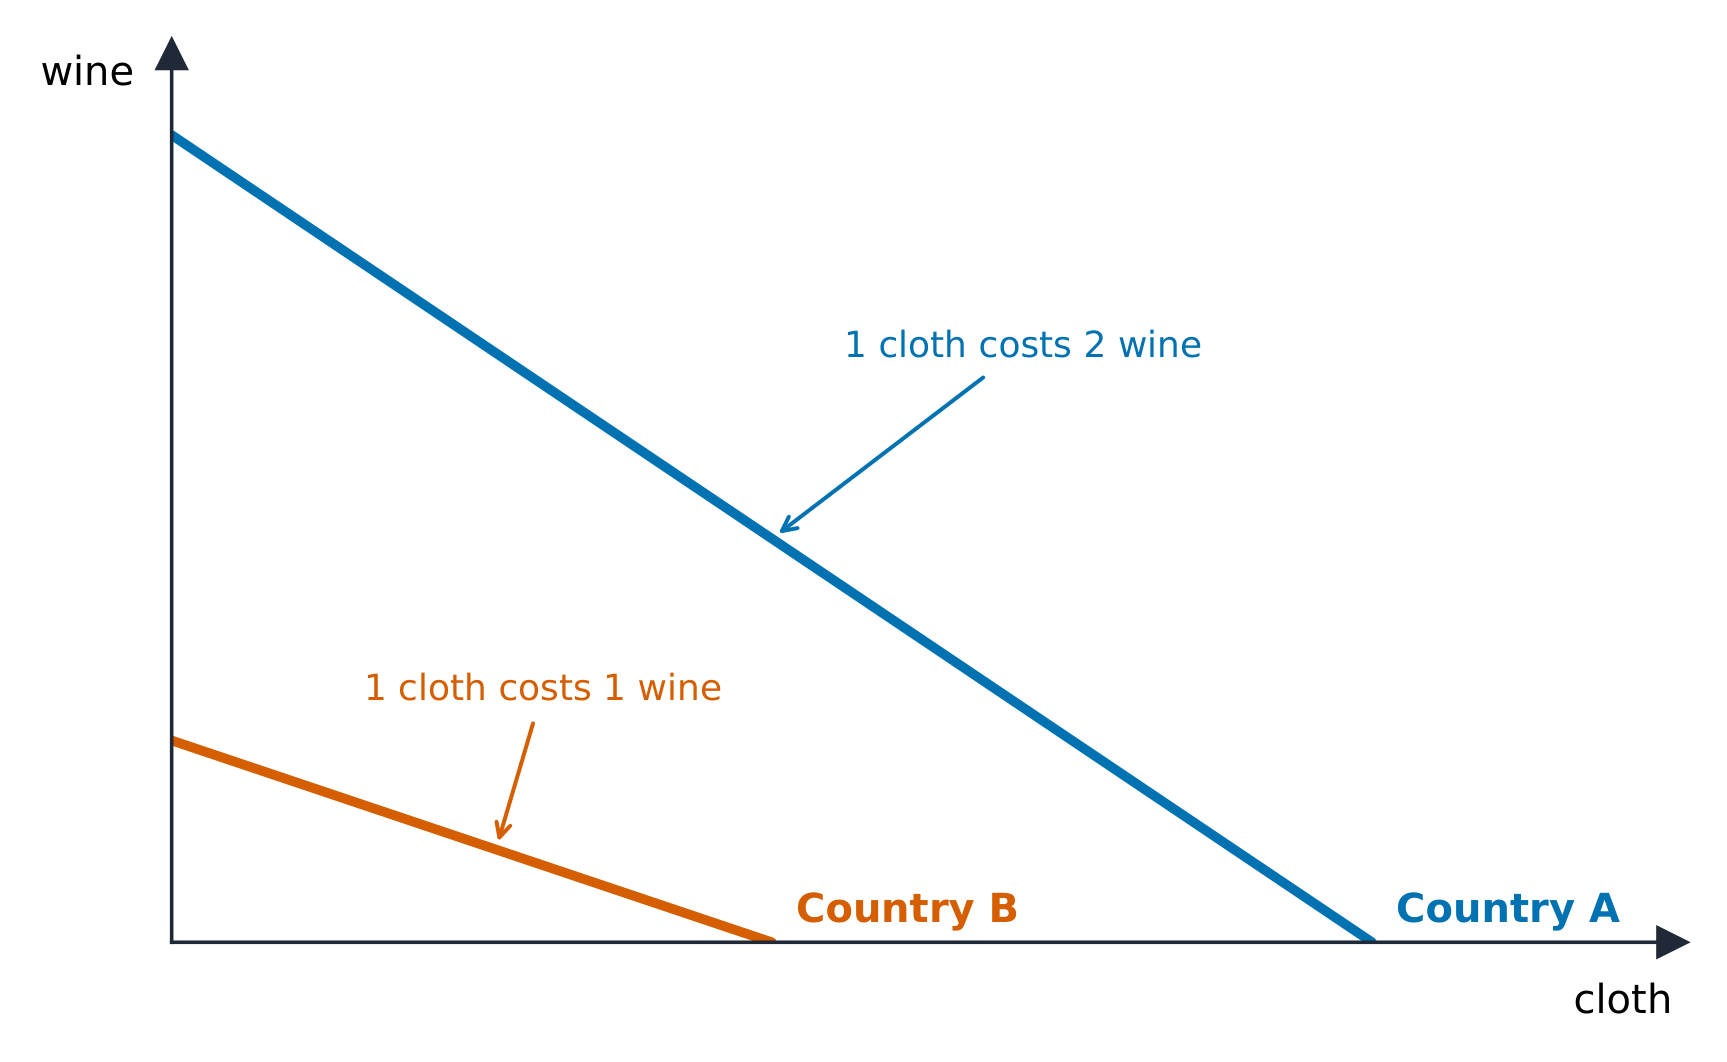
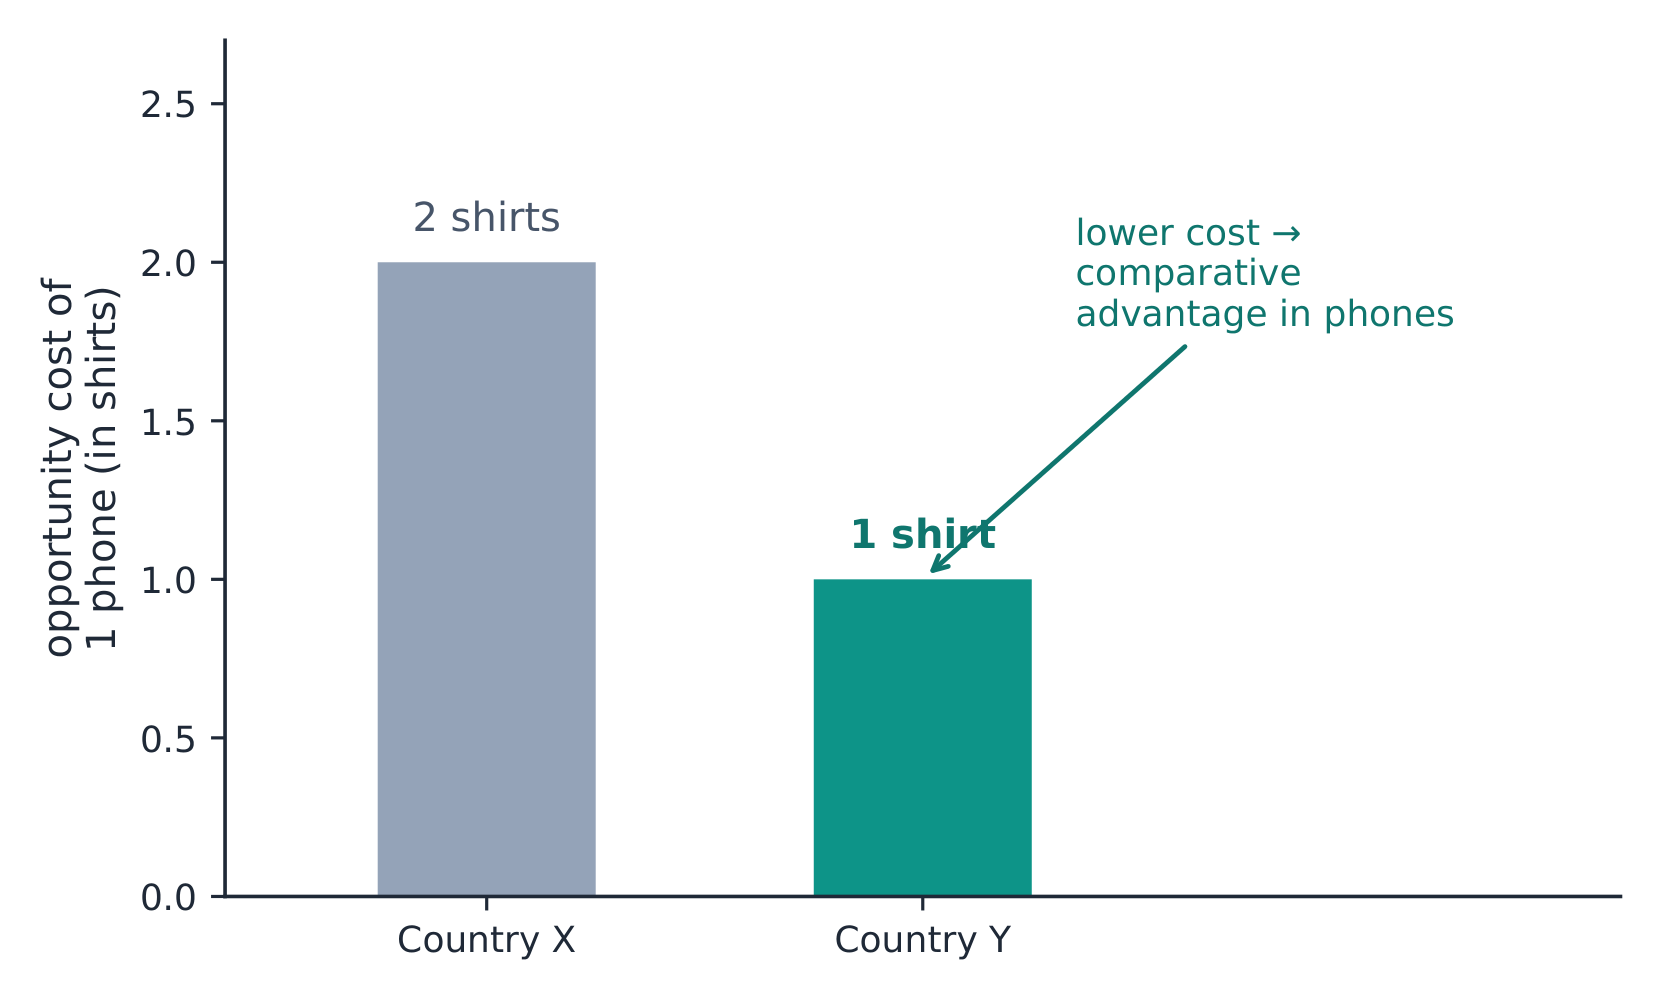
- A producer has a comparative advantage 比较优势 if it has the lower opportunity cost for that good. Comparative advantage – not absolute – determines who should specialize.
- Compute opportunity cost from output data: for each producer, one unit of good X costs (units of Y) $\div$ (units of X). The producer who gives up less Y should make X.
- Both sides gain if they trade at a rate between their two opportunity costs – the terms of trade 贸易条件. With different opportunity costs and suitable terms of trade, specialization can expand consumption possibilities beyond each producer's own PPC. It does not shift that production frontier.
Output-table example. In one day X makes 10 phones or 20 shirts; Y makes 4 phones or 4 shirts. Assume constant opportunity costs. For a phone, X gives up $20/10=2$ shirts; Y gives up $4/4=1$ shirt. Y has comparative advantage in phones, X in shirts, even though X has absolute advantage in both. Trade one phone for 1.5 shirts: X saves 0.5 shirt compared with making the phone, and Y receives 0.5 shirt more than its cost. At an endpoint one producer is indifferent; equal costs leave no strictly beneficial interval in this model.
Input-table example. A needs 2 hours per phone and 1 hour per shirt; B needs 3 hours per phone and 6 hours per shirt. A phone's opportunity cost is hours per phone divided by hours per shirt: A gives up $2/1=2$ shirts, B only $3/6=0.5$. B has comparative advantage in phones although A needs fewer hours for both goods. Do not treat hours as output quantities.
Exam connection (AP 2023 Set 1, Q2a–c). Northland can make 100 bushels of wheat or 300 yards of cloth; Southland 100 or 50. One wheat costs 3 cloth in Northland and 0.5 in Southland. Trading 10 wheat for 20 cloth lies strictly between their costs of 5 and 30 cloth. If Southland's wheat maximum falls to 75 while cloth stays 50, its cloth cost becomes $75/50=1.5$ wheat. Northland's is still $100/300=1/3$, so Southland does not gain comparative advantage in cloth.

Explore
Separate production capacity from consumption
An outward shift represents greater productive capacity. Specialization and trade at suitable terms can expand consumption possibilities without shifting this production frontier; compare the worked opportunity-cost examples.
Vocabulary
Train
| English |
|---|
| specializing/ˈspeʃəlaɪzɪŋ/ |
| absolute advantage/ˈæbsəluːt ədˈvæntɪdʒ/ |
| comparative advantage/kəmˈpærətɪv ədˈvæntɪdʒ/ |
| terms of trade/tɜːmz ɒv treɪd/ |
1.5
Cost-Benefit Analysis
Syllabus
| Enduring Understanding | Learning Objective | Essential Knowledge |
|---|---|---|
CBA-1 | CBA-1.A |
|
CBA-1.B |
|
Source: College Board AP Course and Exam Description
Rational decision-makers weigh benefits against costs. Compare feasible alternatives by net benefit (total benefit minus total cost), including opportunity cost. When a decision has increments, compare the extra benefit and cost of each increment. Money already spent and unrecoverable is a sunk cost 沉没成本 and should be ignored in decisions: only future costs and benefits matter.
Explore
Weigh total benefit against total cost
Compare total revenue with total cost. At break-even they are equal. With price above variable cost per unit, output beyond break-even earns positive profit in this constant-cost model; break-even is not the quantity that maximizes profit.
Vocabulary
Train
| English |
|---|
| sunk cost/sʌŋk kɒst/ |
1.6
Marginal Analysis and Consumer Choice
Syllabus
| Enduring Understanding | Learning Objective | Essential Knowledge |
|---|---|---|
CBA-2 | CBA-2.A |
|
CBA-2.B |
|
Source: College Board AP Course and Exam Description
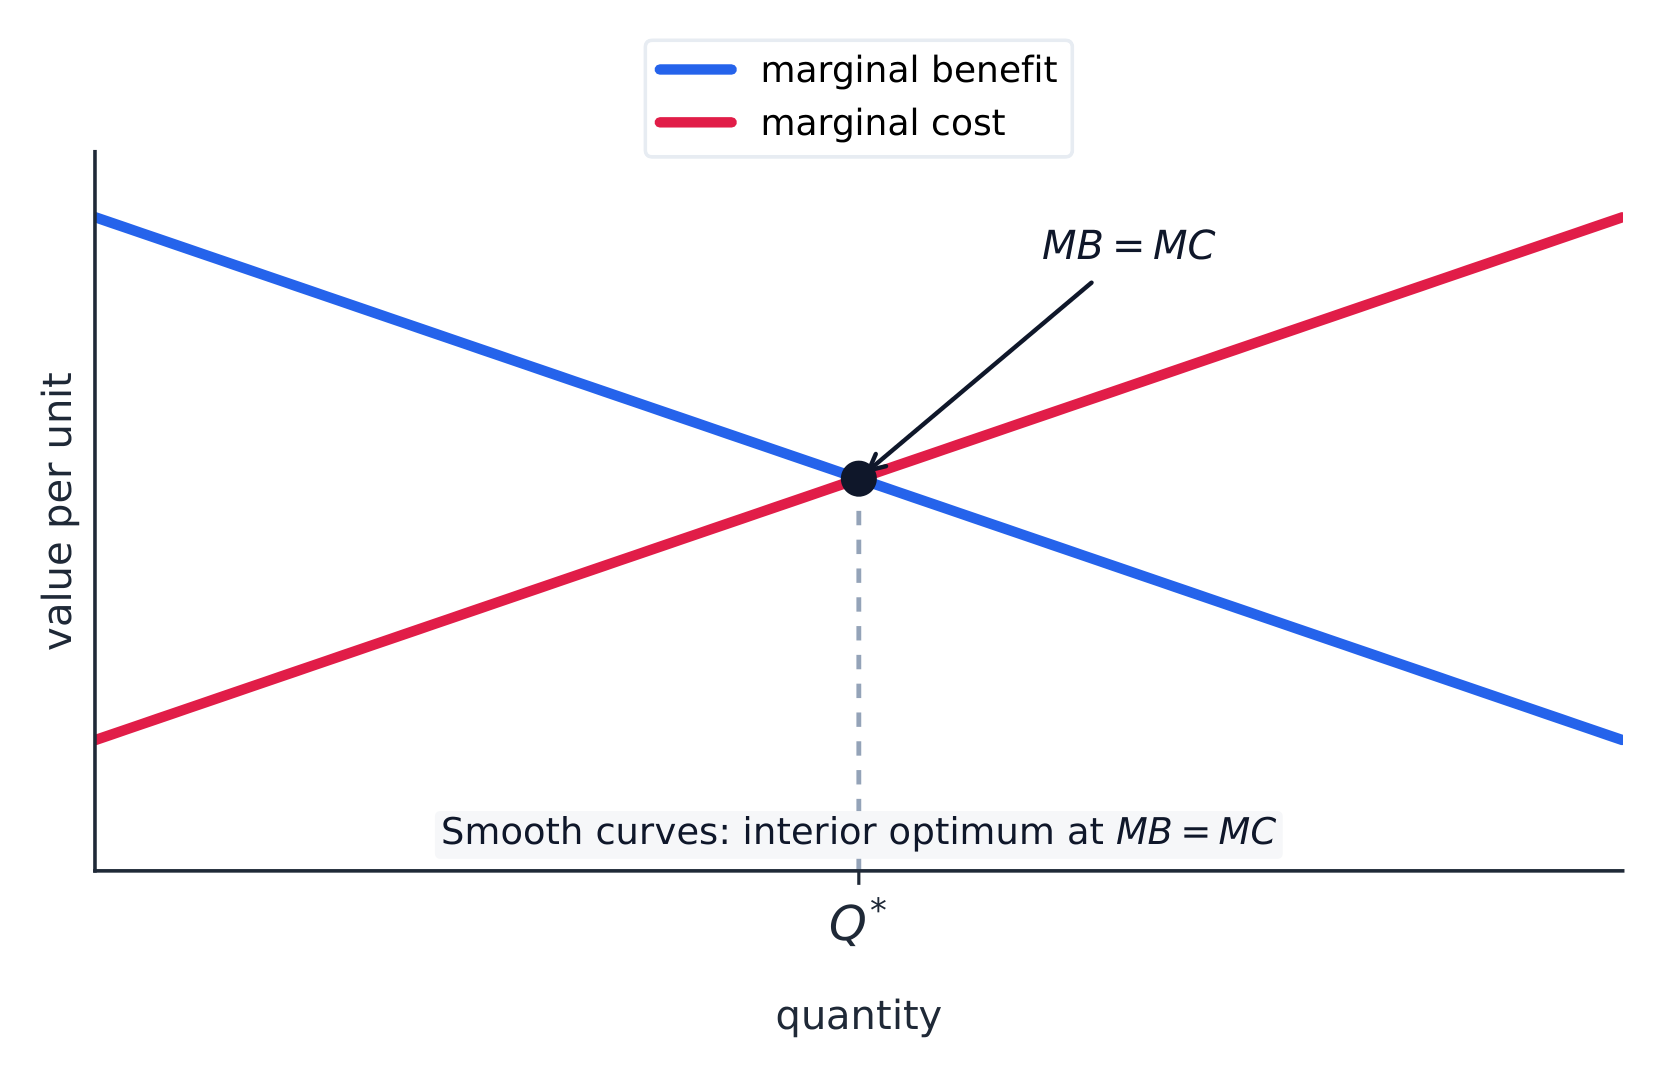
Most real decisions are not "all or nothing" but "a little more or a little less." Marginal analysis 边际分析 compares the marginal benefit 边际收益 (the benefit of one more unit) with the marginal cost 边际成本 (the cost of one more unit).
- Decision rule: add a unit when its marginal benefit exceeds its marginal cost. A feasible interior optimum on smooth curves has MB $=$ MC. Whole-unit tables may have no exact equality: choose the quantity with the greatest net benefit. A unit with equal MB and MC leaves net benefit unchanged.
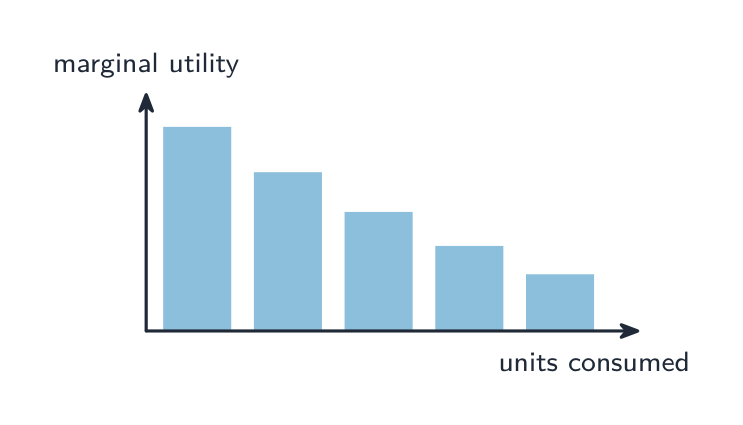
- Consumers get utility 效用 (satisfaction) from goods, but each extra unit usually gives less added satisfaction – the law of diminishing marginal utility 边际效用递减法则.
- A consumer maximizes total utility by the utility-maximizing rule: spend so that the marginal utility per dollar is equal across all goods, $\dfrac{MU_x}{P_x}=\dfrac{MU_y}{P_y}$, subject to the budget. This equality describes a standard interior choice; with whole units, compare feasible combinations because exact equality may be impossible. With positive marginal utility and divisible goods, the budget is spent.
Whole-unit example. Four units give marginal benefits of 12, 9, 6 and 3 dollars; each costs 5 dollars. Their extra net benefits are 7, 4, 1 and -2 dollars. Cumulative net benefits are 7, 11, 12 and 10 dollars. Choose three units: the fourth reduces net benefit, although no row has MB = MC.
| Unit | X | Y |
|---|---|---|
| 1 | 20 | 28 |
| 2 | 16 | 24 |
| 3 | 12 | 16 |
| 4 | 8 | 8 |
| 5 | 4 | -4 |
| 6 | -2 | -8 |
Consumer example (AP 2025 Set 2, Q3A–C). The table gives Lucy's marginal utility in utils. If both goods are free, choose 5 X and 4 Y: the next units add negative utility. Total utility from 2 X and 2 Y is $(20+16)+(28+24)=88$ utils.
If X costs $2, Y $4, and the budget is $20, buying 2 X leaves $16 for 4 Y. The optimal combination is instead 4 X and 3 Y. The last units give $8/2=4$ and $16/4=4$ utils per dollar, and spending is $2(4)+4(3)=20$ dollars. Total utility is $56+68=124$ utils. Replacing two X with one Y loses $12+8=20$ utils and gains only 8. Replacing one Y with two X loses 16 and gains only $4-2=2$. Compare both marginal ratios and the budget.
Vocabulary
Train
| English |
|---|
| Marginal analysis/ˈmɑːdʒɪnl əˈnæləsɪs/ |
| marginal benefit/ˈmɑːdʒɪnl ˈbenɪfɪt/ |
| marginal cost/ˈmɑːdʒɪnl kɒst/ |
| utility/juːˈtɪlɪti/ |
| law of diminishing marginal utility/lɔː ɒv dɪˈmɪnɪʃɪŋ ˈmɑːdʒɪnl juːˈtɪlɪti/ |
1.6
Exam tips
State the opportunity-cost units and compare both producers. Give a specific trade rate strictly between their costs. For consumer choice, check the budget and the last units bought. For marginal decisions, compare feasible net benefits; exact equality need not occur in a table.
Interactive lessons on this topic
Work through it step by step, with instant-check exercises.