Enduring Understanding (MOD-1): The production possibilities curve (PPC) model is used to demonstrate the full employment level of output and to illustrate changes in full employment.
Learning Objective MOD-1.A: Define scarcity and economic resources.
MOD-1.A.1 Individuals and societies are forced to make choices because most resources are scarce.
Source: College Board AP Course and Exam Description · แหล่งที่มา: คำอธิบายหลักสูตรและข้อสอบ College Board AP
English
Economics 经济学 begins with scarcity 稀缺性: people's wants are unlimited, but the resources 资源 to satisfy them are limited. The resources – the factors of production 生产要素 – are land, labor 劳动, capital 资本, and entrepreneurship 企业家才能. Scarcity forces every society to choose what, how, and for whom to produce, and it makes trade-offs 权衡 unavoidable.
production possibilities curve (PPC)/prəˈdʌkʃn ˌpɒsəˈbɪlɪtiz kɜːv/
เส้นโค้งความเป็นไปได้ในการผลิต (PPC)
economic growth/ˌiːkəˈnɒmɪk ɡrəʊθ/
การเติบโตทางเศรษฐกิจ
absolute advantage/ˈæbsəluːt ədˈvæntɪdʒ/
ข้อได้เปรียบสัมบูรณ์
1.2
Opportunity Cost and the Production Possibilities Curve (PPC) · ต้นทุนทางเลือกและเส้นโค้งความสามารถในการผลิต (PPC)
Syllabus · หลักสูตร
English
Enduring Understanding (MOD-1): The production possibilities curve (PPC) model is used to demonstrate the full employment level of output and to illustrate changes in full employment.
Learning Objective MOD-1.B:
a. Define (using graphs as appropriate) the PPC and related terms.
b. Explain (using graphs as appropriate) how the PPC illustrates opportunity costs, tradeoffs, inefficiency, efficiency, and economic growth or contraction under various conditions.
c. Calculate (using data from PPCs or tables as appropriate) opportunity cost.
MOD-1.B.1 The PPC is a model used to show the tradeoffs associated with allocating resources.
MOD-1.B.2 The PPC can be used to illustrate the concepts of scarcity, opportunity cost, efficiency, underutilized resources, and economic growth or contraction.
MOD-1.B.3 The shape of the PPC depends on whether opportunity costs are constant, increasing, or decreasing.
MOD-1.B.4 The PPC can shift because of changes in factors of production as well as changes in productivity/technology.
MOD-1.B.5 Economic growth results in an outward shift of the PPC.
Source: College Board AP Course and Exam Description · แหล่งที่มา: คำอธิบายหลักสูตรและข้อสอบ College Board AP
English
The production possibility frontier
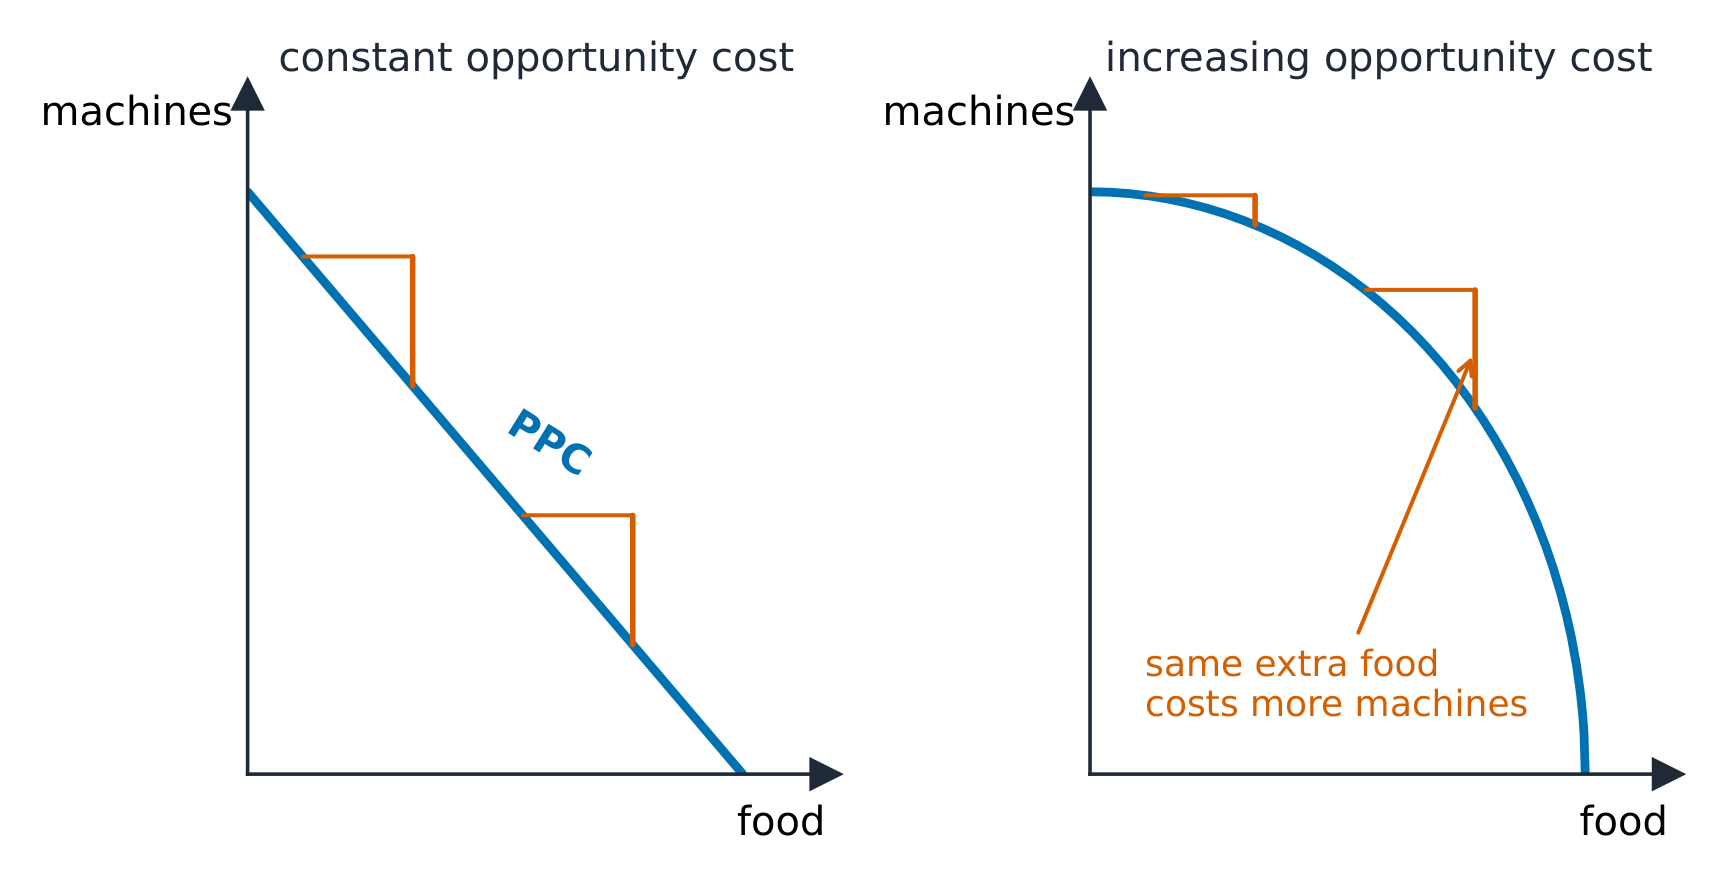
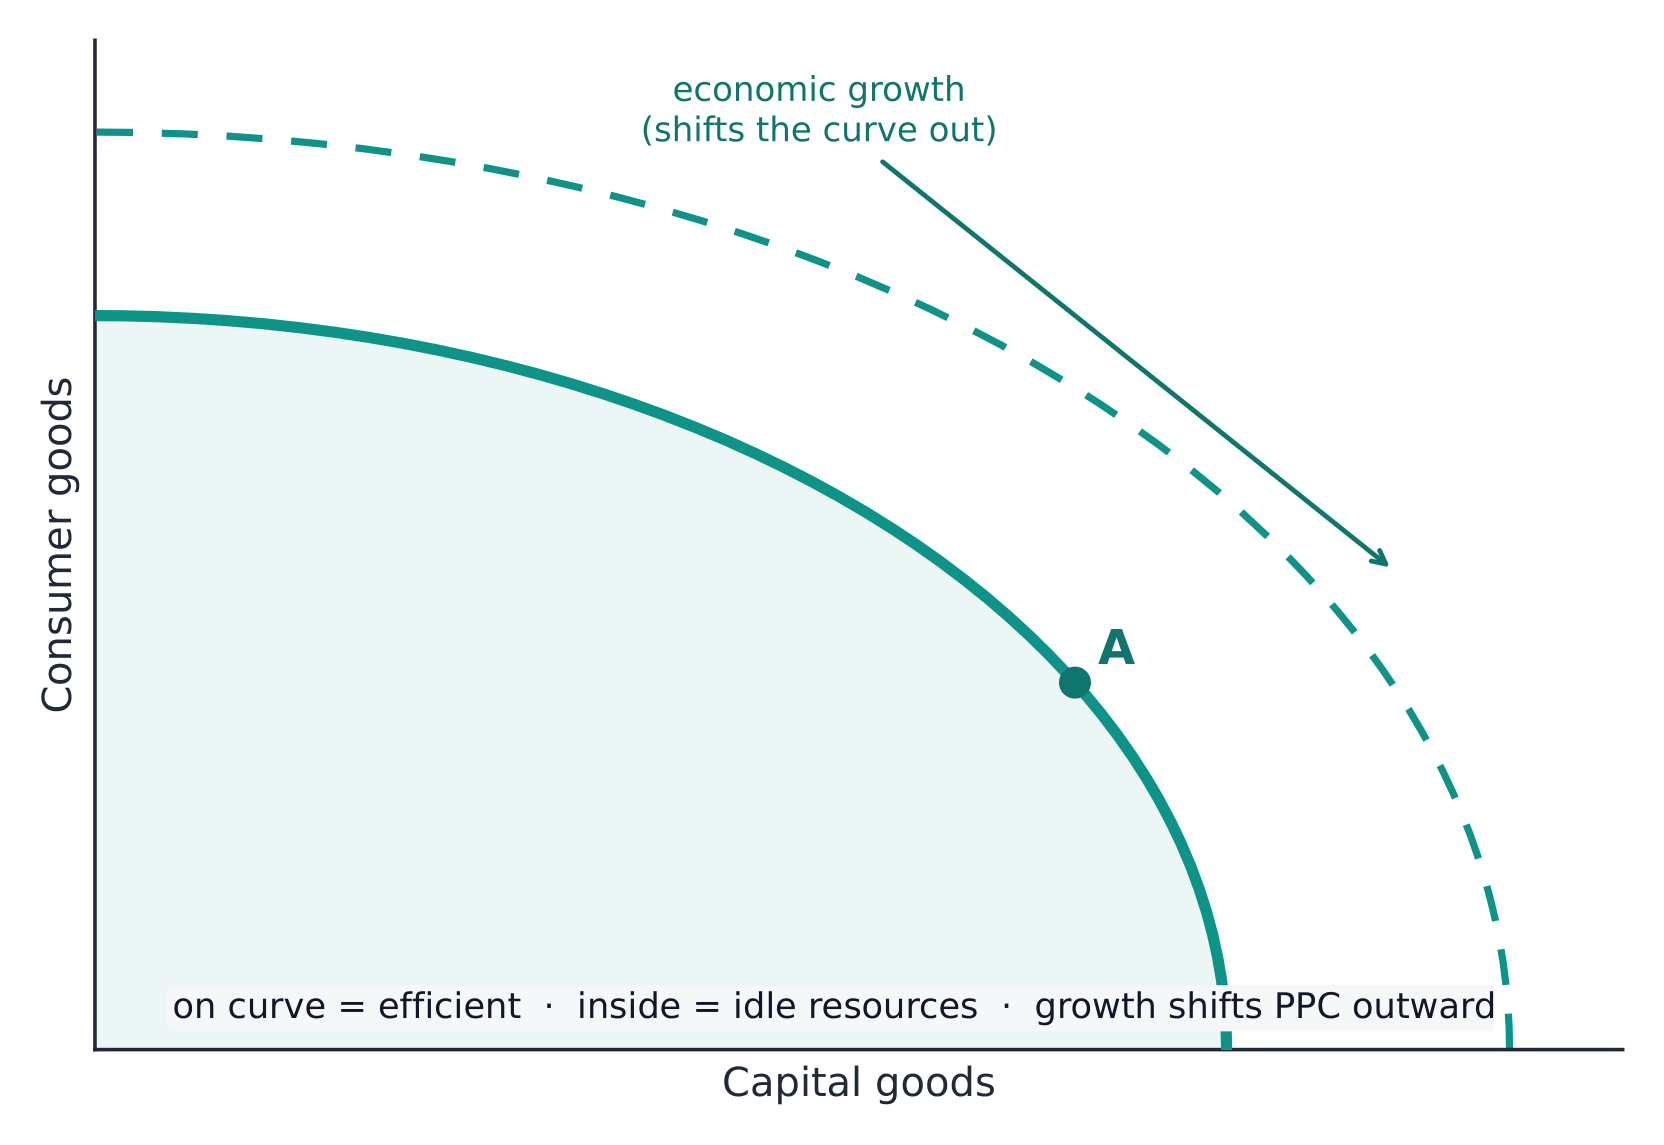
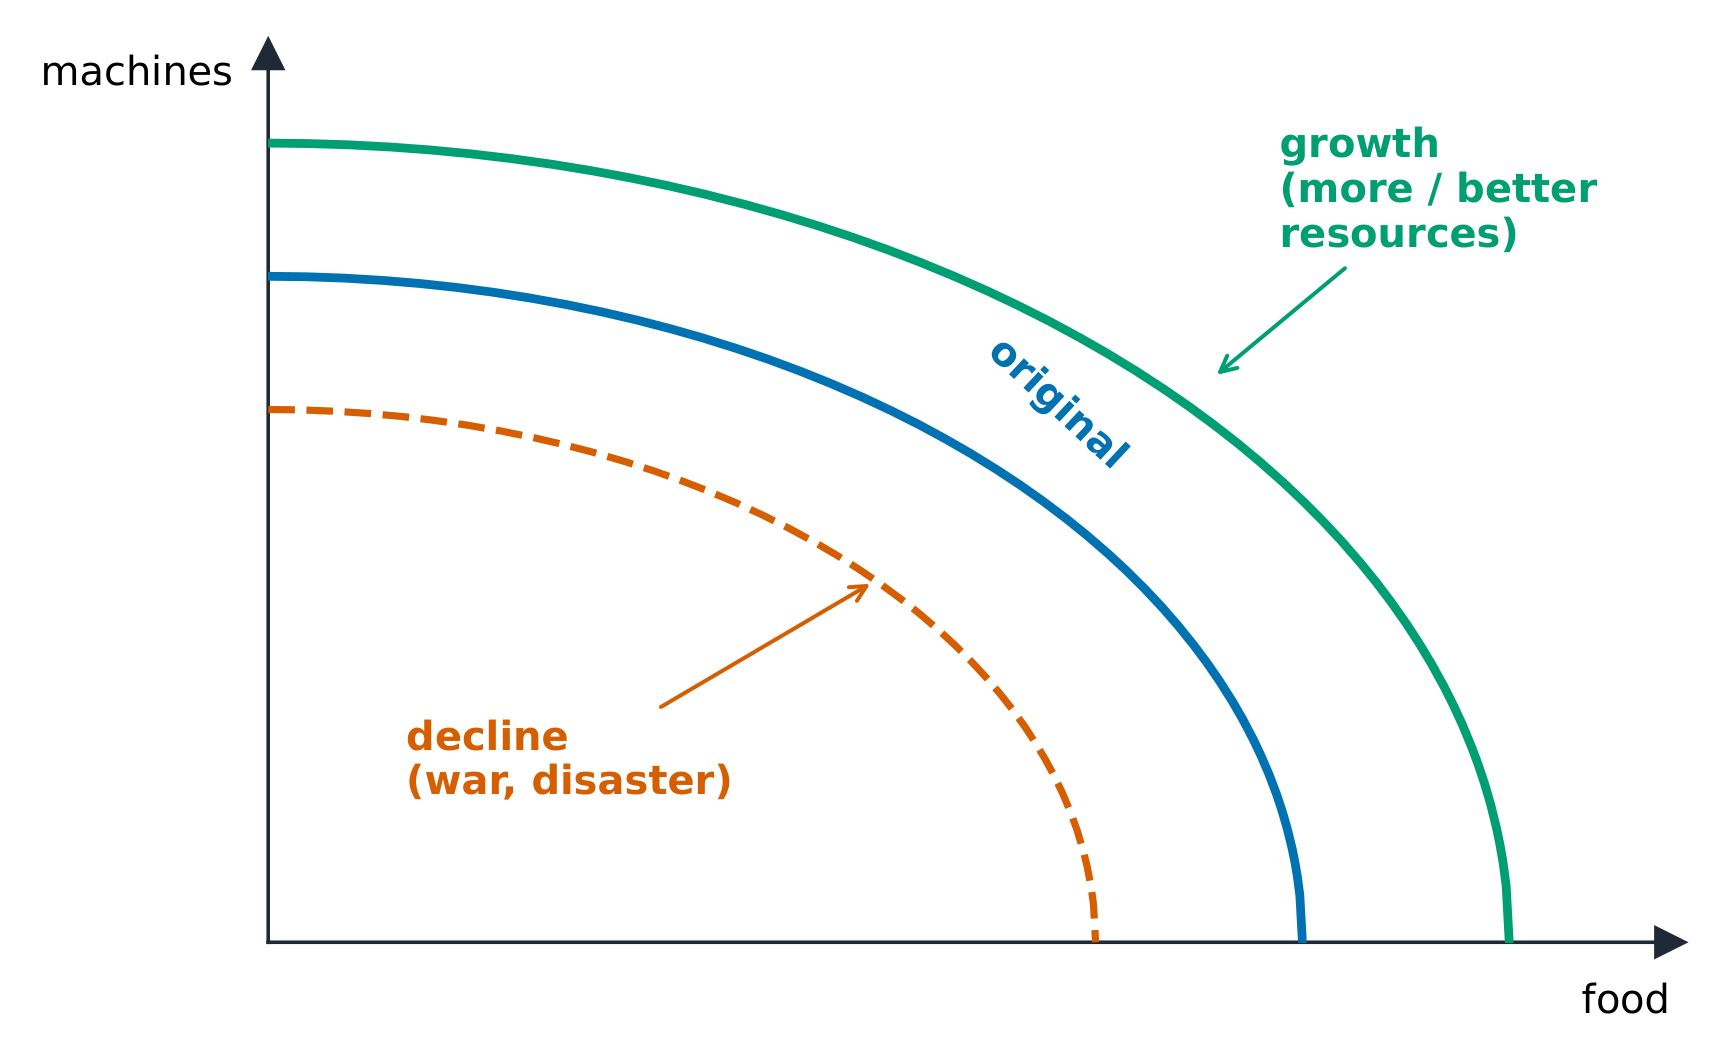
Every choice has an opportunity cost 机会成本 – the value of the next-best alternative given up. The production possibilities curve (PPC) 生产可能性曲线 shows the maximum combinations of two goods an economy can make when resources are fully and efficiently used.
Points on the curve are efficient; inside, inefficient (unemployed resources); outside, unattainable.
The downward slope shows opportunity cost; a bowed-out curve shows increasing opportunity cost.
More resources or better technology cause economic growth 经济增长, shifting the PPC outward.
Move along the curve — making more capital goods means giving up consumer goods. That lost output is the opportunity cost, and the bowed shape shows it rising with each extra unit. · เคลื่อนที่ไปตามเส้นโค้ง — การผลิต สินค้าทุน ที่มากขึ้นหมายถึงการสละ สินค้าอุปโภคบริโภค ผลผลิตรวมที่สูญเสียไป คือโอกาสต้นทุน และรูปร่างโค้งที่นูนขึ้นแสดงว่าสิ่งนี้ เพิ่มขึ้น เมื่อเพิ่มหน่วยการผลิตหนึ่งหน่วย
1.3
Comparative Advantage and Gains from Trade · ความได้เปรียบสัมพัทธ์และประโยชน์จากการค้า
Syllabus · หลักสูตร
English
Enduring Understanding (MKT-1): Production and consumption increase by engaging in trade.
Learning Objective MKT-1.A:
a. Define absolute advantage and comparative advantage.
b. Determine (using data from PPCs or tables as appropriate) absolute and comparative advantage.
MKT-1.A.1 Absolute advantage describes a situation in which an individual, business, or country can produce more of a good or service than any other producer with the same quantity of resources.
MKT-1.A.2 Comparative advantage describes a situation in which an individual, business, or country can produce a good or service at a lower opportunity cost than another producer.
Learning Objective MKT-1.B:
a. Explain (using data from PPCs or tables as appropriate) how specialization according to comparative advantage with appropriate terms of trade can lead to gains from trade.
b. Calculate (using data from PPCs or tables as appropriate) mutually beneficial terms of trade.
MKT-1.B.1 Production specialization according to comparative advantage results in exchange opportunities that lead to consumption opportunities beyond the PPC.
MKT-1.B.2 Comparative advantage and opportunity costs determine the terms of trade for exchange under which mutually beneficial trade can occur.
Source: College Board AP Course and Exam Description · แหล่งที่มา: คำอธิบายหลักสูตรและข้อสอบ College Board AP
English
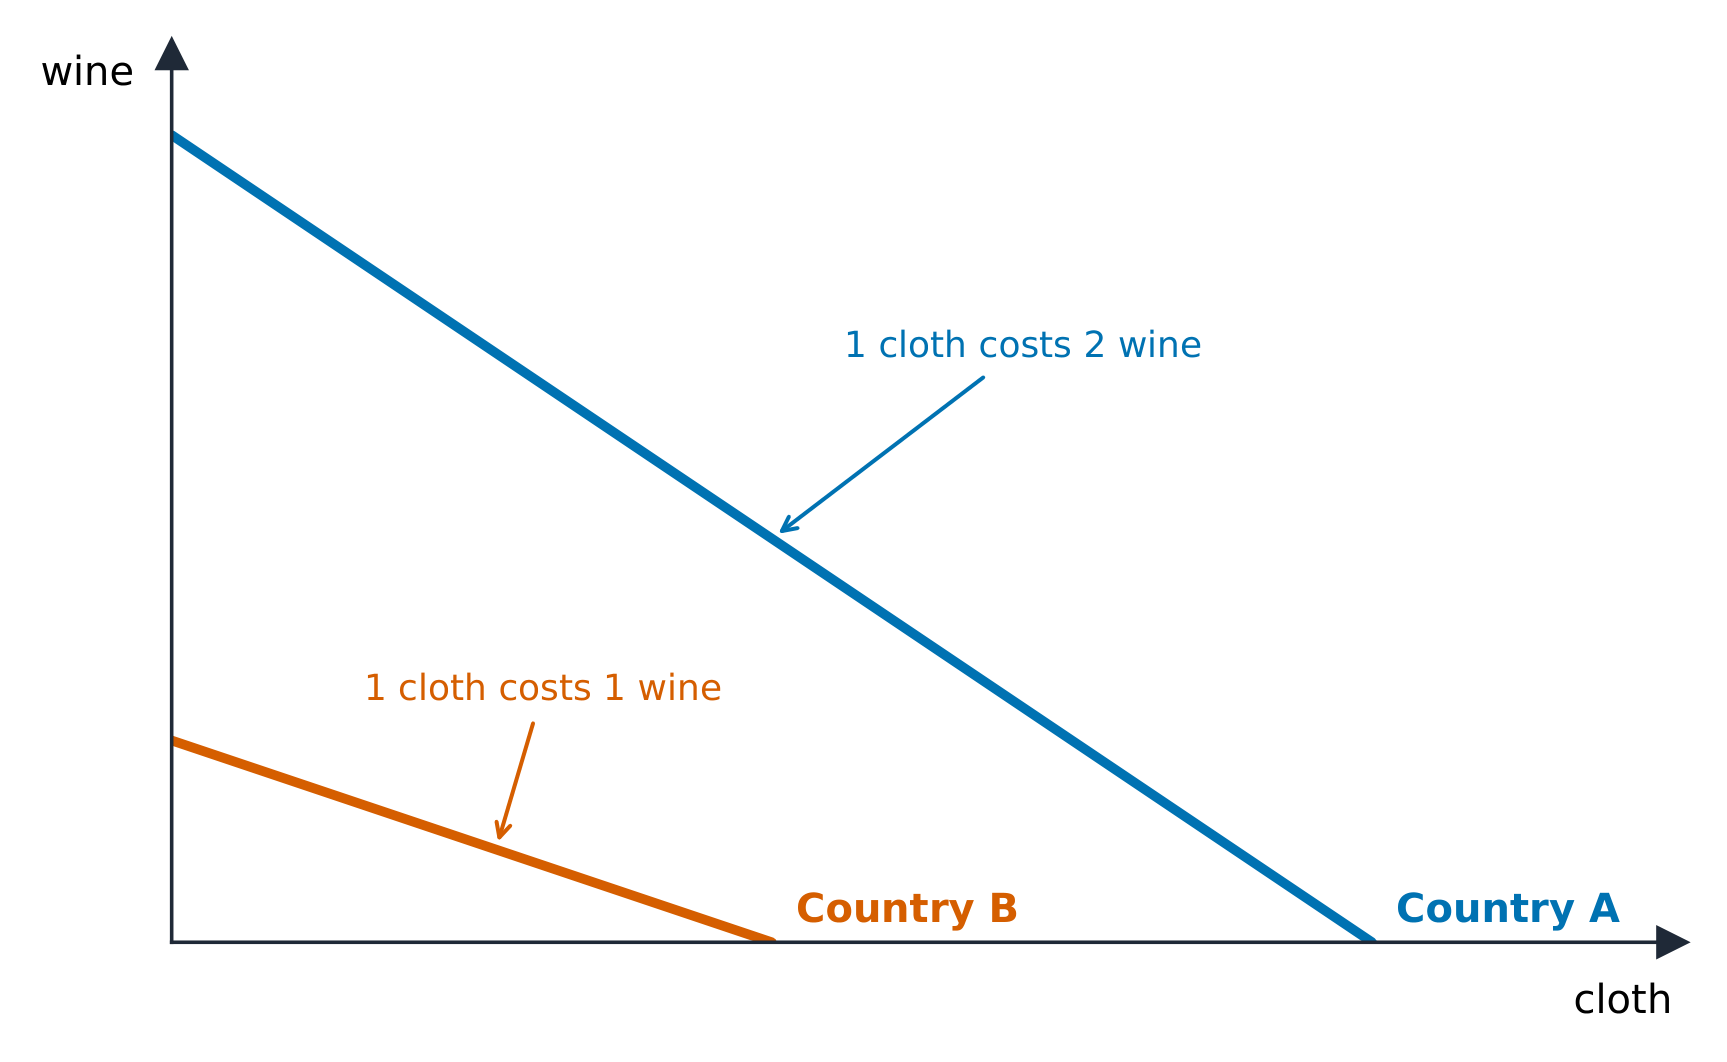
A producer has an absolute advantage 绝对优势 in a good if it can make more of it. It has a comparative advantage 比较优势 if it has the lower opportunity cost. Nations should specialize in their comparative-advantage goods and trade – both gain if the terms of trade 贸易条件 lie between the two opportunity costs. Trade lets a country consume beyond its own PPC.
Worked example. Country A can make $10$ wheat or$5$ cloth per day; Country B can make $8$ wheat or$8$ cloth. For A, one cloth costs $\tfrac{10}{5}=2$ wheat; for B it costs $\tfrac{8}{8}=1$ wheat. B's opportunity cost of cloth is lower, so B specializes in cloth. Checking wheat: A gives up $0.5$ cloth per wheat and B gives up $1$, so A specializes in wheat. Trading at any rate between the two costs, both consume beyond their own PPC.
See the gains from specialization and trade · เห็นประโยชน์จากการแบ่งงานเฉพาะด้านและการค้า
A country should specialize where its opportunity cost is lowest, then trade for the rest. Because the terms of trade sit between the two countries' costs, each can consume beyond its own production frontier. · ประเทศควรแบ่งงานเฉพาะด้านที่ โอกาสต้นทุน ต่ำที่สุด แล้วซื้อขายส่วนที่เหลือ เนื่องจากอัตราแลกเปลี่ยนอยู่ระหว่างต้นทุนของประเทศทั้งสอง ทุกประเทศจึงสามารถบริโภค เกินกว่า ขอบเขตการผลิตของตนเองได้
Enduring Understanding (MKT-2): In a competitive market, demand for and supply of a good or service determine the equilibrium price.
Learning Objective MKT-2.A:
a. Define (using graphs as appropriate) the law of demand.
b. Explain (using graphs as appropriate) the relationship between the price of a good or service and the quantity demanded.
MKT-2.A.1 The law of demand states there is an inverse relationship between price and quantity demanded, leading to a downward-sloping demand curve.
Learning Objective MKT-2.B: Explain (using graphs as appropriate) the determinants of demand.
MKT-2.B.1 Factors that influence consumer demand, such as changes in consumer income, cause the market demand curve to shift.
Source: College Board AP Course and Exam Description · แหล่งที่มา: คำอธิบายหลักสูตรและข้อสอบ College Board AP
English
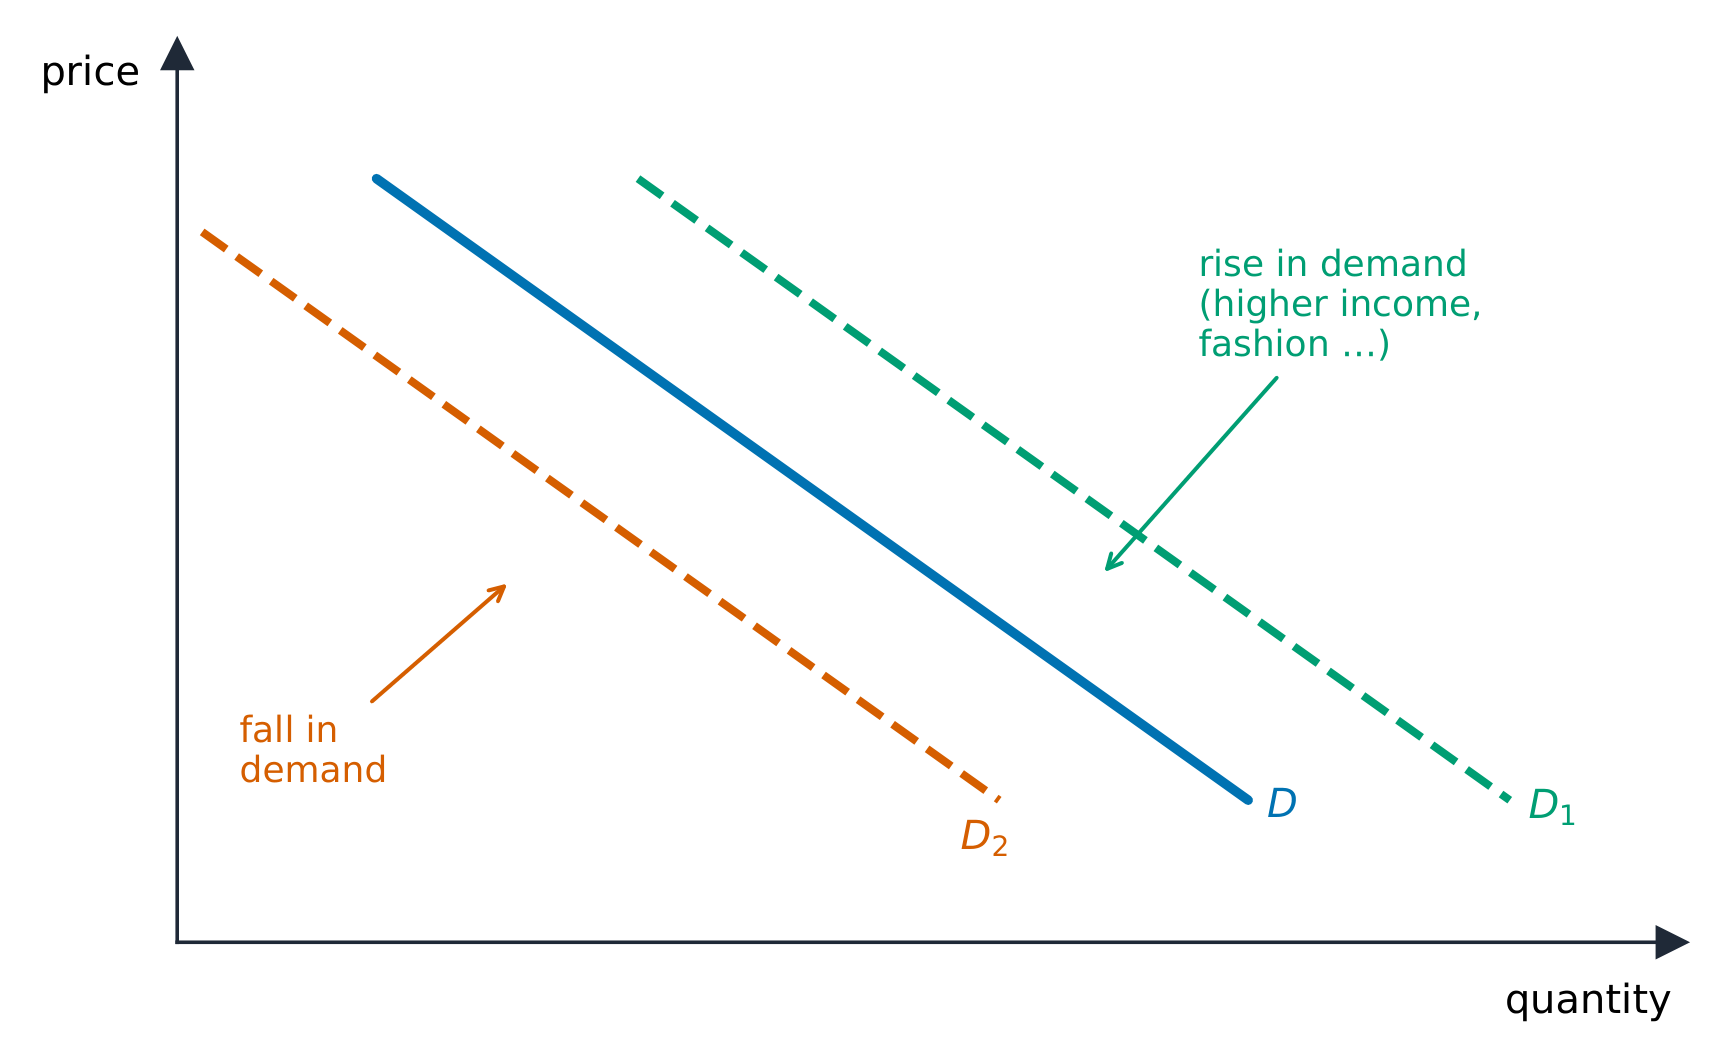
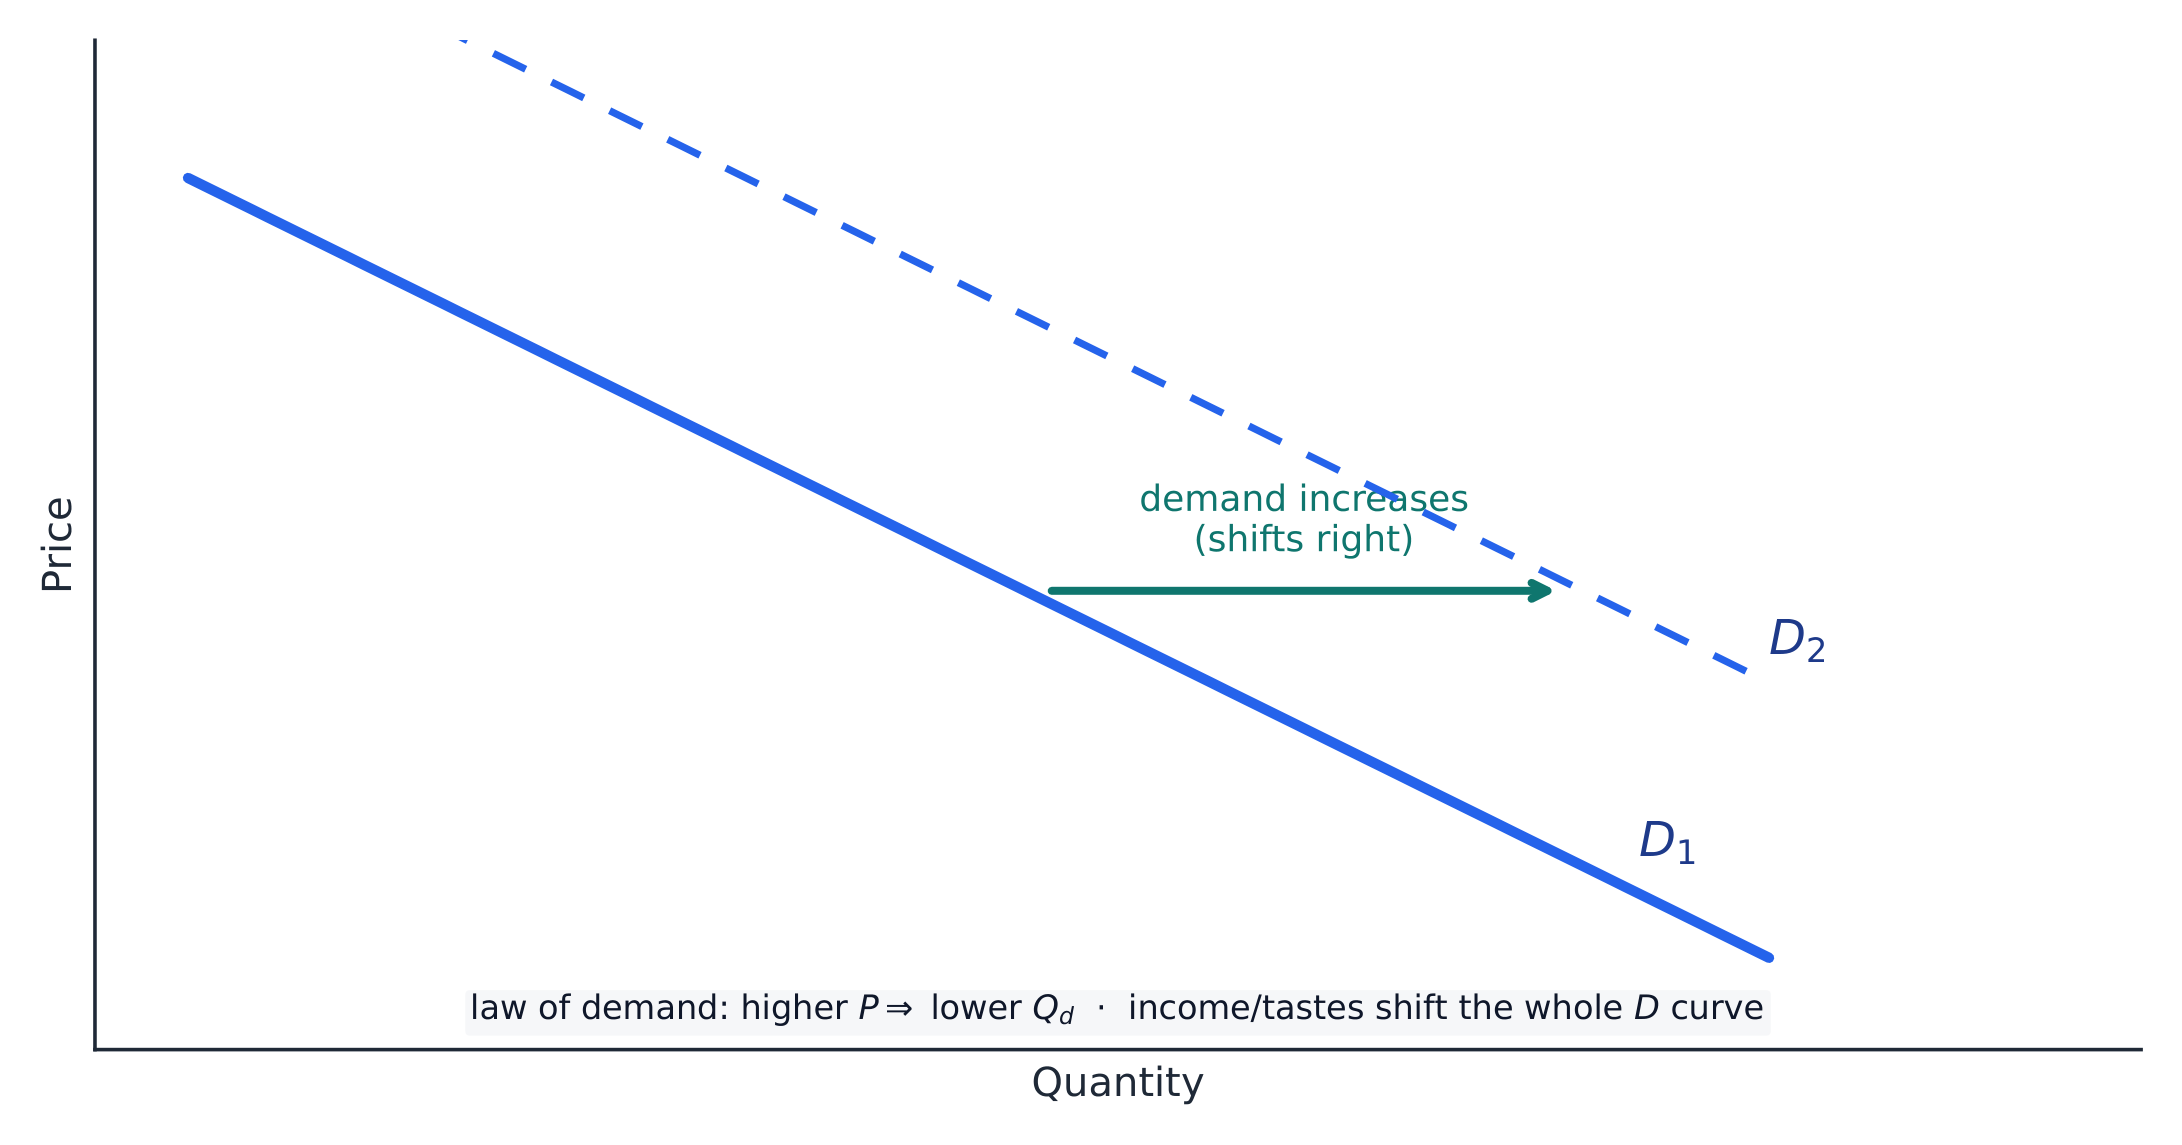
Demand 需求 relates price to the quantity buyers will buy. The law of demand 需求定律 makes the curve slope downward. A change in the good's own price is a movement along the curve; the determinants (income, tastes, prices of substitutes 替代品 and complements 互补品, number of buyers, expectations) shift the whole curve.
Explore demand — move along vs shift the curve · สำรวจความต้องการ — เคลื่อนที่ตามเส้น vs เลื่อนเส้น
A change in the own price moves you along a fixed curve (a change in quantity demanded); a determinant like income or tastes shifts the whole curve ($D_1 \to D_2$) — a change in demand. · การเปลี่ยนแปลง ราคาตัวเอง ทำให้คุณ เคลื่อนที่ตาม เส้นคงที่ (เป็นการเปลี่ยนแปลง ปริมาณต้องการซื้อ); ปัจจัยกำหนดอย่างเช่น รายได้หรือรสนิยมจะ เลื่อน เส้นทั้งหมด ($D_1 \to D_2$) — ซึ่งเป็นการเปลี่ยนแปลง ความต้องการ
Enduring Understanding (MKT-2): In a competitive market, demand for and supply of a good or service determine the equilibrium price.
Learning Objective MKT-2.C:
a. Define (using graphs as appropriate) the law of supply.
b. Explain (using graphs as appropriate) the relationship between the price of a good or service and the quantity supplied.
MKT-2.C.1 The law of supply states there is a positive relationship between price and quantity supplied, leading to an upward-sloping supply curve.
Learning Objective MKT-2.D: Explain (using graphs as appropriate) the determinants of supply.
MKT-2.D.1 Factors that influence producer supply, such as changes in input prices, cause the market supply curve to shift.
Source: College Board AP Course and Exam Description · แหล่งที่มา: คำอธิบายหลักสูตรและข้อสอบ College Board AP
English
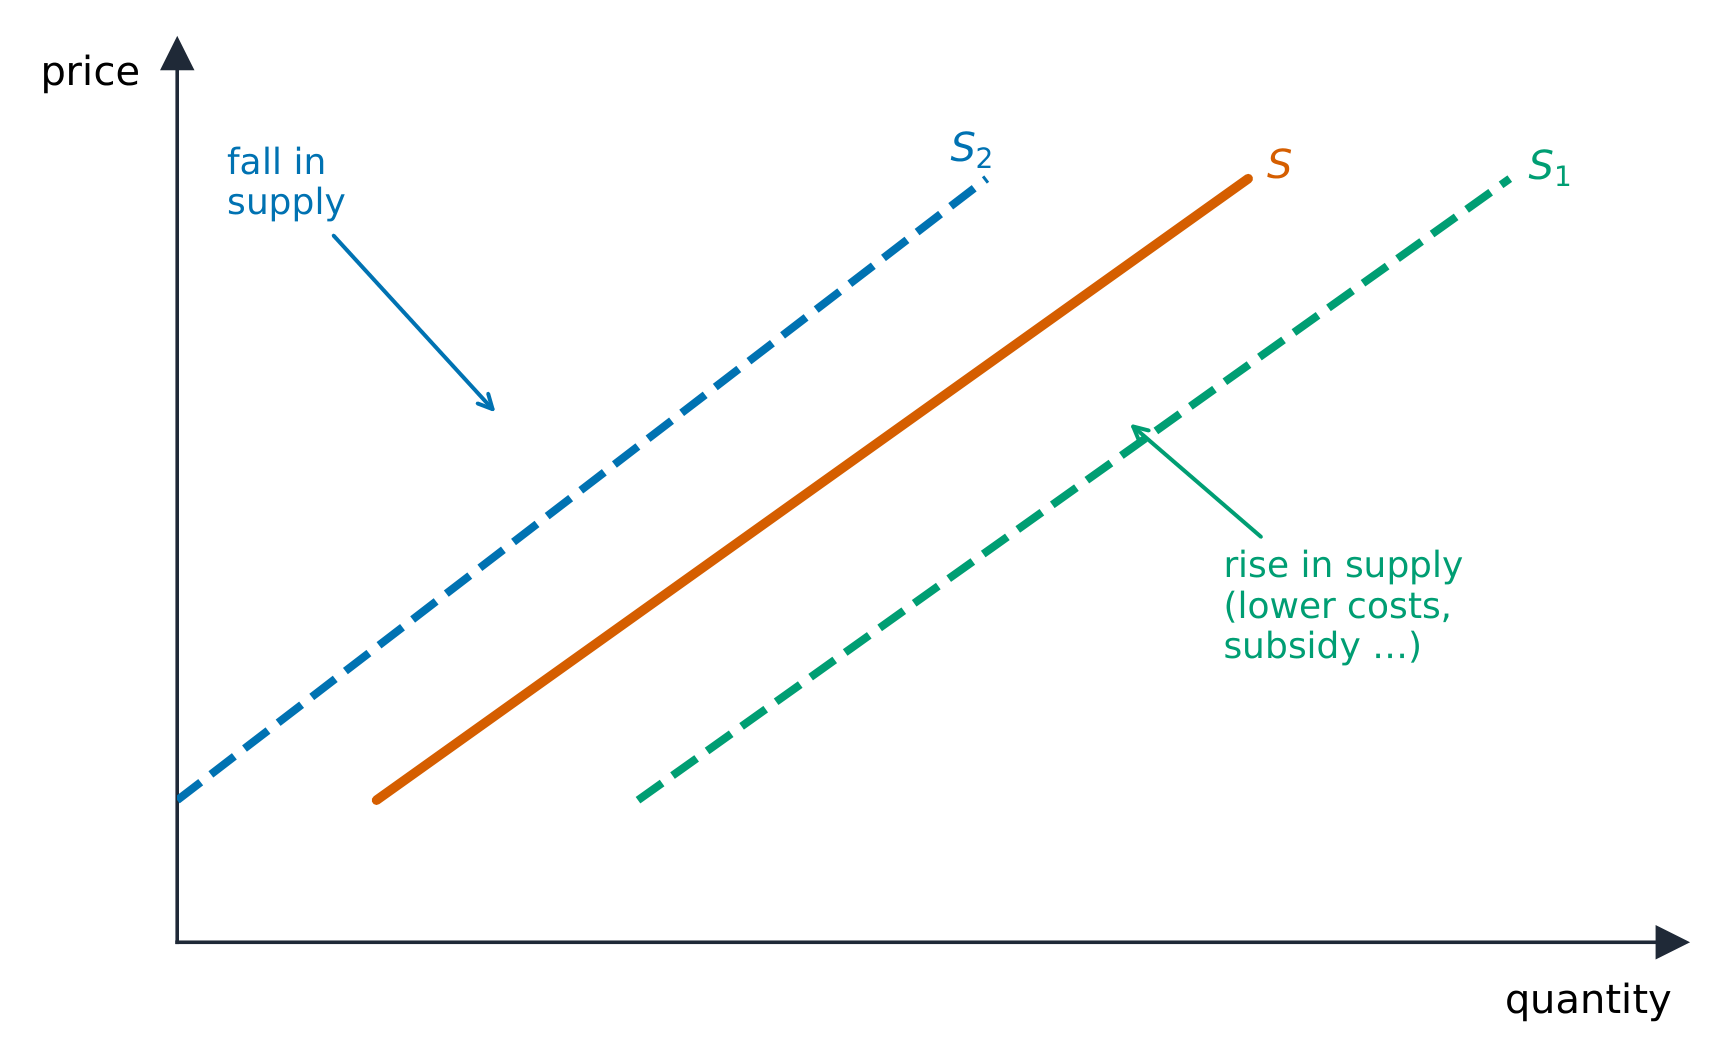
Supply 供给 relates price to the quantity sellers will offer; the law of supply 供给定律 makes it slope upward. Its determinants – input prices, technology, taxes and subsidies 补贴, number of sellers, expectations – shift the curve, while the good's own price moves along it.
Explore what moves the supply curve · สำรวจปัจจัยที่ทำให้เส้น_supply_เคลื่อนที่
Supply slopes up: a higher price makes selling more worthwhile. A change in costs, technology or the number of sellers shifts the whole curve — not a move along it. Drag the supply line and watch price and quantity respond. · ** عرضه** มีแนวโน้มเป็นบวก: ราคาที่สูงขึ้นทำให้การขายมากขึ้นคุ้มค่า การเปลี่ยนแปลงต้นทุน เทคโนโลยี หรือจำนวนผู้ขายจะ เลื่อนเส้นทั้งหมด — ไม่ใช่การเคลื่อนที่ตามเส้น ลากเส้น عرضهแล้วดูปฏิกิริยาของราคาและปริมาณ
Market Equilibrium, Disequilibrium, and Changes in Equilibrium · จุดสมดุลตลาด ความไม่สมดุล และการเปลี่ยนแปลงจุดสมดุล
Syllabus · หลักสูตร
English
Enduring Understanding (MKT-2): In a competitive market, demand for and supply of a good or service determine the equilibrium price.
Learning Objective MKT-2.E: Define (using graphs as appropriate) market equilibrium.
MKT-2.E.1 Equilibrium is achieved at the price at which quantities demanded and supplied are equal.
Learning Objective MKT-2.F:
a. Define a surplus and shortage.
b. Explain (using graphs as appropriate) how prices adjust to restore equilibrium in markets that are experiencing imbalances.
c. Calculate (using graphs as appropriate) the surplus or shortage in the market experience an imbalance.
Source: College Board AP Course and Exam Description · แหล่งที่มา: คำอธิบายหลักสูตรและข้อสอบ College Board AP
English
Supply & demand: a shift raises P and Q
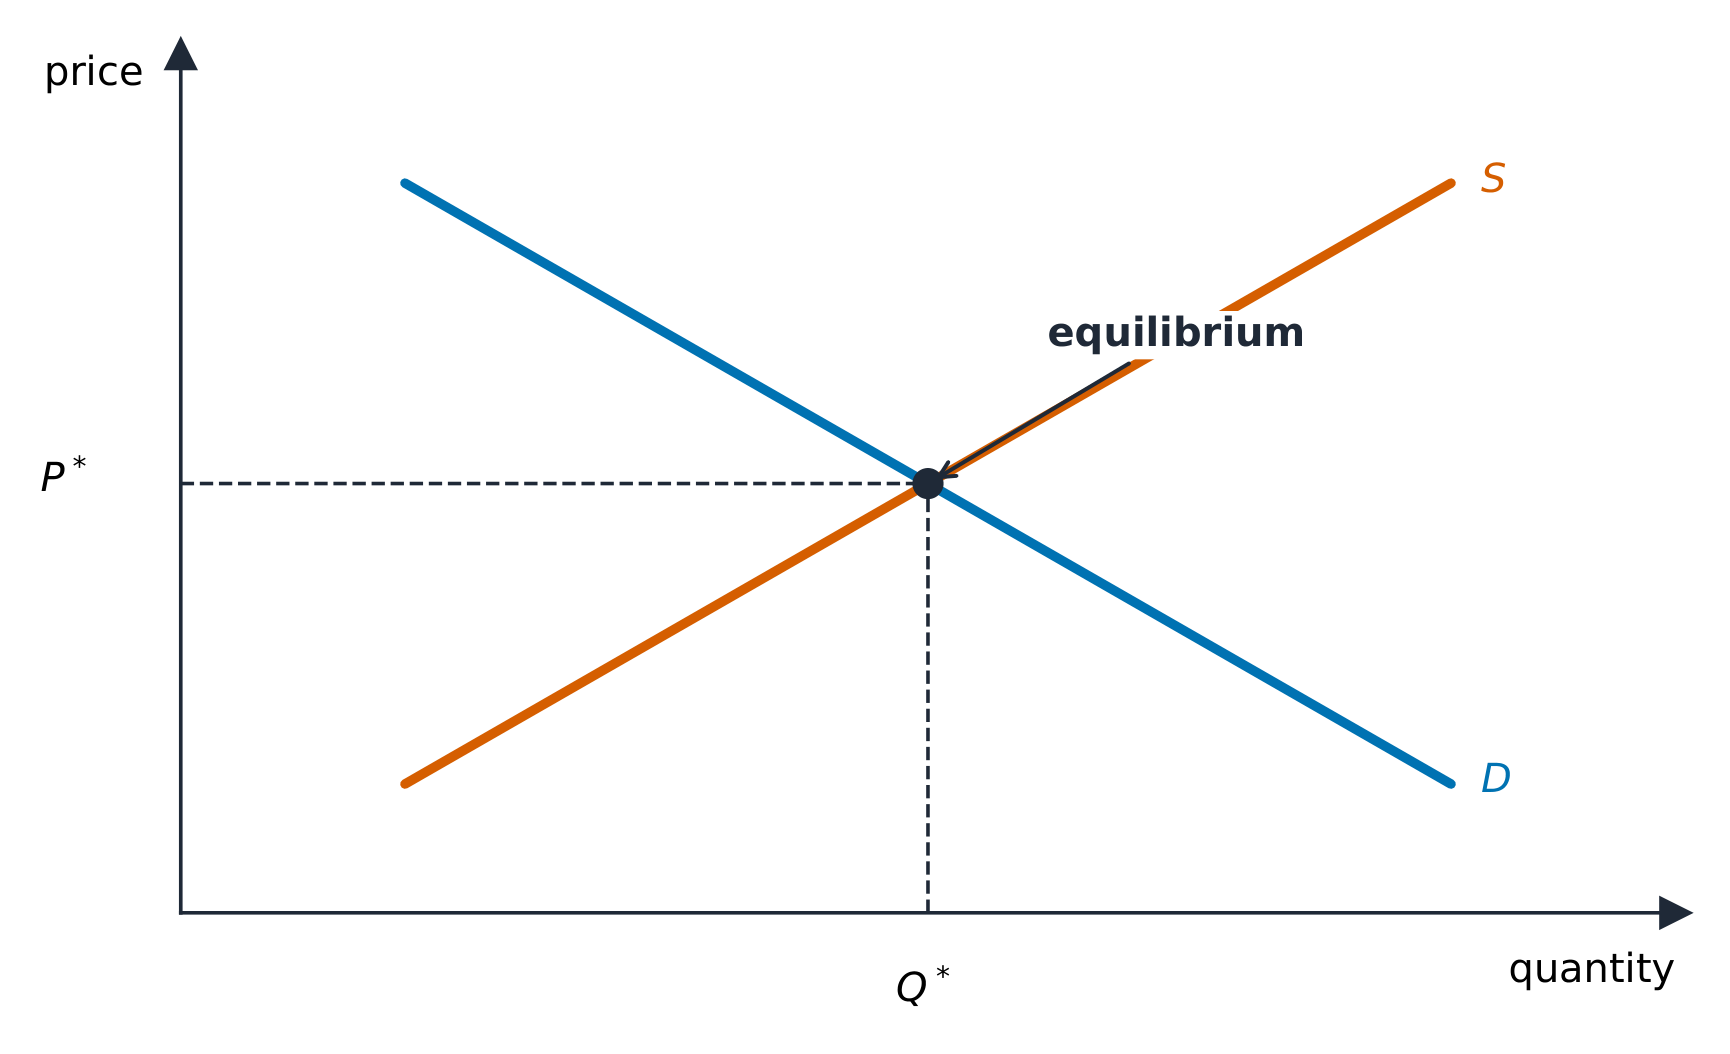
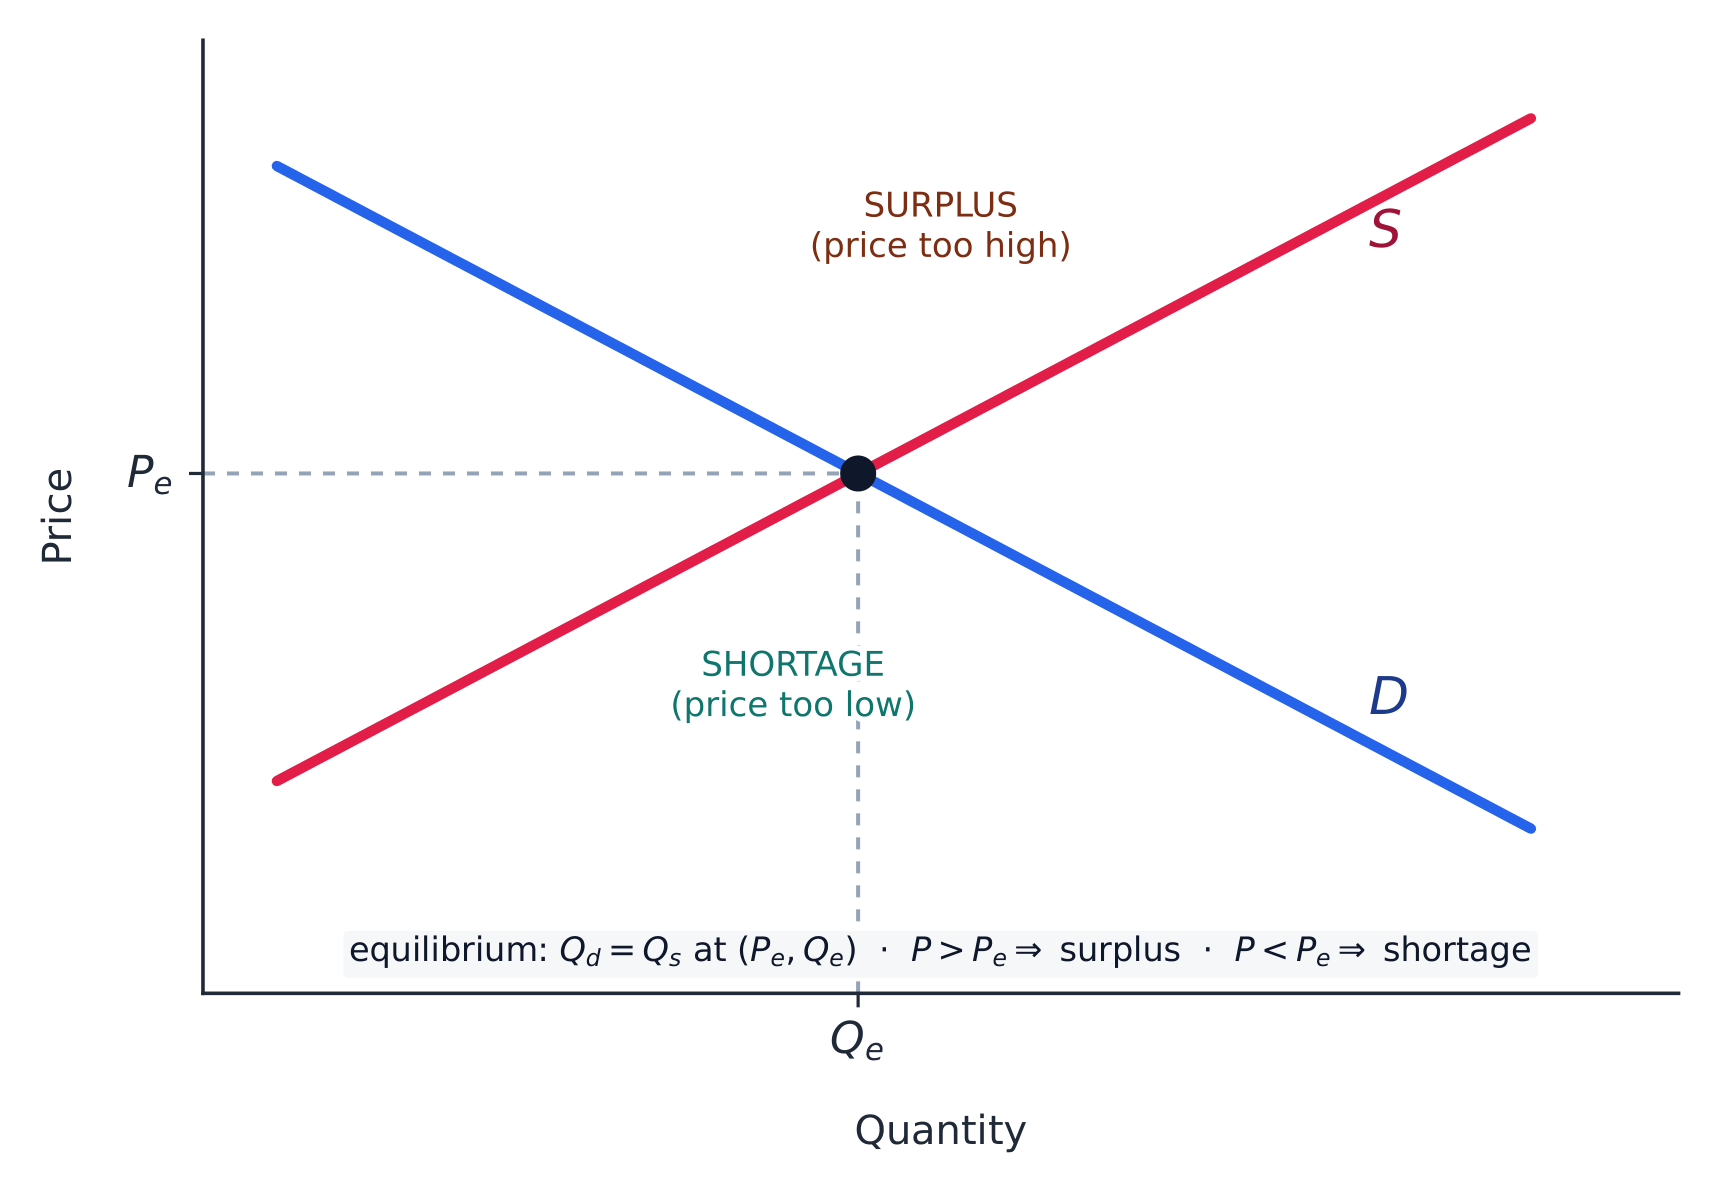
Equilibrium 均衡 is where supply meets demand, clearing the market. Above the equilibrium price a surplus 过剩 pushes price down; below it a shortage 短缺 pushes price up. When a determinant shifts one curve, price and quantity move predictably; when both shift, one of them is indeterminate.
Worked example. A new technology lowers producers' costs, shifting supply right. Along the unchanged demand curve, the equilibrium price falls and the equilibrium quantity rises. If instead a rise in incomes shifts demand right at the same time, quantity clearly rises but the effect on price depends on which shift is larger – the "both shift" indeterminate case.
Exam skill: macro builds on these micro tools – you must draw and shift supply-and-demand and PPC graphs correctly, because the same shift logic drives the aggregate (whole-economy) models later in the course.
Explore market equilibrium, surplus and shortage · สำรวจจุดสมดุลตลาด ความเหลือเฟือ และความขาดแคลน
The market clears where supply meets demand. Shift a curve and watch the crossing move — a rightward demand shift raises both price and quantity; away from equilibrium a surplus or shortage pushes the price back. · ตลาดจะเคลียร์เมื่อ ** عرضهพบความต้องการ** เลื่อนเส้นและดูจุดตัดเคลื่อนที่ — การเลื่อนความต้องการไปทางขวาทำให้ ราคาและปริมาณ เพิ่มขึ้นทั้งคู่; ห่างจากจุดสมดุล ความเหลือเฟือหรือความขาดแคลน จะดันราคากลับคืนมา
The Circular Flow and GDP · การไหลเวียนวงกลมและ GDP
Syllabus · หลักสูตร
English
Enduring Understanding (MEA-1): An economy's performance can be measured by different indicators such as gross domestic product (GDP), the inflation rate, and the unemployment rate.
Learning Objective MEA-1.A:
a. Define (using the circular flow diagram as appropriate) how GDP is measured and its components.
b. Calculate nominal GDP.
MEA-1.A.1 GDP is a measure of final output of the economy.
MEA-1.A.2 GDP as a total flow of income and expenditure can be represented by the circular flow diagram.
MEA-1.A.3 There are three ways of measuring GDP: the expenditures approach, the income approach, and the value-added approach.
Source: College Board AP Course and Exam Description · แหล่งที่มา: คำอธิบายหลักสูตรและข้อสอบ College Board AP
English
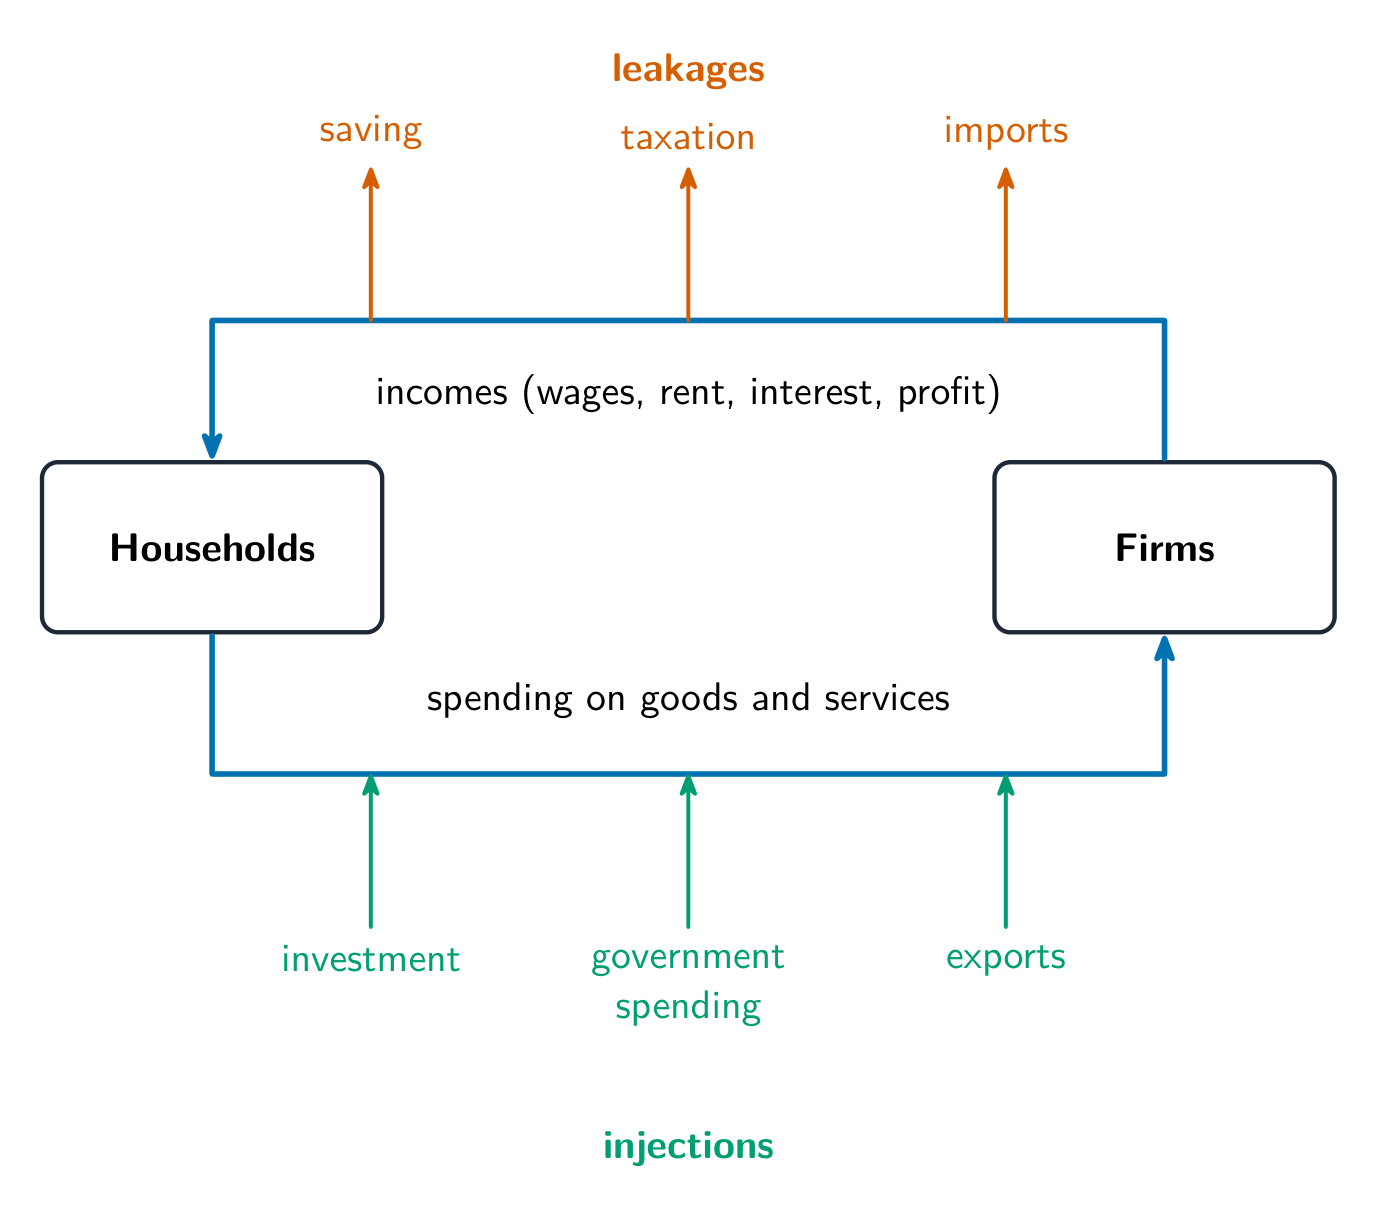
The circular-flow model 循环流动模型 shows money moving between households and firms: households supply factors and earn income; firms sell goods and earn revenue. Every dollar of spending is someone's income, which is why output and income are two sides of the same total.
Gross domestic product (GDP) 国内生产总值 is the market value of all final goods and services produced within a country in a year. Three ways to measure it give the same number:
Expenditure approach:$GDP = C + I + G + X_n$ – consumption 消费, investment 投资 (business spending on capital, plus new housing and inventory), government purchases 政府购买, and net exports 净出口 (exports minus imports).
Income approach: add up all wages, rent, interest, and profit.
Exclude intermediate goods (avoid double counting), used goods, purely financial transactions, and transfer payments.
ไทย
โมเดลการไหลเวียนวงกลม แสดงให้เห็นการไหลของเงินระหว่าง ครัวเรือน และ บริษัท: ครัวเรือนเสนอปัจจัยการผลิตและได้รับรายได้; บริษัทขายสินค้าและรับรายได้ Every dollar ของการใช้จ่ายคือรายได้ของใครคนหนึ่ง นั่นคือเหตุผลว่าทำไมผลผลิตและรายได้จึงเป็นสองด้านของยอดรวมเดียวกัน
Follow money around the circular flow · ติดตามการไหลเวียนของเงินแบบวงกลม
Money flows from households to firms (spending) and back (wages), while injections (investment, government, exports) and leakages (saving, taxes, imports) can grow or shrink the flow — the size of that flow is GDP. · เงินไหลจากครัวเรือนไปยังธุรกิจ (ค่าใช้จ่าย) กลับมา (ค่าจ้าง) ในขณะที่การฉีดเข้า (การลงทุน รัฐบาล การส่งออก) และการรั่วไหล (การออม ภาษี การนำเข้า) สามารถขยายหรือหดขนาดการไหลเวียน — ขนาดของการไหลเวียนนี้คือ GDP
2.2
Limitations of GDP · ข้อจำกัดของ GDP
Syllabus · หลักสูตร
English
Enduring Understanding (MEA-1): An economy's performance can be measured by different indicators such as gross domestic product (GDP), the inflation rate, and the unemployment rate.
Learning Objective MEA-1.B: Define the limitations of GDP.
MEA-1.B.1 GDP is a useful indicator of a nation's economic performance, but it has some limitations, such as failing to account for nonmarket transactions.
จุดประสงค์การเรียนรู้ MEA-1.B: กำหนดข้อจำกัดของ GDP
MEA-1.B.1 GDP เป็นตัวชี้วัด有用的ของการดำเนินงานทางเศรษฐกิจของประเทศ แต่มีข้อจำกัดบางประการ เช่น ไม่คำนึงถึงธุรกรรมที่ไม่ใช่ตลาด
Source: College Board AP Course and Exam Description · แหล่งที่มา: คำอธิบายหลักสูตรและข้อสอบ College Board AP
English
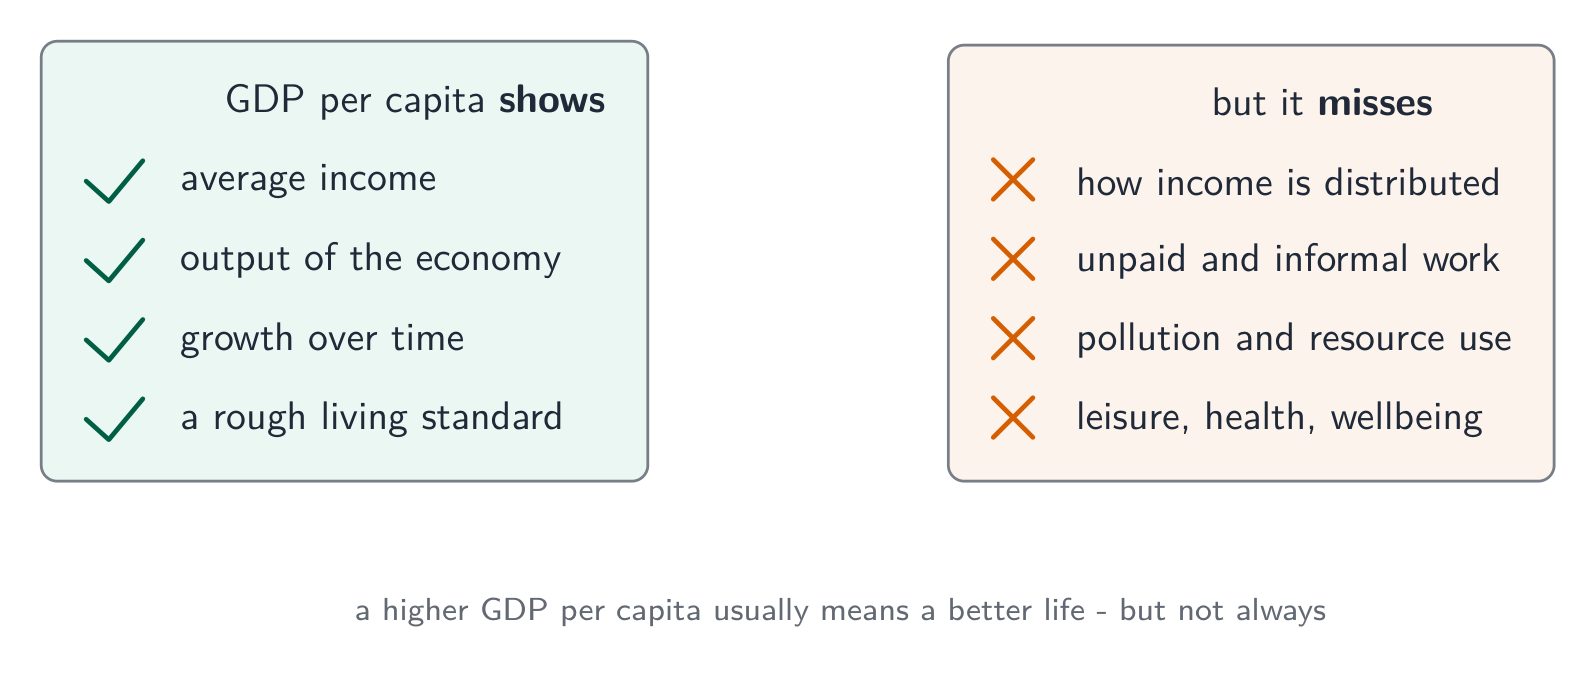
GDP measures market output, not well-being. It omits non-market production (unpaid housework, volunteering), the underground economy 地下经济, leisure, and the distribution of income, and it ignores environmental damage and resource depletion. So a higher GDP does not automatically mean a better standard of living. GDP per capita (GDP $\div$ population) is a better welfare proxy than total GDP.
ไทย
GDP วัดผลผลิตในตลาด ไม่ใช่ความอยู่ดีมีสุข มัน ละเลย การผลิตนอกตลาด (งานบ้านที่ไม่ได้รับค่าจ้าง, การเป็นอาสาสมัคร), เศรษฐกิจใต้ดิน, เวลาว่าง และการ กระจาย รายได้ และมันไม่คำนึงถึงความเสียหายต่อ สิ่งแวดล้อม และการเสื่อมโทรมของทรัพยากร ดังนั้น GDP ที่สูงขึ้นจึงไม่ได้หมายความว่ามาตรฐานการมีชีวิตจะดีขึ้นเสมอไป GDP ต่อหัว (GDP $\div$ ประชากร) เป็นตัวบ่งชี้สวัสดิภาพที่ดีกว่า GDP รวม
GDP ต่อหัวแสดงผลผลิตเฉลี่ยแต่ขาดการกระจาย งานที่ไม่ได้รับค่าจ้าง และอื่นๆ
2.3
Unemployment · การว่างงาน
Syllabus · หลักสูตร
English
Enduring Understanding (MEA-1): An economy's performance can be measured by different indicators such as gross domestic product (GDP), the inflation rate, and the unemployment rate.
Learning Objective MEA-1.C:
a. Define the labor force, the unemployment rate, and the labor force participation rate.
b. Explain how changes in employment and the labor market affect the unemployment rate and the labor force participation rate.
c. Calculate the unemployment rate and the labor force participation rate.
MEA-1.C.1 The unemployment rate is the percentage of the labor force that is out of work.
MEA-1.C.2 The labor force participation rate is another measure of the labor market activity in an economy. The labor force participation rate is the percentage of the adult population that is in the labor force.
Learning Objective MEA-1.D: Define the limitations of the unemployment rate.
MEA-1.D.1 The measured unemployment rate is often criticized for understating the level of joblessness because it excludes groups such as discouraged workers and part-time workers.
Learning Objective MEA-1.E:
a. Define the types of unemployment and the natural rate of unemployment.
b. Explain changes in the types of unemployment.
MEA-1.E.1 Economists primarily focus on three types of unemployment: cyclical, frictional, and structural.
MEA-1.E.2 The natural rate of unemployment is the unemployment rate that would exist when the economy produces full-employment real output. It is equal to the sum of frictional and structural unemployment.
MEA-1.E.3 The deviation of the actual unemployment rate from the natural rate is cyclical unemployment.
MEA-1.E.4 The natural rate of unemployment can gradually change over time because of such things as changes in labor force characteristics.
Worked example. A country has $150$ million employed and $10$ million unemployed (actively looking), with $40$ million working-age adults not looking. The labor force is $150+10=160$ million, so the unemployment rate is $\dfrac{10}{160}=6.25\%$ and the participation rate is $\dfrac{160}{200}=80\%$.
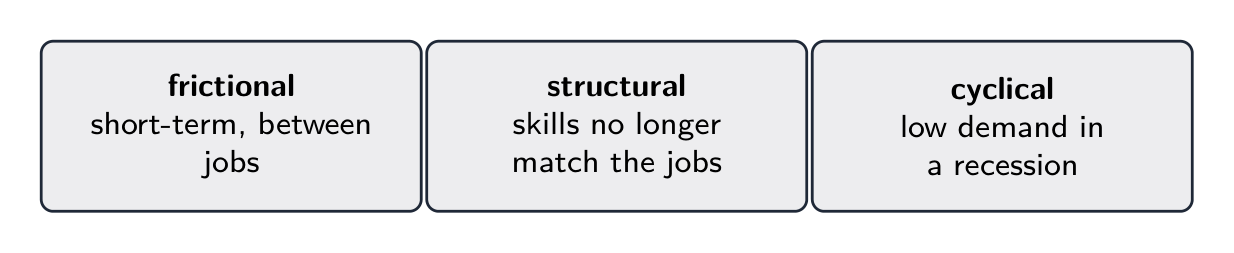
Three types of unemployment:
Frictional 摩擦性失业: between jobs or searching for a first job (normal, short).
Structural 结构性失业: skills or location don't match available jobs (technology, trade).
Cyclical 周期性失业: caused by a recession (a downturn in the business cycle).
Frictional + structural make up the natural rate of unemployment 自然失业率. At the natural rate cyclical unemployment is zero and the economy is at full employment 充分就业. The rate understates joblessness because it omits discouraged workers 灰心工人 and the underemployed.
natural rate of unemployment/ˈnætʃərəl reɪt ɒv ʌnemˈplɔɪmənt/
อัตราการว่างงานตามธรรมชาติ
full employment/fʊl emˈplɔɪmənt/
การจ้างงานเต็มกำลัง
discouraged workers/dɪˈskʌrɪdʒd ˈwɜːkəz/
discouraged workers
2.4
Price Indices and Inflation · ดัชนีราคาและการเงินเฟ้อ
Syllabus · หลักสูตร
English
Enduring Understanding (MEA-1): An economy's performance can be measured by different indicators such as gross domestic product (GDP), the inflation rate, and the unemployment rate.
Learning Objective MEA-1.F:
a. Define the consumer price index (CPI), inflation, deflation, disinflation, the inflation rate, and real variables.
b. Explain how price indices can be used to calculate the inflation rate and to compare nominal variables over time periods.
c. Calculate the CPI, the inflation rate, and changes in real variables.
MEA-1.F.1 The consumer price index (CPI) measures the change in income a consumer would need in order to maintain the same standard of living over time under a new set of prices as under the original set of prices.
MEA-1.F.2 The CPI measures the cost of a fixed basket of goods and services in a given year relative to the base year.
Exclusion statement: Calculating the producer price index (PPI) is beyond the scope of the course and AP Exam.
MEA-1.F.3 The inflation rate is determined by calculating the percentage change in a price index, such as CPI or the GDP deflator.
MEA-1.F.4 Real variables, such as real wages, are the nominal variables deflated by the price level.
Learning Objective MEA-1.G: Define the shortcomings of the CPI as a true measure of inflation.
MEA-1.G.1 The CPI as a measure of inflation has some shortcomings, such as substitution bias, causing it to overstate the true inflation rate.
Source: College Board AP Course and Exam Description · แหล่งที่มา: คำอธิบายหลักสูตรและข้อสอบ College Board AP
English
Inflation 通货膨胀 is a sustained rise in the average price level. It is measured with a price index 价格指数, most often the consumer price index (CPI) 消费者价格指数, built from a fixed market basket of goods a typical household buys:
$$CPI=\frac{\text{cost of basket this year}}{\text{cost of basket in base year}}\times100.$$
The inflation rate is the percent change in the index between two years. Deflation 通货紧缩 is a falling price level; disinflation is a slowing of inflation.
Worked example. If the CPI is $200$ this year and was $190$ last year, the inflation rate is $\dfrac{200-190}{190}\times100\%=5.3\%$. A basket that cost $\$190$ then costs $\$200$ – the same goods, more dollars.
Enduring Understanding (MEA-1): An economy's performance can be measured by different indicators such as gross domestic product (GDP), the inflation rate, and the unemployment rate.
Learning Objective MEA-1.H: Explain the costs that unexpected inflation (deflation) imposes on individuals and the economy.
MEA-1.H.1 Unexpected inflation arbitrarily redistributes wealth from one group of individuals to another group, such as lenders to borrowers.
Source: College Board AP Course and Exam Description · แหล่งที่มา: คำอธิบายหลักสูตรและข้อสอบ College Board AP
English
Inflation redistributes and distorts:
It hurts lenders and savers and helps borrowers when it is unexpected, because loans are repaid in cheaper dollars. It erodes the value of money and fixed incomes.
Menu costs and uncertainty discourage investment.
Anticipated inflation is less harmful because contracts and interest rates adjust for it. This is why we separate nominal and real values.
Enduring Understanding (MEA-1): An economy's performance can be measured by different indicators such as gross domestic product (GDP), the inflation rate, and the unemployment rate.
Learning Objective MEA-1.I: Define nominal GDP and real GDP.
MEA-1.I.1 Nominal GDP is a measure of how much is spent on output. Real GDP is a measure of how much is produced.
MEA-1.I.2 Nominal GDP measures aggregate output using current prices. Real GDP measures aggregate output using constant prices, thus removing the effect of changes in the overall price level.
Learning Objective MEA-1.J: Calculate real GDP and the GDP deflator.
MEA-1.J.1 One way of measuring real GDP is to weigh final goods and services by their prices in a base year. Because this can lead to overstatement of real GDP growth, statistical agencies actually use different methods.
MEA-1.J.2 Nominal GDP can be converted to real GDP by using the GDP deflator.
จุดประสงค์การเรียนรู้ MEA-1.I: นิยาม GDP นามธรรมและ GDP จริง
MEA-1.I.1 GDP นามธรรมเป็นการวัดว่ามีการใช้จ่ายกับผลผลิตมากแค่ไหน GDP จริงเป็นการวัดว่ามีการผลิตมากแค่ไหน
MEA-1.I.2 GDP นามธรรมวัดผลผลิตรวมโดยใช้ราคาปัจจุบัน GDP จริงวัดผลผลิตรวมโดยใช้ราคาคงที่ ดังนั้นจึงขจัดผลกระทบจากการเปลี่ยนแปลงของระดับราคาโดยรวม
จุดประสงค์การเรียนรู้ MEA-1.J: คำนวณ GDP จริงและ GDP deflator
MEA-1.J.1 วิธีการหนึ่งในการวัด GDP จริงคือการคูณด้วยน้ำหนักสินค้าและบริการสุดท้ายด้วยราคาในปีฐาน เนื่องจากวิธีนี้可能导致高估真实GDP增长,统计机构实际上使用不同的方法。
MEA-1.J.2 GDP นามธรรมสามารถแปลงเป็น GDP จริงได้โดยใช้ GDP deflator
Source: College Board AP Course and Exam Description · แหล่งที่มา: คำอธิบายหลักสูตรและข้อสอบ College Board AP
English
Nominal GDP 名义GDP is valued at current prices, so it rises with both output and prices.
Real GDP 实际GDP is valued at constant (base-year) prices, stripping out inflation, so it reflects true output. Real GDP is the honest measure of growth.
Worked example. Nominal GDP is $\$22$ trillion and the GDP deflator is $110$. Real GDP is $\dfrac{22}{110}\times100=\$20$ trillion. The extra $\$2$ trillion of nominal GDP is pure price rise, not real output – which is why growth is always measured with real GDP.
Exam skill: be fluent converting nominal to real using a price index, and computing an inflation rate or a growth rate as a percent change.
ไทย
GDP นามนัย GDP มีมูลค่าที่ ราคาปัจจุบัน, ดังนั้นมันจึงเพิ่มขึ้นทั้งผลผลิตและราคา
GDP จริง GDP มีมูลค่าที่ ราคาคงที่ (ปีฐาน), ล้างเงินเฟ้อออก, ดังนั้นมันจึงสะท้อนผลผลิตที่แท้จริง. GDP จริงคือการวัดการเติบโตที่ซื่อสัตย์ที่สุด
ตัวอย่างที่คำนวณแล้ว. GDP นามนัยคือ $\$22$ trillion and the GDP deflator is $110$. Real GDP is $\dfrac{22}{110}\times100=\$20$ trillion. ส่วนเพิ่ม $\$2$万亿ของ GDP นามนัยเป็นการขึ้นราคาล้วนๆ ไม่ใช่ผลผลิตจริง – นั่นคือเหตุผลที่การเติบโตต้องวัดด้วย GDP จริง เสมอ
consumer price index (CPI)/kənˈsuːmə praɪs ˈɪndeks/
ดัชนีราคาผู้บริโภค (CPI)
Deflation/diːˈfleɪʃn/
Deflation
Nominal GDP/ˈnɒmɪnl ˌdʒiː diː ˈpiː/
GDP ชั่วคราว
Real GDP/rɪəl ˌdʒiː diː ˈpiː/
GDP จริง
2.7
Business Cycles · รอบธุรกิจ
Syllabus · หลักสูตร
English
Enduring Understanding (MEA-2): The economy fluctuates between periods of expansion and contraction in the short run, but economic growth can occur in the long run.
Learning Objective MEA-2.A:
a. Define (using graphs and data as appropriate) turning points and phases of the business cycle.
b. Explain (using graphs and data as appropriate) turning points and phases of the business cycle.
MEA-2.A.1 Business cycles are fluctuations in aggregate output and employment because of changes in aggregate supply and/or aggregate demand.
MEA-2.A.2 The phases of a business cycle are recession and expansion.
MEA-2.A.3 The turning points of a business cycle are peak and trough.
MEA-2.A.4 The difference between actual output and potential output is the output gap.
MEA-2.A.5 Potential output is also called full-employment output. It is the level of GDP where unemployment is equal to the natural rate of unemployment. [See EK MEA-1.E.2]
MEA-2.A.5 ผลผลิตที่เป็นไปได้ (Potential output) ยังเรียกว่าผลผลิตที่ระดับการจ้างงานเต็ม (full-employment output) ซึ่งเป็นระดับของ GDP ที่อัตราการว่างงานเท่ากับอัตราการว่างงานตามธรรมชาติ [ดู EK MEA-1.E.2]
Source: College Board AP Course and Exam Description · แหล่งที่มา: คำอธิบายหลักสูตรและข้อสอบ College Board AP
English
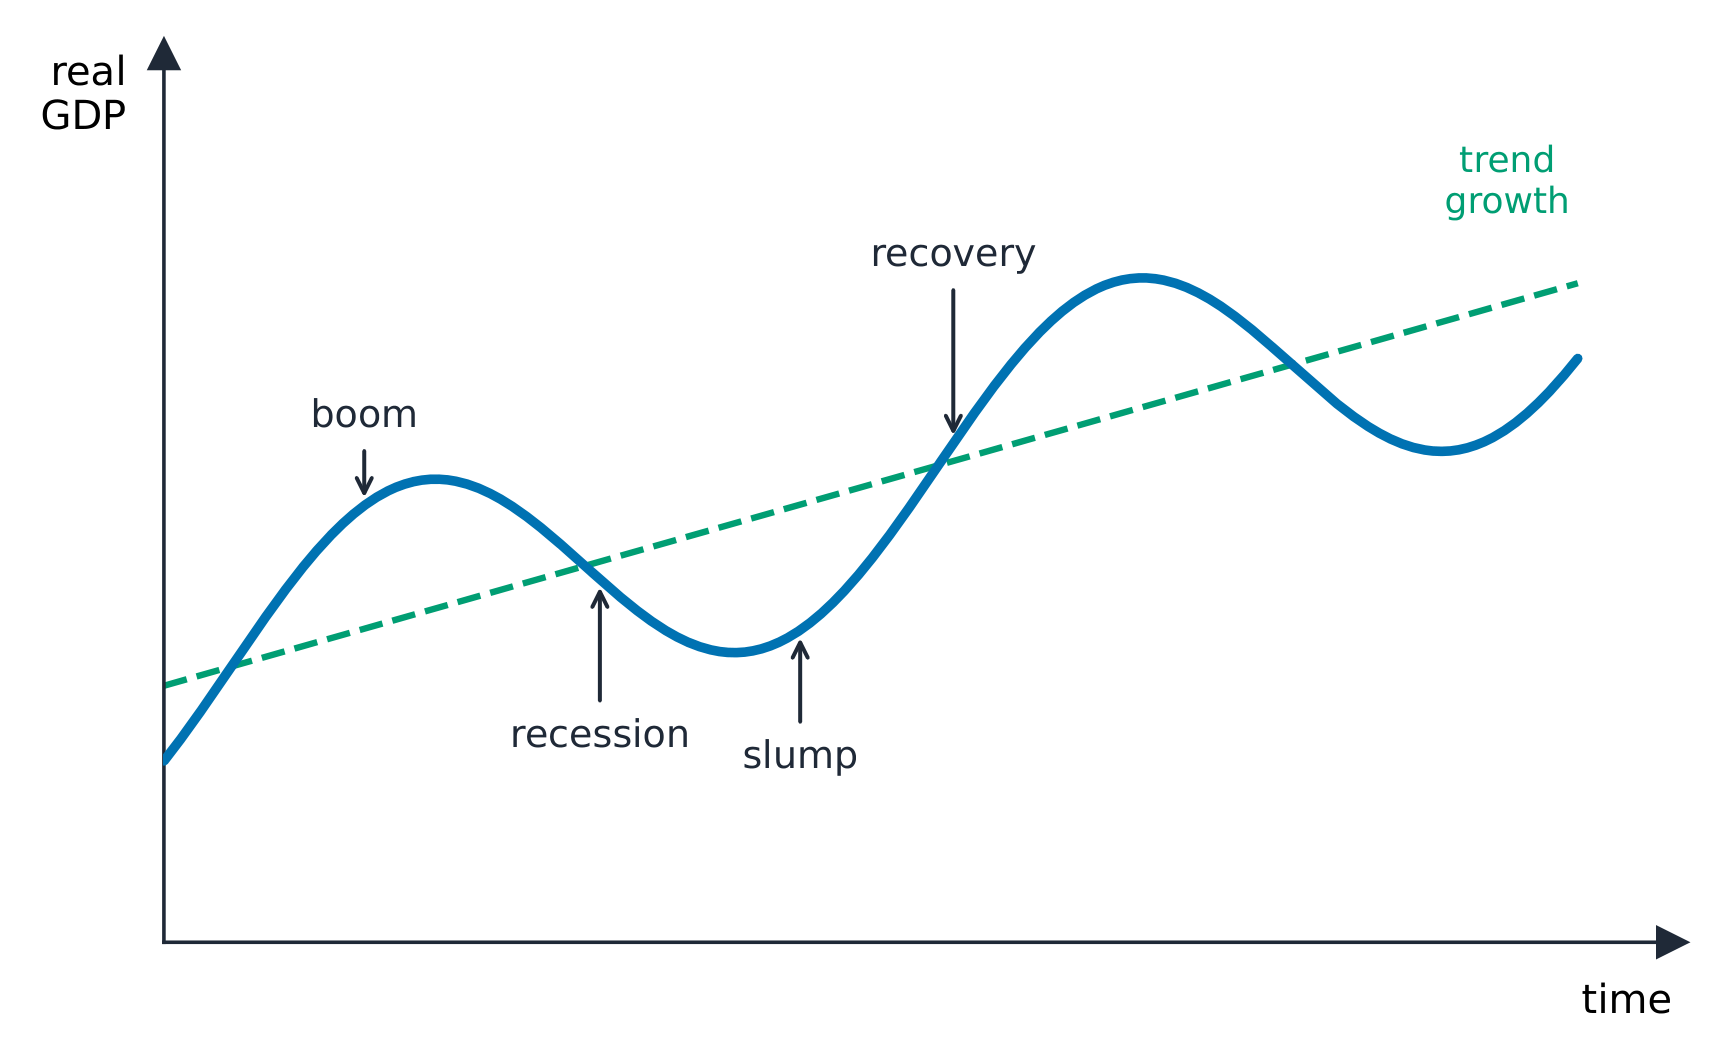
The business cycle
The business cycle 经济周期 is the economy's short-run ups and downs in real GDP around its long-run growth trend: expansion 扩张 (rising output, falling unemployment) up to a peak 顶峰, then contraction/recession 衰退 (falling output, rising cyclical unemployment) down to a trough 谷底, then recovery. A recession is commonly two consecutive quarters of falling real GDP. Unemployment and inflation move roughly opposite over the cycle – the tension the rest of the course tries to manage.
Enduring Understanding (MOD-2): Economists use the aggregate demand–aggregate supply model to represent the relationship between the price level and aggregate output in an economy and to illustrate how output, employment, and the price level respond to macroeconomic shocks.
Learning Objective MOD-2.A:
a. Define (using graphs as appropriate) the aggregate demand (AD) curve.
b. Explain (using graphs as appropriate) the slope of the AD curve and its determinants.
MOD-2.A.1 The aggregate demand (AD) curve describes the relationship between the price level and the quantity of goods and services demanded by households (consumption), firms (investment), government (government spending), and the rest of the world (net exports).
MOD-2.A.2 The negative slope of the AD curve is explained by the real wealth effect, the interest rate effect, and the exchange rate effect. [See EK MKT-3.A.1]
MOD-2.A.3 Any change in the components of aggregate demand (consumption, investment, government spending, or net exports) that is not due to changes in the price level leads to a shift of the AD curve.
Source: College Board AP Course and Exam Description · แหล่งที่มา: คำอธิบายหลักสูตรและข้อสอบ College Board AP
English
The AD–AS model: a demand shock
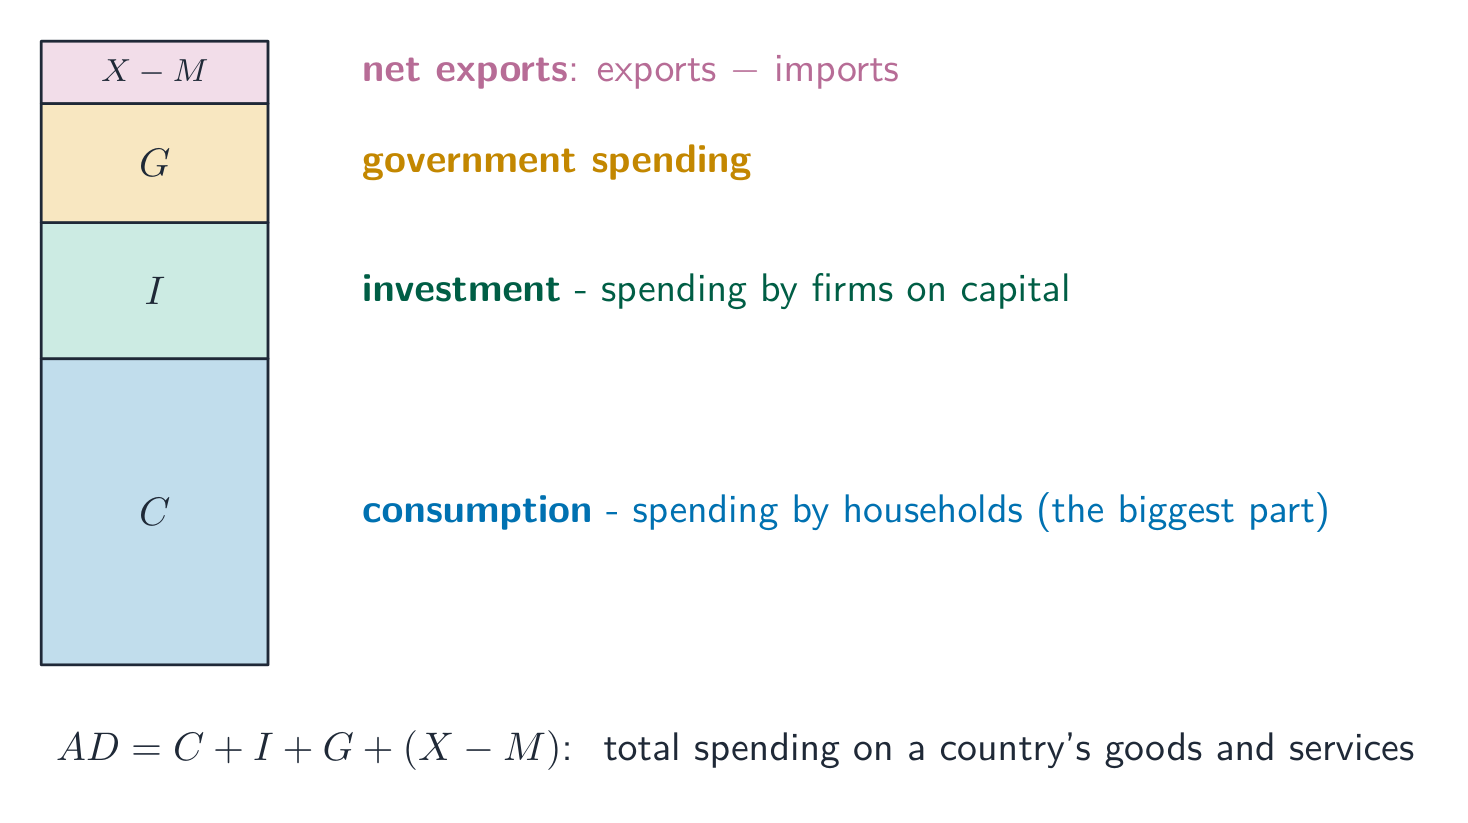
Aggregate demand (AD) 总需求 shows the total quantity of real output ($C+I+G+X_n$) buyers want at each price level 价格水平. It slopes downward for three reasons special to the whole economy:
the wealth effect 财富效应 (a higher price level shrinks the real value of money, so people buy less),
the interest-rate effect 利率效应 (a higher price level raises money demand and interest rates, cutting investment),
the net-export effect (a higher domestic price level makes exports dearer and imports cheaper).
A change in the price level is a movement along AD. AD shifts when any component of $C+I+G+X_n$ changes for another reason – consumer confidence, business expectations, government spending, taxes, or foreign incomes.
The Spending and Tax Multipliers · ตัวคูณการใช้จ่ายและตัวคูณภาษี
Syllabus · หลักสูตร
English
Enduring Understanding (MOD-2): Economists use the aggregate demand–aggregate supply model to represent the relationship between the price level and aggregate output in an economy and to illustrate how output, employment, and the price level respond to macroeconomic shocks.
Learning Objective MOD-2.B:
a. Define the expenditure multiplier, the tax multiplier, the marginal propensity to consume, and the marginal propensity to save.
b. Explain how changes in spending and taxes lead to changes in real GDP.
c. Calculate how changes in spending and taxes lead to changes in real GDP.
MOD-2.B.1 A $\$1$ change to autonomous expenditures leads to further changes in total expenditures and total output.
MOD-2.B.2 The expenditure multiplier quantifies the size of the change in aggregate demand as a result of a change in any of the components of aggregate demand.
MOD-2.B.3 The tax multiplier quantifies the size of the change in aggregate demand as a result of a change in taxes.
MOD-2.B.4 The expenditure multiplier and tax multiplier depend on the marginal propensity to consume.
MOD-2.B.5 The marginal propensity to consume is the change in consumer spending divided by the change in disposable income. The sum of the marginal propensity to consume and marginal propensity to save is equal to one.
Source: College Board AP Course and Exam Description · แหล่งที่มา: คำอธิบายหลักสูตรและข้อสอบ College Board AP
English
The spending multiplier
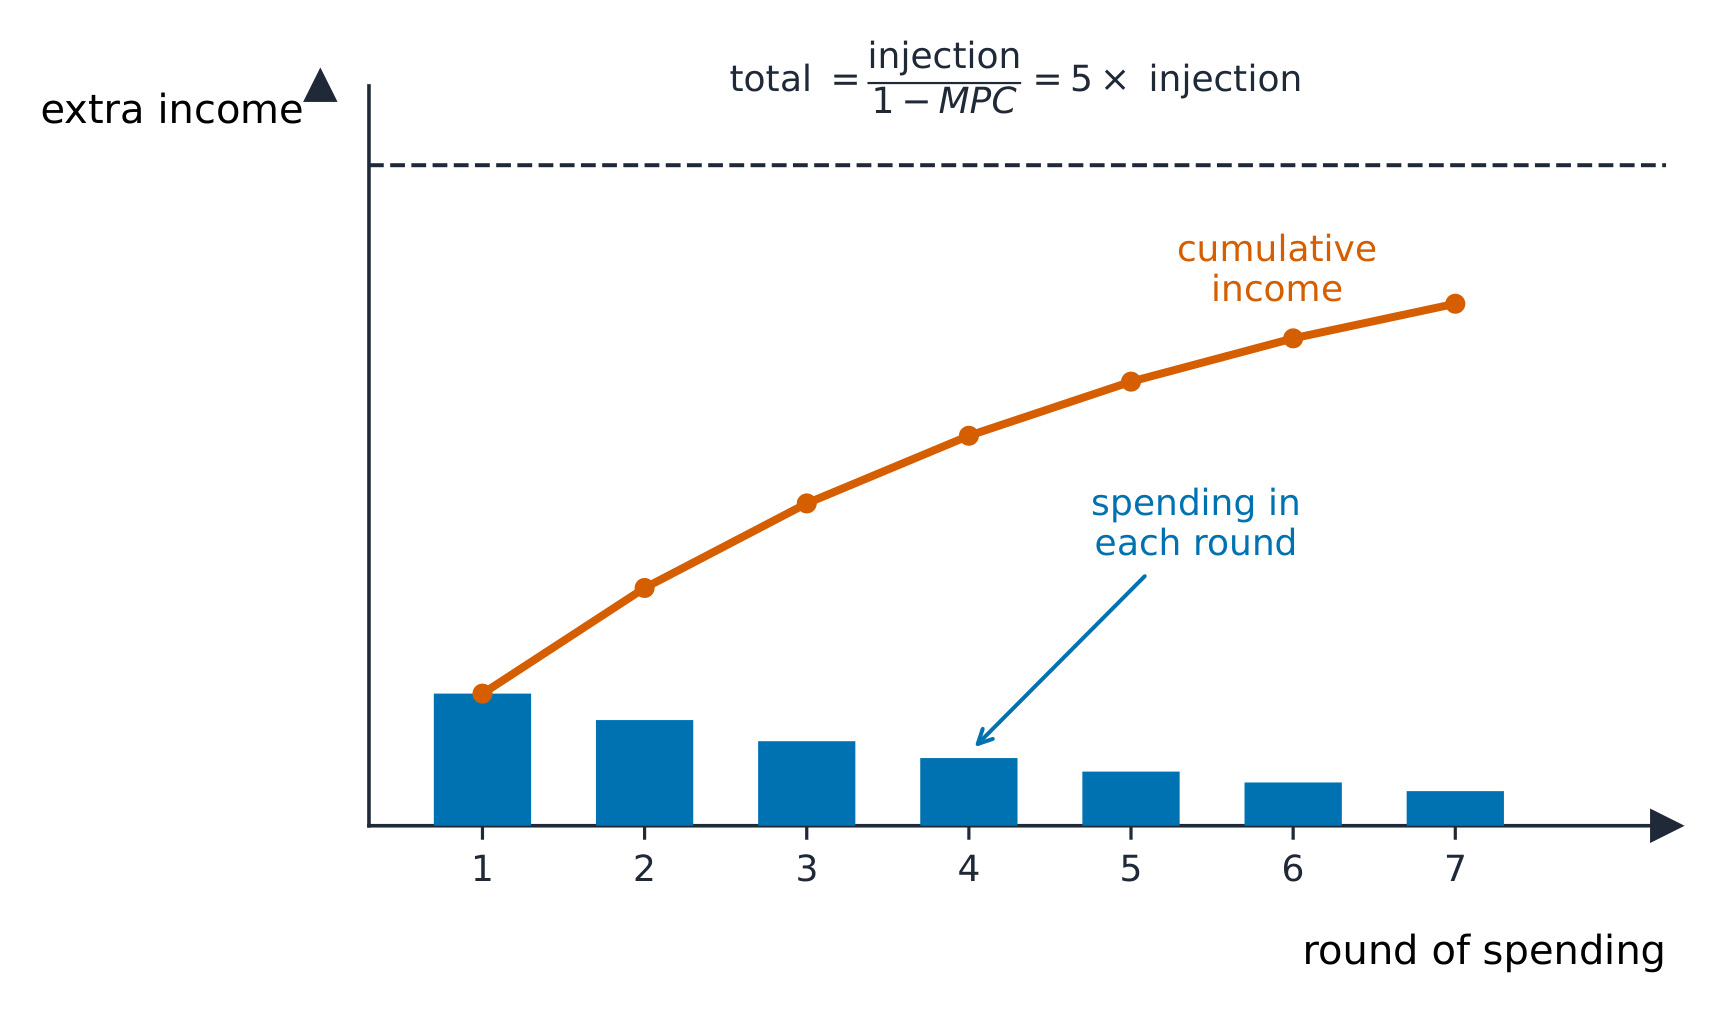
A change in spending sets off further rounds of spending, so the final change in GDP is larger than the initial change – the multiplier effect 乘数效应. It depends on the marginal propensity to consume 边际消费倾向 (MPC), the fraction of extra income that is spent (the rest is the marginal propensity to save 边际储蓄倾向, MPS, with $MPC+MPS=1$):
The tax multiplier is smaller in size and negative (a tax cut raises GDP; a tax rise lowers it). Total change in GDP $=$ (multiplier) $\times$ (initial change).
Worked example. If $MPC=0.8$, the spending multiplier is $\dfrac{1}{1-0.8}=5$, so a $\$10$ billion rise in government spending lifts real GDP by $5\times\$10=\$50$ billion. The tax multiplier is $-\dfrac{0.8}{0.2}=-4$, so a $\$10$ billion tax cut raises GDP by only $\$40$ billion – weaker, because part of the tax cut is saved.
Exam skill: compute both multipliers from the MPC and find the resulting change in real GDP – an almost-guaranteed calculation.
ไทย
ตัวคูณการใช้จ่าย
การเปลี่ยนแปลงในการใช้จ่ายจะกระตุ้นให้เกิดรอบของการใช้จ่ายเพิ่มเติม ดังนั้นการเปลี่ยนแปลงสุดท้ายใน GDP จึงมีขนาด มากกว่า การเปลี่ยนแปลงเริ่มต้น – นี่คือ ผลคูณ. มันขึ้นอยู่กับ ** propensity to consume边际 (MPC)**, คือสัดส่วนของรายได้เพิ่มเติมที่ถูกใช้จ่าย (ส่วนที่เหลือคือ propensity to save边际, MPS, โดยมี $MPC+MPS=1$):
ตัวอย่างฝึกฝน. ถ้า $MPC=0.8$, ตัวคูณการใช้จ่ายคือ $\dfrac{1}{1-0.8}=5$, ดังนั้นการลดภาษี $\$10$ billion rise in government spending lifts real GDP by $5\times\$10=\$50$ billion. The tax multiplier is $-\dfrac{0.8}{0.2}=-4$, so a $\$10$ พันล้านดอลลาร์สหรัฐ จะเพิ่ม GDP เพียง $\$40$ พันล้านดอลลาร์สหรัฐ – มีผลอ่อนกว่า เพราะบางส่วนของการลดภาษีถูกเก็บออมไว้.
เทคนิคการสอบ: คำนวณตัวคูณทั้งสองจาก MPC และหาการเปลี่ยนแปลงของ GDP จริง – เป็นการคำนวณที่แทบจะแน่นอนที่จะออกสอบ.
Explore · สำรวจ
See the spending multiplier ripple out · เห็นผลกระทบคูณของการใช้จ่ายที่แผ่ขยายออกไป
A dollar of new spending becomes someone's income, part of which they spend again — so the total effect is a multiple of the first injection, set by the marginal propensity to consume (MPC). · เงินหนึ่งดอลลาร์จากการใช้จ่ายใหม่กลายเป็นรายได้ของคนอื่น คนหนึ่งบางส่วนถูกนำไปใช้จ่ายอีกครั้ง — ดังนั้นผลกระทบรวมจึงเป็น หลายเท่า ของการฉีดเข้าครั้งแรก ซึ่งกำหนดโดยอัตราการบริโภครายได้เพิ่ม (MPC)
3.3
Short-Run Aggregate Supply · Oferta รวมระยะสั้น
Syllabus · หลักสูตร
English
Enduring Understanding (MOD-2): Economists use the aggregate demand–aggregate supply model to represent the relationship between the price level and aggregate output in an economy and to illustrate how output, employment, and the price level respond to macroeconomic shocks.
Learning Objective MOD-2.C:
a. Define (using graphs as appropriate) the short-run aggregate supply (SRAS) curve.
b. Explain (using graphs as appropriate) the slope of the SRAS curve and its determinants.
MOD-2.C.1 The short-run aggregate supply (SRAS) curve describes the relationship between the price level and the quantity of goods and services supplied in an economy.
MOD-2.C.2 The SRAS curve is upward-sloping because of sticky wages and prices. [See EK MOD-2.E.1]
MOD-2.C.3 Any factor that causes production costs to change, such as a change in inflationary expectations, will cause the SRAS curve to shift.
Learning Objective MOD-2.D: Explain (using graphs as appropriate) how movement along the SRAS curve implies a relationship between the price level (and inflation) and unemployment.
MOD-2.D.1 Moving along the SRAS curve, an increase in the price level is associated with an increase in output, which means employment must correspondingly rise. With the labor force held constant, unemployment will fall. So, there is a short-run trade-off between inflation and unemployment. [See EK MOD-3.A.1]
Source: College Board AP Course and Exam Description · แหล่งที่มา: คำอธิบายหลักสูตรและข้อสอบ College Board AP
English
Short-run aggregate supply (SRAS) 短期总供给 slopes upward: in the short run some input prices (especially nominal wages 名义工资) are sticky 粘性, so a higher output price level widens profit margins and firms produce more. SRAS shifts with input prices, productivity, taxes/subsidies on producers, and supply shocks (e.g. an oil-price change). A rise in input costs shifts SRAS left.
Enduring Understanding (MOD-2): Economists use the aggregate demand–aggregate supply model to represent the relationship between the price level and aggregate output in an economy and to illustrate how output, employment, and the price level respond to macroeconomic shocks.
Learning Objective MOD-2.E: Define (using graphs as appropriate) the short run and the long run.
MOD-2.E.1 In the long run all prices and wages are fully flexible, while in the short run some input prices are fixed. A consequence of flexible long-run prices and wages is the lack of a long-run trade-off between inflation and unemployment.
Learning Objective MOD-2.F: Define (using graphs as appropriate) the long-run aggregate supply (LRAS) curve.
MOD-2.F.1 The LRAS curve corresponds to the production possibilities curve (PPC) because they both represent maximum sustainable capacity. Maximum sustainable capacity is the total output an economic system will produce over a set period of time if all resources are fully employed. [See LO MOD-2.I]
MOD-2.F.2 The LRAS curve is vertical at the full-employment level of output because in the long run wages and prices fully adjust.
Source: College Board AP Course and Exam Description · แหล่งที่มา: คำอธิบายหลักสูตรและข้อสอบ College Board AP
English
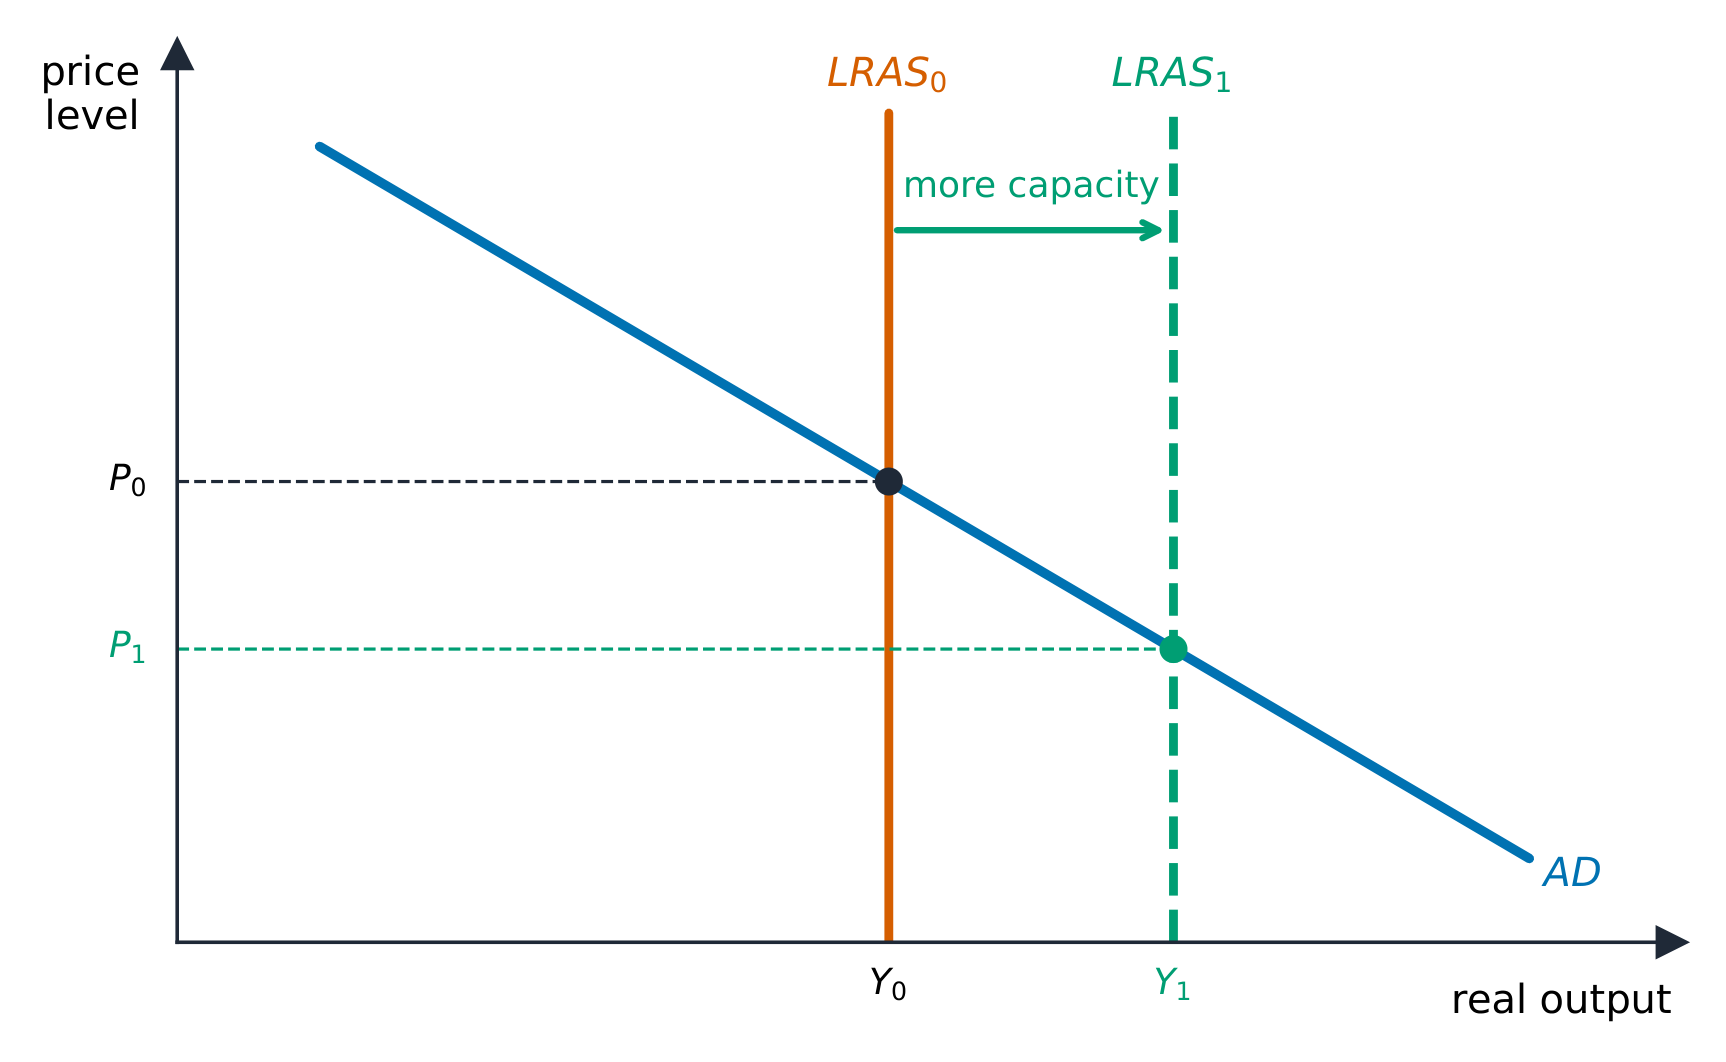
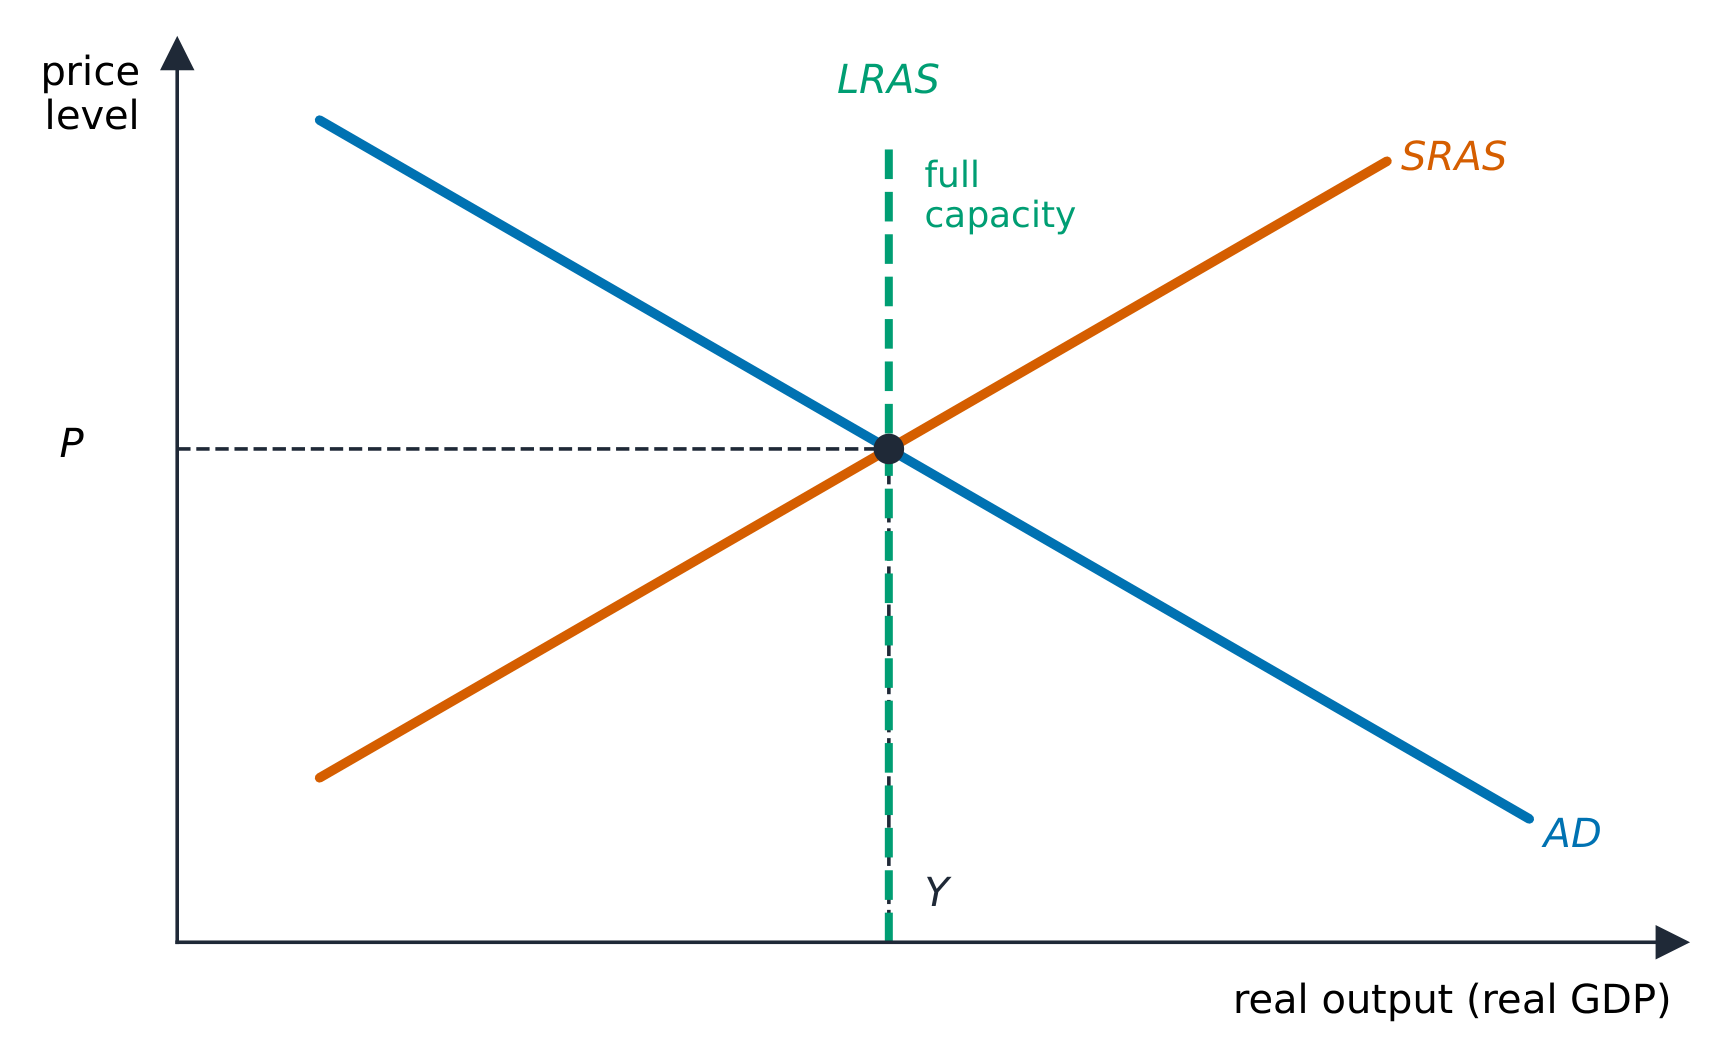
Long-run aggregate supply (LRAS) 长期总供给 is vertical at the economy's full-employment (potential) output 潜在产出$Y_f$. In the long run all prices and wages are fully flexible (only in the short run are some input prices fixed), so output depends only on real factors – resources, technology, institutions – not the price level. LRAS shifts only with economic growth (more or better resources). LRAS corresponds to the production possibilities curve (PPC) 生产可能性曲线: both mark the economy's maximum sustainable capacity, so an outward LRAS shift and an outward PPC shift are the same event drawn two ways. The vertical LRAS is why, in the long run, demand policy changes prices, not output.
Equilibrium in the AD-AS Model · จุดสมดุลในโมเดล AD-AS
Syllabus · หลักสูตร
English
Enduring Understanding (MOD-2): Economists use the aggregate demand–aggregate supply model to represent the relationship between the price level and aggregate output in an economy and to illustrate how output, employment, and the price level respond to macroeconomic shocks.
Learning Objective MOD-2.G: Explain (using graphs as appropriate) the short-run and long-run equilibrium price level and output level.
MOD-2.G.1 Short-run equilibrium occurs when the aggregate quantity of output demanded and the aggregate quantity of output supplied are equal—i.e., at the intersection of the AD and SRAS curves.
MOD-2.G.2 Long-run equilibrium occurs when the AD and SRAS curves intersect on the LRAS—i.e., at the full-employment level of real output.
MOD-2.G.3 The short-run equilibrium output can be at the full-employment level of output, above it, or below it, creating positive (i.e., inflationary) or negative (i.e., recessionary) output gaps.
Source: College Board AP Course and Exam Description · แหล่งที่มา: คำอธิบายหลักสูตรและข้อสอบ College Board AP
English
The economy settles where AD meets SRAS, fixing the equilibrium price level and real GDP. Comparing that output to $Y_f$ (the LRAS line) gives the economy's state:
output $: a recessionary gap 衰退缺口 (cyclical unemployment),
output $>Y_f$: an inflationary gap 通胀缺口 (overheating),
output $=Y_f$: long-run equilibrium.
ไทย
เศรษฐกิจจะเข้าสู่สภาวะสมดุลเมื่อ AD ตัดกับ SRAS, ซึ่งกำหนด ระดับราคาสมดุล และ GDP จริง การเปรียบเทียบผลผลิตนั้นกับ $Y_f$ (เส้น LRAS) บอกสถานะของเศรษฐกิจ:
Find equilibrium in the AD-AS model · หาจุดสมดุลในโมเดล AD-AS
Aggregate demand and aggregate supply cross at the economy's price level and real GDP. A demand or supply shock shifts a curve and moves the whole economy's output and prices. · ** Aggregate demand** และ aggregate supply ตัดกันที่ระดับราคาและ GDP จริงของเศรษฐกิจ การกระแทกจากฝั่งความต้องการหรือ供给侧จะเลื่อนเส้นและเปลี่ยนผลผลิตและราคาของเศรษฐกิจทั้งระบบ
3.6
Short-Run Changes: Demand and Supply Shocks · การเปลี่ยนแปลงระยะสั้น: แรงกระตุ้นด้านความต้องการและofferta
Syllabus · หลักสูตร
English
Enduring Understanding (MOD-2): Economists use the aggregate demand–aggregate supply model to represent the relationship between the price level and aggregate output in an economy and to illustrate how output, employment, and the price level respond to macroeconomic shocks.
Learning Objective MOD-2.H: Explain (using graphs as appropriate) the response of output, employment, and the price level to an aggregate demand or aggregate supply shock in the short run.
MOD-2.H.1 A positive (negative) shock in AD causes output, employment, and the price level to rise (fall) in the short run.
MOD-2.H.2 A positive (negative) shock in SRAS causes output and employment to rise (fall) and the price level to fall (rise) in the short run.
MOD-2.H.3 Inflation can be caused by changes in aggregate demand (demand-pull) or aggregate supply (cost-push).
Source: College Board AP Course and Exam Description · แหล่งที่มา: คำอธิบายหลักสูตรและข้อสอบ College Board AP
English
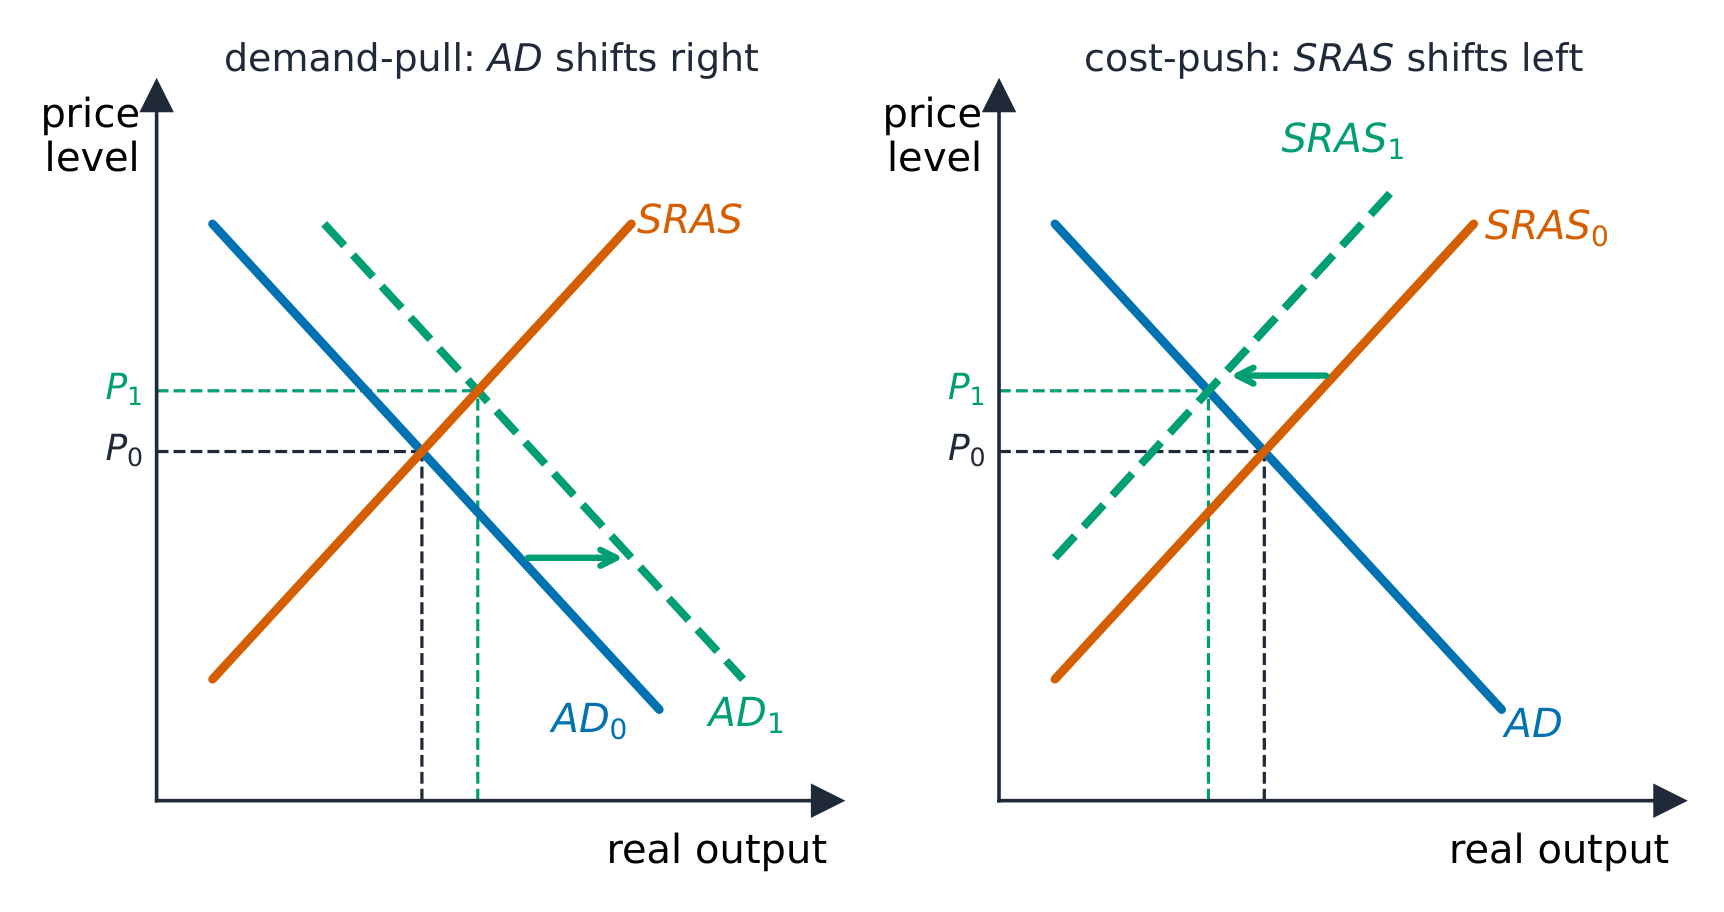
A demand shock shifts AD: a positive one (more spending) raises both price level and output (and lowers unemployment); a negative one lowers both.
A supply shock shifts SRAS: a negative one (higher input costs) raises the price level and lowers output at once – stagflation 滞胀 – the hardest case for policymakers, because fixing one worsens the other.
Enduring Understanding (MOD-2): Economists use the aggregate demand–aggregate supply model to represent the relationship between the price level and aggregate output in an economy and to illustrate how output, employment, and the price level respond to macroeconomic shocks.
Learning Objective MOD-2.I: Explain (using graphs as appropriate) the response of output, employment, and the price level to an aggregate demand or aggregate supply shock in the long run.
MOD-2.I.1 In the long run, in the absence of government policy actions, flexible wages and prices will adjust to restore full employment and unemployment will revert to its natural rate after a shock to aggregate demand or short-run aggregate supply. [See EK MEA-1.E.2]
MOD-2.I.2 Shifts in the long-run aggregate supply curve indicate changes in the full-employment level of output and economic growth.
Source: College Board AP Course and Exam Description · แหล่งที่มา: คำอธิบายหลักสูตรและข้อสอบ College Board AP
English
Left alone, the economy self-corrects through flexible wages:
In a recessionary gap, high unemployment eventually pushes nominal wages down, shifting SRAS right until output returns to $Y_f$ at a lower price level.
In an inflationary gap, labor shortages push wages up, shifting SRAS left back to $Y_f$ at a higher price level.
The debate over how fast this happens is the case for (or against) active policy: self-adjustment is slow and painful, which is the argument for intervening.
Enduring Understanding (POL-1): Fiscal and monetary policy have short-run effects on macroeconomic outcomes.
Learning Objective POL-1.A:
a. Define fiscal policy and related terms.
b. Explain (using graphs as appropriate) the short-run effects of a fiscal policy action.
c. Calculate the short-run effects of a fiscal policy action.
POL-1.A.1 Governments implement fiscal policies to achieve macroeconomic goals, such as full employment.
POL-1.A.2 The tools of fiscal policy are government spending and taxes/transfers.
POL-1.A.3 Changes in government spending affect aggregate demand directly, and changes in taxes/transfers affect aggregate demand indirectly.
POL-1.A.4 The government spending multiplier is greater than the tax multiplier.
POL-1.A.5 Expansionary or contractionary fiscal policies are used to restore full employment when the economy is in a negative (i.e., recessionary) or positive (i.e., inflationary) output gap.
POL-1.A.6 Fiscal policy can influence aggregate demand, real output, and the price level. [See also EK MKT-5.E.2 for the effect on exchange rates.]
POL-1.A.7 The AD–AS model is used to demonstrate the short-run effects of fiscal policy.
Learning Objective POL-1.B: Define why there are lags to discretionary fiscal policy.
POL-1.B.1 In reality, there are lags to discretionary fiscal policy because of factors such as the time it takes to decide on and implement a policy action.
จุดประสงค์การเรียนรู้ POL-1.A:
a. นิยามนโยบายการคลังและคำศัพท์ที่เกี่ยวข้อง
b. อธิบาย (โดยใช้กราฟเมื่อจำเป็น) ผลกระทบระยะสั้นของการดำเนินการนโยบายการคลัง
c. คำนวณผลกระทบระยะสั้นของการดำเนินการนโยบายการคลัง
Source: College Board AP Course and Exam Description · แหล่งที่มา: คำอธิบายหลักสูตรและข้อสอบ College Board AP
English
Fiscal policy 财政政策 is the government's use of spending and taxes to shift AD:
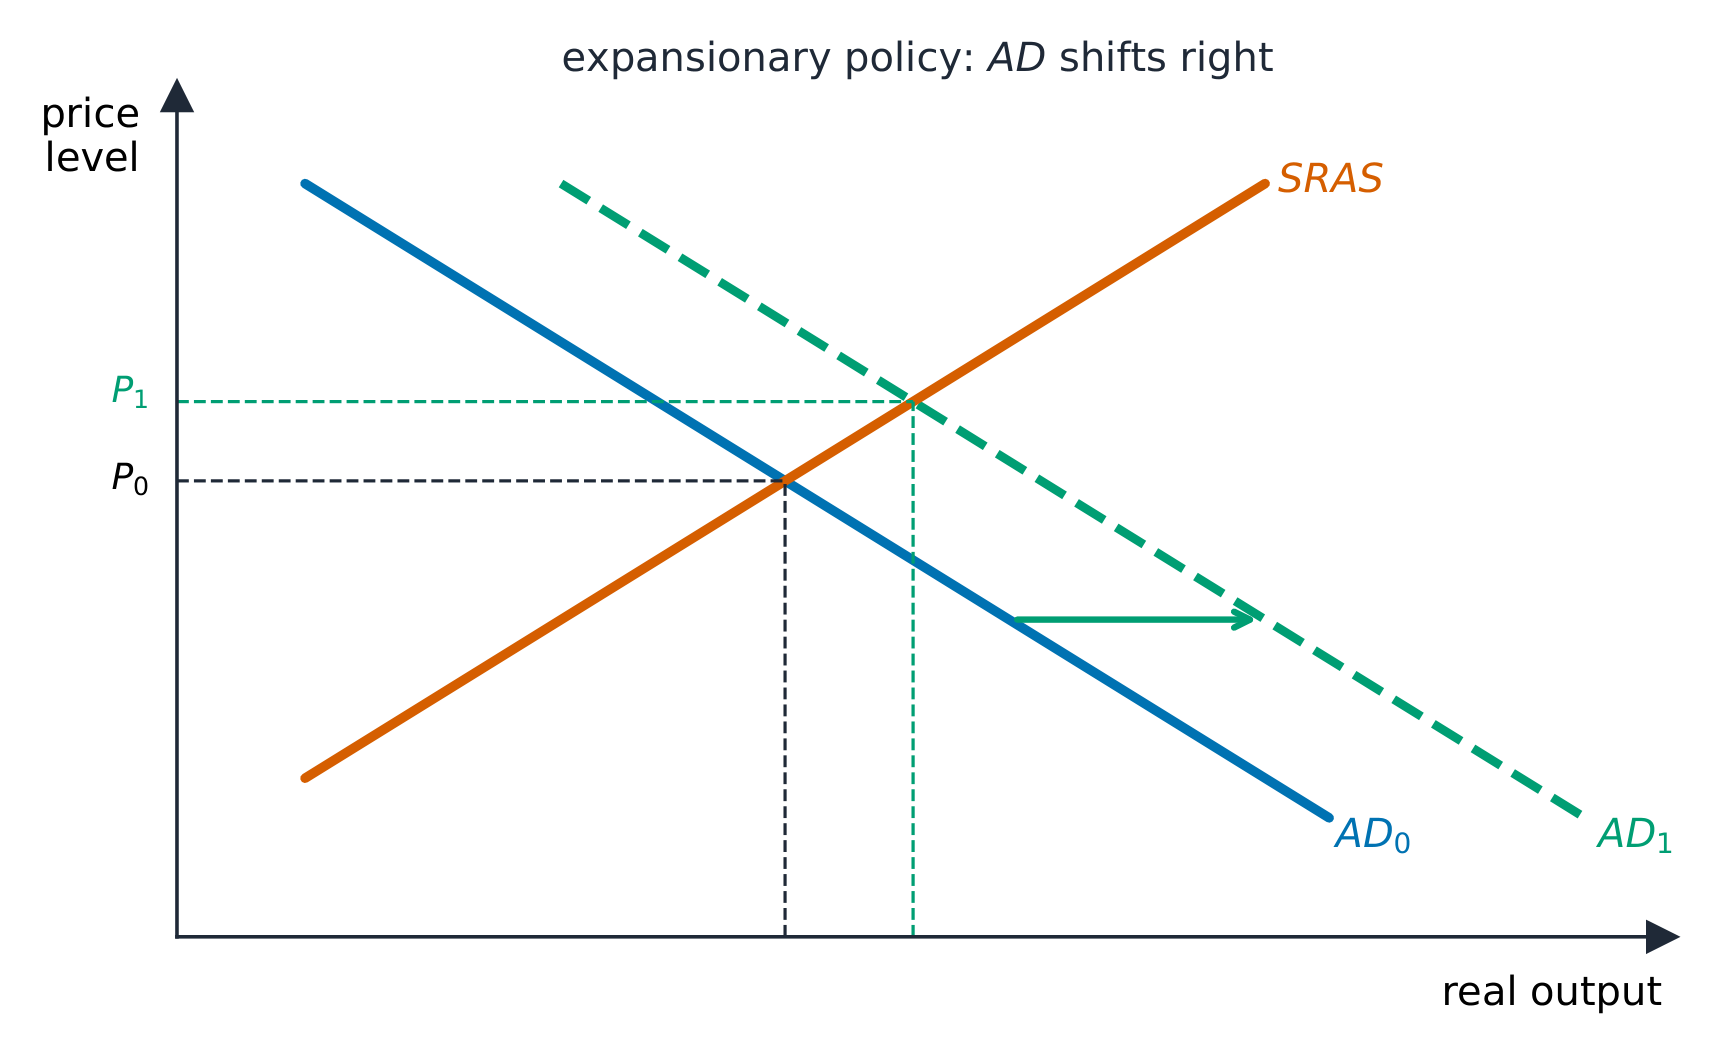
Expansionary 扩张性 (more spending or lower taxes) shifts AD right to close a recessionary gap.
Contractionary 紧缩性 (less spending or higher taxes) shifts AD left to close an inflationary gap.
Size the policy with the multipliers: to close a gap of a given size, the required change in spending is (gap) $\div$ (spending multiplier). Limits include time lags, crowding out (below), and political difficulty.
Worked example. An economy has a $\$100$ billion recessionary gap and $MPC=0.75$ (spending multiplier $=\dfrac{1}{0.25}=4$). To close it, the government must raise spending by $\dfrac{\$100\text{ billion}}{4}=\$25$ billion. Using a tax cut instead (tax multiplier $-3$) would require a larger $\dfrac{100}{3}\approx\$33$ billion cut.
Exam skill: you must draw the correctly labeled AD-AS graph, identify the gap, prescribe the right fiscal action and its direction, and often calculate the exact spending or tax change needed.
ตัวอย่างที่คำนวณแล้ว. เศรษฐกิจมี $\$100$ billion recessionary gap and $MPC=0.75$ (spending multiplier $=\dfrac{1}{0.25}=4$). To close it, the government must raise spending by $\dfrac{\$100\text{ billion}}{4}=\$25$ billion. Using a tax cut instead (tax multiplier $-3$) would require a larger $\dfrac{100}{3}\approx\$33$ พันล้านลดลง
จุดประสงค์การเรียนรู้ POL-1.C:
a. นิยามเครื่องมือปรับสมดุลอัตโนมัติ
b. อธิบายว่าเครื่องมือปรับสมดุลอัตโนมัติช่วยลดความรุนแรงของรอบธุรกิจอย่างไร
POL-1.C.1 เครื่องมือปรับสมดุลอัตโนมัติช่วยสนับสนุนเศรษฐกิจในช่วง recession และช่วยป้องกันไม่ให้เศรษฐกิจร้อนเกินไปในช่วง expansionary periods
POL-1.C.2 รายได้ภาษีลดลงโดยอัตโนมัติเมื่อ GDP ลดลง ป้องกันไม่ให้การบริโภคและเศรษฐกิจตกลงไป更深
POL-1.C.3 รายได้ภาษีเพิ่มขึ้นโดยอัตโนมัติเมื่อ GDP เพิ่มขึ้น ชะลอการบริโภคและป้องกันไม่ให้เศรษฐกิจร้อนเกินไป
POL-1.C.4 นโยบาย institutions หรือหน่วยงานของรัฐอาจมีโปรแกรมบริการสังคมwhose transfer payments ทำหน้าที่เป็นเครื่องมือปรับสมดุลอัตโนมัติ
Source: College Board AP Course and Exam Description · แหล่งที่มา: คำอธิบายหลักสูตรและข้อสอบ College Board AP
English
Automatic stabilizers 自动稳定器 are features that dampen the cycle without new legislation. In a downturn, progressive taxes collect less and transfer payments (unemployment benefits, welfare) rise automatically – cushioning incomes and spending; in a boom they do the reverse. They soften the cycle and act instantly, avoiding the lags of discretionary 相机抉择 policy.
Enduring Understanding (MEA-3): Money makes it possible to compare the value of goods and services, and interest rates provide a measure of the price of money that is borrowed or saved.
Learning Objective MEA-3.A:
a. Define the principal attributes—liquidity, rate of return, and risk—associated with various classes of financial assets, including money.
b. Explain the relationship between the price of previously issued bonds and interest rates.
MEA-3.A.1 The most liquid forms of money are cash and demand deposits.
MEA-3.A.2 Other financial assets people can hold in place of the most liquid forms of money include bonds (interest-bearing assets) and stocks (equity).
MEA-3.A.3 The price of previously issued bonds and interest rates on bonds are inversely related.
MEA-3.A.4 The opportunity cost of holding money is the interest that could have been earned from holding other financial assets such as bonds.
จุดประสงค์การเรียนรู้ MEA-3.A:
a. นิยามคุณสมบัติหลัก—สภาพคล่อง อัตราผลตอบแทน และความเสี่ยง—ที่เกี่ยวข้องกับกลุ่มสินทรัพย์ทางการเงินต่างๆ รวมถึงเงิน
b. อธิบายความสัมพันธ์ระหว่างราคาพันธบัตรที่ออกมาก่อนหน้าและอัตราดอกเบี้ย
Source: College Board AP Course and Exam Description · แหล่งที่มา: คำอธิบายหลักสูตรและข้อสอบ College Board AP
English
A financial asset 金融资产 is a claim that stores value: money, stocks 股票 (ownership shares), bonds 债券 (loans that pay interest), and bank deposits. Assets trade off liquidity 流动性 (how easily converted to cash), risk, and return. A key inverse relationship: bond prices and interest rates move in opposite directions – when market interest rates rise, existing bonds paying the old, lower rate are worth less, so their price falls.
Nominal versus Real Interest Rates · อัตราดอกเบี้ยนามธรรมเทียบกับอัตราดอกเบี้ยจริง
Syllabus · หลักสูตร
English
Enduring Understanding (MEA-3): Money makes it possible to compare the value of goods and services, and interest rates provide a measure of the price of money that is borrowed or saved.
Learning Objective MEA-3.B:
a. Define the nominal and real interest rate.
b. Explain the relationship between changes in nominal interest rates, expected inflation, and real interest rates.
c. Calculate the nominal and real interest rate.
MEA-3.B.1 A nominal interest rate is the rate of interest paid for a loan, unadjusted for inflation.
MEA-3.B.2 Lenders and borrowers establish nominal interest rates as the sum of their expected real interest rate and expected inflation.
MEA-3.B.3 A real interest rate can be calculated in hindsight by subtracting the actual inflation rate from the nominal interest rate.
จุดประสงค์การเรียนรู้ MEA-3.B:
a. นิยามอัตราดอกเบี้ยnominalและreal
b. อธิบายความสัมพันธ์ระหว่างการเปลี่ยนแปลงอัตราดอกเบี้ยnominal,的预期 inflation และอัตราดอกเบี้ยreal
c. คำนวณอัตราดอกเบี้ยnominalและreal
Lenders and borrowers care about the real rate. If inflation turns out higher than expected, real rates fall – helping borrowers and hurting lenders.
Worked example. A loan carries a nominal rate of $6\%$ while inflation runs at $2\%$. The real rate is $6\%-2\%=4\%$, so the lender's purchasing power grows by $4\%$. If inflation instead jumped to $7\%$, the real rate would be $-1\%$ – the lender would actually lose purchasing power.
ตัวอย่างที่คำนวณแล้ว. กู้ยืมมีอัตรานามธรรมอยู่ที่ $6\%$ mientras la inflación corre al $2\%$. The real rate is $6\%-2\%=4\%$, so the lender's purchasing power grows by $4\%$. If inflation instead jumped to $7\%$, the real rate would be $-1\%$ – the lender would actually lose purchasing power.
4.3
The Definition, Measurement, and Functions of Money · นิยาม การวัด และหน้าที่ของเงิน
Syllabus · หลักสูตร
English
Enduring Understanding (MEA-3): Money makes it possible to compare the value of goods and services, and interest rates provide a measure of the price of money that is borrowed or saved.
Learning Objective MEA-3.C:
a. Define money and its functions.
b. Calculate (using data as appropriate) measures of money.
MEA-3.C.1 Money is any asset that is accepted as a means of payment.
MEA-3.C.2 Money serves as a medium of exchange, unit of account, and store of value.
MEA-3.C.3 The money supply is measured using monetary aggregates designated as M1 and M2.
MEA-3.C.4 The monetary base (often labeled as M0 or MB) includes currency in circulation and bank reserves.
MEA-3.C.4 Monetary base (มักเรียกว่า M0 หรือ MB) รวม currency in circulation และbank reserves
Source: College Board AP Course and Exam Description · แหล่งที่มา: คำอธิบายหลักสูตรและข้อสอบ College Board AP
English
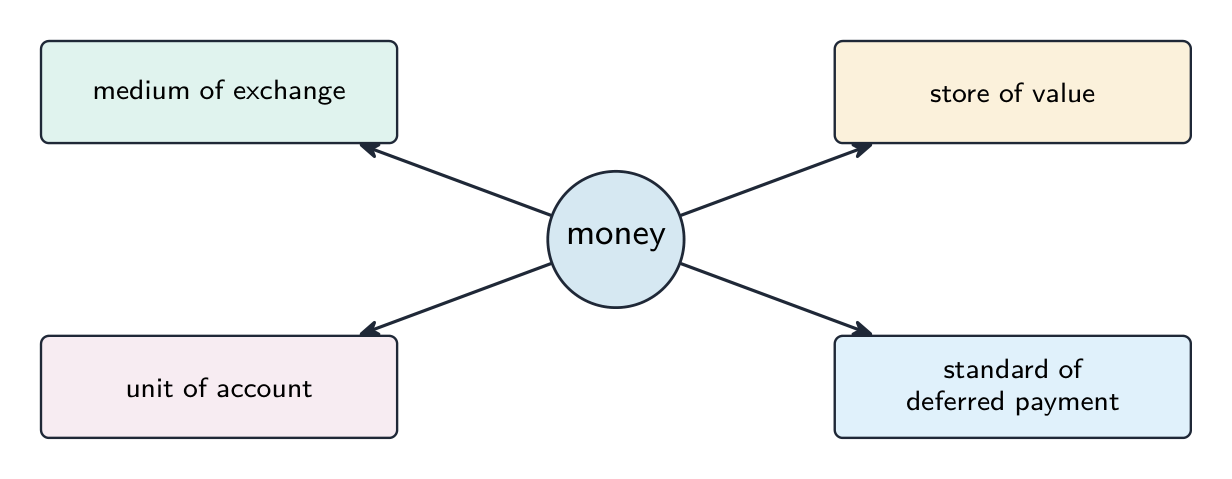
Money 货币 is anything widely accepted in exchange. Its three functions: a medium of exchange 交换媒介 (avoids barter), a unit of account 记账单位 (a common measure of value), and a store of value 价值储藏 (holds value over time). Modern money is fiat money 法定货币 – valuable because the government declares it legal tender and people trust it, not because it is backed by gold.
Money is measured in tiers by liquidity: M1 (currency plus checkable deposits – the most liquid) and the broader M2 (M1 plus savings deposits and other near-money). Below M1 is the monetary base 基础货币 (M0, or MB) – currency in circulation plus bank reserves. The money multiplier equals money supply ÷ monetary base, so a central-bank action that raises reserves expands the money supply by a larger amount through the multiplier.
ไทย
เงิน คือสิ่งanything accepted in exchange. Three functions: a medium of exchange (หลีกเลี่ยงการแลกเปลี่ยนของใช้), a unit of account (มาตรฐานวัดมูลค่าร่วมกัน), and a store of value (รักษามูลค่าไว้ตามเวลา). เงินสมัยใหม่คือ fiat money – มีคุณค่าเพราะรัฐบาลประกาศให้เป็นชำระหนี้ قانون и люди trust it, not because it is backed by gold.
หน้าที่ของเงิน – การสอบ AP ทดสอบสามข้อแรก (medium of exchange, unit of account, store of value); standard of deferred payment อยู่เหนือ CED
เงินถูกวัดในระดับชั้นตามสภาพคล่อง: M1 (เงินสด plus checkable deposits – ที่มีความคล่องตัวมากที่สุด) และ M2 ที่กว้างขึ้น (M1 plus savings deposits และ near-money อื่นๆ) ต่ำกว่า M1 คือ monetary base (M0, หรือ MB) – เงินสดใน circulation plus bank reserves. The money multiplier equals money supply ÷ monetary base, so a central-bank action that raises reserves expands the money supply by a larger amount through the multiplier.
เงินทำงานได้เพราะทุกคนยอมรับมัน: shared unit of account, medium of exchange, และ store of value
Banking and the Expansion of the Money Supply · ธนาคารและการขยายตัวของอุปทานเงิน
Syllabus · หลักสูตร
English
Enduring Understanding (POL-2): The banking system plays an important role in the expansion of the money supply.
Learning Objective POL-2.A:
a. Define key terms related to the banking system and the expansion of the money supply.
b. Explain how the banking system creates and expands the money supply.
c. Calculate (using data and balance sheets as appropriate) the effects of changes in the banking system.
POL-2.A.1 Depository institutions (such as commercial banks) organize their assets and liabilities on balance sheets.
POL-2.A.2 Depository institutions operate using fractional reserve banking.
POL-2.A.3 Banks' reserves are divided into required reserves and excess reserves.
POL-2.A.4 Excess reserves are the basis of expansion of the money supply by the banking system.
POL-2.A.5 The money multiplier is the ratio of the money supply to the monetary base.
POL-2.A.6 The size of expansion of the money supply depends on the money multiplier.
POL-2.A.7 The maximum value of the money multiplier can be calculated as the reciprocal of the required reserve ratio.
POL-2.A.8 The amount predicted by the simple money multiplier may be overstated because it does not take into account a bank's desire to hold excess reserves or the public holding more currency.
Source: College Board AP Course and Exam Description · แหล่งที่มา: คำอธิบายหลักสูตรและข้อสอบ College Board AP
English
Banks operate on a fractional reserve 部分准备金 system: they keep a fraction of deposits as reserves 准备金 and lend the rest. The fraction they must keep is the required reserve ratio 法定准备金率 (rr). Lending creates new deposits, which are re-deposited and re-lent, expanding the money supply by the money multiplier:
$$\text{money multiplier}=\frac{1}{rr}.$$
A new $1000 deposit with$rr=0.1$leaves$$900$in excess reserves, so the banking system can expand the money supply by up to$900\times\frac{1}{0.1}=9,000$. Use a bank's T-account (assets = reserves + loans; liabilities = deposits) to track required reserves and excess reserves 超额准备金 (the amount available to lend).
Worked example. A bank receives a $\$1000$ deposit with $rr=0.20$. It must hold $0.20\times1000=\$200$ as required reserves, leaving $\$800$ of excess reserves to lend. With a money multiplier of $\dfrac{1}{0.20}=5$, that $\$800$ of new lending can expand the money supply by up to $800\times5=\$4000$ across the banking system.
Exam skill: given a required reserve ratio and a deposit, compute excess reserves, the money multiplier, and the maximum change in the money supply.
ไทย
ธนาคารดำเนินธุรกิจภายใต้ระบบ fractional reserve: They keep a fraction of deposits as reserves and lend the rest. The fraction they must keep is the required reserve ratio (rr). Lending creates new deposits, which are re-deposited and re-lent, expanding the money supply by the money multiplier:
$$\text{money multiplier}=\frac{1}{rr}.$$
A new $1000 deposit with$rr=0.1$leaves$$900$in excess reserves, so the banking system can expand the money supply by up to$900\times\frac{1}{0.1}=9,000$. Use a bank's T-account (assets = reserves + loans; liabilities = deposits) to track required reserves and excess reserves (the amount available to lend).
ตัวอย่างที่คำนวณแล้ว. A bank receives a $\$1000$ deposit with $rr=0.20$. It must hold $0.20\times1000=\$200$ as required reserves, leaving $\$800$ of excess reserves to lend. With a money multiplier of $\dfrac{1}{0.20}=5$, that $\$800$ ของ new lending สามารถขยายอุปทานเงินได้สูงสุดถึง $800\times5=\$4000$ across the banking system.
See banks multiply deposits · ดูธนาคารคูณเงินฝาก
Banks keep a fraction of deposits as reserves and lend the rest, which is redeposited and lent again — the money multiplier expands the money supply from the initial deposit. · ธนาคารเก็บเงินฝากไว้บางส่วนเป็นสำรองและให้กู้ส่วนที่เหลือ ซึ่งถูกนำกลับฝากและให้กู้ซ้ำ — ตัวคูณเงิน ขยายอุปทานเงินจากเงินฝากเริ่มต้น
Enduring Understanding (MKT-3): In the money market, demand for and supply of money determine the equilibrium nominal interest rate and influence the value of other financial assets.
Learning Objective MKT-3.A:
a. Define (using graphs as appropriate) the money market, money demand, and money supply.
b. Explain (using graphs as appropriate) the relationship between the nominal interest rate and the quantity of money demanded (supplied).
MKT-3.A.1 The demand for money shows the inverse relationship between the nominal interest rate and the quantity of money people want to hold.
MKT-3.A.2 Given a monetary base determined by a country's central bank, money supply is independent of the nominal interest rate.
Learning Objective MKT-3.B: Define (using graphs as appropriate) equilibrium in the money market.
MKT-3.B.1 In the money market, equilibrium is achieved when the nominal interest rate is such that the quantities demanded and supplied of money are equal.
Learning Objective MKT-3.C: Explain (using graphs as appropriate) how nominal interest rates adjust to restore equilibrium in the money market.
MKT-3.C.1 Disequilibrium nominal interest rates create surpluses and shortages in the money market. Market forces drive nominal interest rates toward equilibrium.
Learning Objective MKT-3.D:
a. Explain (using graphs as appropriate) the determinants of demand and supply in the money market.
b. Explain (using graphs as appropriate) how changes in demand and supply in the money market affect the equilibrium nominal interest rate.
MKT-3.D.1 Factors that shift the demand for money, such as changes in the price level, and supply of money, such as monetary policy, change the equilibrium nominal interest rate.
Source: College Board AP Course and Exam Description · แหล่งที่มา: คำอธิบายหลักสูตรและข้อสอบ College Board AP
English
The money market sets the interest rate
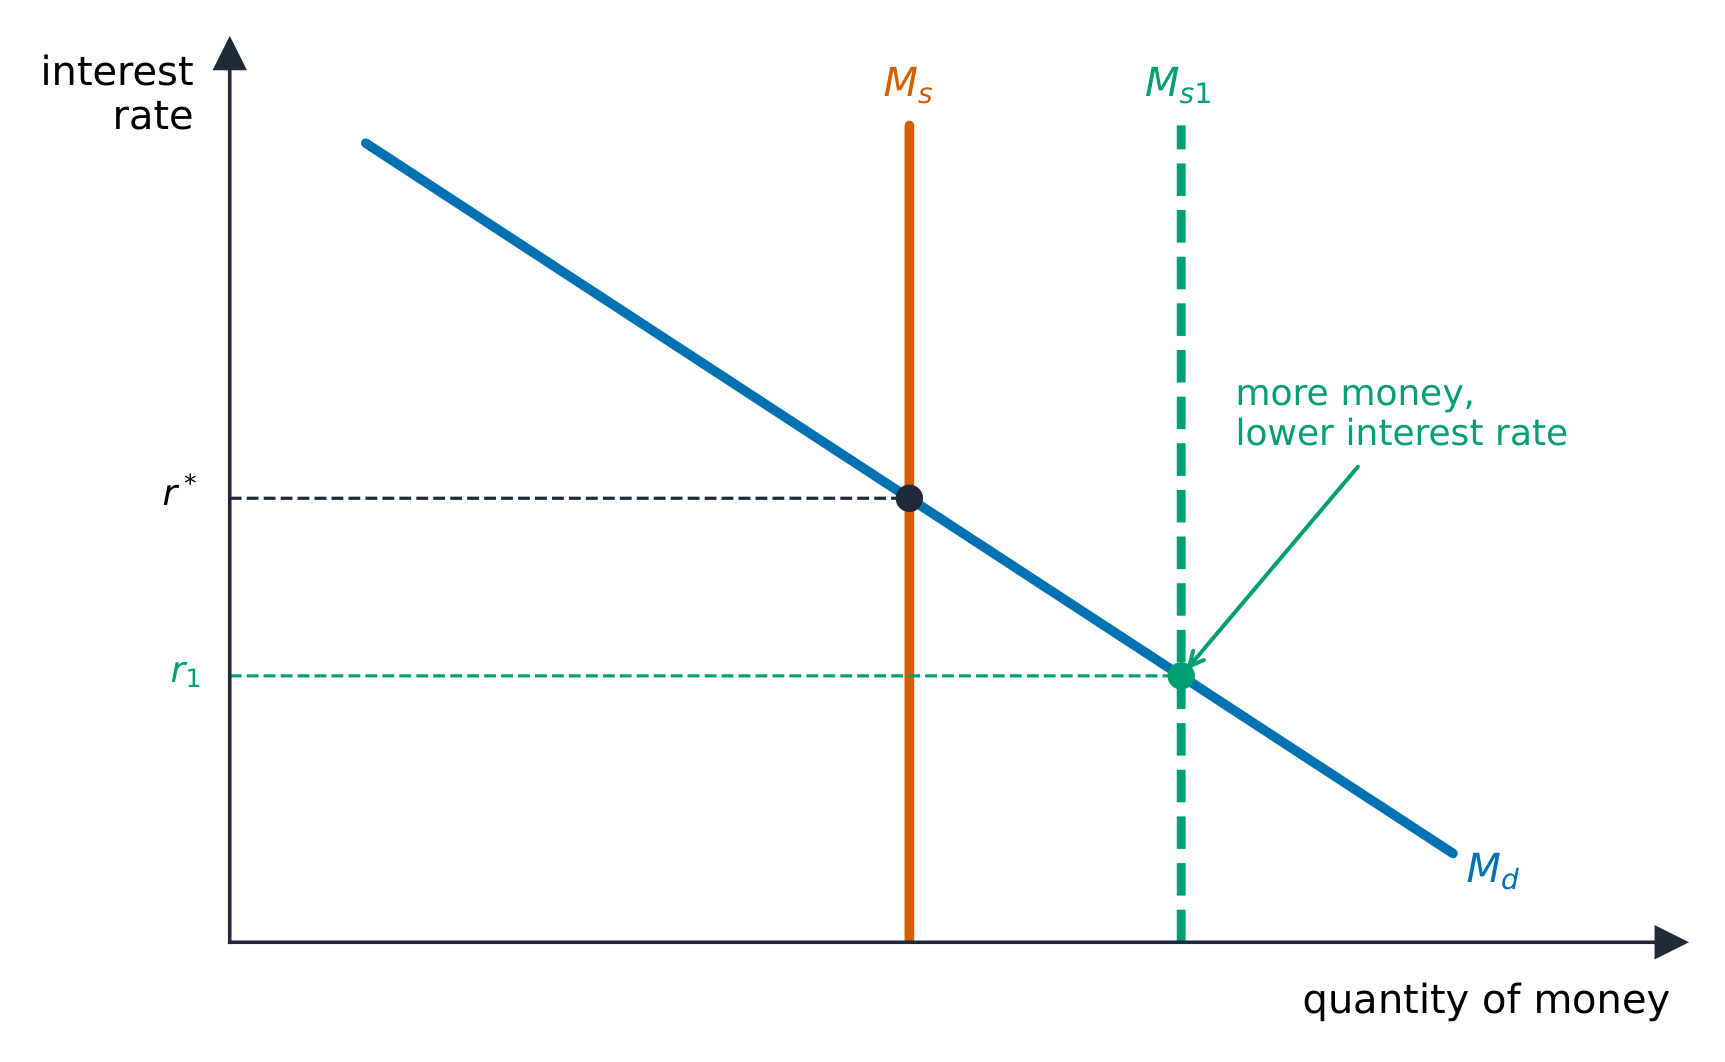
The money market 货币市场 determines the nominal interest rate:
Money demand 货币需求 slopes downward against the interest rate – the rate is the opportunity cost of holding money instead of interest-bearing assets. It shifts right with a higher price level or more real GDP.
Money supply 货币供给 is vertical – set by the central bank, independent of the interest rate.
Their intersection sets the equilibrium interest rate. If the central bank increases the money supply, the supply line shifts right and the interest rate falls.
ไทย
*The money market sets the interest rate
The market determine the nominal interest rate:
*The interest rate is set by the demand for and supply of money
Money demand slopes downward against the interest rate – the rate is the opportunity cost of holding money instead of interest-bearing assets. It shifts right with a higher price level or more real GDP.
Money supply is vertical – set by the central bank, independent of the interest rate.
Equilibrium in the money market · สมดุลในตลาดเงิน
The money market sets the interest rate where money demand meets the central bank's money supply. A change in the money supply moves the interest rate. · ตลาดเงิน กำหนดอัตราดอกเบี้ยเมื่อความต้องการเงินตรงกับอุปทานเงินของธนาคารกลาง การเปลี่ยนแปลงอุปทานเงินจะส่งผลต่ออัตราดอกเบี้ย
Enduring Understanding (POL-1): Fiscal and monetary policy have short-run effects on macroeconomic outcomes.
Learning Objective POL-1.D:
a. Define monetary policy and related terms.
b. Explain (using graphs as appropriate) the short-run effects of a monetary policy action.
c. Calculate (using data and balance sheets as appropriate) the effects of a monetary policy action.
POL-1.D.1 Central banks implement monetary policies to achieve macroeconomic goals, such as price stability.
POL-1.D.2 The tools of monetary policy may include the central bank's discount rate and other administered interest rates (e.g., interest on reserves), open market operations, and the required reserve ratio. The tools used and the way in which they are implemented differ between economies that have limited reserves in their banking system and economies that have ample reserves in their banking system. (The banking system in the United States has ample reserves, and the Federal Reserve's key policy tool is interest on reserves.)
POL-1.D.3 When the central bank conducts an open-market purchase (sale), reserves increase (decrease), thereby increasing (decreasing) the monetary base.
POL-1.D.4 When the central bank conducts an open-market purchase (sale) in an economy with limited reserves, the effect on the money supply is greater than the effect on the monetary base because of the money multiplier.
POL-1.D.5 Many central banks carry out policy to hit a target range for an overnight interbank lending rate, sometimes referred to as the central bank's policy rate. (In the United States, this is the federal funds rate.)
POL-1.D.6 Central banks can influence the nominal interest rate in the short run, which in turn will affect investment and consumption. [See also EK MKT-5.G.2 for the influence on net capital inflows.] In an economy with limited reserves, the central bank can influence the nominal interest rate by changing the money supply. In an economy with ample reserves, changes in the money supply do not effectively change the nominal interest rate; instead, the central bank can influence the nominal interest rate by changing its administered interest rates.
POL-1.D.7 Expansionary or contractionary monetary policies are used to restore full employment when the economy is in a negative (i.e., recessionary) or positive (i.e., inflationary) output gap.
POL-1.D.8 Monetary policy can influence interest rates, aggregate demand, real output, and the price level. [See also EK MKT-5.E.3 for the effect on exchange rates.]
POL-1.D.9 A money market model, a reserve market model, and/or the AD–AS model may be used to demonstrate the short-run effects of monetary policy.
Learning Objective POL-1.E: Define why there are lags to monetary policy.
POL-1.E.1 In reality, there are lags to monetary policy caused by the time it takes to recognize a problem in the economy and the time it takes the economy to adjust to the policy action.
Source: College Board AP Course and Exam Description · แหล่งที่มา: คำอธิบายหลักสูตรและข้อสอบ College Board AP
English
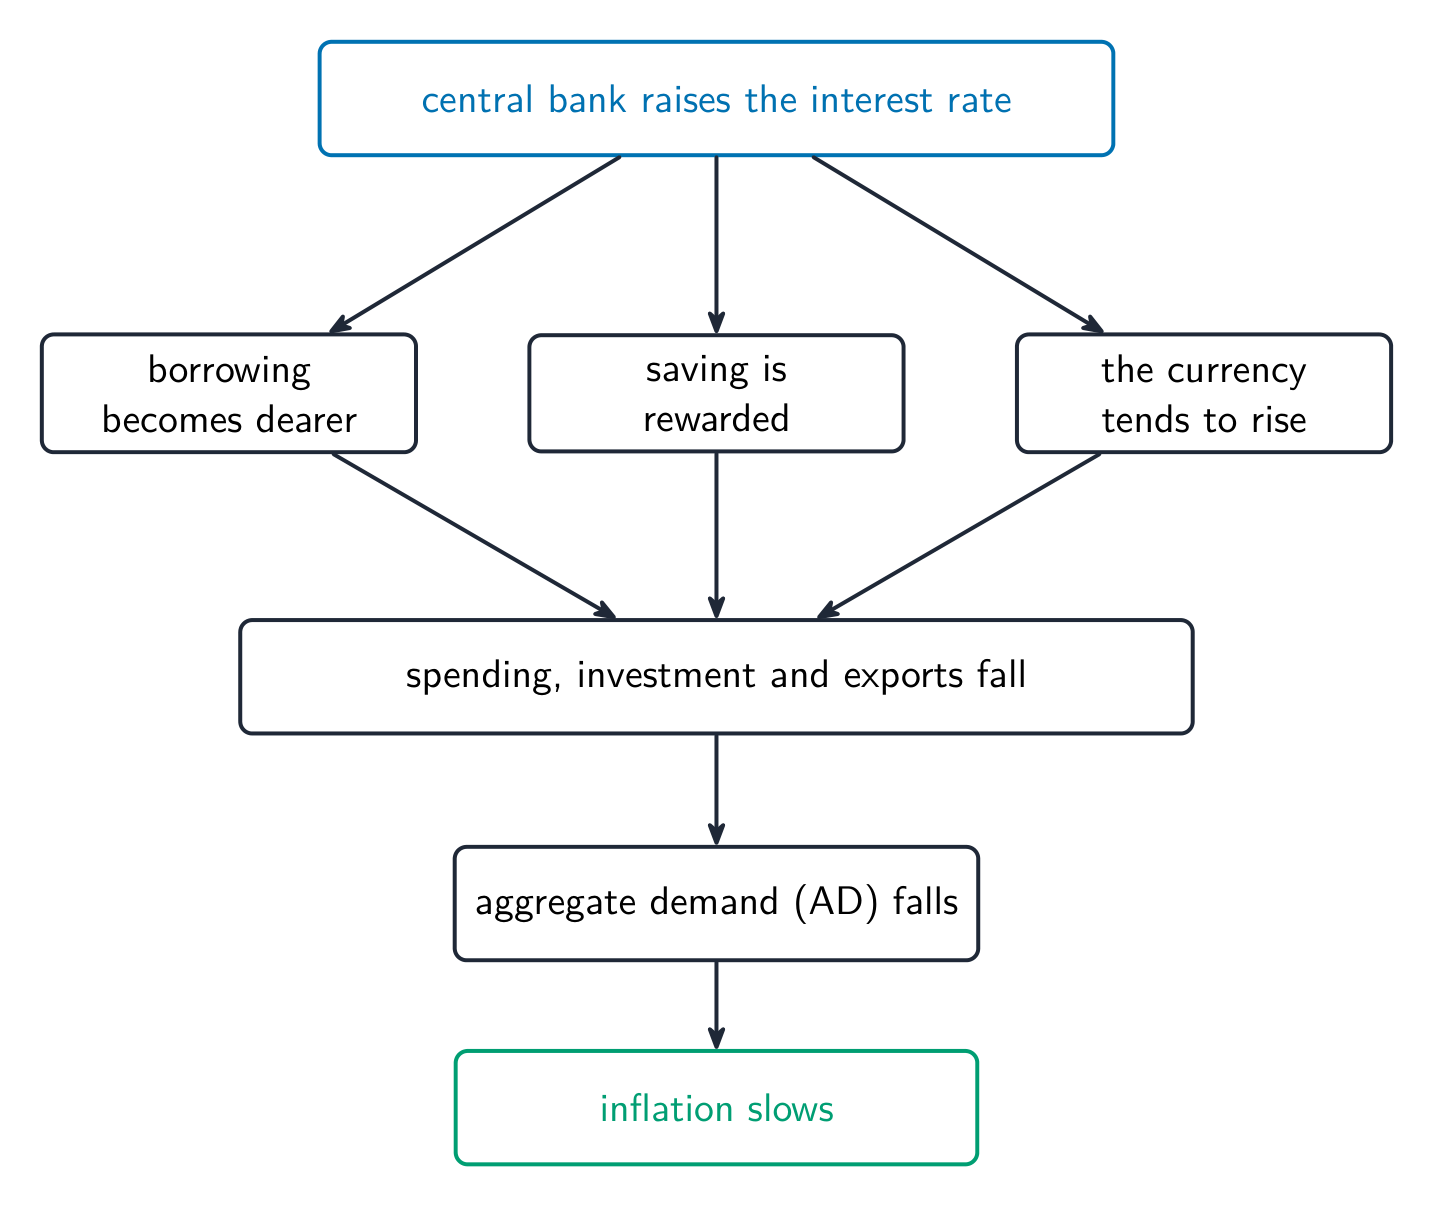
Monetary policy 货币政策 is the central bank's (the Federal Reserve's) use of the money supply to steer the economy, working through the interest rate:
Expansionary (easy) 扩张性: increase the money supply $\to$ interest rate falls $\to$ investment and consumption rise $\to$ AD shifts right (fights recession).
Contractionary (tight) 紧缩性: decrease the money supply $\to$ interest rate rises $\to$ AD shifts left (fights inflation).
Tools: open-market operations 公开市场操作 (buying bonds injects money, selling bonds withdraws it – the main tool), changing the reserve requirement, and changing the discount rate 贴现率 (the rate banks pay to borrow from the central bank). Follow the full chain on the exam: money supply $\to$ interest rate $\to$ investment $\to$ AD $\to$ output, price level, unemployment.
Modern central banks run an ample-reserves system. Rather than nudging the money supply, the Fed sets administered rates – chiefly the interest on reserves (IOR) 准备金利息 it pays banks – and this steers the policy rate 政策利率 (the federal funds rate, the overnight rate banks charge one another). In the reserve market, reserve demand slopes downward while the central bank supplies reserves at its chosen rate; raising IOR lifts the whole policy rate to fight inflation, lowering it eases to fight recession. (In the older limited-reserves system the Fed instead shifted the reserve supply through open-market operations.)
The Loanable Funds Market · ตลาดเงินทุนสำหรับสินเชื่อ
Syllabus · หลักสูตร
English
Enduring Understanding (MKT-4): The interaction of borrowers, who demand loanable funds, and savers, who supply loanable funds, determines the equilibrium real interest rate.
Learning Objective MKT-4.A:
a. Define (using graphs as appropriate) the loanable funds market, demand for loanable funds, and supply of loanable funds.
b. Explain (using graphs as appropriate) the relationship between the real interest rate and the quantity of loanable funds demanded (supplied).
MKT-4.A.1 The loanable funds market describes the behavior of savers and borrowers.
MKT-4.A.2 The demand for loanable funds shows the inverse relationship between real interest rates and the quantity demanded of loanable funds.
MKT-4.A.3 The supply of loanable funds shows the positive relationship between real interest rates and the quantity supplied of loanable funds.
Learning Objective MKT-4.B: Define national savings in both a closed and an open economy.
MKT-4.B.1 In the absence of international borrowing and lending, national savings is the sum of public savings and private savings.
MKT-4.B.2 For an open economy, investment equals national savings plus net capital inflow.
Learning Objective MKT-4.C: Define (using graphs as appropriate) equilibrium in the loanable funds market.
MKT-4.C.1 In the loanable funds market, equilibrium is achieved when the real interest rate is such that the quantities demanded and supplied of loanable funds are equal.
Learning Objective MKT-4.D: Explain (using graphs as appropriate) how real interest rates adjust to restore equilibrium in the loanable funds market.
MKT-4.D.1 Disequilibrium real interest rates create surpluses and shortages in the loanable funds market. Market forces drive real interest rates toward equilibrium.
Learning Objective MKT-4.E:
a. Explain (using graphs as appropriate) the determinants of demand and supply in the loanable funds market.
b. Explain (using graphs as appropriate) how changes in demand and supply in the loanable funds market affect the equilibrium real interest rate and equilibrium quantity of loanable funds.
MKT-4.E.1 The loanable funds market can be used to show the effects of government spending, taxes, and borrowing on interest rates.
MKT-4.E.2 Factors that shift the demand (such as an investment tax credit) and supply (such as changes in saving behavior) of loanable funds change the equilibrium interest rate and the equilibrium quantity of funds.
ไทย
ความเข้าใจที่ยั่งยืน (MKT-4): การมีปฏิสัมพันธ์ระหว่างผู้กู้ which ต้องการเงินกู้ยืมได้และผู้ออม which จ่ายเงินกู้ยืมได้ จะกำหนดอัตราดอกเบี้ยจริงที่สมดุล
Source: College Board AP Course and Exam Description · แหล่งที่มา: คำอธิบายหลักสูตรและข้อสอบ College Board AP
English
The loanable funds market
The loanable funds market 可贷资金市场 determines the real interest rate and connects saving to investment:
Supply of loanable funds comes from saving and slopes upward.
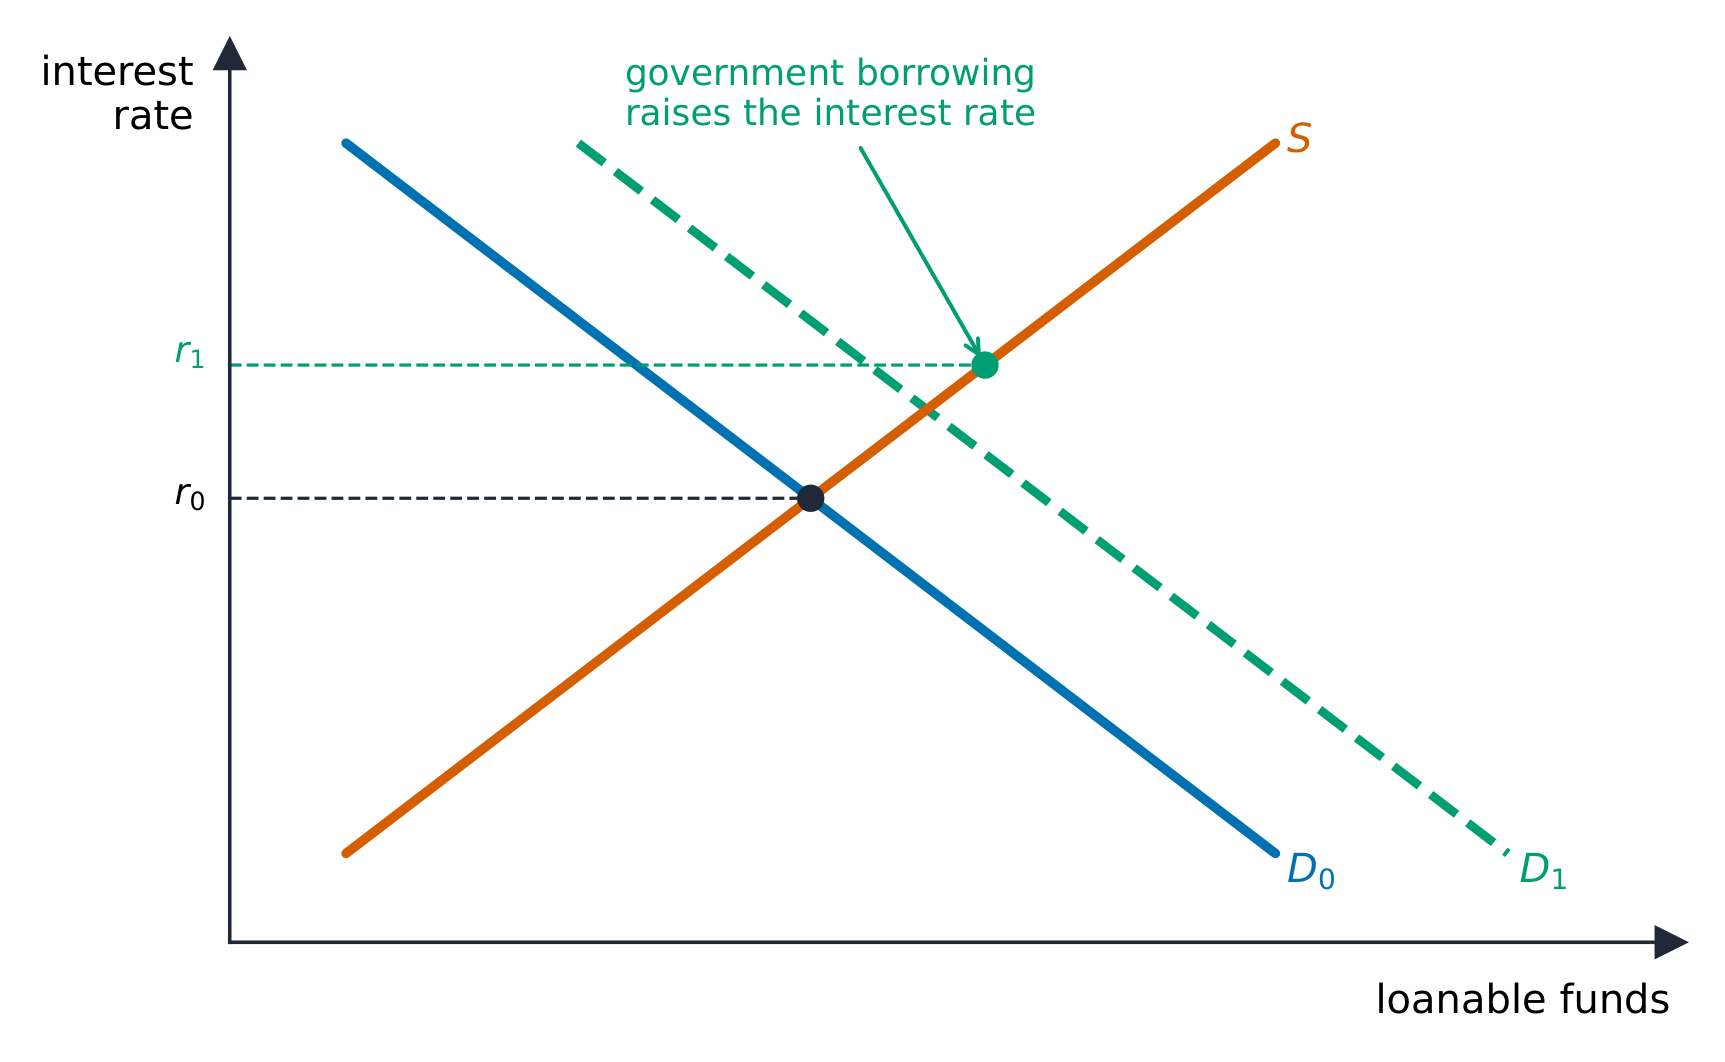
Demand for loanable funds comes from borrowers (firms investing, government borrowing) and slopes downward.
That saving is the economy's national savings 国民储蓄 = private savings (households and firms) + public savings (the government's budget balance – a surplus adds to saving, a deficit subtracts from it). For an open economy, investment = national savings + net capital inflow from abroad. So a bigger budget deficit is negative public saving that shrinks the supply of loanable funds and crowds out investment.
More saving shifts supply right and lowers the real rate; more government borrowing shifts demand right and raises the real rate – the mechanism behind crowding out. Distinguish the two graphs: the money market sets the nominal rate (vertical money supply), while loanable funds sets the real rate (upward-sloping saving supply).
Exam skill: know which graph to draw – money market for monetary policy, loanable funds for saving, deficits, and crowding out – and trace how a shift in one feeds into AD-AS.
Fiscal and Monetary Policy in the Short Run · นโยบายการคลังและการเงินในระยะสั้น
Syllabus · หลักสูตร
English
Enduring Understanding (POL-1): Fiscal and monetary policy have short-run effects on macroeconomic outcomes.
Learning Objective POL-1.F: Explain (using graphs as appropriate) the effects of combined fiscal and monetary policy actions.
POL-1.F.1 A combination of expansionary or contractionary fiscal and monetary policies may be used to restore full employment when the economy is in a negative (i.e., recessionary) or positive (i.e., inflationary) output gap.
POL-1.F.2 A combination of fiscal and monetary policies can influence aggregate demand, real output, the price level, and interest rates. [For additional details on fiscal and monetary policy actions and how to demonstrate their effects graphically, see LO POL-1.A and LO POL-1.D.]
POL-1.F.2 การผสมผสานนโยบายการคลังและนโยบายการเงินสามารถมีผลต่ออัตราการใช้จ่ายรวม ผลผลิตจริง ระดับราคา และอัตราดอกเบี้ย [สำหรับรายละเอียดเพิ่มเติมเกี่ยวกับการดำเนินนโยบายการคลังและนโยบายการเงิน以及如何แสดงผลกระทบด้วยกราฟ ดูที่ LO POL-1.A และ LO POL-1.D]
Source: College Board AP Course and Exam Description · แหล่งที่มา: คำอธิบายหลักสูตรและข้อสอบ College Board AP
English
Both policies work by shifting AD in the short run. Fiscal policy 财政政策 changes government spending or taxes; monetary policy 货币政策 changes the money supply and thus the interest rate. They can work together (both expansionary to fight a deep recession) or be mixed (e.g. loose fiscal + tight monetary). In the short run, expansionary policy raises output and the price level and lowers unemployment; contractionary policy does the reverse.
Use policy to shift aggregate demand · ใช้นโยบายเพื่อเลื่อนเส้นอุปสงค์รวม
In the short run, fiscal (spending/taxes) and monetary (interest-rate) policy shift aggregate demand, moving real GDP and the price level along short-run aggregate supply. · ในระยะสั้น นโยบายการคลัง (การใช้จ่าย/ภาษี) และ นโยบายการเงิน (อัตราดอกเบี้ย) เปลี่ยนแปลง อุปสงค์รวม ซึ่งทำให้ GDP จริงและระดับราคาเคลื่อนที่ไปตามเส้นอุปทานรวมระยะสั้น
5.2
The Phillips Curve · กราฟPhillips
Syllabus · หลักสูตร
English
Enduring Understanding (MOD-3): The Phillips curve model is used to represent the relationship between inflation and unemployment and to illustrate how macroeconomic shocks affect inflation and unemployment.
Learning Objective MOD-3.A:
a. Define (using graphs as appropriate) the short-run Phillips curve and the long-run Phillips curve.
b. Explain (using graphs as appropriate) short-run and long-run equilibrium in the Phillips curve model.
MOD-3.A.1 The short-run trade-off between inflation and unemployment can be illustrated by the downward-sloping short-run Phillips curve (SRPC).
MOD-3.A.2 An economy is always operating somewhere along the SRPC.
MOD-3.A.3 The long-run relationship between inflation and unemployment can be illustrated by the long-run Phillips curve (LRPC), which is vertical at the natural rate of unemployment.
MOD-3.A.4 Long-run equilibrium corresponds to the intersection of the SRPC and the LRPC.
MOD-3.A.5 Points to the left of long-run equilibrium represent inflationary gaps, while points to the right of long-run equilibrium represent recessionary gaps.
Learning Objective MOD-3.B: Explain (using graphs as appropriate) the response of unemployment and inflation in the short run and in the long run.
MOD-3.B.1 Demand shocks correspond to movement along the SRPC.
MOD-3.B.2 Supply shocks correspond to shifts of the SRPC.
MOD-3.B.3 Factors that cause the natural rate of unemployment to change will cause the LRPC to shift.
Source: College Board AP Course and Exam Description · แหล่งที่มา: คำอธิบายหลักสูตรและข้อสอบ College Board AP
English
The short-run Phillips curve
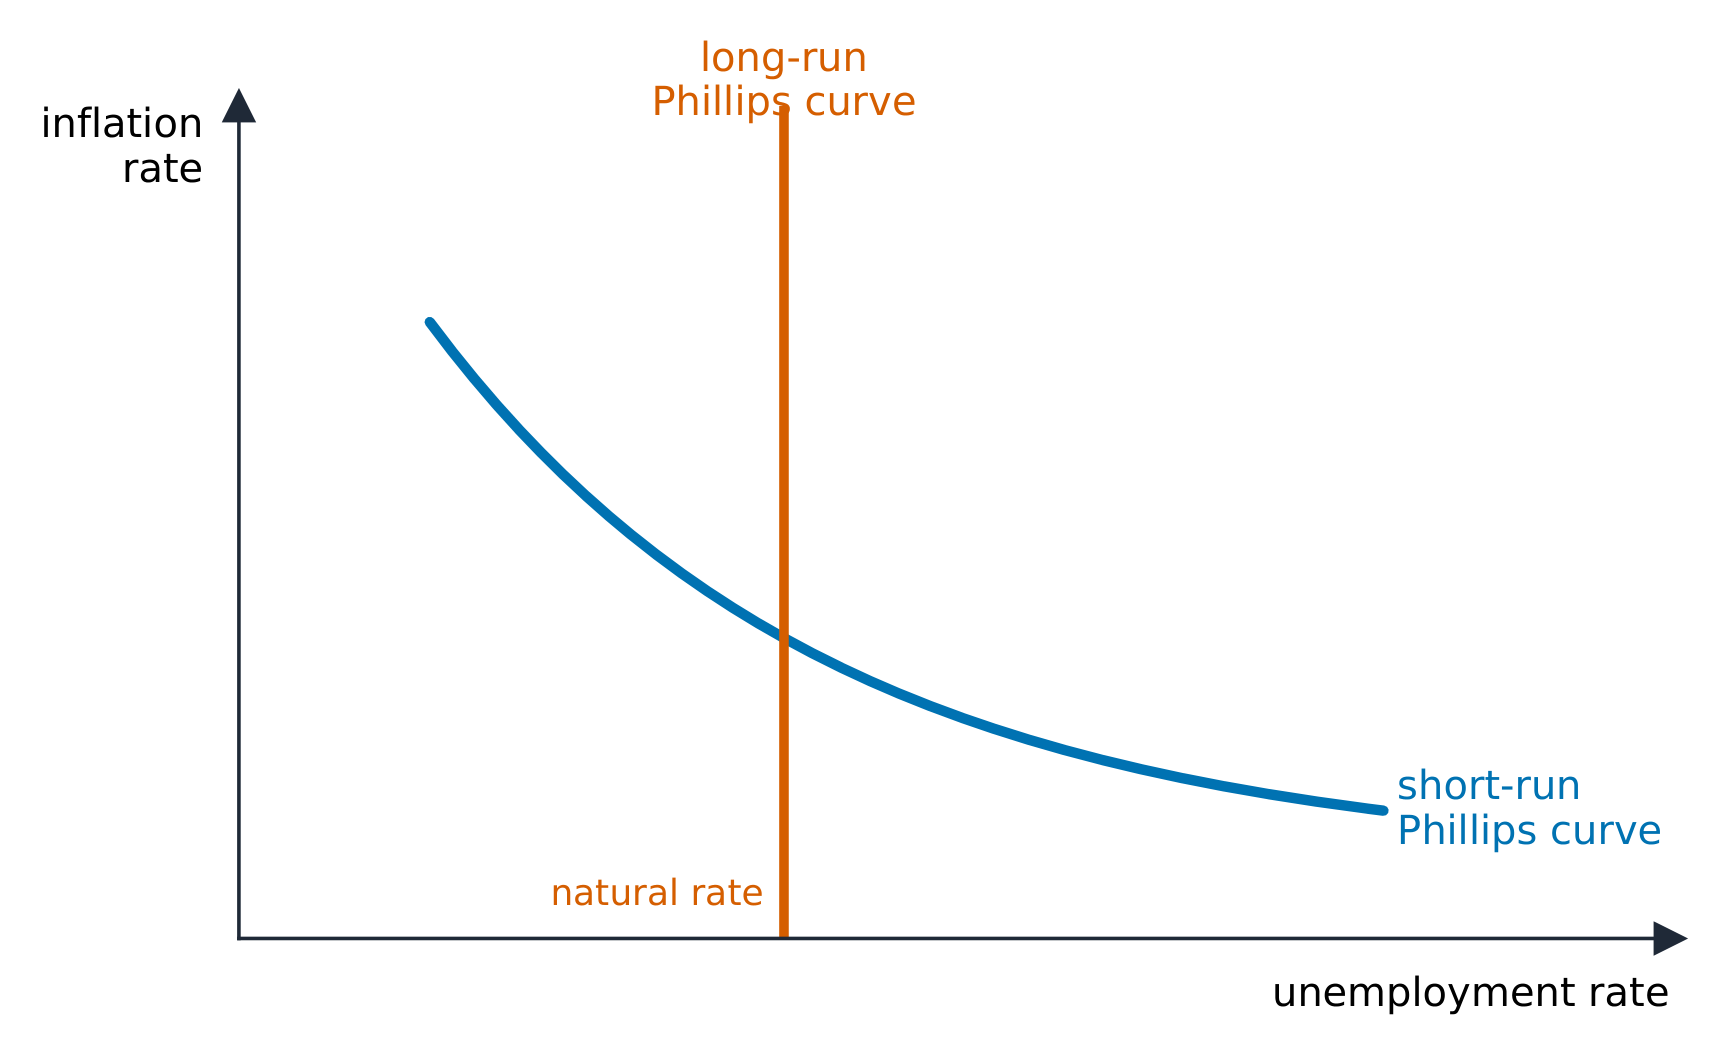
The Phillips curve 菲利普斯曲线 shows the short-run trade-off between inflation and unemployment:
The short-run Phillips curve (SRPC) 短期菲利普斯曲线 slopes downward – lower unemployment comes with higher inflation. It is the mirror image of AD-AS: a rightward AD shift moves the economy up-left along the SRPC (less unemployment, more inflation).
The long-run Phillips curve (LRPC) 长期菲利普斯曲线 is vertical at the natural rate of unemployment 自然失业率 – the counterpart of vertical LRAS. In the long run there is no trade-off: policy changes inflation, not unemployment.
A supply shock shifts the SRPC (a negative shock moves it right – worse inflation and unemployment, i.e. stagflation). A change in expected inflation also shifts the SRPC.
Exam skill: link the AD-AS and Phillips graphs – a recessionary gap in AD-AS corresponds to a point on the SRPC to the right of the natural rate; know what shifts SRPC versus moves along it.
natural rate of unemployment/ˈnætʃərəl reɪt ɒv ʌnemˈplɔɪmənt/
อัตราการว่างงานตามธรรมชาติ
5.3
Money Growth and Inflation · การเติบโตของเงินและเงินเฟ้อ
Syllabus · หลักสูตร
English
Enduring Understanding (POL-3): There are long-run implications of monetary and fiscal policy.
Learning Objective POL-3.A:
a. Explain (using graphs as appropriate) how inflation is a monetary phenomenon.
b. Define the quantity theory of money.
c. Calculate the money supply, velocity, the price level, and real output using the quantity theory of money.
POL-3.A.1 Inflation (deflation) results from increasing (decreasing) the money supply at too rapid of a rate for a sustained period of time.
POL-3.A.2 When the economy is at full employment, changes in the money supply have no effect on real output in the long run.
POL-3.A.3 In the long run, the growth rate of the money supply determines the growth rate of the price level (inflation rate) according to the quantity theory of money.
Source: College Board AP Course and Exam Description · แหล่งที่มา: คำอธิบายหลักสูตรและข้อสอบ College Board AP
English
In the long run, inflation is a monetary phenomenon. The quantity theory of money 货币数量论 states $M\times V = P\times Y$ (money supply $\times$ velocity $=$ price level $\times$ real output). With velocity $V$ and real output $Y$ roughly stable in the long run, growth in the money supply translates almost one-for-one into inflation. Printing money faster than the economy grows raises the price level, not real output – the root of high inflation and, in the extreme, hyperinflation 恶性通货膨胀.
Worked example. Suppose the money supply grows $8\%$ per year while real output $Y$ grows $3\%$ and velocity $V$ is stable. Rearranging $M\times V=P\times Y$ into growth rates, inflation $\approx 8\%-3\%=5\%$. The $5\%$ of money growth not matched by extra output simply becomes higher prices.
ไทย
In the long run, inflation is a monetary phenomenon. The quantity theory of money states $M\times V = P\times Y$ (money supply $\times$ velocity $=$ price level $\times$ real output). With velocity $V$ and real output $Y$ roughly stable in the long run, growth in the money supply translates almost one-for-one into inflation. Printing money faster than the economy grows raises the price level, not real output – the root of high inflation and, in the extreme, hyperinflation.
Link money growth to inflation · เชื่อมโยงการเติบโตของเงินกับอัตราเงินเฟ้อ
The quantity theory$MV=PY$: with output and velocity roughly fixed, the price level moves in proportion to the money supply — too much money chasing the same goods is inflation. · ทฤษฎีปริมาณเงิน$MV=PY$: เมื่อผลผลิตและความเร็วหมุนเวียนมีค่าคงที่โดยประมาณ ระดับราคาจะเปลี่ยนแปลง ตามสัดส่วน กับปริมาณเงิน — การที่มีเงินมากเกินไปในการซื้อสินค้าเดิมคือสาเหตุของภาวะเงินเฟ้อ
quantity theory of money/ˈkwɒntɪti ˈθɪəri ɒv ˈmʌni/
ทฤษฎีปริมาณเงิน
hyperinflation/ˌhaɪpərɪnˈfleɪʃn/
เงินเฟ้อรุนแรง
budget deficit/ˈbʌdʒɪt ˈdefɪsɪt/
ขาดดุลงบประมาณ
surplus/ˈsɜːpləs/
ส่วนเกิน
national debt/ˈnæʃənl det/
หนี้สาธารณะ
5.4
Government Deficits and the National Debt · ขาดดุลงบประมาณและหนี้สาธารณะ
Syllabus · หลักสูตร
English
Enduring Understanding
Learning Objective
Essential Knowledge
POL-3
There are long-run implications of monetary and fiscal policy.
POL-3.B
a. Define the government budget surplus (deficit) and national debt.
b. Explain the issues involved with the burden of the national debt.
POL-3.B.1 The government budget surplus (deficit) is the difference between tax revenues and government purchases plus transfer payments in a given year.
POL-3.B.2 A government adds to the national debt when it runs a budget deficit.
POL-3.B.3 A government must pay interest on its accumulated debt, thus increasing the national debt and increasingly forgoing using those funds for alternative uses. [See also LO POL-3.C on crowding out.]
POL-3.B
ก. นิยาม政府 budget surplus (deficit) และ national debt
ข. อธิบายปัญหาที่เกี่ยวข้องกับภาระของ national debt
POL-3.B.1 Government budget surplus (deficit) คือความแตกต่างระหว่าง tax revenues กับ government purchases plus transfer payments ใน某一 year
POL-3.B.2 Government จะเพิ่ม national debt เมื่อมี budget deficit
POL-3.B.3 Government ต้องจ่ายดอกเบี้ยบน accumulated debt ของตนเอง ซึ่งทำให้ national debt เพิ่มขึ้นและ increasingly forgoing using those funds for alternative uses. [ดูHEADER LO POL-3.C เรื่อง crowding out]
Source: College Board AP Course and Exam Description · แหล่งที่มา: คำอธิบายหลักสูตรและข้อสอบ College Board AP
English
A budget deficit 预算赤字 occurs when government spending exceeds tax revenue in a year (a surplus 盈余 is the reverse). The accumulated total of past deficits is the national debt 国债. Deficits are financed by borrowing – selling government bonds – which adds to the debt and to future interest payments. Persistent deficits raise concerns about crowding out and the burden of servicing the debt.
POL-3
There are long-run implications of monetary and fiscal policy.
POL-3.C
a. Define crowding out.
b. Explain (using graphs as appropriate) how fiscal policy may cause crowding out.
POL-3.C.1 When a government is in budget deficit, it typically borrows to finance its spending.
POL-3.C.2 A loanable funds market model can be used to show the effect of government borrowing on the equilibrium real interest rate and the resulting crowding out of private investment. [See MKT-4]
POL-3.C.3 Crowding out refers to the adverse effect of increased government borrowing, which leads to decreased levels of interest-sensitive private sector spending in the short run.
POL-3.C.4 A potential long-run impact of crowding out is a lower rate of physical capital accumulation and less economic growth as a result.
POL-3.C.2 Loanable funds market model สามารถใช้เพื่อแสดง effect ของ government borrowing ต่อ equilibrium real interest rate และ resulting crowding out of private investment. [ดูHEADER MKT-4]
POL-3.C.3 Crowding out หมายถึง adverse effect ของ increased government borrowing ซึ่งนำไปสู่ decreased levels of interest-sensitive private sector spending ในระยะสั้น
POL-3.C.4 Potential long-run impact ของ crowding out คือ lower rate of physical capital accumulation และ less economic growth เป็นผลมา
Source: College Board AP Course and Exam Description · แหล่งที่มา: คำอธิบายหลักสูตรและข้อสอบ College Board AP
English
Crowding out 挤出效应 is the main long-run cost of deficit-financed fiscal policy. When the government borrows heavily, it increases the demand for loanable funds, raising the real interest rate. Higher rates reduce private investment (and interest-sensitive consumption). So expansionary fiscal policy partly cancels itself: the AD boost is offset by weaker investment. Worse, less investment today means a smaller capital stock and slower long-run growth.
Exam skill: show crowding out on the loanable funds graph – government borrowing shifts demand right, the real interest rate rises, and private investment falls.
Worked example. A government borrows $\$500$ billion to finance a deficit. On the loanable funds market this shifts the demand for funds right, pushing the real interest rate up (say from $3\%$ to $4\%$). At the higher rate firms scale back investment – perhaps by $\$150$ billion – so the net boost to AD is smaller than the $\$500$ billion, and the lost investment slows long-run growth.
ตัวอย่างการคำนวณ รัฐบาลกู้ยืม $\$500$ billion to finance a deficit. On the loanable funds market this shifts the demand for funds right, pushing the real interest rate up (say from $3%$ to $4%$). At the higher rate firms scale back investment – perhaps by $\$150$ พันล้านดอลลาร์ – ดังนั้นการกระตุ้น AD สุทธิจึงน้อยกว่า $\$500$ พันล้านดอลลาร์ และการสูญเสียการลงทุนจะทำให้การเติบโตระยะยาวชะลอตัวลง
5.6
Economic Growth · การเติบโตทางเศรษฐกิจ
Syllabus · หลักสูตร
English
Enduring Understanding
Learning Objective
Essential Knowledge
MEA-2
The economy fluctuates between periods of expansion and contraction in the short run, but economic growth can occur in the long run.
MEA-2.B
a. Define measures and determinants of economic growth.
b. Explain (using graphs and data as appropriate) the determinants of economic growth.
c. Calculate (using graphs and data as appropriate) per capita GDP and economic growth.
MEA-2.B.1 Economic growth can be measured as the growth rate in real GDP per capita over time.
MEA-2.B.2 Aggregate employment and aggregate output are directly related because firms need to employ more workers in order to produce more output, holding other factors constant. This is captured by the aggregate production function.
MEA-2.B.3 Output per employed worker is a measure of average labor productivity.
MEA-2.B.4 Productivity is determined by the level of technology and physical and human capital per worker.
MEA-2.B.5 The aggregate production function shows that output per capita is positively related to both physical and human capital per capita.
MEA-2.B.1 Economic growth สามารถวัดได้ bằng growth rate of real GDP per capita over time
MEA-2.B.2 Aggregate employment และaggregate output มีความสัมพันธ์โดยตรงเพราะ firms ต้อง employ workers มากขึ้นเพื่อ produce output มากขึ้น โดยคง other factors ไว้ This is captured by the aggregate production function
MEA-2.B.3 Output per employed worker เป็น measure ของ average labor productivity
MEA-2.B.4 Productivity ถูกกำหนดโดยระดับ technology และ physical และ human capital ต่อ worker
MEA-2.B.5 Aggregate production function แสดงว่า output per capita มีความสัมพันธ์เชิงบวกทั้ง physical และ human capital per capita
Source: College Board AP Course and Exam Description · แหล่งที่มา: คำอธิบายหลักสูตรและข้อสอบ College Board AP
English
Economic growth 经济增长 is a sustained rise in real GDP per capita – the true source of higher living standards. It comes from more or better resources and is shown as a rightward shift of LRAS (and an outward shift of the PPC). Its main drivers:
physical capital 实物资本 (more tools and machines per worker),
human capital 人力资本 (education, skills, health),
technology 技术 and innovation,
productivity 生产率 (output per worker) growth, the deepest driver.
Economic growth pushes the frontier out · การเติบโตทางเศรษฐกิจดันเส้นขอบเขตออกไป
Economic growth — more resources, better technology — shifts the whole production possibilities frontier outward, letting the economy produce more of everything. · การเติบโตทางเศรษฐกิจ — มีทรัพยากรมากขึ้น เทคโนโลยีดีขึ้น — ทำให้ เส้นขอบเขตความเป็นไปได้ในการผลิต ทั้งเส้นเลื่อนออกด้านนอก ทำให้เศรษฐกิจสามารถผลิตสิ่งต่างๆ ได้มากขึ้น
5.7
Public Policy and Economic Growth · นโยบายสาธารณะและการเติบโตทางเศรษฐกิจ
Syllabus · หลักสูตร
English
Enduring Understanding
Learning Objective
Essential Knowledge
POL-4
Authorities and organizations institute policies that affect economic growth.
POL-4.A
a. Explain (using graphs as appropriate) public policies aimed at influencing long-run economic growth.
b. Define supply-side fiscal policies.
[For a description of economic growth and information about how to show it graphically, see LO MEA-2.B, LO MOD-1.B, and LO MOD-2.I]
POL-4.A.1 Public policies that impact productivity and labor force participation affect real GDP per capita and economic growth.
POL-4.A.2 Government policies that invest in infrastructure and technology affect growth.
POL-4.A.3 Supply-side fiscal policies affect aggregate demand, aggregate supply, and potential output in the short run and long run by influencing incentives that affect household and business economic behavior.
ไทย
Enduring Understanding
Learning Objective
Essential Knowledge
POL-4
Authorities และ organizations institute policies ที่ affect economic growth
POL-4.A
ก. อธิบาย (โดยใช้กราฟเมื่อเหมาะสม) public policies ที่มีเป้าหมายเพื่อ influencing long-run economic growth
ข. นิยาม supply-side fiscal policies
[สำหรับคำอธิบาย关于economic growth และข้อมูลเกี่ยวกับวิธีแสดง graphically ดูHEADER LO MEA-2.B, LO MOD-1.B และ LO MOD-2.I]
POL-4.A.1 Public policies ที่影响 productivity และlabor force participation会影响real GDP per capita และeconomic growth
POL-4.A.2 Government policies ที่ลงทุนใน infrastructure และ technology会影响growth
Source: College Board AP Course and Exam Description · แหล่งที่มา: คำอธิบายหลักสูตรและข้อสอบ College Board AP
English
Governments can raise long-run growth by policies that build capital and productivity: investment in infrastructure and education, research and development incentives, protecting property rights 产权 and the rule of law, encouraging saving and investment (which finances capital), and keeping inflation low and stable. The recurring long-run theme: policies that crowd out or discourage investment slow growth, while those that encourage capital formation speed it up.
Balance of Payments Accounts · บัญชีดุลการชำระเงิน
Syllabus · หลักสูตร
English
Enduring Understanding
Learning Objective
Essential Knowledge
MEA-4
Foreign trade accounting measures the flow of goods, services, and financial capital between countries.
MEA-4.A
a. Define the current account (CA), the capital and financial account (CFA), and the balance of payments (BOP).
b. Explain how changes in the components of the CA and CFA affect a country's BOP.
c. Calculate the CA, the CFA, and the BOP.
MEA-4.A.1 The current account (CA) records net exports, net income from abroad, and net unilateral transfers.
MEA-4.A.2 The CA is not always balanced; it may show a surplus or a deficit. A nation's balance of trade (i.e., net exports) is part of the current account and may also show a surplus or a deficit.
MEA-4.A.3 The capital and financial account (CFA) records financial capital transfers and purchases and sales of assets between countries.
MEA-4.A.4 The CFA is not always balanced; it may show a surplus (financial capital inflow) or a deficit (financial capital outflow).
MEA-4.A.5 The balance of payments (BOP) is an accounting system that records a country's international transactions for a particular time period. It consists of the CA and the CFA.
MEA-4.A.6 Any transaction that causes money to flow into a country is a credit to its BOP account, and any transaction that causes money to flow out is a debit. The sum of all credit entries should match the sum of all debit entries ($CA + CFA = 0$).
MEA-4.A
ก. นิยามcurrent account (CA), capital and financial account (CFA) และbalance of payments (BOP)
ข. อธิบายว่าการเปลี่ยนแปลงใน components ของ CA และ CFA会影响一个国家's BOP อย่างไร
ค. คำนวณ CA, CFA และBOP
MEA-4.A.1 Current account (CA) บันทึก net exports, net income จากต่างประเทศ และnet unilateral transfers
MEA-4.A.2 CA ไม่ได้สมดุลเสมอไป; อาจแสดง surplus หรือdeficit Balance of trade ของประเทศ (即 net exports) เป็นส่วนหนึ่งของ current account และอาจแสดง surplus หรือdeficit เช่นกัน
MEA-4.A.3 Capital and financial account (CFA) บันทึก financial capital transfers และpurchases และsales ของ assets ระหว่างประเทศ
MEA-4.A.4 CFA ไม่ได้สมดุลเสมอไป; อาจแสดง surplus (financial capital inflow) หรือdeficit (financial capital outflow)
MEA-4.A.5 Balance of payments (BOP) เป็นaccounting system ที่บันทึกinternational transactions ของประเทศในช่วงเวลาหนึ่ง particular time period ประกอบด้วย CA และCFA
MEA-4.A.6 Any transaction causing money flow into a country เป็นcredit to its BOP account และany transaction causing money flow out เป็นdebit ผลรวมของ credit entries ทั้งหมดควรเท่ากับผลรวมของ debit entries ทั้งหมด ($CA + CFA = 0$)
Source: College Board AP Course and Exam Description · แหล่งที่มา: คำอธิบายหลักสูตรและข้อสอบ College Board AP
English
The balance of payments 国际收支 records all transactions between a country and the rest of the world, in two main accounts:
The current account 经常账户 tracks trade in goods and services (exports minus imports), plus income and transfers. A trade deficit makes it negative.
The capital (financial) account 资本账户 tracks flows of financial assets – foreigners buying domestic assets, and residents buying foreign assets.
The two are mirror images: a current-account deficit is matched by a capital-account surplus (a country that imports more than it exports pays with assets, so foreign investment flows in). They sum to zero.
Enduring Understanding (MKT-5): The interaction of buyers and sellers exchanging the currency of one country for the currency of another determines the equilibrium exchange rate in a flexible exchange market and influences the flow of goods, services, and financial capital between countries.
Learning Objective MKT-5.A:
a. Define the exchange rate, currency appreciation, and currency depreciation.
b. Explain how currencies are valued relative to one another.
c. Calculate the value of one currency relative to another.
MKT-5.A.1 In the foreign exchange market, one currency is exchanged for another; the price of one currency in terms of the other is the exchange rate.
MKT-5.A.2 If one currency becomes more valuable in terms of the other, it is said to appreciate. If one currency becomes less valuable in terms of the other, it is said to depreciate.
Source: College Board AP Course and Exam Description · แหล่งที่มา: คำอธิบายหลักสูตรและข้อสอบ College Board AP
English
An exchange rate 汇率 is the price of one currency in terms of another. A currency appreciates 升值 when it gains value (buys more foreign currency) and depreciates 贬值 when it loses value. Always track which currency: if the US dollar appreciates against the euro, the euro depreciates against the dollar – the same event from two sides.
Worked example. Suppose $\$1=\text{€}0.90$, so $\text{€}1=\dfrac{1}{0.90}\approx\$1.11$. If the dollar then appreciates to $\$1=\text{€}1.00$, each dollar now buys more euros, while the euro has depreciated – it now buys only $\$1.00$ instead of $\$1.11$. The single event is an appreciation of the dollar and a depreciation of the euro.
Most currencies today are floating 浮动, set by supply and demand in the foreign-exchange market.
ตัวอย่างวิธีทำ. สมมติ $\$1=\text{€}0.90$, so $\text{€}1=\dfrac{1}{0.90}\approx\$1.11$. หาก afterward ดอลลาร์มีค่าขึ้นเป็น $\$1=\text{€}1.00$, each dollar now buys more euros, while the euro has depreciated – it now buys only $\$1.00$ แทนที่จะเป็น $\$1.11$. เหตุการณ์เดียวนี้คือการมีค่าขึ้นของดอลลาร์ และ การมีค่าลงของยูโร
Enduring Understanding (MKT-5): The interaction of buyers and sellers exchanging the currency of one country for the currency of another determines the equilibrium exchange rate in a flexible exchange market and influences the flow of goods, services, and financial capital between countries.
Learning Objective MKT-5.B:
a. Define the foreign exchange market, demand for currency, and supply of currency.
b. Explain (using graphs as appropriate) the relationship between the exchange rate and the quantity of currency demanded (supplied).
MKT-5.B.1 The demand for a currency in a foreign exchange market arises from the demand for the country's goods, services, and financial assets and shows the inverse relationship between the exchange rate and the quantity demanded of a currency.
MKT-5.B.2 The supply of a currency in a foreign exchange market arises from making payments in other currencies and shows the positive relationship between the exchange rate and the quantity supplied of a currency.
Learning Objective MKT-5.C: Define (using graphs as appropriate) the equilibrium exchange rate.
MKT-5.C.1 In the foreign exchange market, equilibrium is achieved when the exchange rate is such that the quantities demanded and supplied of the currency are equal.
Learning Objective MKT-5.D: Explain (using graphs as appropriate) how exchange rates adjust to restore equilibrium in the foreign exchange market.
MKT-5.D.1 Disequilibrium exchange rates create surpluses and shortages in the foreign exchange market. Market forces drive exchange rates toward equilibrium.
Source: College Board AP Course and Exam Description · แหล่งที่มา: คำอธิบายหลักสูตรและข้อสอบ College Board AP
English
The foreign exchange market
Each currency has its own supply-and-demand graph (price $=$ the exchange rate, quantity $=$ amount of that currency).
Demand for a currency comes from foreigners wanting its goods, services, or assets.
Supply of a currency comes from its own residents wanting foreign goods, services, or assets.
The equilibrium exchange rate is where they cross. A rightward shift in demand for a currency causes it to appreciate; a rightward shift in supply causes it to depreciate.
Exam skill: always draw the graph for the currency named in the question, label the axis with that currency's price, and shift the correct curve – mixing up the two currencies' graphs is the most common error.
The foreign-exchange market · ตลาด foreign-exchange
A currency's exchange rate is set where demand for it meets supply. Higher demand for exports or higher interest rates appreciate the currency. · อัตราแลกเปลี่ยน ของเงินตราถูกกำหนดที่จุดที่อุปสงค์และอุปทานบรรจบกัน ความต้องการส่งออกที่สูงขึ้นหรืออัตราดอกเบี้ยที่สูงขึ้นจะทำให้เงินตรามีมูลค่าสูงขึ้น
6.4
Changes in Policies and Economic Conditions · การเปลี่ยนแปลงของนโยบายและสภาพเศรษฐกิจ
Syllabus · หลักสูตร
English
Enduring Understanding (MKT-5): The interaction of buyers and sellers exchanging the currency of one country for the currency of another determines the equilibrium exchange rate in a flexible exchange market and influences the flow of goods, services, and financial capital between countries.
Learning Objective MKT-5.E:
a. Explain (using graphs as appropriate) the determinants of currency demand and supply.
b. Explain (using graphs as appropriate) how changes in demand and supply in the foreign exchange market affect the equilibrium exchange rate.
MKT-5.E.1 Factors that shift the demand for a currency (such as the demand for that country's goods, services, or assets) and the supply of a currency (such as tariffs or quotas on the other country's goods and services) change the equilibrium exchange rate.
MKT-5.E.2 Fiscal policy can influence aggregate demand, real output, the price level, and exchange rates.
MKT-5.E.3 Monetary policy can influence aggregate demand, real output, the price level, and interest rates, and thereby affect exchange rates.
Source: College Board AP Course and Exam Description · แหล่งที่มา: คำอธิบายหลักสูตรและข้อสอบ College Board AP
English
Exchange rates respond to:
Relative interest rates: a higher domestic real interest rate attracts foreign financial investment, raising demand for the currency and causing appreciation.
Relative price levels/inflation: higher domestic inflation makes goods less competitive, lowering demand for the currency (depreciation).
Relative incomes: higher domestic income raises imports, increasing the supply of domestic currency (depreciation).
Tastes and expectations about future value.
Monetary policy has a strong link: expansionary monetary policy lowers interest rates, reduces demand for the currency, and causes depreciation (which then boosts net exports).
Exchange Rates and Net Exports · อัตราแลกเปลี่ยนและการส่งออกสุทธิ
Syllabus · หลักสูตร
English
Enduring Understanding (MKT-5): The interaction of buyers and sellers exchanging the currency of one country for the currency of another determines the equilibrium exchange rate in a flexible exchange market and influences the flow of goods, services, and financial capital between countries.
Learning Objective MKT-5.F: Explain (using graphs as appropriate) how changes in the value of a currency can lead to changes in a country's net exports and aggregate demand.
MKT-5.F.1 Factors that cause a currency to appreciate cause that country's exports to decrease and its imports to increase. As a result, net exports will decrease.
MKT-5.F.2 Factors that cause a currency to depreciate cause that country's exports to increase and its imports to decrease. As a result, net exports will increase. [See EK MOD-2.A.3 and EK MOD-2.H.1 for explanations of the effect of changes in net exports on aggregate demand and the resulting effects on output, employment, and the price level.]
MKT-5.F.2 ปัจจัยที่ทำให้สกุลเงินลดมูลค่าจะทำให้ صادراتของประเทศนั้นเพิ่มขึ้นและการนำเข้าลดลง ผลลัพธ์คือ صادراتสุทธิจะเพิ่มขึ้น [ดู EK MOD-2.A.3 และ EK MOD-2.H.1 สำหรับการอธิบายผลกระทบของการเปลี่ยนแปลง صادراتสุทธิต่อกำลังซื้อรวมและผลกระทบที่เกิดขึ้นต่อผลผลิต การจ้างงาน และระดับราคา]
Source: College Board AP Course and Exam Description · แหล่งที่มา: คำอธิบายหลักสูตรและข้อสอบ College Board AP
English
Exchange rates feed back into AD through net exports:
A depreciation makes exports cheaper for foreigners and imports dearer, so net exports rise and AD shifts right.
An appreciation makes exports dearer and imports cheaper, so net exports fall and AD shifts left.
Worked example. A US car priced at $\$30{,}000$ costs a European buyer $\text{€}27{,}000$ when $\$1=\text{€}0.90$. If the dollar depreciates to $\$1=\text{€}0.80$, the same car now costs only $\text{€}24{,}000$ – cheaper for foreigners, so US exports rise while imports (now dearer in dollars) fall, lifting net exports and shifting AD right.
This is how the foreign-exchange market and the AD-AS model connect – a currency change is a channel through which policy reaches output.
ไทย
อัตราแลกเปลี่ยนส่งผลกระทบต่อ AD ผ่าน Net Exports :
การมีค่าลง ทำให้ส่งออกถูกลงสำหรับชาวต่างชาติและนำเข้าแพงขึ้น ดังนั้น Net Exports จะเพิ่มขึ้น และ AD เลื่อนไปทางขวา
การมีค่าขึ้น ทำให้ส่งออกแพงขึ้นและนำเข้าถูกลง ดังนั้น Net Exports จะลดลง และ AD เลื่อนไปทางซ้าย
ตัวอย่างวิธีทำ. รถยนต์สหรัฐฯ ราคา $\$30{,}000$ costs a European buyer $\text{€}27{,}000$ when $\$1=\text{€}0.90$. หากดอลลาร์ มีค่าลง เป็น $\$1=\text{€}0.80$, the same car now costs only $\text{€}24{,}000$ – ถูกสำหรับชาวต่างชาติ ดังนั้นการส่งออกของสหรัฐฯ เพิ่มขึ้น ในขณะที่การนำเข้า (ซึ่งตอนนี้แพงขึ้นเมื่อแปลงเป็นดอลลาร์) ลดลง ช่วยเพิ่ม Net Exports และเลื่อน AD ไปทางขวา
Real Interest Rates and International Capital Flows · อัตราดอกเบี้ยจริงและการไหลเวียนของทุนระหว่างประเทศ
Syllabus · หลักสูตร
English
Enduring Understanding (MKT-5): The interaction of buyers and sellers exchanging the currency of one country for the currency of another determines the equilibrium exchange rate in a flexible exchange market and influences the flow of goods, services, and financial capital between countries.
Learning Objective MKT-5.G: Explain (using graphs as appropriate) how differences in real interest rates across countries affect financial capital flows, foreign exchange markets, and loanable funds markets.
MKT-5.G.1 In an open economy, differences in real interest rates across countries change the relative values of domestic and foreign assets. Financial capital will flow toward the country with the relatively higher interest rate. [See EK MKT-4.E.2 and EK MEA-4.A.6 for explanations of the impact on the loanable funds market and on net exports.]
MKT-5.G.2 Central banks can influence the domestic interest rate in the short run, which in turn will affect net capital inflows.
Source: College Board AP Course and Exam Description · แหล่งที่มา: คำอธิบายหลักสูตรและข้อสอบ College Board AP
English
Money chases the highest real return, so capital flows 资本流动 respond to real interest rates:
A higher domestic real interest rate attracts inflows of foreign financial capital – foreigners buy domestic bonds, raising currency demand and causing appreciation.
A lower real rate causes outflows and depreciation.
This ties the whole course together: government borrowing raises the real interest rate (loanable funds), which attracts foreign capital, appreciates the currency, and reduces net exports – so a budget deficit can widen a trade deficit (the "twin deficits"). Tracing these linked effects across the loanable-funds, forex, and AD-AS graphs is the capstone skill of AP Macroeconomics.
Pick one and the site follows you — notes, papers, videos and practice all open on it. · เลือกหนึ่งตัว และเว็บจะติดตามคุณ — หมายเหตุ, ใบงาน, วิดีโอ และการฝึกฝนจะเปิดอยู่ที่นั้น
Type to search notes, lessons, code, vocabulary and past-paper questions across every subject. · พิมพ์เพื่อค้นหาบันทึก, บทเรียน, โค้ด, คำศัพท์ และคำถามข้อสอบเก่าในทุกวิชา