Skip to content · ⁨ข้ามไปยังเนื้อหา⁩

Marketing (A Level) · ⁨การตลาด (A Level)⁩

A-Level Business · ⁨Business A-Level⁩ · Topic 8 · ⁨หัวข้อ 8⁩

Video lesson for this topic · ⁨บทเรียนวิดีโอสำหรับหัวข้อนี้⁩ Open the video page · ⁨เปิดหน้าวิดีโอ⁩
8:06

การตลาด (A Level)

ร้านทุกแห่งทำงานด้วยตัวเลข ต้องสั่งซื้อเท่าไหร่ ตั้งราคาเท่าไหร่ จะลองสินค้าใหม่ตัวไหน หากผิดไปจากนั้น อาหารอาจถูกทิ้งในถัง หรือชั้นวาง...

English narration · English + 中文 subtitles burned in · ⁨การบรรยายภาษาอังกฤษ · คำบรรยายภาษาอังกฤษ + 中文 ลอยตัวบนภาพ⁩

8.1

Marketing analysis · ⁨การวิเคราะห์การตลาด⁩

Syllabus · ⁨หลักสูตร⁩
English
  1. use quantitative marketing analysis: sales forecasting, time-series analysis (moving averages, trend, seasonal variation), correlation
  2. explain elasticity (price, income, cross) and its use in marketing decisions
ไทย
  1. ใช้การวิเคราะห์ทางการตลาดเชิงปริมาณ: การคาดการณ์ยอดขาย, การวิเคราะห์อนุกรมเวลา (ค่าเฉลี่ยเคลื่อนที่, แนวโน้ม, ความแปรปรวนตามฤดูกาล), ความสัมพันธ์กัน
  2. อธิบาย ความยืดหยุ่น (ราคา รายได้ ตัดกัน) และการนำไปใช้ในการตัดสินใจทางการตลาด

Source: Cambridge International syllabus · ⁨แหล่งที่มา: หลักสูตร Cambridge International⁩

English

Marketing analysis 营销分析 means using data to understand the market and to make better marketing decisions. At A Level you study some numbers tools: sales forecasting, time-series analysis, correlation, and elasticity.

ไทย
ทางเดินร้านขายของชำที่คึกคัก
ร้านขายของชำ: ผู้ค้าปลีกใช้ข้อมูลเพื่อแข่งขันในด้านราคา สินค้าหลากหลาย และประสบการณ์ลูกค้า

การวิเคราะห์การตลาด หมายถึงการใช้ข้อมูลเพื่อทำความเข้าใจตลาดและตัดสินใจด้านการตลาดที่ดีขึ้น ในระดับ A-Level คุณจะได้เรียนเครื่องมือทางคณิตศาสตร์บางประการ: การคาดการณ์ยอดขาย, การวิเคราะห์อนุกรมเวลา, ความสัมพันธ์เชิงเส้น และความยืดหยุ่น

Watch lesson · ⁨ดูบทเรียน⁩
8.1

Sales forecasting and time-series analysis · ⁨การคาดการณ์ยอดขายและการวิเคราะห์อนุกรมเวลา⁩

English

Sales forecasting 销售预测 is predicting future sales from past data and market knowledge. Good forecasts help a firm plan production, staff, stock and cash.

Time-series analysis 时间序列分析 studies past sales recorded over time to find a pattern. It has two main parts:

  • the trend 趋势 — the general direction of sales over the long run (up, down or flat).
  • the seasonal variation 季节性波动 — the regular rise and fall within a year (e.g. ice cream sells more in summer).

To find the trend, firms use a moving average 移动平均, which smooths the ups and downs by averaging several periods in a row. The seasonal variation is then how far the actual figure sits above or below the trend:

$$\text{seasonal variation} = \text{actual value} - \text{trend value}$$

A forecast extends the trend into the future (called extrapolation 外推) and then adds the usual seasonal variation. This works only if past patterns continue, so forecasts are never certain.

ไทย

การคาดการณ์ยอดขาย คือการทำนายยอดขายในอนาคตจากข้อมูลในอดีตและความรู้ด้านตลาด การคาดการณ์ที่ดีช่วยให้บริษัทวางแผนการผลิต พนักงาน สต็อก และเงินสด

การวิเคราะห์อนุกรมเวลา ศึกษายอดขายในอดีตที่บันทึกไว้ตามเวลาเพื่อหาแนวโน้ม มีสองส่วนหลัก:

  • แนวโน้ม — ทิศทางทั่วไปของยอดขายในระยะยาว (เพิ่มขึ้น ลดลง หรือคงที่)
  • ความผันผวนตามฤดูกาล — การเพิ่มขึ้นและลดลงอย่างสม่ำเสมอภายในหนึ่งปี (เช่น ขายน้ำแข็งมากขึ้นในฤดูร้อน)

ในการหาแนวโน้ม บริษัทจะใช้ ค่าเฉลี่ยเคลื่อนที่ ซึ่งช่วยปรับความผันผวนโดยนำค่าเฉลี่ยของหลายช่วงเวลาติดกัน ค่าความผันผวนตามฤดูกาลจึงเป็นระยะห่างระหว่างตัวเลขจริงกับแนวโน้ม:

$$\text{seasonal variation} = \text{actual value} - \text{trend value}$$
กราฟอนุกรมเวลา: ยอดขายรายไตรมาสจริงแกว่งขึ้นลงรอบๆ เส้นแนวโน้มที่เรียบและเพิ่มขึ้น โดยมีช่องว่างระหว่างตัวเลขจริงกับแนวโน้มถูกกำหนดให้เป็นความผันผวนตามฤดูกาล
ยอดขายจริงมีการผันผวนตามฤดูกาลรอบๆ เทรนด์พื้นฐานที่เรียบเนียน

การคาดการณ์จะขยายเทรนด์ไปสู่อนาคต (ซึ่งเรียกว่า การประมาณค่า) แล้วเพิ่มความแปรปรวนตามฤดูกาลปกติเข้าไป การทำเช่นนี้ทำได้ก็ต่อเมื่อรูปแบบในอดีตยังคงอยู่ ดังนั้นการคาดการณ์จึงไม่มีความแน่นอนเสมอไป

Explore · ⁨สำรวจ⁩

Sales forecast lab · ⁨ห้องปฏิบัติการคาดการณ์ยอดขาย⁩

sales = trend + seasonal effect · ⁨ยอดขาย = แนวโน้ม + ผลกระทบตามฤดูกาล⁩

Move along a sales trend and see how forecast and actual can separate. · ⁨เลื่อนไปตามแนวโน้มยอดขายเพื่อดูว่าการคาดการณ์และผลจริงอาจแยกออกจากกันได้อย่างไร⁩

Vocabulary · ⁨คำศัพท์⁩ Train · ⁨ฝึกฝน⁩
English ไทย
marketing analysis/ˈmɑːkɪtɪŋ əˈnæləsɪs/ การวิเคราะห์การตลาด
sales forecasting/seɪlz ˈfɔːkæstɪŋ/ การพยากรณ์ยอดขาย
time-series analysis/taɪm ˈsɪəriːz əˈnæləsɪs/ การวิเคราะห์อนุกรมเวลา
trend/trend/ แนวโน้ม
seasonal variation/ˈsiːzənl ˌveərɪˈeɪʃn/ ความแปรปรวนตามฤดูกาล
moving average/ˈmuːvɪŋ ˈævrɪdʒ/ ค่าเฉลี่ยเคลื่อนที่
extrapolation/ekˈstræpəleɪʃn/ การขยายนอกขอบเขตข้อมูล (extrapolation)
8.1

Correlation · ⁨ความสัมพันธ์⁩

English

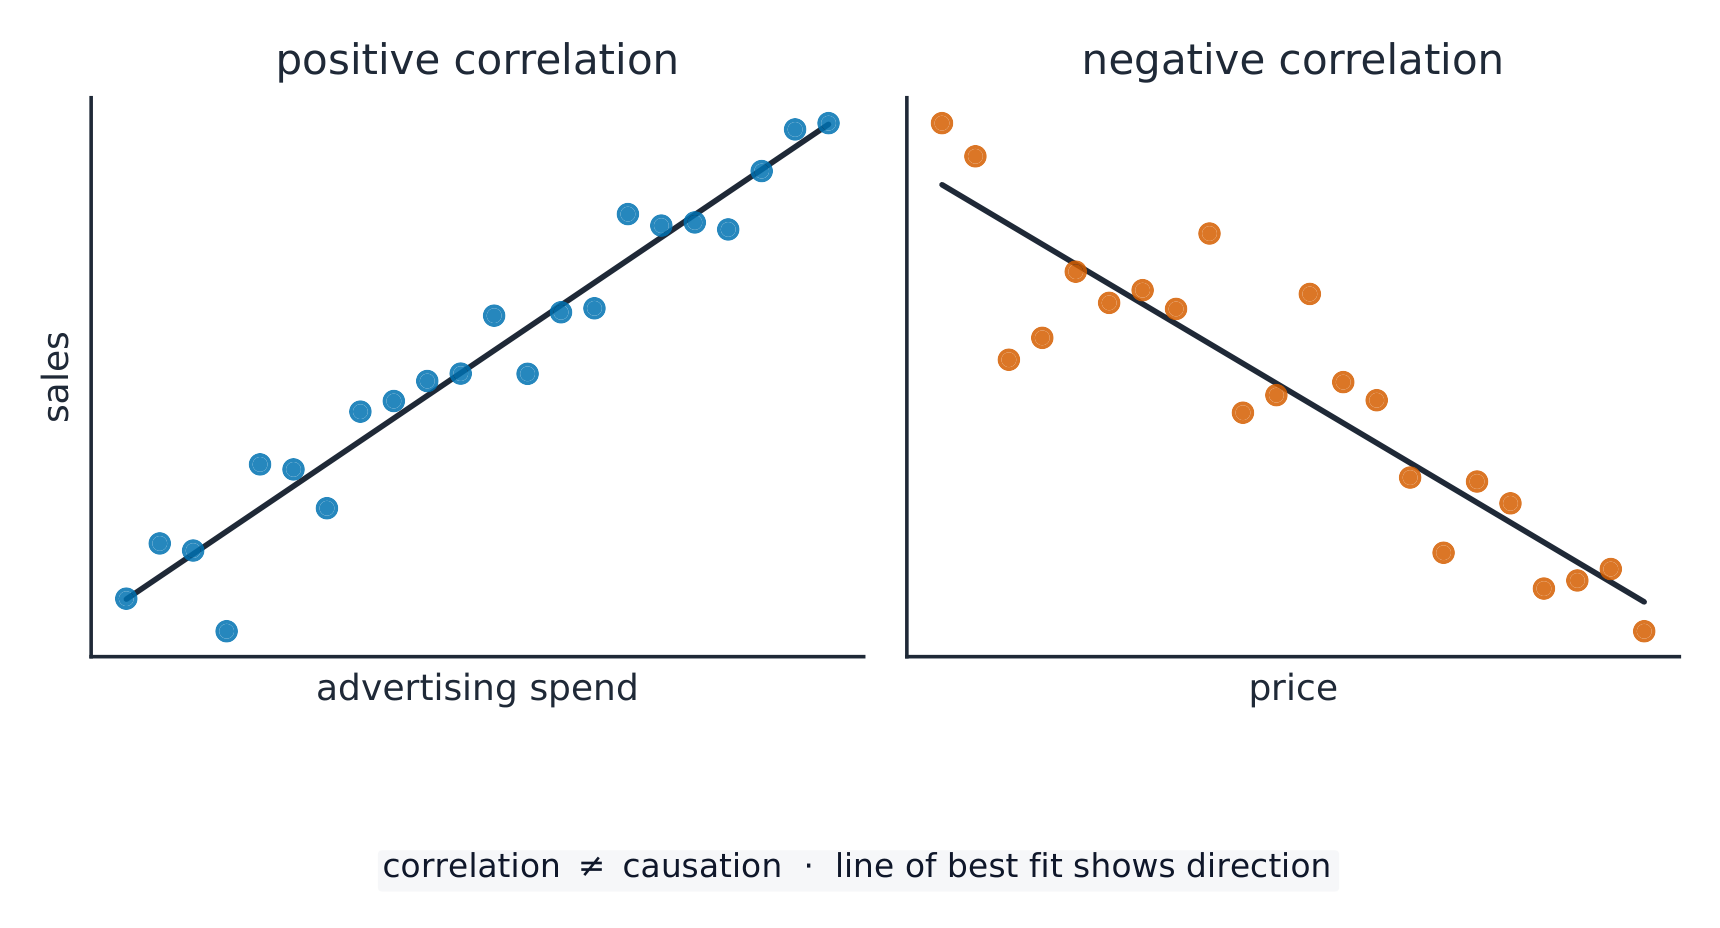
Correlation 相关性 measures how strongly two things move together — for example, advertising spending and sales.

  • positive correlation 正相关 — when one rises, the other rises too.
  • negative correlation 负相关 — when one rises, the other falls.

Strong correlation helps a firm predict, but it does not prove that one thing causes the other. Other factors may be at work.

ไทย

ความสัมพันธ์ บ่งบอกถึงระดับความเข้มแข็งของการเคลื่อนไหวร่วมกันของสองสิ่ง — ตัวอย่างเช่น ค่าใช้จ่ายด้านโฆษณาและยอดขาย

  • ความสัมพันธ์เชิงบวก — เมื่อสิ่งหนึ่งเพิ่มขึ้น อีกสิ่งหนึ่งก็เพิ่มขึ้นตามไปด้วย
  • ความสัมพันธ์เชิงลบ — เมื่อสิ่งหนึ่งเพิ่มขึ้น อีกสิ่งหนึ่งจะลดลง
กราฟกระจายสองแบบ: ความสัมพันธ์เชิงบวกที่จุดข้อมูลพุ่งขึ้นพร้อมกัน และความสัมพันธ์เชิงลบที่จุดข้อมูลลดลงเมื่อตัวแปรอื่นเพิ่มขึ้น โดยแต่ละแบบมีเส้นแนวโน้มที่ดีที่สุด
ความสัมพันธ์เชิงบวก (ทั้งสองสิ่งพุ่งขึ้นพร้อมกัน) และความสัมพันธ์เชิงลบ (สิ่งหนึ่งพุ่งขึ้นในขณะที่อีกสิ่งหนึ่งลดลง)

ความสัมพันธ์ที่แข็งแกร่งช่วยให้บริษัทสามารถทำนายได้ แต่ไม่ได้พิสูจน์ว่าสิ่งหนึ่ง เป็นสาเหตุ ของอีกสิ่งหนึ่ง ปัจจัยอื่นอาจเข้ามามีส่วนร่วมด้วย

Explore · ⁨สำรวจ⁩

Correlation and the line of best fit · ⁨สัมประสิทธิ์สหสัมพันธ์และเส้นตรงที่ใกล้เคียงที่สุด⁩

Change the strength of the relationship. A line of best fit lets a business spot a trend and forecast from it. · ⁨เปลี่ยนความแข็งแกร่งของความสัมพันธ์ เส้นตรงที่ใกล้เคียงที่สุด ช่วยให้งานธุรกิจมองเห็นแนวโน้มและทำนายจากมัน⁩

Vocabulary · ⁨คำศัพท์⁩ Train · ⁨ฝึกฝน⁩
English ไทย
correlation/ˌkɒrɪˈleɪʃn/ ความสัมพันธ์เชิงสหสัมพันธ์
positive correlation/ˈpɒzɪtɪv ˌkɒrɪˈleɪʃn/ ความสัมพันธ์เชิงบวก
negative correlation/ˈneɡətɪv ˌkɒrɪˈleɪʃn/ ความสัมพันธ์เชิงลบ
elasticity/ɪlæˈstɪsɪti/ ความยืดหยุ่น
price elasticity of demand/praɪs ɪlæˈstɪsɪti ɒv dɪˈmænd/ ความยืดหยุ่นของราคาต่อความต้องการ
price elastic/praɪs ɪˈlæstɪk/ ความยืดหยุ่นของราคา
price inelastic/praɪs ɪnɪˈlæstɪk/ ความไม่ยืดหยุ่นของราคา
income elasticity of demand/ˈɪŋkʌm ɪlæˈstɪsɪti ɒv dɪˈmænd/ ความยืดหยุ่นต่อรายได้
cross elasticity of demand/krɒs ɪlæˈstɪsɪti ɒv dɪˈmænd/ ความยืดหยุ่นข้ามกันของความต้องการ
marketing strategy/ˈmɑːkɪtɪŋ ˈstrætədʒi/ กลยุทธ์การตลาด
marketing planning/ˈmɑːkɪtɪŋ ˈplænɪŋ/ การวางแผนการตลาด
Ansoff's matrix/ˈænsɒfs ˈmeɪtrɪks/ เมทริกซ์ของแอนโซฟ⟦Ansoff's matrix⟧
market penetration/ˈmɑːkɪt ˌpenɪˈtreɪʃn/ การเจาะตลาด
product development/ˈprɒdʌkt dɪˈveləpmənt/ การพัฒนาผลิตภัณฑ์
market development/ˈmɑːkɪt dɪˈveləpmənt/ การพัฒนาตลาด
diversification/daɪˌvɜːsɪfɪˈkeɪʃn/ การหลากหลาย
product portfolio analysis/ˈprɒdʌkt pɔːtˈfəʊlɪəʊ əˈnæləsɪs/ การวิเคราะห์พอร์ตโฟลิโอสินค้า
globalisation/ˌɡləʊbəlaɪˈzeɪʃn/ globalisation
exporting/ekˈspɔːtɪŋ/ การส่งออก
joint venture/dʒɔɪnt ˈventʃə/ กิจการร่วมค้า
localisation/ˌləʊkəlaɪˈzeɪʃn/ การทำให้เป็นท้องถิ่น
8.1

Using elasticity in marketing decisions · ⁨การใช้ความยืดหยุ่นในการตัดสินใจด้านการตลาด⁩

English

Elasticity 弹性 measures how much demand reacts to a change. Three types guide marketing decisions.

  • price elasticity of demand 需求价格弹性 (PED) — for a price elastic 富有弹性 product, cutting the price raises total revenue; for a price inelastic 缺乏弹性 product, raising the price raises total revenue.
  • income elasticity of demand 需求收入弹性 (YED) — tells a firm how sales will change as incomes rise or fall, which helps plan for booms and recessions.
  • cross elasticity of demand 需求交叉弹性 (XED) — tells a firm how a rival's price change, or the price of a partner product, will affect its own sales.

So elasticity helps a firm set prices, choose products, and predict the effect of a competitor's move.

Worked example. Quarterly sales run Q1 100, Q2 140, Q3 180, Q4 120, then next Q1 108. Find the four-quarter moving-average trend centred on Q3, and the seasonal variation for Q3. Average the first four quarters: $(100 + 140 + 180 + 120) \div 4 = 135$. Average the next four: $(140 + 180 + 120 + 108) \div 4 = 137$. A four-period average falls between quarters, so centre the two: $(135 + 137) \div 2 = 136$, the trend at Q3. The seasonal variation is actual minus trend: $180 - 136 =$ +44, so Q3 runs about 44 units above trend, and next year's Q3 forecast is the projected trend plus 44. The centring step is the one most answers drop: with an even number of periods the average lands between two quarters and must be centred before it can be compared with an actual figure.

ไทย

ความยืดหยุ่น วัดว่าความต้องการตอบสนองต่อการเปลี่ยนแปลงอย่างไร มีสามประเภทที่ช่วยในการตัดสินใจด้านการตลาด

กราฟความต้องการแบบยืดหยุ่นที่เป็นเส้นแบน อยู่ข้างๆ กราฟความต้องการแบบไม่ยืดหยุ่นที่เป็นเส้นชัน
ความต้องการที่ยืดหยุ่นจะแบน; ความต้องการที่ไม่ยืดหยุ่นจะชัน
  • ความยืดหยุ่นของราคาต่อความต้องการ (PED) — สำหรับสินค้าที่มี ความยืดหยุ่นสูง การลดราคาจะเพิ่มรายได้รวม; สำหรับสินค้าที่มี ความยืดหยุ่นต่ำ การขึ้นราคาจะเพิ่มรายได้รวม
  • ความยืดหยุ่นของรายได้ต่อความต้องการ (YED) — บอกให้บริษัททราบว่ายอดขายจะเปลี่ยนแปลงอย่างไรเมื่อรายได้เพิ่มขึ้นหรือลดลง ซึ่งช่วยวางแผนสำหรับช่วงเศรษฐกิจเฟื่องฟูและ recession
  • ความยืดหยุ่นข้าม_demand (XED) — บอกให้บริษัททราบว่าคู่แข่งจะปรับราคา หรือราคาของผลิตภัณฑ์คู่ค้า จะส่งผลต่อยอดขายของบริษัทตนเองอย่างไร

ดังนั้น ความยืดหยุ่นช่วยให้องค์กรกำหนดราคา เลือกผลิตภัณฑ์ และคาดการณ์ผลกระทบจากการกระทำของคู่แข่ง

ตัวอย่างที่แสดงวิธีทำ ยอดขายรายไตรมาสคือ Q1 = 100, Q2 = 140, Q3 = 180, Q4 = 120 จากนั้น Q1 ปีถัดไปคือ 108 ให้หาแนวโน้มค่าเฉลี่ยเคลื่อนที่สี่ไตรมาสที่จุดกึ่งกลางอยู่ที่ Q3 และความผันแปรตามฤดูกาลสำหรับ Q3 หาค่าเฉลี่ยสี่ไตรมาสแรก: $(100 + 140 + 180 + 120) \div 4 = 135$. หาค่าเฉลี่ยสี่ trimester ถัดไป: $(140 + 180 + 120 + 108) \div 4 = 137$. ค่าเฉลี่ยสี่งวดจะตกอยู่ ระหว่าง ไตรมาส ดังนั้นต้องปรับให้เข้าจุดกึ่งกลางทั้งสอง: $(135 + 137) \div 2 = 136$, ซึ่งเป็นแนวโน้มที่ Q3. ความผันแปรตามฤดูกาล คือค่าจริงลบด้วยแนวโน้ม: $180 - 136 =$ +44, ดังนั้น Q3 มีค่าสูงกว่าแนวโน้มประมาณ 44 หน่วย และการพยากรณ์ Q3 ปีหน้าคือแนวโน้มที่คาดไว้ บวก 44. ขั้นตอนการ ปรับให้เข้าจุดกึ่งกลาง เป็นขั้นตอนที่ผู้ตอบส่วนใหญ่ทำผิด: เมื่อมีจำนวนงวดเป็น เลขคู่ ค่าเฉลี่ยจะตกอยู่ระหว่างสองไตรมาสและต้องปรับให้เข้าจุดกึ่งกลางก่อนจึงจะนำไปเทียบกับค่าจริงได้

8.2

Marketing planning and strategy · ⁨การวางแผนและการวางกลยุทธ์ทางการตลาด⁩

Syllabus · ⁨หลักสูตร⁩
English
  1. explain marketing planning and marketing strategy (Ansoff's matrix, product portfolio analysis)
  2. explain how marketing strategy is adapted for entering international markets
ไทย
  1. อธิบาย การวางแผนการตลาด และ กลยุทธ์การตลาด (เมทริกซ์อันโซฟฟ์, การวิเคราะห์พอร์ตโฟลิโอผลิตภัณฑ์)
  2. อธิบายการปรับกลยุทธ์การตลาดสำหรับการเข้าสู่ ตลาดระหว่างประเทศ

Source: Cambridge International syllabus · ⁨แหล่งที่มา: หลักสูตร Cambridge International⁩

English

A marketing strategy 营销战略 is the long-term plan for how marketing will meet the firm's objectives. Marketing planning 营销规划 is the work of setting that plan: studying the market, choosing target customers, and deciding the marketing mix. Two tools shape strategy: Ansoff's matrix and product portfolio analysis.

ไทย
จอโฆษณาดิจิทัลขนาดใหญ่ในเวลากลางคืน
จอโฆษณาดิจิทัล — การตลาดเกิดขึ้นบนออนไลน์และหน้าจอมากขึ้นเรื่อยๆ

กลยุทธ์ทางการตลาด คือแผนระยะยาวว่าการตลาดจะบรรลุเป้าหมายขององค์กรได้อย่างไร การวางแผนการตลาด คือการดำเนินงานในการวางแผนนั้น: ศึกษาตลาด เลือกกลุ่มลูกค้าเป้าหมาย และตัดสินใจเรื่องส่วนผสมทางการตลาด (marketing mix) เครื่องมือสองอย่างที่ใช้กำหนดกลยุทธ์ ได้แก่ แมทริกซ์ของแอนซอฟฟ์ และการวิเคราะห์พอร์ตโฟลิโอผลิตภัณฑ์

Explore · ⁨สำรวจ⁩

Ansoff strategy lab · ⁨ห้องปฏิบัติการกลยุทธ์อันซอฟฟ์⁩

Sort growth choices by product and market risk. · ⁨จัดหมวดหมู่ตัวเลือกการเติบโตตามความเสี่ยงของผลิตภัณฑ์และตลาด⁩

8.2

Ansoff's matrix · ⁨แมทริกซ์ของแอนซอฟฟ์⁩

English

Ansoff's matrix 安索夫矩阵 shows four ways to grow, by mixing existing or new products with existing or new markets. The risk rises as you move away from what you know.

Existing products New products
Existing markets market penetration 市场渗透 (sell more to current buyers) product development 产品开发 (new products for current buyers)
New markets market development 市场开发 (current products to new buyers) diversification 多元化 (new products and new markets)

Market penetration is the safest; diversification is the riskiest because both the product and the market are new.

ไทย
เมทริกซ์ Ansoff: ตารางขนาด 2x2 ของกลยุทธ์การเติบโตของผลิตภัณฑ์และตลาด
แมทริกซ์ของแอนซอฟฟ์: กลยุทธ์การเติบโตสี่แบบ โดยความเสี่ยงเพิ่มขึ้นทางมุมล่างขวา (การหลากหลาย)

แมทริกซ์ของแอนซอฟฟ์ แสดงถึงสี่วิธีการเติบโต โดยผสมผสานระหว่างผลิตภัณฑ์เก่าหรือใหม่กับตลาดเก่าหรือใหม่ ความเสี่ยงจะเพิ่มขึ้นเมื่อคุณห่างจากสิ่งที่รู้จัก

ผลิตภัณฑ์เดิม ผลิตภัณฑ์ใหม่
ตลาดเดิม การเจาะตลาด (ขายมากขึ้นให้กับผู้ซื้อปัจจุบัน) การพัฒนาผลิตภัณฑ์ (ผลิตภัณฑ์ใหม่สำหรับผู้ซื้อปัจจุบัน)
ตลาดใหม่ การพัฒนาตลาด (ผลิตภัณฑ์เดิมไปยังผู้ซื้อใหม่) การหลากหลาย (ผลิตภัณฑ์ใหม่และตลาดใหม่)

การเจาะตลาดปลอดภัยที่สุด; การหลากหลายมีความเสี่ยงมากที่สุดเนื่องจากทั้งผลิตภัณฑ์และตลาดล้วนใหม่

8.2

Product portfolio analysis · ⁨การวิเคราะห์พอร์ตโฟลิโอผลิตภัณฑ์⁩

English

Product portfolio analysis 产品组合分析 looks at the firm's whole range of products together, using a tool like the Boston Matrix. It checks the balance: a firm needs some steady earners to fund its risky new products. The aim is a healthy mix, so the firm is not left with only ageing products.

ไทย

การวิเคราะห์พอร์ตโฟลิโอผลิตภัณฑ์ พิจารณาผลิตภัณฑ์ทั้งหมดขององค์กร โดยใช้เครื่องมืออย่างแมทริกซ์ของบอสตัน ตรวจสอบความสมดุล: องค์กรจำเป็นต้องมีสินค้าที่ทำกำไรได้อย่างสม่ำเสมอเพื่อมาอุดหนุนสินค้าใหม่ที่มีความเสี่ยง เป้าหมายคือการมีส่วนผสมที่ดีเพื่อให้องค์กรไม่เหลือเพียงสินค้าเก่าแก่

Explore · ⁨สำรวจ⁩

Balance the product portfolio · ⁨ปรับสมดุลพอร์ตfolioผลิตภัณฑ์⁩

Drag each product's share and growth — a healthy portfolio keeps a cash cow funding the stars and question marks that will replace it. · ⁨ลากส่วนแบ่งและการเติบโตของแต่ละผลิตภัณฑ์ — พอร์ตโฟลิโอที่ดีจะรักษา 'วัวผลิตนม' เพื่อสนับสนุน 'ดาว' และ 'คำถาม' ที่จะมาแทนที่它在⁩

8.2

Entering international markets · ⁨การเข้าสู่ตลาดระหว่างประเทศ⁩

English

To grow, many firms sell abroad. Globalisation 全球化 (the world becoming more connected) has made this easier. A firm can enter a new country by exporting 出口, by setting up a joint venture 合资企业 with a local partner, or by opening its own branch there.

But a strategy that works at home may need changes. Localisation 本地化 means adapting the marketing mix to the new market — for example, changing the product, the language, the price, or the way it is sold to suit local tastes, laws and incomes.

ไทย

เพื่อขยายธุรกิจ องค์กรจำนวนมากขายสินค้าต่างประเทศ โลกาภิวัตน์ (โลกที่เชื่อมโยงกันมากขึ้น) ทำให้สิ่งนี้ง่ายขึ้น องค์กรสามารถเข้าสู่ประเทศใหม่ได้โดย การส่งออก, การจัดตั้ง กิจการร่วมค้า กับพันธมิตรท้องถิ่น หรือการเปิดสาขาของตนเอง

เส้นที่แสดงการผูกพันและการควบคุมเพิ่มขึ้น พร้อมโหมดการเข้าสู่ตลาดสามแบบ: การส่งออก (ต่ำสุด) การร่วมกิจการ และสาขาขององค์กรเอง (สูงสุด)
รูปแบบการเข้าถึงมีการแลกเปลี่ยนระหว่างความมุ่งมั่นกับการควบคุม: การส่งออกมีความเสี่ยงน้อยที่สุด แต่สาขาตนเองให้ความควบคุมมากที่สุดแต่มีค่าใช้จ่ายและความเสี่ยงสูงสุด

แต่กลยุทธ์ที่ทำงานได้ดีในบ้านอาจต้องปรับเปลี่ยน การทำให้เป็นท้องถิ่น หมายถึงการปรับส่วนผสมทางการตลาดให้เข้ากับตลาดใหม่ เช่น เปลี่ยนแปลงผลิตภัณฑ์ ภาษา ราคา หรือวิธีการขายเพื่อให้เหมาะกับรสนิยม กฎหมาย และรายได้ในพื้นที่

Explore · ⁨สำรวจ⁩

International market lab · ⁨ห้องปฏิบัติการตลาดระหว่างประเทศ⁩

See how access to world markets changes quantity and price pressure. · ⁨ดูว่าการเข้าถึงตลาดโลกส่งผลต่อปริมาณและความดันราคาอย่างไร⁩

8.2

Exam tips · ⁨ข้อแนะนำสำหรับการสอบ⁩

English
  • Read time-series data: separate the underlying trend from seasonal variation, and extrapolate with caution.
  • Interpret correlation (strength and direction) but never assume it proves causation.
  • Use Ansoff's matrix to classify a growth strategy and judge its risk (diversification is riskiest).
  • Use elasticity values to justify a pricing or promotion decision numerically.
ไทย
  • อ่าน ข้อมูลอนุกรมเวลา: แยกแนวโน้มพื้นฐานออกจากความผันแปรตามฤดูกาล และ экстраโพลตด้วยความระมัดระวัง
  • ตีความ ความสัมพันธ์ (ความเข้มแข็งและทิศทาง) แต่อย่าเพิ่งสรุปว่าเป็นเหตุเป็นผล
  • ใช้ แมทริกซ์ของแอนซอฟฟ์ เพื่อจำแนกกลยุทธ์การเติบโตและประเมินความเสี่ยง (การหลากหลายมีความเสี่ยงมากที่สุด)
  • ใช้ ค่าความยืดหยุ่น เพื่อสนับสนุนการตัดสินใจเกี่ยวกับราคาหรือการส่งเสริมการขายอย่างมีตัวเลขประกอบ

Interactive lessons on this topic · ⁨บทเรียนเชิงโต้ตอบสำหรับหัวข้อนี้⁩

Work through it step by step, with instant-check exercises. · ⁨ทำทีละขั้นตอน พร้อมแบบฝึกหัดตรวจสอบผลทันที⁩

Past Papers · ⁨ข้อสอบย้อนหลัง⁩

More topics in A-Level Business · ⁨Business A-Level⁩ · ⁨หัวข้อเพิ่มเติมใน A-Level Business · ⁨Business A-Level⁩⁩

Log in or create account · ⁨เข้าสู่ระบบหรือสร้างบัญชี⁩

IGCSE, A-Level & AP