Skip to content · ⁨본문 바로가기⁩

Inference for Categorical Data: Chi-Square · ⁨범주형 데이터에 대한 추론: 카이제곱⁩

AP Statistics · ⁨AP 통계학⁩ · Topic 8 · ⁨주제 8⁩

Video lesson for this topic · ⁨이 주제용 영상 수업⁩ Open the video page · ⁨영상 페이지 열기⁩
7:49

범주형 데이터에 대한 추론: 카이제곱

공정한 주사위를 60번 굴립니다. 모든 면이 각각 10번씩 나와야 합니다. 하지만 절대 그렇지 않습니다—여기는 8번, 저기는 13번. 간격은 항상 존재합니다. 그래서 또…를 굴립니다.

English narration · English + 中文 subtitles burned in · ⁨영어 내레이션 · 영어 + 중국어 자막 burned-in⁩

8.1

Are My Results Unexpected? · ⁨내 결과가 예상치 못한 것일까요?⁩

Syllabus
English

Enduring Understanding (VAR-1): Given that variation may be random or not, conclusions are uncertain.

Learning Objective VAR-1.J: Identify questions suggested by variation between observed and expected counts in categorical data. [Skill 1.A]

  • VAR-1.J.1 Variation between what we find and what we expect to find may be random or not.
한국어

지속적 이해 (VAR-1): 변동성이 우연일 수도 있고 그렇지 않을 수도 있으므로, 결론은 불확실할 수 있다.

학습 목표 VAR-1.J: 범주형 데이터에서 관측값과 기대값 사이의 변동성으로 인해 제기되는 질문을 식별한다. [스킬 1.A]

  • VAR-1.J.1 우리가 찾아낸 것과 우리가预期한 것 사이의 변동성은 우연일 수도 있고 그렇지 않을 수도 있다.
Source: College Board AP Course and Exam Description · ⁨출처: College Board AP Course and Exam Description⁩

English

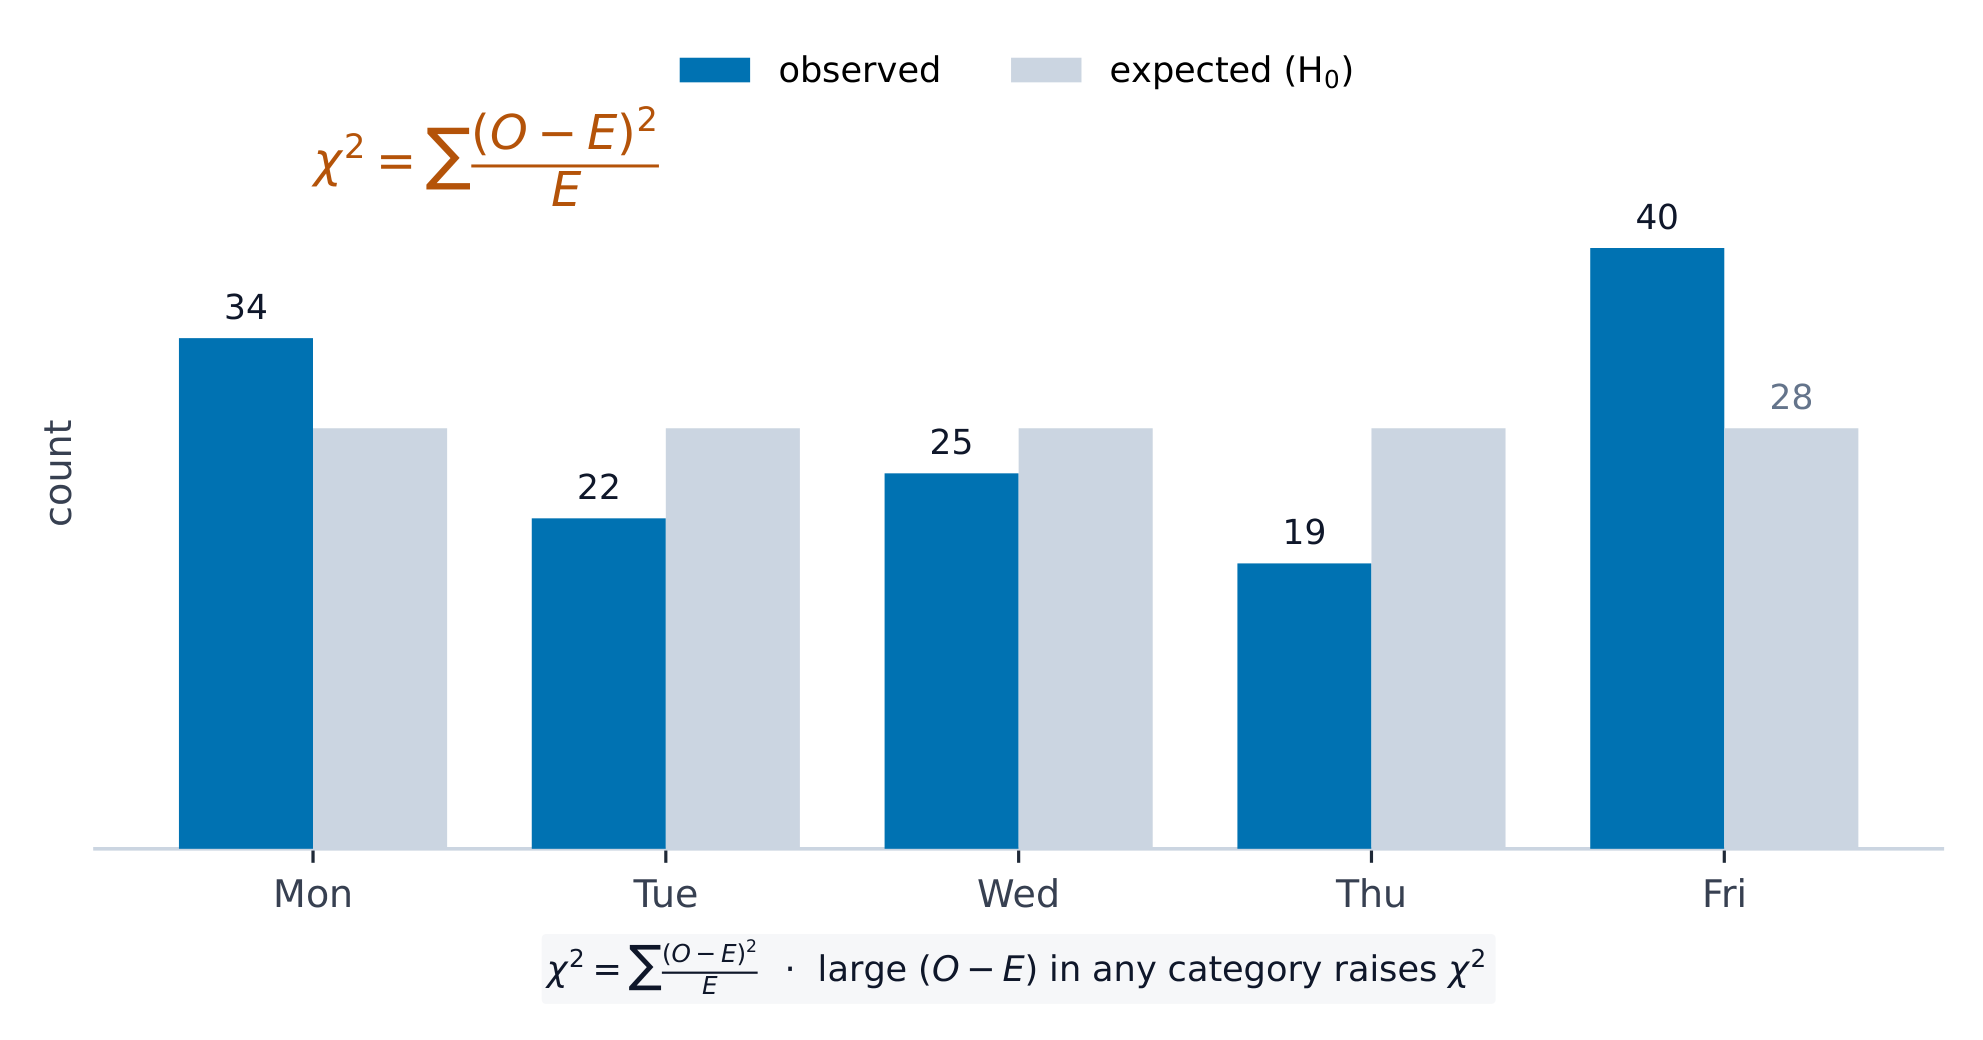
When data are counts spread across several categories, we test whether the observed counts differ from what a claim predicts. The tool is the chi-square 卡方 ($\chi^2$) statistic, which adds up the standardized gaps between observed and expected counts:

$$\chi^2=\sum \frac{(\text{observed}-\text{expected})^2}{\text{expected}}.$$
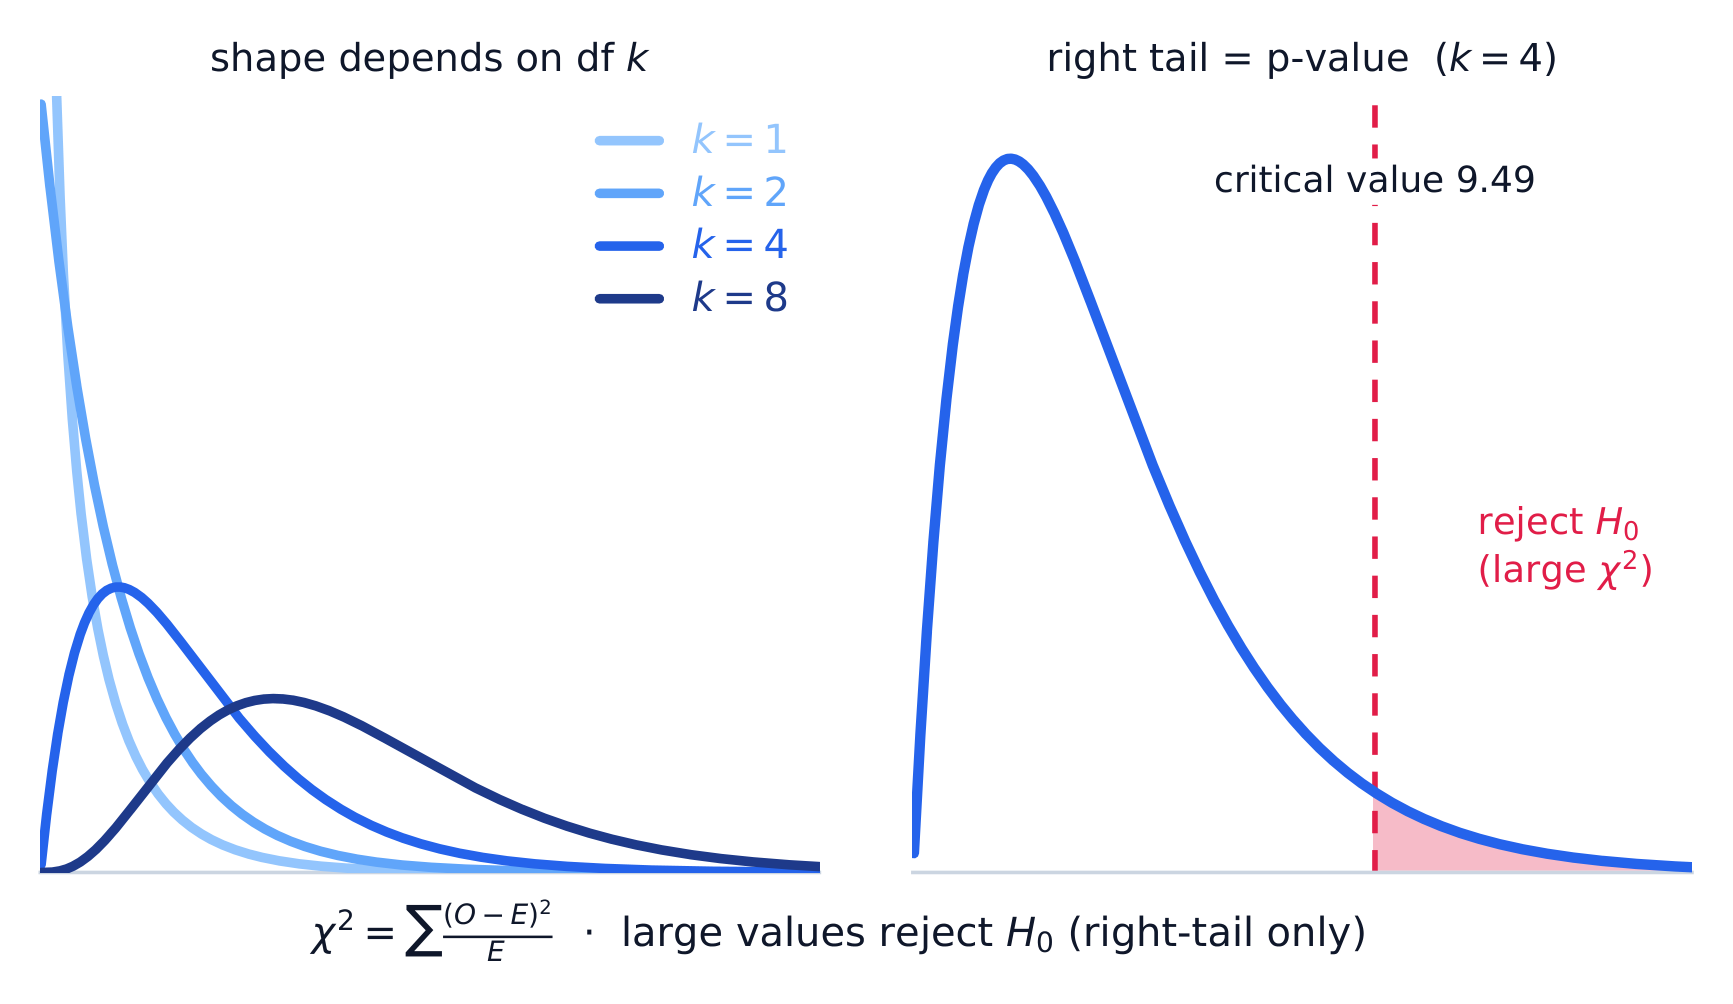
A large $\chi^2$ means the observed counts are far from expected – evidence against the claim. The chi-square distribution is right-skewed and depends on its degrees of freedom 自由度.

한국어

데이터가 여러 범위에 걸친 **빈도(counts)**로 나타날 때, 관측된 빈도가 주장은 예측한 것과 다른지를 검정합니다. 도구는 카이제곱(χ²$\chi^2$) 통계량으로, 관측 빈도와 기대 빈도 사이의 표준화된 차이를 합산합니다:

$$\chi^2=\sum \frac{(\text{observed}-\text{expected})^2}{\text{expected}}.$$
큰 $\chi^2$은 관측 빈도가 기대값에서 멀리 있음을 의미하며, 이는 주장에 대한 증거입니다. 카이제곱 분포는 오른쪽으로 치우쳐 있으며 자유도에 따라 결정됩니다.

8.2

Setting Up a Goodness-of-Fit Test · ⁨적합도 검정을 설정하는 방법⁩

Syllabus
English

Enduring Understanding (VAR-8): The chi-square distribution may be used to model variation.

Learning Objective VAR-8.A: Describe chi-square distributions. [Skill 3.C]

  • VAR-8.A.1 Expected counts of categorical data are counts consistent with the null hypothesis. In general, an expected count is a sample size times a probability.

    The chi-square statistic measures the distance between observed and expected counts relative to expected counts.

    Chi-square distributions have positive values and are skewed right. Within a family of density curves, the skew becomes less pronounced with increasing degrees of freedom.

Learning Objective VAR-8.B: Identify the null and alternative hypotheses in a test for a distribution of proportions in a set of categorical data. [Skill 1.F]

  • VAR-8.B.1 For a chi-square goodness-of-fit test, the null hypothesis specifies null proportions for each category, and the alternative hypothesis is that at least one of these proportions is not as specified in the null hypothesis.

Learning Objective VAR-8.C: Identify an appropriate testing method for a distribution of proportions in a set of categorical data. [Skill 1.E]

  • VAR-8.C.1 When considering a distribution of proportions for one categorical variable, the appropriate test is the chi-square test for goodness of fit.

Learning Objective VAR-8.D: Calculate expected counts for the chi-square test for goodness of fit. [Skill 3.A]

  • VAR-8.D.1 Expected counts for a chi-square goodness-of-fit test are (sample size)(null proportion).

Learning Objective VAR-8.E: Verify the conditions for making statistical inferences when testing goodness of fit for a chi-square distribution. [Skill 4.C]

  • VAR-8.E.1 In order to make statistical inferences for a chi-square test for goodness of fit we must check the following:
    • a. To check for independence:
      • i. Data should be collected using a random sample or randomized experiment.
      • ii. When sampling without replacement, check that $n \leq 10\%N$.
    • b. The chi-square test for goodness of fit becomes more accurate with more observations, so large counts should be used (shape).
      • i. A conservative check for large counts is that all expected counts should be greater than 5.
한국어

지속적 이해 (VAR-8): 카이제곱 분포는 변동성을 모델링하는 데 사용될 수 있다.

학습 목표 VAR-8.A: 카이제곱 분포를 설명한다. [스킬 3.C]

  • VAR-8.A.1 범주형 데이터의 기대값은 영가설과 일치하는 횟수이다. 일반적으로 기대값은 표본 크기에 확률을 곱한 값이다.

    카이제곱 통계량은 관측값과 기대값 사이의 거리를 기대값에 대해 측정한다.

    카이제곱 분포는 양의 값을 가지며 오른쪽으로 치우쳐 있다. 밀도 곡선 가족 내에서 자유도가 증가함에 따라 치우침이 덜 뚜렷해진다.

학습 목표 VAR-8.B: 범주형 데이터 세트에서의 비분포 검정에 대한 영가설 및 대안가설을 식별한다. [스킬 1.F]

  • VAR-8.B.1 카이제곱 적합도 검정에서 영가설은 각 범주에 대한 영비율을 지정하며, 대안가설은 이 비율 중 적어도 하나가 영가설에서 지정한 바와 다르다는 것이다.

학습 목표 VAR-8.C: 범주형 데이터 세트에서의 비분포 검정에 적합한 검정 방법을 식별한다. [스킬 1.E]

  • VAR-8.C.1 단일 범주형 변수에 대한 비분포를 고려할 때, 적절한 검정은 카이제곱 적합도 검정이다.

학습 목표 VAR-8.D: 카이제곱 적합도 검정을 위한 기대값을 계산한다. [스킬 3.A]

  • VAR-8.D.1 카이제곱 적합도 검정의 기대값은 (표본 크기)(영비율)이다.

학습 목표 VAR-8.E: 카이제곱 분포에 대한 적합도 검정 시 통계적 추론을 할 수 있는 조건을 확인한다. [스킬 4.C]

  • VAR-8.E.1 카이제곱 적합도 검정에 대한 통계적 추론을 하기 위해 다음 사항을 확인해야 한다:
    • a. 독립성 확인:
      • i. 데이터는 무작위 표본 또는 무작위 배정 실험을 통해 수집되어야 한다.
      • ii. 무반복 표본 추출 시, $n \leq 10\%N$인지 확인합니다.
    • b. 카이제곱 적합도 검정은 관측치가 많아질수록 정확度가 높아지므로, 큰 횟수를 사용해야 한다(모양).
      • i. 큰 횟수에 대한 보수적 검증 기준은 모든 기대값이 5보다 커야 한다는 것이다.

Source: College Board AP Course and Exam Description · ⁨출처: College Board AP Course and Exam Description⁩

English
The chi-square (χ²) test

A goodness-of-fit (GOF) 拟合优度 test checks whether one categorical variable follows a claimed distribution (e.g. "the die is fair"). Hypotheses:

$$H_0:\text{the distribution is as claimed}\qquad H_a:\text{at least one proportion differs}.$$
Expected count for each category $=n\times(\text{claimed proportion})$. Conditions: random sample, all expected counts $\ge 5$, and the 10% condition.

한국어
카이제곱(χ²²) 검정

적합도(GOF) 검정은 한 범주형 변수가 주장된 분포(예:

$$H_0:\text{the distribution is as claimed}\qquad H_a:\text{at least one proportion differs}.$$
각 범주 $=n\times(\text{claimed proportion})$에 대한 기대 빈도. 조건: 무작위 표본, 모든 기대 빈도가 $\ge 5$, 그리고 10% 조건.

카이제곱 분포와 오른쪽 꼬리 기각 영역
카이제곱 분포는 오른쪽으로 치우쳐 있습니다. 큰 통계량이 임계값을 넘은 그림자 표시 오른쪽 꼬리에 위치하면—that is where you reject the model.
Vocabulary · ⁨어휘⁩ Train · ⁨연습하기⁩
English 한국어
chi-square/kaɪ skweə/ 카이제곱
degrees of freedom/dɪˈɡriːz ɒv ˈfriːdəm/ 자유도
goodness-of-fit (GOF)/ˈɡʊdnəs ɒv fɪt/ 적합도 검정 (GOF)
Test for homogeneity/test fɔː ˈhɒməʊdʒneɪti/ 동질성 검정
Test for independence/test fɔː ˌɪndɪˈpendəns/ 독립성 검정
8.3

Carrying Out a Goodness-of-Fit Test · ⁨적합도 검정 수행하기⁩

Syllabus
English

Enduring Understanding (VAR-8): The chi-square distribution may be used to model variation.

Learning Objective VAR-8.F: Calculate the appropriate statistic for the chi-square test for goodness of fit. [Skill 3.E]

  • VAR-8.F.1 The test statistic for the chi-square test for goodness of fit is
    • Equation: $\chi^2 = \sum \dfrac{(Observed\ count - Expected\ count)^2}{Expected\ count}$, with $degrees\ of\ freedom = number\ of\ categories - 1$.
  • VAR-8.F.2 The distribution of the test statistic assuming the null hypothesis is true (null distribution) can be either a randomization distribution or, when a probability model is assumed to be true, a theoretical distribution (chi-square).

Learning Objective VAR-8.G: Determine the $p$-value for chi-square test for goodness of fit significance test. [Skill 3.E]

  • VAR-8.G.1 The $p$-value for a chi-square test for goodness of fit for a number of degrees of freedom is found using the appropriate table or computer generated output.

Enduring Understanding (DAT-3): Significance testing allows us to make decisions about hypotheses within a particular context.

Learning Objective DAT-3.I: Interpret the $p$-value for the chi-square test for goodness of fit. [Skill 4.B]

  • DAT-3.I.1 An interpretation of the $p$-value for the chi-square test for goodness of fit is the probability, given the null hypothesis and probability model are true, of obtaining a test statistic as, or more, extreme than the observed value.

Learning Objective DAT-3.J: Justify a claim about the population based on the results of a chi-square test for goodness of fit. [Skill 4.E]

  • DAT-3.J.1 A decision to either reject or fail to reject the null hypothesis is based on comparison of the $p$-value to the significance level, $\alpha$.
  • DAT-3.J.2 The results of a chi-square test for goodness of fit can serve as the statistical reasoning to support the answer to a research question about the population that was sampled.
한국어

지속적 이해 (VAR-8): 카이제곱 분포는 변동성을 모델링하는 데 사용될 수 있다.

학습 목표 VAR-8.F: 카이제곱 적합도 검정에 적절한 통계량을 계산한다. [스킬 3.E]

  • VAR-8.F.1 카이제곱 적합도 검정의 검정 통계량은
    • 식: $\chi^2 = \sum \dfrac{(Observed\ count - Expected\ count)^2}{Expected\ count}$, where $degrees\ of\ freedom = number\ of\ categories - 1$.
  • VAR-8.F.2 영가설이 참일 때 검정 통계량의 분포(영분포)는 무작위 배정 분포이거나, 확률 모델을 참이라고 가정할 때는 이론적 분포(카이제곱)일 수 있다.

학습 목표 VAR-8.G: 카이제곱 적합도 검정 유의성 검정의 $p$-값을 결정한다. [스킬 3.E]

  • VAR-8.G.1 자유도의 수에 따른 카이제곱 적합도 검정의 $p$-값은 적절한 표나 컴퓨터 생성 출력물을 사용하여 찾는다.

지속적 이해 (DAT-3): 유의성 검정은 특정 맥락 내에서의 가설에 대한 의사결정을 가능하게 한다.

학습 목표 DAT-3.I: 카이제곱 적합도 검정의 $p$-값을 해석한다. [스킬 4.B]

  • DAT-3.I.1 카이제곱 적합도 검정의 $p$-값에 대한 해석은 영가설과 확률 모델이 참이라는 조건 하에서 관측된 값보다 같거나 더 극단적인 검정 통계량을 얻을 확률이다.

학습 목표 DAT-3.J: 카이제곱 적합도 검정 결과를 바탕으로 모집단에 대한 주장을 정당화한다. [스킬 4.E]

  • DAT-3.J.1 영가설을 기각하거나 기각할 수 없는 결정은 $p$-값과 유의수준 $\alpha$의 비교에 근거한다.
  • DAT-3.J.2 카이제곱 적합도 검정 결과는 표본된 모집단에 대한 연구 질문에 대한 답을 지지하는 통계적 추론으로 활용될 수 있다.

Source: College Board AP Course and Exam Description · ⁨출처: College Board AP Course and Exam Description⁩

English

Compute $\chi^2=\sum\dfrac{(O-E)^2}{E}$ with $df=(\text{number of categories})-1$. Find the $p$-value from the chi-square distribution (upper tail), compare to $\alpha$, and conclude in context. A large component of the sum points to the category that deviates most.

Worked example. A die rolled $60$ times gives counts $8,10,12,9,11,10$. If it is fair, each expected count is $60/6=10$, so

$$\chi^2=\frac{(8-10)^2}{10}+\frac{(10-10)^2}{10}+\frac{(12-10)^2}{10}+\frac{(9-10)^2}{10}+\frac{(11-10)^2}{10}+\frac{(10-10)^2}{10}=0.4+0+0.4+0.1+0.1+0=1.0,$$
with $df=6-1=5$. Write out every category, including the two that match their expected count exactly and so add $0$ – the sum runs over all six categories, and $df$ counts categories, not just the ones that differ. This $\chi^2$ is small (a large $p$-value), so we fail to reject $H_0$ – no evidence the die is unfair.

한국어

$\chi^2=\sum\dfrac{(O-E)^2}{E}$를 $df=(\text{number of categories})-1$과 함께 계산하십시오. 카이제곱 분포에서 $p$-value를 구하고(오른쪽 꼬리), $\alpha$와 비교하여 문맥 속에서 결론을 내리십시오. 합산의 큰 구성 요소는 가장 편차가 큰 범주를 가리킵니다.

카이제곱은 관측 빈도와 귀무가설 하의 기대 빈도를 비교합니다
카이제곱은 관측된 빈도와 귀무가설 하에서 기대되는 빈도를 비교합니다

해설 예시. 주사위를 $60$회 굴렸을 때 빈도가 $8,10,12,9,11,10$입니다. 공평하다면 각 기대 빈도는 $60/6=10$이므로,

$$\chi^2=\frac{(8-10)^2}{10}+\frac{(10-10)^2}{10}+\frac{(12-10)^2}{10}+\frac{(9-10)^2}{10}+\frac{(11-10)^2}{10}+\frac{(10-10)^2}{10}=0.4+0+0.4+0.1+0.1+0=1.0,$$
$df=6-1=5$를 사용하여. 모든 범위를 나열하고, 예상 개수와 정확히 일치하는 두 가지 범위를 포함하여 $0$를 더하십시오 – 합은 모든 6개 범위에 대해 이루어지며, $df$는 단순히 다른 범위가 아닌 모든 범위를 세는 것입니다. 이 $\chi^2$는 작습니다(큰 $p$-값), 따라서 우리는 $H_0$를 기각하지 못합니다 – 주사위가 불공정하다는 증거가 없습니다.

Explore · ⁨탐색하기⁩

Explore the chi-square distribution and its p-value · ⁨카이제곱 분포와 그 p-value 탐색하기⁩

The p-value is the area in the right tail beyond your test statistic, so a larger $\chi^2$ means a smaller p-value. Drag $\chi^2$ to watch that area shrink, and drag df to see the whole family change shape — strongly right-skewed at small df, more symmetric as df grows. · ⁨p-값은 검정 통계량 이상의 우측 꼬리 면적이므로, 더 큰 $\chi^2$은 더 작은 p-값을 의미합니다. $\chi^2$을 드래그하여 면적이 줄어드는 것을 확인하고, df를 드래그하여 전체 집합의 모양 변화를 관찰할 수 있습니다. df가 작을 때는 우측 꼬리가 심하게 치우쳐 있으며, df가 커질수록 대칭성에 가까워집니다.⁩

8.4

Expected Counts in Two-Way Tables · ⁨2차원 표의 예상 개수⁩

Syllabus
English

Enduring Understanding (VAR-8): The chi-square distribution may be used to model variation.

Learning Objective VAR-8.H: Calculate expected counts for two-way tables of categorical data. [Skill 3.A]

  • VAR-8.H.1 The expected count in a particular cell of a two-way table of categorical data can be calculated using the formula:
    • Equation: $expected\ count = \dfrac{(row\ total)(column\ total)}{table\ total}$.
한국어

지속적 이해 (VAR-8): 카이제곱 분포는 변동성을 모델링하는 데 사용될 수 있다.

학습 목표 VAR-8.H: 범주형 데이터의 이원 표에 대한 기대값을 계산한다. [스킬 3.A]

  • VAR-8.H.1 범주형 데이터의 이원 표의 특정 셀에 대한 기대값은 다음 공식을 사용하여 계산할 수 있다:
    • 식: $expected\ count = \dfrac{(row\ total)(column\ total)}{table\ total}$.

Source: College Board AP Course and Exam Description · ⁨출처: College Board AP Course and Exam Description⁩

English

For a two-way table, the expected count in a cell (under "no association") is

$$E=\frac{(\text{row total})\times(\text{column total})}{\text{grand total}}.$$
This is the count you would see if the row and column variables were unrelated.

Worked example. In a two-way table a cell's row total is $40$, its column total is $50$, and the grand total is $200$. Its expected count is $E=\dfrac{40\times50}{200}=10$. Repeating for every cell gives the expected table to compare against the observed one.

한국어

2차원 표에서 한 셀의 예상 개수("무관성" 가정 하)는 다음과 같습니다.

$$E=\frac{(\text{row total})\times(\text{column total})}{\text{grand total}}.$$
이는 행과 열 변수가 서로 무관할 때 관측할 수 있는 개수입니다.

해설 예제. 2차원 표에서 한 셀의 행 합계가 $40$, 열 합계가 $50$이며, 전체 합계가 $200$라면, 그 셀의 예상 개수는 $E=\dfrac{40\times50}{200}=10$입니다. 이를 모든 셀에 대해 반복하면 관측된 표와 비교할 수 있는 예상 표를 얻을 수 있습니다.

카이제곱 검정 전 범주형 계수를 정리한 스프레드시트
8.5

Homogeneity or Independence? · ⁨균일성 검정인지 독립성 검정인가?⁩

Syllabus
English

Enduring Understanding (VAR-8): The chi-square distribution may be used to model variation.

Learning Objective VAR-8.I: Identify the null and alternative hypotheses for a chi-square test for homogeneity or independence. [Skill 1.F]

  • VAR-8.I.1 The appropriate hypotheses for a chi-square test for homogeneity are:

    $H_0$: There is no difference in distributions of a categorical variable across populations or treatments.

    $H_a$: There is a difference in distributions of a categorical variable across populations or treatments.

  • VAR-8.I.2 The appropriate hypotheses for a chi-square test for independence are:

    $H_0$: There is no association between two categorical variables in a given population or the two categorical variables are independent.

    $H_a$: Two categorical variables in a population are associated or dependent.

Learning Objective VAR-8.J: Identify an appropriate testing method for comparing distributions in two-way tables of categorical data. [Skill 1.E]

  • VAR-8.J.1 When comparing distributions to determine whether proportions in each category for categorical data collected from different populations are the same, the appropriate test is the chi-square test for homogeneity.
  • VAR-8.J.2 To determine whether row and column variables in a two-way table of categorical data might be associated in the population from which the data were sampled, the appropriate test is the chi-square test for independence.

Learning Objective VAR-8.K: Verify the conditions for making statistical inferences when testing a chi-square distribution for independence or homogeneity. [Skill 4.C]

  • VAR-8.K.1 In order to make statistical inferences for a chi-square test for two-way tables (homogeneity or independence), we must verify the following:
    • a. To check for independence:
      • i. For a test for independence: Data should be collected using a simple random sample.
      • ii. For a test for homogeneity: Data should be collected using a stratified random sample or randomized experiment.
      • iii. When sampling without replacement, check that $n \leq 10\%N$.
    • b. The chi-square tests for independence and homogeneity become more accurate with more observations, so large counts should be used (shape).
      • i. A conservative check for large counts is that all expected counts should be greater than 5.
한국어

지속적 이해 (VAR-8): 카이제곱 분포는 변동성을 모델링하는 데 사용될 수 있다.

학습 목표 VAR-8.I: 치제동질성 검정 또는 독립성 검정을 위한 귀무가설과 대안가설을 식별한다. [기술 1.F]

  • VAR-8.I.1 치제동질성 검정에 적합한 가설은 다음과 같다:

    $H_0$: 모집단이나 처리 간 범주형 변수의 분포에는 차이가 없다.

    $H_a$: 모집단이나 처리 간 범주형 변수의 분포에는 차이가 있다.

  • VAR-8.I.2 치제독립성 검정에 적합한 가설은 다음과 같다:

    $H_0$: 주어진 모집단 내 두 범주형 변수 간에 연관성이 없거나 두 범주형 변수는 서로 독립이다.

    $H_a$: 모집단 내 두 범주형 변수는 연관되어 있거나 종속적이다.

학습 목표 VAR-8.J: 범주형 데이터의 이차원 표에서 분포를 비교할 때 적절한 검정 방법을 식별한다. [기술 1.E]

  • VAR-8.J.1 서로 다른 모집단에서 수집한 범주형 데이터의 각 범주별 비례가 동일한지 확인하기 위해 분포를 비교할 때 적절한 검정은 치제동질성 검정이다.
  • VAR-8.J.2 범주형 데이터의 이차원 표에서 행 변수와 열 변수가 표본이 추출된 모집단 내에서 연관될 수 있는지를 확인하기 위해 적절한 검정은 치제독립성 검정이다.

학습 목표 VAR-8.K: 치제독립성 검정 또는 동질성 검정을 수행할 때 통계적 추론을 위한 조건을 검증한다. [기술 4.C]

  • VAR-8.K.1 이차원 표(동질성 또는 독립성)에 대한 치제검정의 통계적 추론을 하기 위해서는 다음을 검증해야 한다:
    • a. 독립성 확인:
      • i. 독립성 검정: 데이터는 단순 무작위 표본을 사용하여 수집되어야 한다.
      • ii. 동질성 검정: 데이터는 층화 무작위 표본 또는 무작위 실험을 사용하여 수집되어야 한다.
      • iii. 교체 없는抽样 시, $n \leq 10\%N$인지 확인한다.
    • b. 독립성 검정과 동질성 검정은 관측치가 많아질수록 정확해지므로, 큰 기대 빈도를 사용해야 한다(분포 형태).
      • i. 큰 횟수에 대한 보수적 검증 기준은 모든 기대값이 5보다 커야 한다는 것이다.

Source: College Board AP Course and Exam Description · ⁨출처: College Board AP Course and Exam Description⁩

English

Two tests use the same $\chi^2$ math but answer different questions:

  • Test for homogeneity 同质性: are the distributions of one categorical variable the same across several populations or groups (separate samples/treatments)?
  • Test for independence 独立性: are two categorical variables associated within a single population (one sample, two variables measured)?

The design (several samples vs one sample) decides which name and hypotheses to use.

한국어

두 검정은 동일한 $\chi^2$ 수식을 사용하지만 서로 다른 질문에 대한 답을 제공합니다:

  • 균일성 검정: 하나의 범주형 변수의 분포가 여러 집단 또는 그룹(별개의 샘플/처치) 간에 동일한가?
  • 독립성 검정: 두 범주형 변수가 단일 집단의 내부에서 연관되어 있는가(하나의 샘플, 두 변수 측정)?

연구 설계(여러 샘플 대 단일 샘플)에 따라 사용하는 이름과 가설이 결정됩니다.

8.6

Carrying Out a Test for Homogeneity or Independence · ⁨균일성 또는 독립성 검정 수행⁩

Syllabus
Enduring UnderstandingLearning ObjectiveEssential Knowledge

VAR-8
The chi-square distribution may be used to model variation.

VAR-8.L
Calculate the appropriate statistic for a chi-square test for homogeneity or independence. [Skill 3.E]

  • VAR-8.L.1 The appropriate test statistic for a chi-square test for homogeneity or independence is the chi-square statistic:
    • Equation: $\chi^2 = \sum \dfrac{(Observed\ count - Expected\ count)^2}{Expected\ count}$, with degrees of freedom equal to: $(number\ of\ rows - 1)(number\ of\ columns - 1)$.

VAR-8.M
Determine the $p$-value for a chi-square significance test for independence or homogeneity. [Skill 3.E]

  • VAR-8.M.1 The $p$-value for a chi-square test for independence or homogeneity for a number of degrees of freedom is found using the appropriate table or technology.
  • VAR-8.M.2 For a test of independence or homogeneity for a two-way table, the $p$-value is the proportion of values in a chi-square distribution with appropriate degrees of freedom that are equal to or larger than the test statistic.

DAT-3
Significance testing allows us to make decisions about hypotheses within a particular context.

DAT-3.K
Interpret the $p$-value for the chi-square test for homogeneity or independence. [Skill 4.B]

  • DAT-3.K.1 An interpretation of the $p$-value for the chi-square test for homogeneity or independence is the probability, given the null hypothesis and probability model are true, of obtaining a test statistic as, or more, extreme than the observed value.

DAT-3.L
Justify a claim about the population based on the results of a chi-square test for homogeneity or independence. [Skill 4.E]

  • DAT-3.L.1 A decision to either reject or fail to reject the null hypothesis for a chi-square test for homogeneity or independence is based on comparison of the $p$-value to the significance level, $\alpha$.
  • DAT-3.L.2 The results of a chi-square test for homogeneity or independence can serve as the statistical reasoning to support the answer to a research question about the population that was sampled (independence) or the populations that were sampled (homogeneity).

Source: College Board AP Course and Exam Description · ⁨출처: College Board AP Course and Exam Description⁩

English

Compute expected counts, then $\chi^2=\sum\dfrac{(O-E)^2}{E}$ over all cells, with

$$df=(\text{rows}-1)(\text{columns}-1).$$
Conditions: random data, all expected counts $\ge 5$, 10% condition. Find the $p$-value, compare to $\alpha$, and conclude in context – evidence of a difference between groups (homogeneity) or of an association (independence).

한국어

예상 개수를 계산한 후, 모든 셀에 대해 $\chi^2=\sum\dfrac{(O-E)^2}{E}$를 계산하며,

$$df=(\text{rows}-1)(\text{columns}-1).$$
조건: 무작위 데이터, 모든 기대 빈도가 $\ge 5$, 10% 조건. $p$-값을 구하고 $\alpha$과 비교하여 문맥 속에서 결론을 내리십시오 – 그룹 간 차이(균등성)에 대한 증거이거나 상관관계(독립성)에 대한 증거입니다.

8.7

Choosing the Right Categorical Procedure · ⁨적절한 범주형 절차 선택⁩

Syllabus
English

This topic is intended to focus on the skill of selecting an appropriate inference procedure now that students have a range of options. Students should be given opportunities to practice when and how to apply all learning objectives relating to inference for categorical data.

한국어

이 단원은 학생들이 다양한 옵션을 갖추게 된 후 적절한 추론 절차를 선택하는 기술에 집중하는 것을 목적으로 한다. 학생들에게 범주형 데이터에 대한 추론과 관련된 모든 학습 목표를 언제 및 어떻게 적용할지 연습할 기회가 제공되어야 한다.

Source: College Board AP Course and Exam Description · ⁨출처: College Board AP Course and Exam Description⁩

English

Decide by the setup: one categorical variable against a claimed distribution $\Rightarrow$ goodness-of-fit; one sample cross-classified by two variables $\Rightarrow$ independence; several samples/groups compared $\Rightarrow$ homogeneity. Comparing just two proportions can use either a two-proportion $z$-test or a chi-square test, but only for a two-tailed alternative, where they agree exactly ($\chi^2=z^2$). A chi-square test is always two-tailed, so it cannot give a directional conclusion: if $H_a$ is one-tailed (say $p_1>p_2$), use the $z$-test.

한국어

설정에 따라 결정: 하나의 범주형 변수와 주장된 분포 $\Rightarrow$ 적합도 검정; 하나의 표본이 두 변수로 교차 분류됨 $\Rightarrow$ 독립성 검정; 여러 표본/집단이 비교됨 $\Rightarrow$ 동질성 검정. 오직 두 비율을 비교할 때는 두 비율 $z$-검정 또는 카이제곱 검정을 사용할 수 있으나, 오직 양측 대안가설에서 정확히 일치함 ($\chi^2=z^2$). 카이제곱 검정은 항상 양측이므로 방향성을 가지는 결론을 내릴 수 없음: 만약 $H_a$가 일측(예 $p_1>p_2$)이라면, $z$-검정을 사용해야 함.

Explore · ⁨탐색하기⁩

Which chi-square test is this? · ⁨이것은 어떤 카이제곱 검정입니까?⁩

All three tests use the same $\chi^2$ arithmetic, so the marks are won by naming the right one. The design decides — how many samples were taken, and how many variables were measured on each unit. · ⁨세 가지 검정 모두 같은 $\chi^2$ 연산을共用하므로, 정답을 올바르게 지목하는 것이 점수를 얻는 열쇠입니다. 검정의 설계가 이를 결정하는데, 몇 개의 표본을 취했는지, 그리고 각 단위당 몇 개의 변수를 측정했는지에 따라 달라집니다.⁩

8.7

Exam tips · ⁨시험 팁⁩

English
  • Use $\chi^2=\sum\tfrac{(O-E)^2}{E}$ for categorical data; always divide by the expected count.
  • Pick the right test: goodness-of-fit (one variable), independence, or homogeneity (two-way table).
  • Compute expected counts as $\tfrac{\text{row total}\times\text{column total}}{\text{grand total}}$ and check each is $\ge5$.
  • A large $\chi^2$ (small p-value) means observed counts differ from expected by more than chance.
  • State degrees of freedom correctly (categories $-1$, or $(r-1)(c-1)$).
한국어
  • 범주형 데이터에는 $\chi^2=\sum\tfrac{(O-E)^2}{E}$를 사용하고, 반드시 기대 빈도를 나눈다.
  • 올바른 검정을 선택: 적합도 검정(한 변수), 독립성, 또는 동질성(이원 표).
  • 기대 빈도를 $\tfrac{\text{row total}\times\text{column total}}{\text{grand total}}$로 계산하고 각 값이 $\ge5$인지 확인한다.
  • 큰 $\chi^2$(작은 p-value)는 관측 빈도가 우연보다 기대 빈도와 더 크게 차이남을 의미함.
  • 자유도를 올바르게 명시(카테고리 $-1$, 또는 $(r-1)(c-1)$).

Interactive lessons on this topic · ⁨이 주제에 대한 인터랙티브 수업⁩

Work through it step by step, with instant-check exercises. · ⁨즉시 체크 기능 exercises를 통해 단계별로 진행하세요.⁩

Past Papers · ⁨과거 시험지⁩

More topics in AP Statistics · ⁨AP 통계학⁩ · ⁨AP Statistics · ⁨AP 통계학⁩ 내 추가 주제⁩

Log in or create account · ⁨로그인 또는 계정 만들기⁩

IGCSE, A-Level & AP