Skip to content · ⁨본문 바로가기⁩

Supply and Demand · ⁨공급과 수요⁩

AP Microeconomics · ⁨AP 경제학 (미시)⁩ · Topic 2 · ⁨주제 2⁩

Video lesson for this topic · ⁨이 주제용 영상 수업⁩ Open the video page · ⁨영상 페이지 열기⁩
10:39

공급과 수요

왜 커피 한 잔은 그 가격을 가질까요? 아무도 결정하지 않았습니다. 위원회도 공식 가격표도 없습니다. 오직 구매자만이 있습니다. 그들은 가격이 …일 때 더 사고 싶어 합니다.

English narration · English + 中文 subtitles burned in · ⁨영어 내레이션 · 영어 + 중국어 자막 burned-in⁩

2.1

Demand · ⁨수요⁩

Syllabus
English

Enduring Understanding (MKT-3): Individuals and firms respond to incentives and face constraints.

Learning Objective MKT-3.A: a. Define (using graphs as appropriate) key terms and factors related to consumer decision making and the law of demand. b. Explain (using graphs as appropriate) the relationship between price and quantity demanded and how buyers respond to incentives and constraints.

  • MKT-3.A.1 A well-defined system of property rights is necessary for the market system to function well.
  • MKT-3.A.2 Economic agents respond to incentives.
  • MKT-3.A.3 Individuals often respond to incentives, such as those presented by prices, but also face constraints, such as income, time, and legal and regulatory frameworks.
  • MKT-3.A.4 The law of demand suggests that a change in the own-price causes a change in quantity demanded in the opposite direction and a movement along a demand (marginal benefit) curve.
  • MKT-3.A.5 The conceptual relationship between price and quantity stated by the law of demand leads to downward-sloping demand curves explained by the income effect and substitution effect and/or by diminishing marginal utility.
  • MKT-3.A.6 The market demand curve (schedule) is derived from the summation of individual demand curves (schedules).

Learning Objective MKT-3.B: Explain (using graphs as appropriate) buyers' responses to changes in incentives and constraints.

  • MKT-3.B.1 Changes in the determinants of consumer demand can cause the demand curve to shift.
한국어

지속적 이해 (MKT-3): 개인과 기업은 유인에 반응하며 제약을 받는다.

학습 목표 MKT-3.A: a. 소비자의 의사결정 및 수요의 법칙과 관련된 핵심 용어 및 요인을 정의하시오(필요시 그래프 활용). b. 가격과 수량 간 관계 및 구매자가 유인과 제약에 어떻게 반응하는지를 설명하시오(필요시 그래프 활용).

  • MKT-3.A.1 시장 체제가 원활하게 작동하기 위해서는 명확히 정의된 재산권 체계가 필요하다.
  • MKT-3.A.2 경제 주체는 유인에 반응한다.
  • MKT-3.A.3 개인은 가격과 같은 유인에 자주 반응하지만, 소득, 시간, 법적 및 규제 체계와 같은 제약을 받기도 한다.
  • MKT-3.A.4 수요의 법칙에 따르면 자가격 격의 변화는 수량에 반대 방향으로 변화를 일으키며, 이는 수요(한계 효용) 곡선 위에서의 이동을 의미한다.
  • MKT-3.A.5 수요의 법칙이 제시하는 가격과 수량의 개념적 관계는 소득 효과와 대체 효과, 그리고/또는 한계 효용 체감 원리에 의해 하향 경사需求 곡선으로 설명된다.
  • MKT-3.A.6 시장 수요 곡선(수요표)은 개별 수요 곡선(수요표)들의 합산에서 유도된다.

학습 목표 MKT-3.B: 유인과 제약의 변화에 대한 구매자의 반응을 설명하시오(필요시 그래프 활용).

  • MKT-3.B.1 소비자의 수요를 결정하는 요인의 변화는 수요 곡선을 이동시킬 수 있다.
Source: College Board AP Course and Exam Description · ⁨출처: College Board AP Course and Exam Description⁩

English
Supply & demand: a shift raises P and Q

A market works only where property rights 产权 are well defined – owners can use, exclude others from, and trade their resources; without them, prices cannot coordinate exchange. Within that framework, the two forces are demand and supply.

Demand 需求 is the relationship between the price of a good and the quantity buyers are willing and able to buy. The law of demand 需求定律 says price and quantity demanded move in opposite directions, so the demand curve slopes downward. Two reasons: the substitution effect 替代效应 (when a good gets pricier, buyers switch to alternatives) and the income effect 收入效应 (a higher price shrinks real purchasing power).

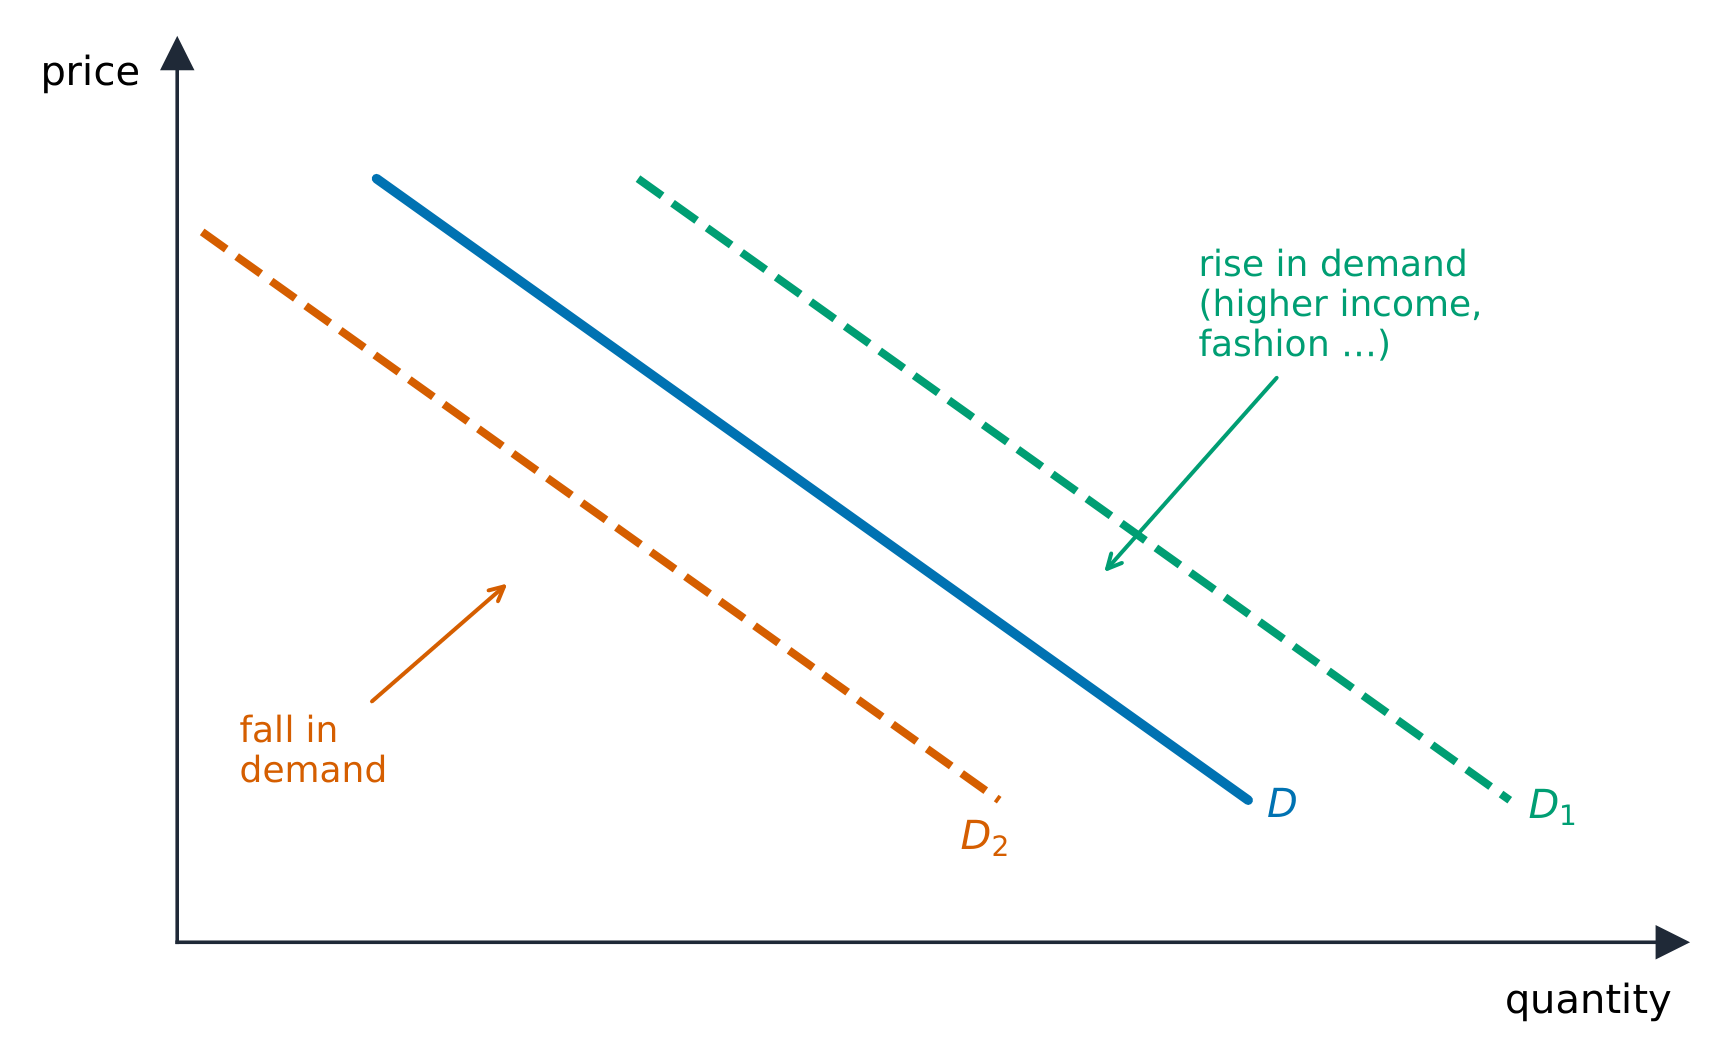
Distinguish a change in quantity demanded (a move along the curve, caused only by the good's own price) from a change in demand (a shift of the whole curve). Demand shifts with the determinants 决定因素, remembered as TRIBE:

  • Tastes/preferences,
  • Related goods – a rise in the price of a substitute 替代品 raises demand; a rise in the price of a complement 互补品 lowers it,
  • Income – for a normal good 正常商品 more income raises demand; for an inferior good 低档商品 it lowers it,
  • Buyers (number of consumers),
  • Expectations of future price or income.

The market demand curve is the horizontal summation 水平相加 of every individual buyer's demand curve – at each price, add up the quantities all buyers want. That is why more buyers (the B above) shifts the whole market curve to the right.

한국어
시장 속 쇼핑객: 수요는 수량 요구가 가격에 어떻게 반응하는지를 보여줍니다
시장 속 구매자: 수요는 수요량이 가격에 어떻게 반응하는지를 보여준다
공급 및 수요: 이동은 P와 Q를 높입니다

시장은 재산권이 명확히 정의될 때만 기능한다. 소유자는 자원을 사용하거나 타인을 배제하며 거래할 수 있으며, 재산권이 없으면 가격은 교환을 조정할 수 없다. 그 틀 안에서는 두 가지 힘인 수요와 공급이 작용한다.

수요는 재화의 가격과 구매자가 사려하고 구매할 수 있는 수량 간의 관계이다. 수요의 법칙은 가격과 수需求量가 반대 방향으로 움직이므로 수요곡선은 하향으로 경사됨을 말한다. 그 이유는 교체효과(재화가 비싸지면 구매자가 대체재로 전환함)와 소득효과(높은 가격이 실질 구매력을 감소시) 때문이다.

수요 곡선은 아래로 경사되며, 소득, 취향, 관련 가격이 이를 이동시킵니다

수요량의 변화(곡선 상에서의 이동, 오직 재화의 자신 가격에 의해 발생)와 수요의 변화(전체 곡선의 이동)를 구별하라. 수요는 TRIBE라고 기억되는 요구인자에 따라 이동한다:

  • Taste/Preference(취향/선호),
  • Related goods(관련재): 대체재의 가격이 상승하면 수요가 증가하고, 보완재의 가격이 상승하면 수요가 감소함,
  • Income(소득): 정상재는 소득 증가 시 수요가 늘고, 저급재는 소득 증가 시 수요가 줄어듦,
  • Buyers(구매자: 소비자 수),
  • Expectations of future price or income(미래 가격 또는 소득에 대한 기대).

시장수요곡선은 각 개별 구매자의 수요곡선을 수평 합산한 것이다. 모든 가격 수준에서 모든 구매자가 원하는 수량을 더하는 것이므로, 더 많은 구매자(B)가 시장 전체 곡선을 오른쪽으로 이동시킨다.

Explore · ⁨탐색하기⁩

Shift demand and watch price and quantity · ⁨수요를 이동시키고 가격 및 수량 확인하기⁩

The demand curve slopes down: lower price, more wanted. A change in income, tastes or related-good prices shifts the whole curve, moving the equilibrium. · ⁨수요 곡선은 하향 사선입니다: 가격이 낮을수록 더 많이 원합니다. 소득, 취향 또는 관련재 가격의 변화는 전체 곡선을 이동시켜 균형을 바꿉니다.⁩

Vocabulary · ⁨어휘⁩ Train · ⁨연습하기⁩
English 한국어
property rights/ˈprɒpəti raɪts/ 재산권
Demand/dɪˈmænd/ 수요
law of demand/lɔː ɒv dɪˈmænd/ 수요의 법칙
substitution effect/ˌsʌbstɪˈtjuːʃn ɪˈfekt/ 교체 효과
income effect/ˈɪŋkʌm ɪˈfekt/ 소득 효과 때문
determinants/dɪˈtɜːmɪnənts/ 영향 요인(determinants)
substitute/ˈsʌbstɪtjuːt/ 치환
complement/ˈkɒmplɪmənt/ 보 event
normal good/ˈnɔːml ɡʊd/ 정품
inferior good/ɪnˈfɪərɪə ɡʊd/ 저급품
horizontal summation/ˌhɒrɪˈzɒntl sʌˈmeɪʃn/ 수평 합계
Supply/səˈplaɪ/ 공급
law of supply/lɔː ɒv səˈplaɪ/ 공급의 법칙(law of supply)
subsidies/ˈsʌbsɪdiz/ 보조금
Price elasticity of demand/praɪs ɪlæˈstɪsɪti ɒv dɪˈmænd/ 수요의 가격 탄력성
2.2

Supply · ⁨공급⁩

Syllabus
English

Enduring Understanding (MKT-3): Individuals and firms respond to incentives and face constraints.

Learning Objective MKT-3.C: a. Define (using graphs as appropriate) the law of supply. b. Explain (using graphs as appropriate) the relationship between price and quantity supplied.

  • MKT-3.C.1 A change in own-price causes a change in quantity supplied in the same direction and a movement along a supply curve.
  • MKT-3.C.2 The market supply curve (schedule) is derived from the summation of individual supply curves (schedules). The market supply curve is upward-sloping.

Learning Objective MKT-3.D: Explain (using graphs as appropriate) producers' (sellers') responses to changes in incentives and technology.

  • MKT-3.D.1 Changes in the determinants of supply can cause the supply curve to shift.
한국어

지속적 이해 (MKT-3): 개인과 기업은 유인에 반응하며 제약을 받는다.

학습 목표 MKT-3.C: a. 공급의 법칙을 정의하십시오(적절한 경우 그래프 사용). b. 가격과 공급량 간의 관계를 설명하시오(필요시 그래프 활용).

  • MKT-3.C.1 자가격 격의 변화는 공급량에 같은 방향으로 변화를 일으키며, 이는 공급 곡선 위에서의 이동을 의미한다.
  • MKT-3.C.2 시장 공급 곡선(공급표)은 개별 공급 곡선(공급표)들의 합산에서 유도된다. 시장 공급 곡선은 상향 경사이다.

학습 목표 MKT-3.D: 생산자(판매자)가 유인과 기술의 변화에 어떻게 반응하는지를 설명하시오(필요시 그래프 활용).

  • MKT-3.D.1 공급을 결정하는 요인의 변화는 공급 곡선을 이동시킬 수 있다.

Source: College Board AP Course and Exam Description · ⁨출처: College Board AP Course and Exam Description⁩

English
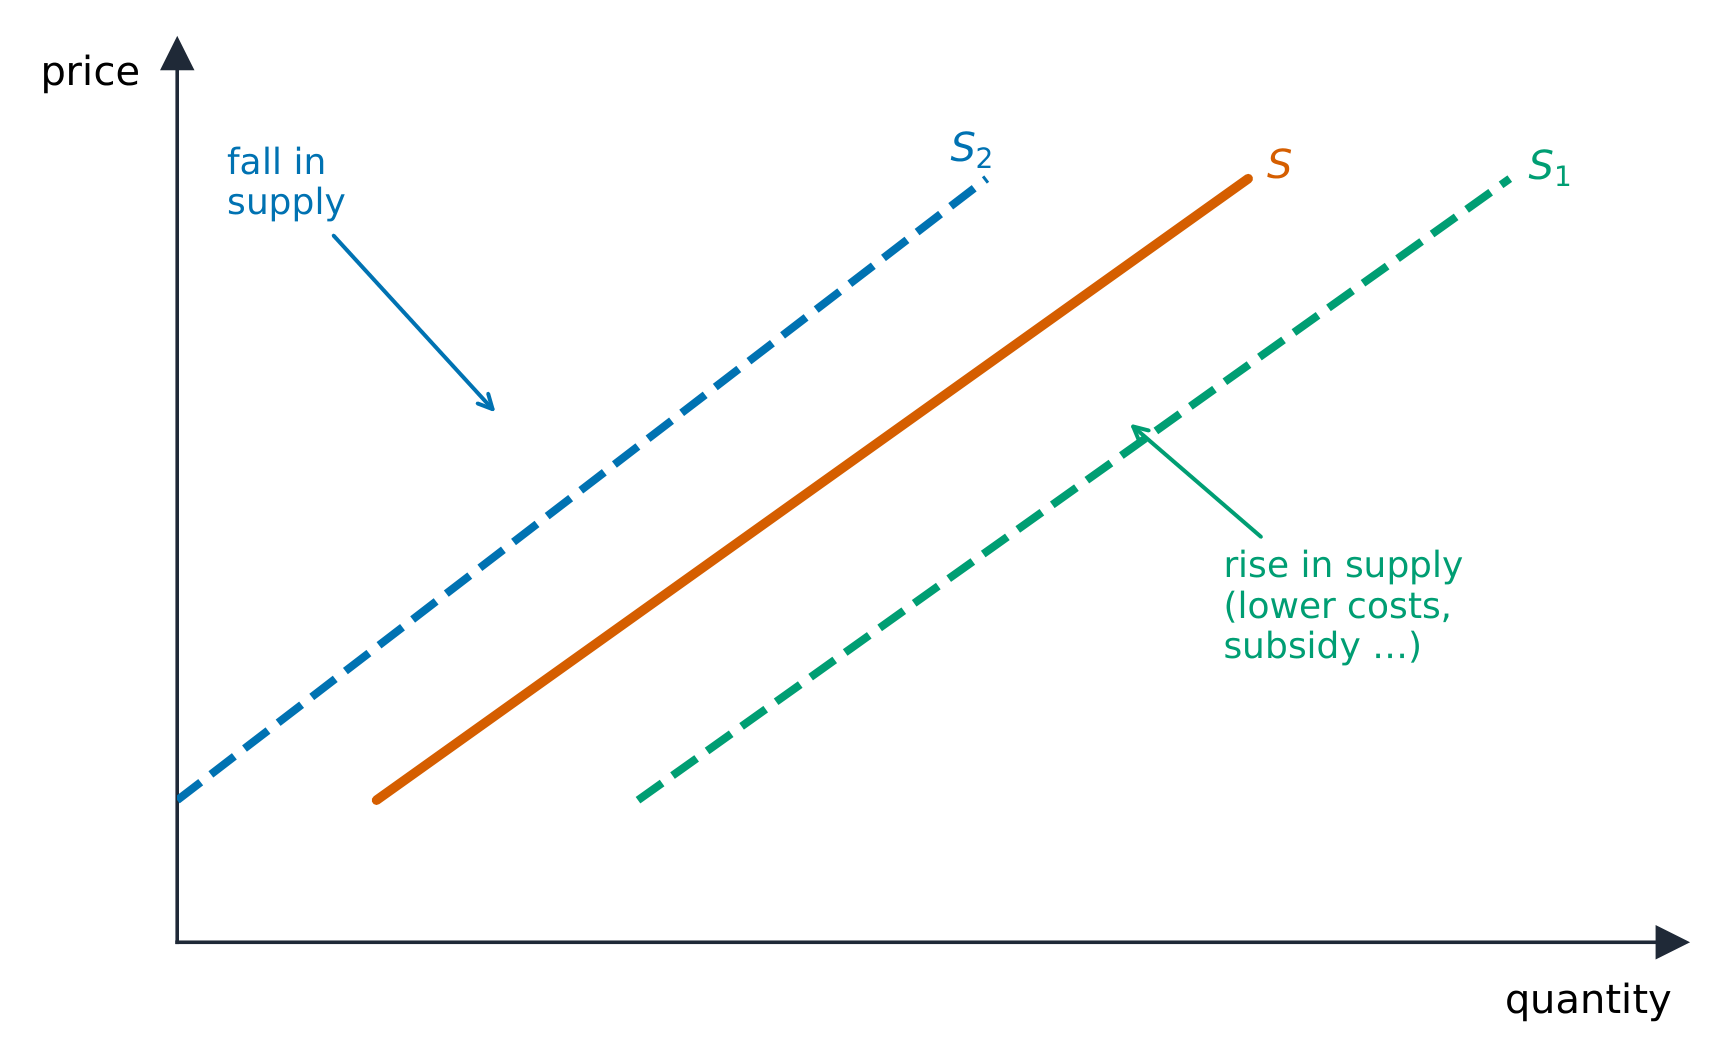
A shift in supply

Supply 供给 is the relationship between price and the quantity sellers will offer. The law of supply 供给定律: price and quantity supplied move in the same direction, so the supply curve slopes upward (higher prices cover higher marginal costs and reward more output).

Again separate a change in quantity supplied (movement along the curve, from the good's own price) from a change in supply (a shift). Supply shifts with input prices, technology, taxes and subsidies 补贴, prices of other goods a firm could make, number of sellers, and expectations. Just like demand, the market supply curve is the horizontal sum of individual firms' supply curves – add the quantities all firms offer at each price – so more sellers shifts market supply to the right.

Exam skill: on the free-response section you must draw correctly labeled supply-and-demand graphs and shift the right curve in the right direction – decide first whether the event changes an "own price" (move along) or a determinant (shift).

한국어
공급의 이동

공급은 가격과 판매자가 제공하려는 수량 간의 관계이다. 공급의 법칙: 가격과 공급량은 같은 방향으로 움직이므로 공급곡선은 상향으로 경사된다(높은 가격은 높은 한계비용을 커버하고 더 많은 산출에 보상을 제공함).

공급 곡선은 위로 경사되며, 비용, 기술, 세금, 보조금이 이를 이동시킵니다

다시 공급량의 변화(곡선 상에서의 이동, 재화의 자신 가격에 의해)와 공급의 변화(이동)를 분리하라. 공급은 投入價格, 기술, 세금 및 보조금, 기업이 생산할 수 있는 다른 재화의 가격, 판매자 수, 그리고 기대에 따라 이동한다. 수요와 마찬가지로 시장공급곡선은 각 기업의 공급곡선을 수평 합산한 것이며, 모든 가격 수준에서 모든 기업이 제공하는 수량을 더하므로, 더 많은 판매자가 시장공급을 오른쪽으로 이동시킨다.

시험 기술: 서술형 문제에서는 올바른 레이블이 붙은 공급-수요 그래프를 정확히 그려야 하며, 오른쪽 곡선을 올바른 방향으로 이동시켜야 한다. 먼저 해당 사건이 "자신 가격"(이동)을 변경하는지 아니면 요구인자(이동)를 변경하는지 결정하라.

2.3

Price Elasticity of Demand · ⁨수요의 가격 탄력성⁩

Syllabus
English

Enduring Understanding (MKT-3): Individuals and firms respond to incentives and face constraints.

Learning Objective MKT-3.E: a. Define measures of elasticity. b. Explain (using graphs where appropriate) measures of elasticity and the impact of a given price change on total revenue or total expenditure. c. Calculate (using data from a graph or a table as appropriate) measures of elasticity.

  • MKT-3.E.1 Economists use the concept of elasticity to measure the magnitude of percentage changes in quantity owing to any given changes in the own-price, income, and prices of related goods.
  • MKT-3.E.2 Price elasticity of demand is measured by the percentage change in quantity demanded divided by the percentage change in price or the responsiveness of the quantity demanded to changes in price. Elasticity varies along a linear demand curve, meaning slope is not elasticity.
  • MKT-3.E.3 Ranges of values of elasticity of demand are described as elastic or inelastic with the separating benchmark being a magnitude of 1, where the change in the price and the change in the quantity demanded are proportional.
    • a. When the magnitude of the value of elasticity is greater than 1, the demand is described as being elastic with respect to that price in the range of the given change.
    • b. When the magnitude of the value of elasticity is less than 1, the demand is described as being inelastic with respect to that price in the range of the given change.
    • c. When the magnitude of the value of elasticity is equal to 1, the demand is described as being unit elastic with respect to that price in the range of the given change.
  • MKT-3.E.4 The price elasticity of demand depends on certain factors such as the availability of substitutes.
  • MKT-3.E.5 The impact of a given price change on total revenue or total expenditure will depend on whether demand is elastic, inelastic, or unit elastic.
한국어

지속적 이해 (MKT-3): 개인과 기업은 유인에 반응하며 제약을 받는다.

학습 목표 MKT-3.E: a. 탄력성의 측정 지표를 정의하시오. b. 탄력성의 측정 지표와 특정 가격 변화가 총수입 또는 총지출에 미치는 영향을 설명하시오(필요시 그래프 활용). c. 탄력성의 측정 지표를 계산하시오(필요시 그래프나 표의 데이터 활용).

  • MKT-3.E.1 경제학자는 탄력성 개념을 사용하여 자가격 격, 소득, 관련 재화의 가격 등의 특정 변화에 따른 수량의 백분율 변화 크기를 측정하는 데 사용한다.
  • MKT-3.E.2 수요의 가격 탄력성은 수량의 백분율 변화량을 가격의 백분율 변화량으로 나눈 값으로 측정되거나, 수량이 가격 변화에 얼마나 민감하게 반응하는지로 정의된다. 탄력성은 선형 수요 곡선 위에서 변하므로, 기울기는 탄력성과 다르다.
  • MKT-3.E.3 수요의 탄력성 값 범위는 탄력적(elastic) 또는 비탄력적(inelastic)으로 묘사되며, 이때 구분 기준은 1이라는 크기이며, 이 경우 가격 변화와 수량 변화가 비례한다.
    • a. 탄력성 값의 크기가 1보다 클 때, 해당 가격에 대해 주어진 변화 범위 내에서 수요는 탄력적이라고 묘사된다.
    • b. 탄력성 값의 크기가 1보다 작을 때, 해당 가격에 대해 주어진 변화 범위 내에서 수요는 비탄력적이라고 묘사된다.
    • c. 탄력성 값의 크기가 1과 같을 때, 해당 가격에 대해 주어진 변화 범위 내에서 수요는 단위 탄력적(unit elastic)이라고 묘사된다.
  • MKT-3.E.4 수요의 가격 탄력성은 교대재의 가용성과 같은 특정 요인에 의존한다.
  • MKT-3.E.5 특정 가격 변화가 총수입 또는 총지출에 미치는 영향은 수요가 탄력적인지, 비탄력적인지, 아니면 단위 탄력적인지에 따라 달라진다.

Source: College Board AP Course and Exam Description · ⁨출처: College Board AP Course and Exam Description⁩

English
Price elasticity of demand

Price elasticity of demand 需求价格弹性 measures how responsive quantity demanded is to a price change:

$$E_d=\left|\frac{\%\ \Delta\ \text{quantity demanded}}{\%\ \Delta\ \text{price}}\right|.$$

  • $E_d>1$: elastic 富有弹性 (quantity responds strongly);
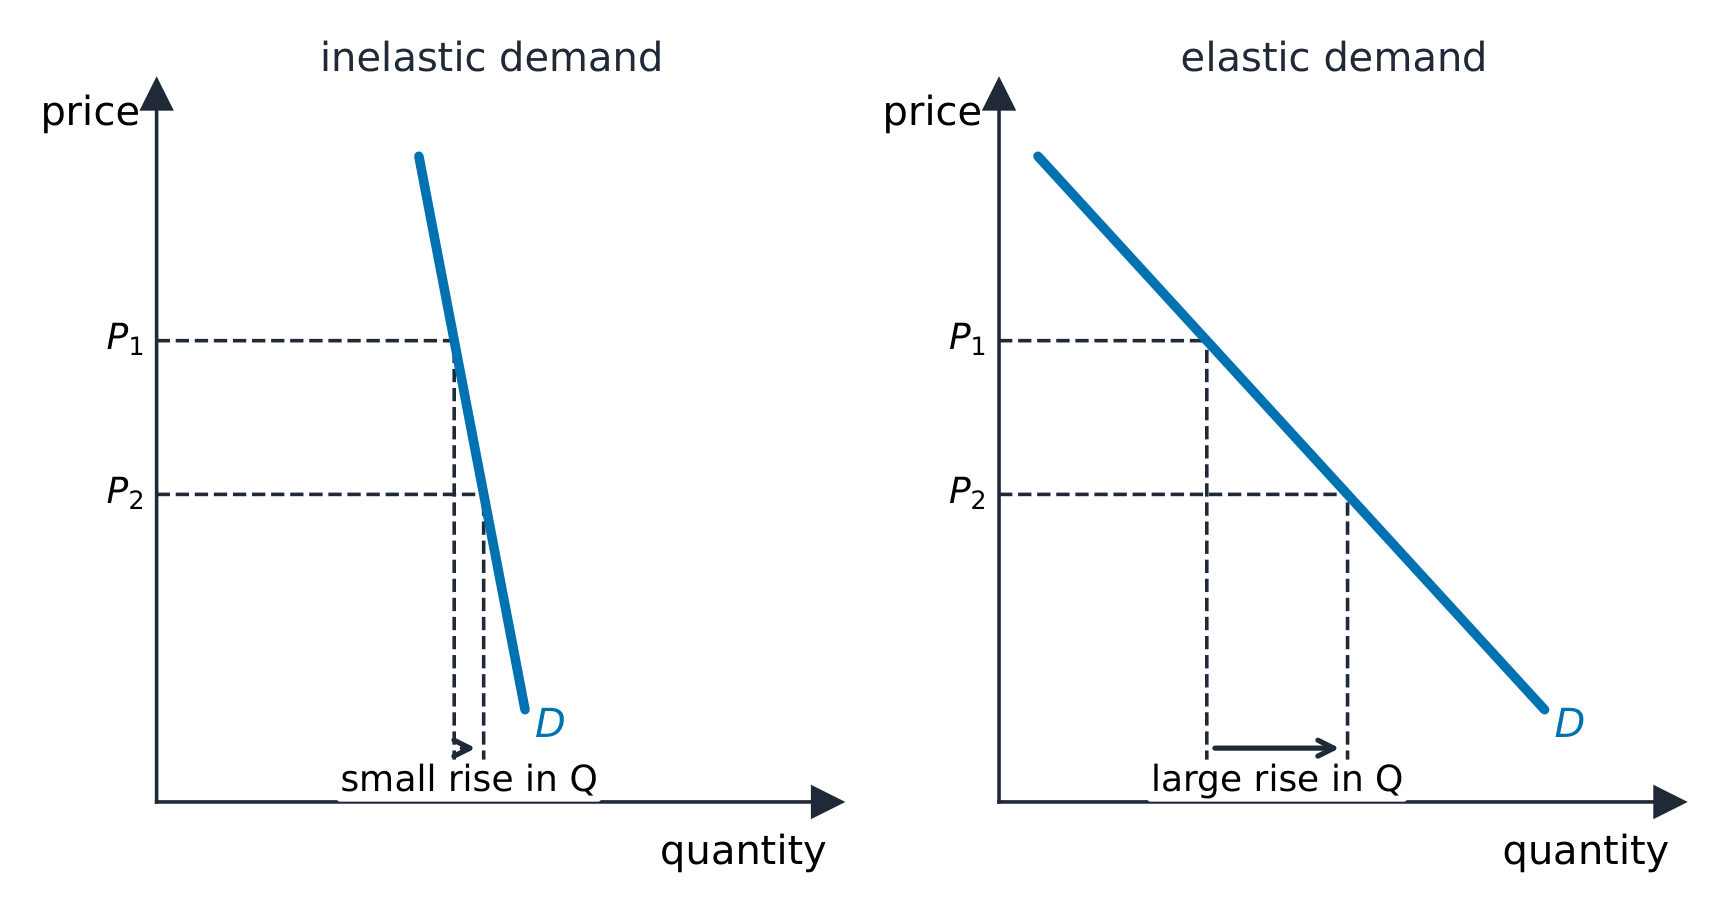
  • $E_d<1$: inelastic 缺乏弹性 (quantity barely responds);
  • $E_d=1$: unit elastic.

Demand is more elastic when there are more substitutes, the good is a luxury, it takes a large share of income, or buyers have more time to adjust. Elasticity links to total revenue 总收入 ($P\times Q$): if demand is elastic, a price cut raises revenue; if inelastic, a price cut lowers it. Along a straight-line demand curve, elasticity falls as you move down (elastic on top, inelastic at the bottom).

Worked example. A price rise from $\$10$ to $\$12$ (a $+20\%$ change) cuts quantity demanded from $100$ to $85$ (a $-15\%$ change). Then $E_d=\left|\dfrac{-15\%}{20\%}\right|=0.75<1$, so demand is inelastic. Because it is inelastic, the price rise raises total revenue: from $\$10\times100=\$1000$ to $\$12\times85=\$1020$.

한국어
수요의 가격 탄력성

수요의 가격 탄력성은 수요량이 가격 변화에 얼마나 민감하게 반응하는지를 측정한다:

$$E_d=\left|\frac{\%\ \Delta\ \text{quantity demanded}}{\%\ \Delta\ \text{price}}\right|.$$

비탄력적 수요와 탄력적 수요: 가격 변화에 대한 작은 반응 vs 큰 반응
비탄력적 수요와 탄력적 수요: 가격 변화에 따른 작은 반응과 큰 반응
  • $E_d>1$: 탄력적 (수량이 강하게 반응);
  • $E_d<1$: 비탄력적 (수량이 거의 반응하지 않음);
  • $E_d=1$: 단위 탄력적.

대체재가 많거나, 재화가 사치재이거나, 소득 중 차지하는 비중이 크거나, 구매자가进行调整에 더 많은 시간을 가질 때 수요는 더 탄력적이다. 탄력성은 총수입(Total Revenue) ($P\times Q$)과 연결된다: 수요가 탄력적이면 가격 인하가 수익을 증가시키고, 비탄력적이면 가격 인하가 수익을 감소시킨다. 직선 수요곡선 위에서 아래로 이동할수록 탄력성이 떨어진다(위쪽은 탄력적, 아래쪽은 비탄력적).

해설 예제. 가격이 $\$10$ to $\$12$로 상승함($+20\%$ 변화)으로 인해 수량 요구가 $100$에서 $85$로 감소함($-15\%$ 변화). 따라서 $E_d=\left|\dfrac{-15\%}{20\%}\right|=0.75<1$이므로, 수요는 비탄력적입니다. 비탄력적이므로 가격 상승은 총수입을 높입니다: $\$10\times100=\$1000$에서 시작하여 $\$12\times85=\$1020$로 증가합니다.

Explore · ⁨탐색하기⁩

Stretch price and measure elasticity · ⁨가격을 늘리고 탄력성 측정하기⁩

Price elasticity of demand is how strongly quantity responds to price. A steep curve is inelastic (small response); a shallow one is elastic (large response). · ⁨수요의 가격 탄력성은 수량이 가격에 얼마나 민감하게 반응하는지를 나타냅니다. 가파른 곡선은 비탄력적(작은 반응), 완만한 곡선은 탄력적(큰 반응)입니다.⁩

Vocabulary · ⁨어휘⁩ Train · ⁨연습하기⁩
English 한국어
elastic/ɪˈlæstɪk/ 탄성 충돌
inelastic/ɪnɪˈlæstɪk/ 비 탄력적일 때
total revenue/ˈtəʊtl ˈrevənjuː/ 총매출
Price elasticity of supply/praɪs ɪlæˈstɪsɪti ɒv səˈplaɪ/ 공급의 가격 탄력성
Cross-price elasticity/krɒs praɪs ɪlæˈstɪsɪti/ 교체 가격 탄력성
Income elasticity/ˈɪŋkʌm ɪlæˈstɪsɪti/ 소득 탄력성
2.4

Price Elasticity of Supply · ⁨공급의 가격 탄력성⁩

Syllabus
English

Enduring Understanding (MKT-3): Individuals and firms respond to incentives and face constraints.

Learning Objective MKT-3.E: a. Define measures of elasticity. b. Explain (using graphs where appropriate) measures of elasticity and the impact of a given price change on total revenue or total expenditure. c. Calculate (using data from a graph or a table as appropriate) measures of elasticity.

  • MKT-3.E.6 Price elasticity of supply is measured by the percentage change in quantity supplied divided by the percentage change in price, or the responsiveness of the quantity supplied to changes in price.
  • MKT-3.E.7 Ranges of values of elasticity of supply are described as elastic or inelastic with the separating benchmark being a magnitude of 1, where the change in the price and the change in the quantity supplied are proportional.
    • a. When the magnitude of the value of elasticity is greater than 1, the supply is described as being elastic with respect to that price in the range of the given change.
    • b. When the magnitude of the value of elasticity is less than 1, the supply is described as being inelastic with respect to that price in the range of the given change.
    • c. When the magnitude of the value of elasticity is equal to 1, the supply is described as being unit elastic with respect to that price in the range of the given change.
  • MKT-3.E.8 The price elasticity of supply depends on certain factors such as the price of alternative inputs.
한국어

지속적 이해 (MKT-3): 개인과 기업은 유인에 반응하며 제약을 받는다.

학습 목표 MKT-3.E: a. 탄력성의 측정 지표를 정의하시오. b. 탄력성의 측정 지표와 특정 가격 변화가 총수입 또는 총지출에 미치는 영향을 설명하시오(필요시 그래프 활용). c. 탄력성의 측정 지표를 계산하시오(필요시 그래프나 표의 데이터 활용).

  • MKT-3.E.6 공급의 가격 탄력성은 공급량의 백분율 변화량을 가격의 백분율 변화량으로 나눈 값으로 측정되거나, 공급량이 가격 변화에 얼마나 민감하게 반응하는지로 정의된다.
  • MKT-3.E.7 공급의 탄력성 값 범위는 탄력적(elastic) 또는 비탄력적(inelastic)으로 묘사되며, 이때 구분 기준은 1이라는 크기이며, 이 경우 가격 변화와 공급량 변화가 비례한다.
    • a. 탄력성 값의 크기가 1보다 클 때, 해당 가격에 대해 주어진 변화 범위 내에서 공급은 탄력적이라고 묘사된다.
    • b. 탄력성 값의 크기가 1보다 작을 때, 해당 가격에 대해 주어진 변화 범위 내에서 공급은 비탄력적이라고 묘사된다.
    • c. 탄력성 값의 크기가 1과 같을 때, 해당 가격에 대해 주어진 변화 범위 내에서 공급은 단위 탄력적(unit elastic)이라고 묘사된다.
  • MKT-3.E.8 공급의 가격 탄력성은 교대 투입재의 가격과 같은 특정 요인에 의존한다.

Source: College Board AP Course and Exam Description · ⁨출처: College Board AP Course and Exam Description⁩

English

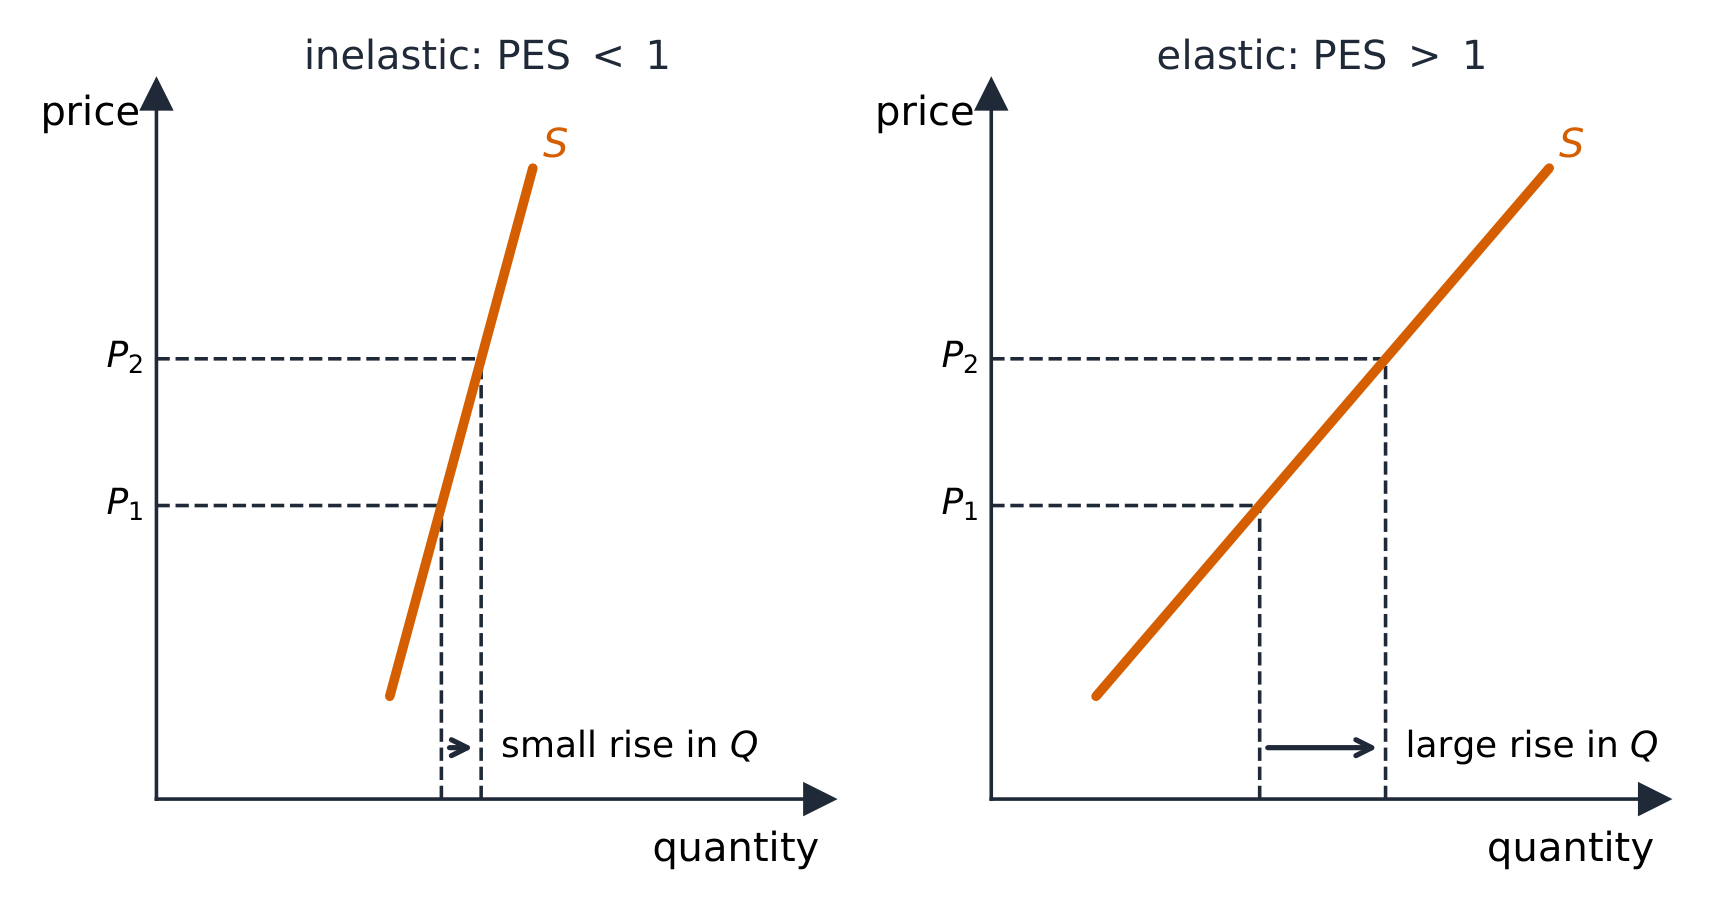
Price elasticity of supply 供给价格弹性, $E_s=\dfrac{\%\ \Delta\ Q_s}{\%\ \Delta\ P}$, measures how responsive sellers are. Supply is more elastic when firms can adjust output easily – spare capacity, storable goods, and above all more time (supply is more elastic in the long run than the short run).

한국어

공급의 가격 탄력성, $E_s=\dfrac{\%\ \Delta\ Q_s}{\%\ \Delta\ P}$,는 판매자가 얼마나 민감하게 반응하는지를 측정한다. 기업이 산출량을 쉽게 조정할 수 있을 때 공급은 더 탄력적이다—여유 용량, 보관 가능한 재화, 그리고 무엇보다 더 많은 시간(장기가 단기에 비해 공급 탄력성이 더 큼).

PES가 1 미만일 때는 동일한 가격 상승이 작은 공급 반응을, 1 이상일 때는 큰 공급 반응을 나타냄
PES가 1 미만일 때는 같은 가격 상승이 작은 공급 반응을, 1보다 클 때는 큰 공급 반응을 보인다
2.5

Other Elasticities · ⁨기타 탄력성⁩

Syllabus
English

Enduring Understanding (MKT-3): Individuals and firms respond to incentives and face constraints.

Learning Objective MKT-3.E: a. Define measures of elasticity. b. Explain (using graphs where appropriate) measures of elasticity and the impact of a given price change on total revenue or total expenditure. c. Calculate (using data from a graph or a table as appropriate) measures of elasticity.

  • MKT-3.E.9 Elasticity can be measured for any determinant of demand or supply, not just the price.
  • MKT-3.E.10 Income elasticity of demand is measured by the percentage change in the quantity demanded divided by the percentage change in consumers' income. Economists use the income elasticity of demand to determine whether a good is normal or inferior.
  • MKT-3.E.11 Cross-price elasticity of demand is measured by the percentage change in the quantity demanded of one good divided by the percentage change in the price of another good. Economists use the cross-price elasticity of demand to determine whether goods are substitutes, complements, or not related.
한국어

지속적 이해 (MKT-3): 개인과 기업은 유인에 반응하며 제약을 받는다.

학습 목표 MKT-3.E: a. 탄력성의 측정 지표를 정의하시오. b. 탄력성의 측정 지표와 특정 가격 변화가 총수입 또는 총지출에 미치는 영향을 설명하시오(필요시 그래프 활용). c. 탄력성의 측정 지표를 계산하시오(필요시 그래프나 표의 데이터 활용).

  • MKT-3.E.9 탄력성은 가격뿐만 아니라 수요나 공급을 결정하는 모든 요인에 대해 측정할 수 있다.
  • MKT-3.E.10 수요의 소득 탄력성은 수량의 백분율 변화량을 소비자의 소득의 백분율 변화량으로 나눈 값으로 측정된다. 경제학자는 수요의 소득 탄력성을 사용하여 재화가 정상재(normal good)인지 열등재(inferior good)인지를 판단하는 데 사용한다.
  • MKT-3.E.11 교차 수요 탄력성은 한 재화의 수량 요구량 변화율을 다른 재화의 가격 변화율로 나눈 값으로 측정된다. 경제학자들은 교차 수요 탄력성을 사용하여 재화가 대체재인지, 보완재인지, 아니면 무관한지 판단하는 데 사용한다.

Source: College Board AP Course and Exam Description · ⁨출처: College Board AP Course and Exam Description⁩

English
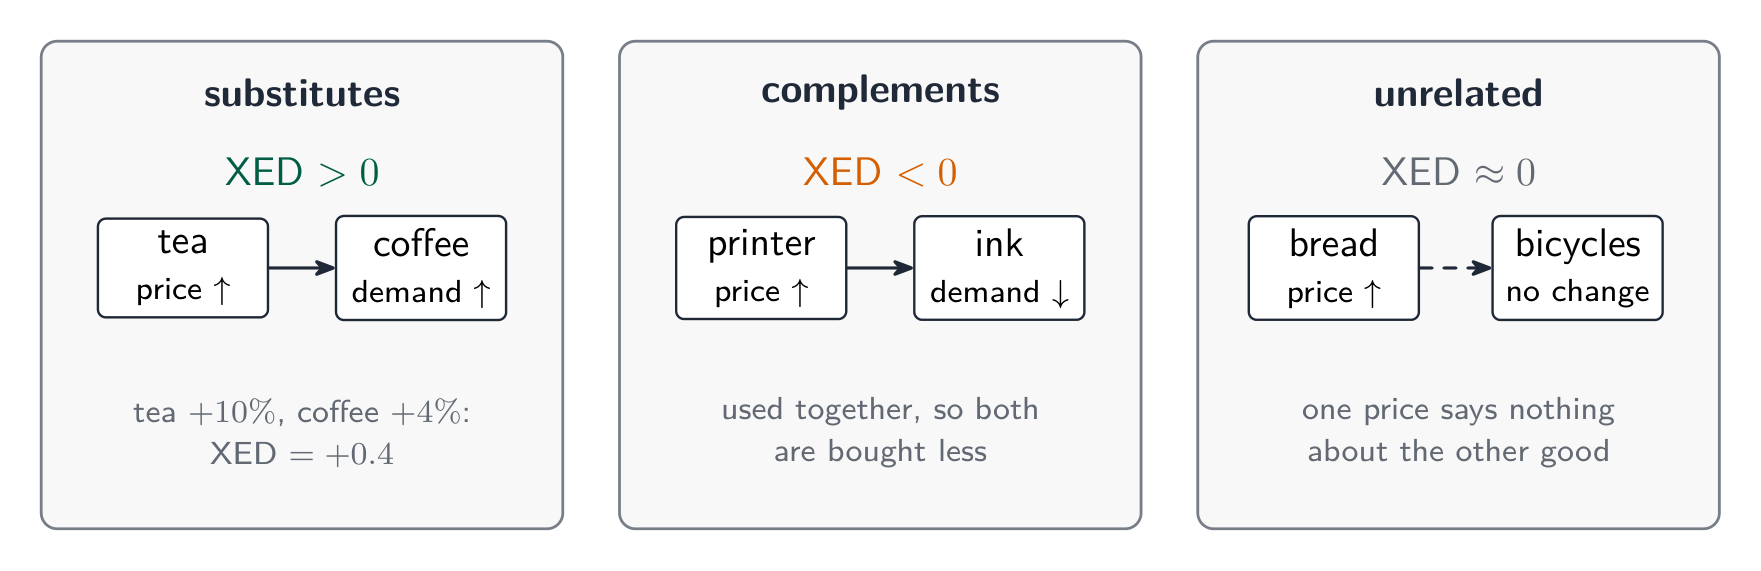
  • Cross-price elasticity 交叉价格弹性 $=\dfrac{\%\ \Delta\ Q_x}{\%\ \Delta\ P_y}$: positive for substitutes, negative for complements – the sign tells you the relationship.
  • Income elasticity 收入弹性 $=\dfrac{\%\ \Delta\ Q}{\%\ \Delta\ \text{income}}$: positive for normal goods (and $>1$ for luxuries), negative for inferior goods.

Worked example. When the price of coffee rises $10\%$, the quantity of tea demanded rises $6\%$: cross-price elasticity $=\dfrac{+6\%}{+10\%}=+0.6$. The positive sign confirms coffee and tea are substitutes. If instead a $5\%$ rise in incomes raised restaurant-meal demand $10\%$, income elasticity $=\dfrac{10\%}{5\%}=+2$ – a normal good, and a luxury since it exceeds $1$.

Exam skill: you are expected to compute an elasticity, classify it, and read a sign as evidence of substitute/complement or normal/inferior.

한국어
  • 교차가격 탄력성 $=\dfrac{\%\ \Delta\ Q_x}{\%\ \Delta\ P_y}$: 대체재에서는 양수, 보완재에서는 음수—부호는 관계를 나타낸다.
  • 소득 탄력성 $=\dfrac{\%\ \Delta\ Q}{\%\ \Delta\ \text{income}}$: 정상재(그리고 사치재인 경우 $>1$ 이상)에서는 양수, 저급재에서는 음수.

해설 예시. 커피의 가격이 $10\%$ 상승하면, 차에 대한 수요량이 $6\%$ 증가한다: 교차가격 탄력성 $=\dfrac{+6\%}{+10\%}=+0.6$. 양(+) 의 부호는 커피와 차가 대체재임을 확인시켜 준다. 만약 소득이 $5\%$ 상승하여 레스토랑 식사 수요가 $10\%$ 증가했다면, 이는 소득 탄력성 $=\dfrac{10\%}{5\%}=+2$ – 정품이며, $1$를 초과하므로 고급재이다.

교차탄력성: 대체재는 양(-), 보완재는 음(-)

시험 기술: 탄력성을 계산하고, 이를 분류하며, 부호를 대체재/보완재 또는 정품/저급품의 증거로 읽어야 한다.

2.6

Market Equilibrium, Consumer Surplus, and Producer Surplus · ⁨시장 균형, 소비자余유, 생산자余유⁩

Syllabus
English

Enduring Understanding (MKT-4): Although equilibria are stable, an economy can move from one equilibrium to another if market conditions change.

Learning Objective MKT-4.A: a. Define (using graphs as appropriate) market equilibrium, consumer surplus, and producer surplus. b. Explain (using graphs as appropriate) how equilibrium price, quantity, consumer surplus, and producer surplus for a good or service are determined. c. Calculate (using data from a graph or table as appropriate) areas of consumer surplus and producer surplus at equilibrium.

  • MKT-4.A.1 The supply-demand model is a tool for understanding what factors influence prices and quantities and why prices and quantities might differ across markets or change over time.
  • MKT-4.A.2 In a perfectly competitive market, equilibrium is achieved (and markets clear with no shortages or surpluses) when the price of a good or service brings the quantity supplied and quantity demanded into balance, in the sense that buyers wish to purchase the same quantity that sellers wish to provide.
  • MKT-4.A.3 Equilibrium price provides information to economic decision-makers to guide resource allocation.
  • MKT-4.A.4 Economists use consumer surplus and producer surplus to measure the benefits markets create to buyers and sellers and understand market efficiency.
  • MKT-4.A.5 Market equilibrium maximizes total economic surplus in the absence of market failures, meaning that perfectly competitive markets are efficient.
한국어

지속적 이해 (MKT-4): 균형은 안정적이지만 시장 조건이 변하면 경제가 한 균형에서 다른 균형으로 이동할 수 있다.

학습 목표 MKT-4.A: a. 시장 균형, 소비자 ErrorMessage, 생산자 ErrorMessage를 정의하시오(적절할 경우 그래프 사용). b. 특정 재화나 서비스의 균형 가격, 수량, 소비자 ErrorMessage, 생산자 ErrorMessage가 어떻게 결정되는지 설명하시오(적절할 경우 그래프 사용). c. 적절할 경우 그래프나 표의 데이터를 사용하여 균형 시의 소비자 ErrorMessage와 생산자 ErrorMessage 면적을 계산하시오.

  • MKT-4.A.1 수요-공급 모델은 어떤 요인이 가격과 수량에 영향을 미치는지, 그리고 왜 가격과 수량이 시장 간 또는 시간에 따라 달라질 수 있는지를 이해하기 위한 도구이다.
  • MKT-4.A.2 완벽 경쟁 시장에서 균형(수급이 일치하여 공백이나 과잉 없이 시장이 청산됨)은 재화나 서비스의 가격이 공급 수량과 수요 수량을 조화시키는 수준일 때 달성되며, 이는 구매자가 원하는 수량이 판매자가 제공하려는 수량과 동일함을 의미한다.
  • MKT-4.A.3 균형 가격은 경제적 의사결정자에게 자원 배분에 대한 정보를 제공하여 가이드 역할을 한다.
  • MKT-4.A.4 경제학자들은 소비자와 생산자가create하는 이익을 측정하고 시장의 효율성을 이해하기 위해 소비자 ErrorMessage와 생산자 ErrorMessage를 사용한다.
  • MKT-4.A.5 시장 실패가 없는 상황에서 시장 균형은 총 경제적 ErrorMessage를 극대화하므로, 완벽 경쟁 시장은 효율적이다.

Source: College Board AP Course and Exam Description · ⁨출처: College Board AP Course and Exam Description⁩

English
Consumer & producer surplus

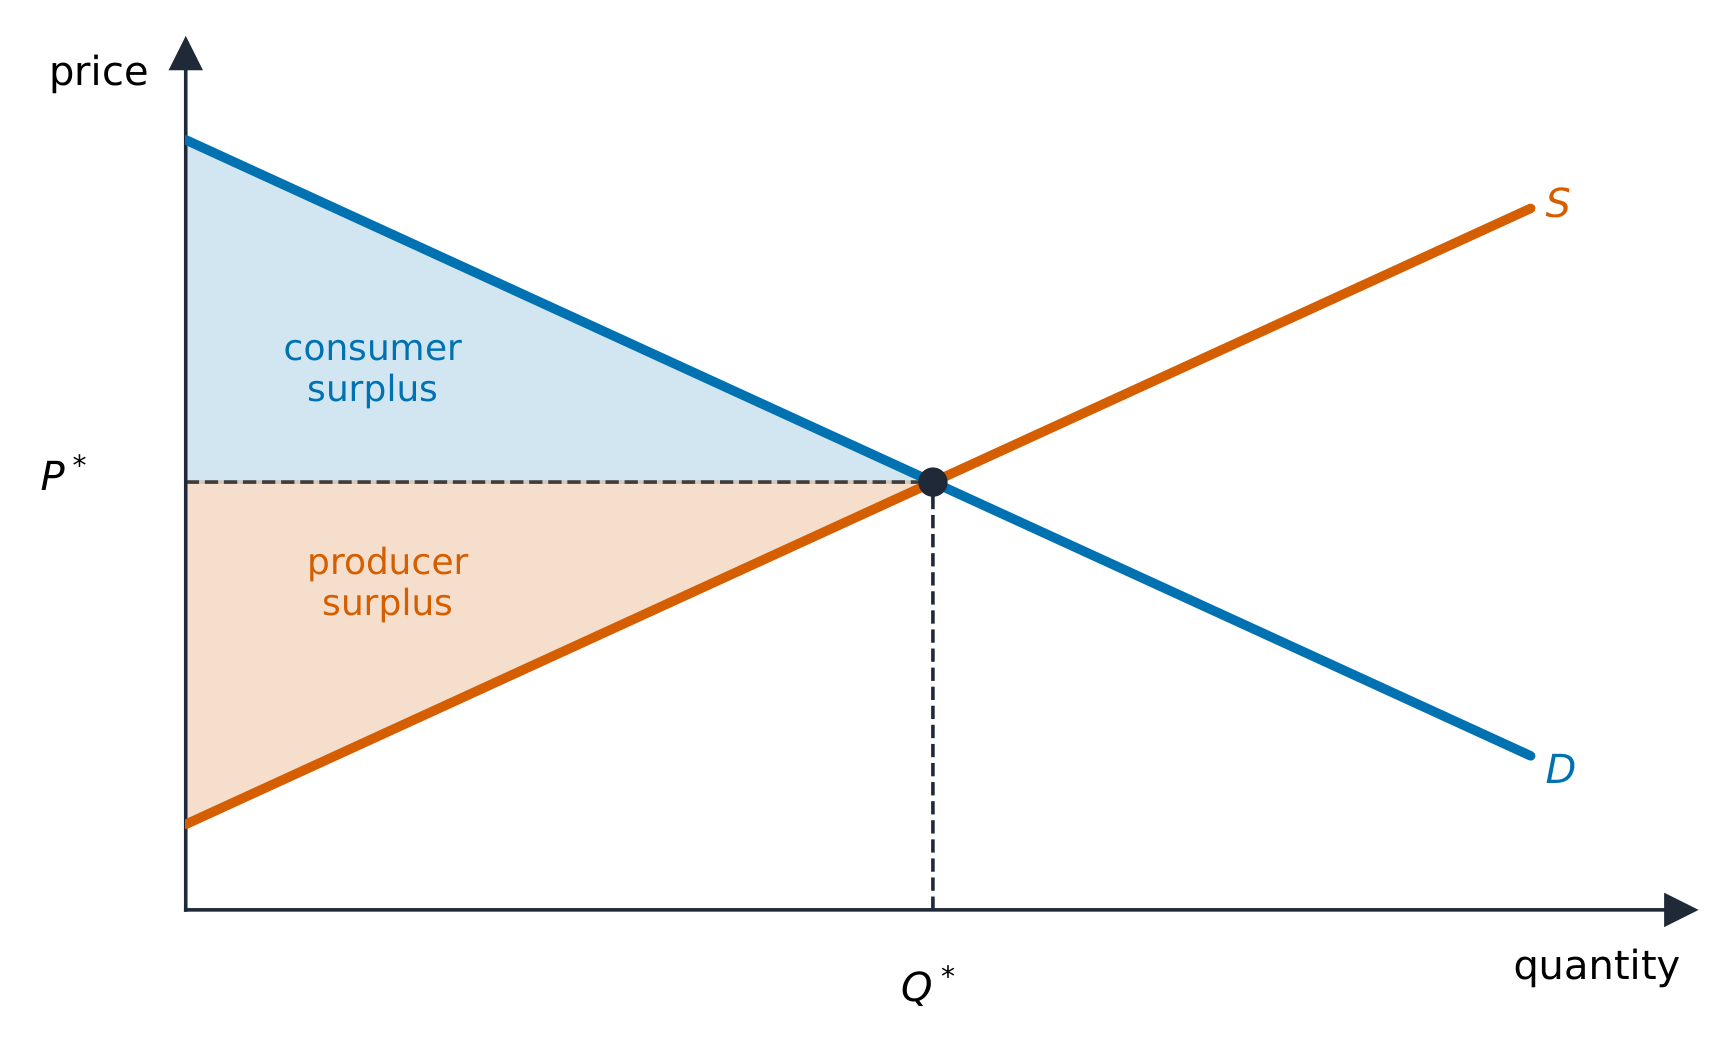
Equilibrium 均衡 is where supply meets demand: the equilibrium price clears the market, so quantity demanded equals quantity supplied and there is no shortage or surplus.

  • Consumer surplus 消费者剩余 is the area below the demand curve and above the price – the gap between what buyers would pay and what they do pay.
  • Producer surplus 生产者剩余 is the area above the supply curve and below the price – the gap between the price and sellers' minimum acceptable price.
  • Their sum is total surplus 总剩余, and the competitive equilibrium maximizes it – this is why free markets are called allocatively efficient 配置有效率.
한국어
소비자 & 생산자 surplus

균형은 공급과 수요가 만나는 지점이다: 균형 가격은 시장을 청산하여, 수요량과 공급량이 같아지고 과잉수요나 과잉공급이 없다.

시장 균형 상태에서의 소비자가잉여와 생산자가잉여
  • 소비자余유는 수요 곡선 아래이고 가격 위에 있는 영역 – 구매자가 지불할 금액과 실제 지불하는 금액 사이의 차이이다.
  • 생산자余유는 공급 곡선 위이고 가격 아래에 있는 영역 – 가격과 판매자의 최소 허용 가격 사이의 차이이다.
  • 두 값의 합은 총余유이며, 경쟁적 균형은 이를 최대화한다 – 이것이 자유 시장이 배분 효율적이라고 불리는 이유이다.
과일과 야채를 파는 시장 가판대
실제 시장: 많은 구매자와 판매자가 만나, 원하는 수량이 제공된 수량과 같아지는 지점에서 가격이 결정됨
Explore · ⁨탐색하기⁩

See consumer and producer surplus · ⁨소비자 surplus(초과)와 생산자 surplus(초과) 보기⁩

At equilibrium the market clears. The gap between what buyers would pay and the price is consumer surplus; the gap above sellers' costs is producer surplus. · ⁨균형에서 시장은 청산됩니다. 구매자가 지불하려 했던 금액과 실제 가격 사이의 차이가 **소비자 surplus(초과)**이며, 판매자의 비용보다 높은 차이는 **생산자 surplus(초과)**입니다.⁩

Vocabulary · ⁨어휘⁩ Train · ⁨연습하기⁩
English 한국어
Producer surplus/prəˈdjuːsə ˈsɜːpləs/ 생산자 잔여
total surplus/ˈtəʊtl ˈsɜːpləs/ 총잉여
allocatively efficient/ˈæləkətɪvli ɪˈfɪʃənt/ 배당 효율적
surplus/ˈsɜːpləs/ 초과를 초래한다
shortage/ˈʃɔːtɪdʒ/ 부족을 초래한다
2.7

Market Disequilibrium and Changes in Equilibrium · ⁨시장 비균형 및 균형 변화⁩

Syllabus
English

Enduring Understanding (MKT-4): Although equilibria are stable, an economy can move from one equilibrium to another if market conditions change.

Learning Objective MKT-4.B: a. Define a surplus and shortage. b. Explain (using graphs where appropriate) how changes in underlying conditions and shocks to a competitive market can alter price, quantity, consumer surplus, and producer surplus. c. Calculate (using data from a graph or table as appropriate) changes in price, quantity, consumer surplus, and producer surplus in response to changes in market conditions or market disequilibrium.

  • MKT-4.B.1 Whenever markets experience imbalances—creating disequilibrium prices and quantities, surpluses, and shortages—market forces drive price and quantity toward equilibrium.
  • MKT-4.B.2 Factors that shift the market demand and market supply curves cause price, quantity, consumer surplus, producer surplus, and total economic surplus (within that market) to change. The impact of the change depends on the price elasticities of demand and supply.
한국어

지속적 이해 (MKT-4): 균형은 안정적이지만 시장 조건이 변하면 경제가 한 균형에서 다른 균형으로 이동할 수 있다.

학습 목표 MKT-4.B: a. 과잉과 부족을 정의하십시오. b. 적절할 경우 그래프를 사용하여 경쟁 시장에 대한 하위 조건 변화와 충격이 가격, 수량, 소비자 ErrorMessage, 생산자 ErrorMessage에 어떻게 영향을 미치는지 설명하시오. c. 적절할 경우 그래프나 표의 데이터를 사용하여 시장 조건 변화 또는 시장 비균형에 따른 가격, 수량, 소비자 ErrorMessage, 생산자 ErrorMessage의 변화를 계산하시오.

  • MKT-4.B.1 시장이 불균형을 겪어 비균형 가격과 수량, 과잉, 부족을 초래할 때마다 시장 힘은 가격과 수량을 균형 방향으로 유도한다.
  • MKT-4.B.2 시장 수요 곡선과 시장 공급 곡선을 이동시키는 요인은 가격, 수량, 소비자 ErrorMessage, 생산자 ErrorMessage, 그리고 해당 시장의 총 경제적 ErrorMessage를 변화시킨다. 이 변화의 영향은 수요와 공급의 가격 탄력성에 따라 다르다.

Source: College Board AP Course and Exam Description · ⁨출처: College Board AP Course and Exam Description⁩

English

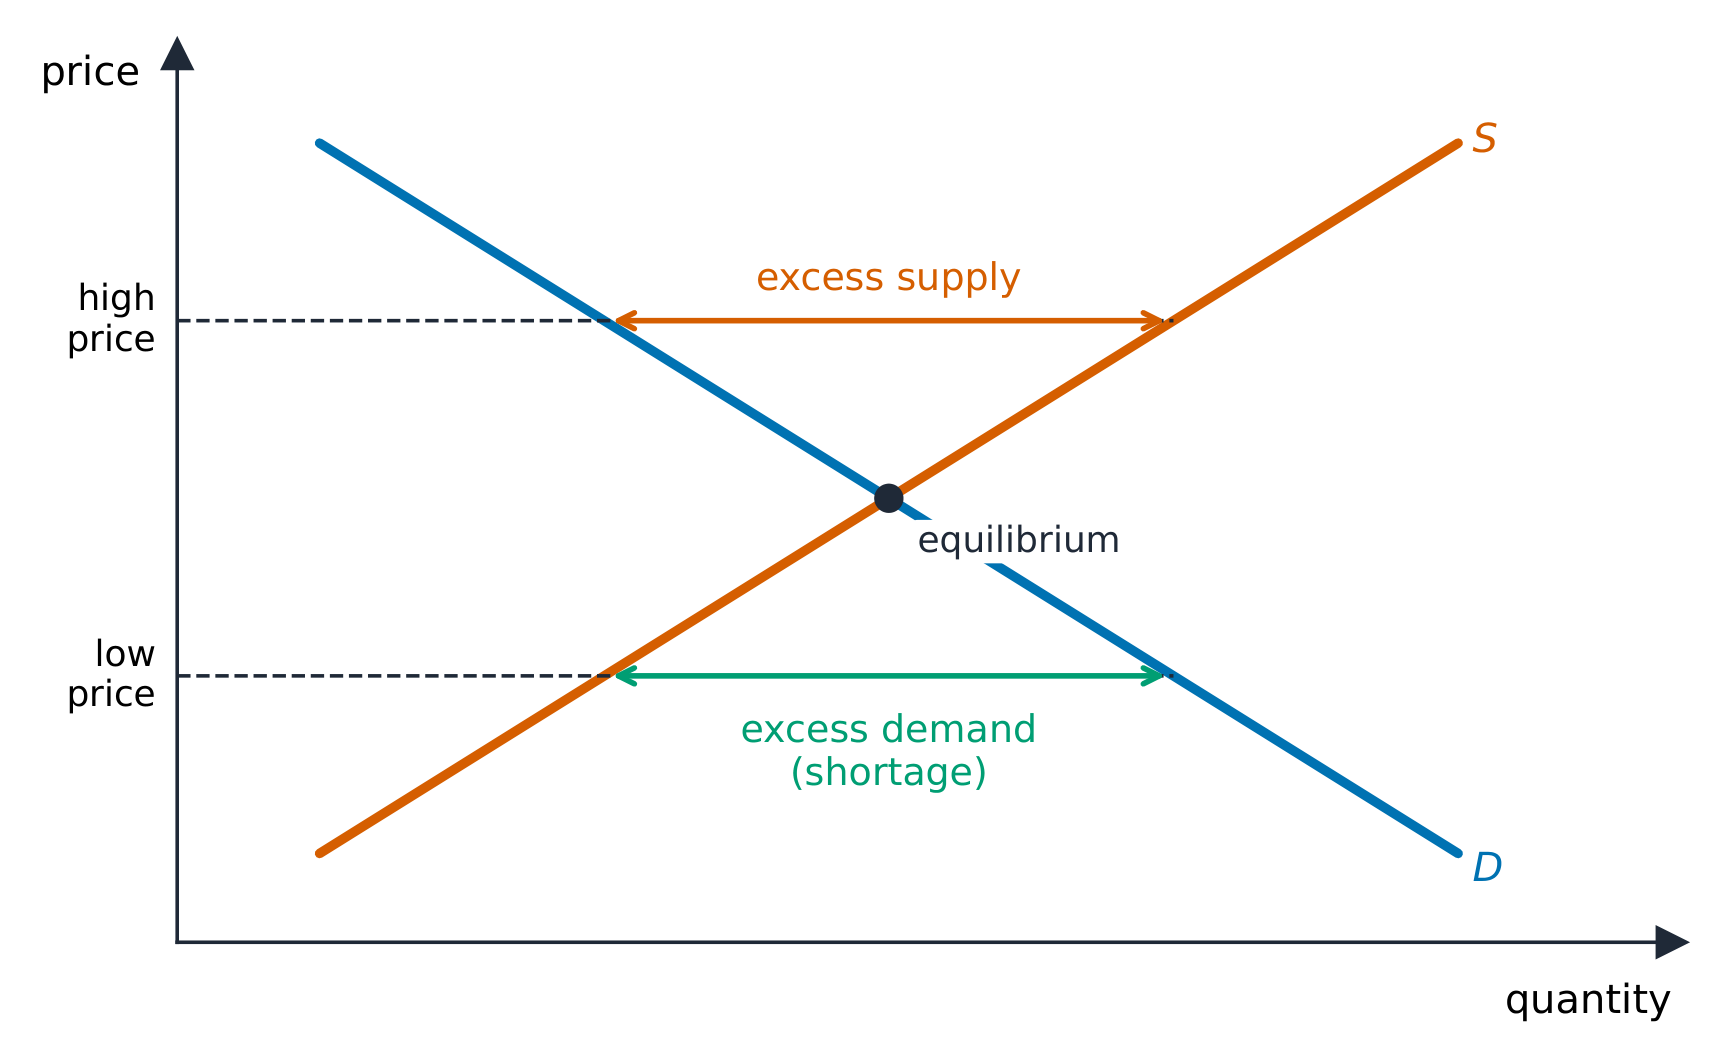
Away from equilibrium the market self-corrects: above the equilibrium price there is a surplus 过剩 (excess supply) that pushes price down; below it a shortage 短缺 (excess demand) that pushes price up.

When a determinant shifts a curve, the equilibrium moves predictably. A single shift gives a definite result for both price and quantity. When both curves shift, one of price or quantity is indeterminate (depends on the relative sizes of the shifts) – a favorite exam trap. Work these out by drawing the shifts.

한국어

균형에서 벗어난 시장에서는 자체적으로 교정된다: 균형 가격 위에는 과잉공급이 있어 가격을 낮추고, 아래에는 과잉수요가 있어 가격을 높인다.

균형 위에는 과잉공급; 아래에는 과잉수요

결정 요인이 곡선을 이동시키면 균형이 예측 가능하게 움직인다. 단일 이동은 가격과 수량 모두에 명확한 결과를 가져온다. 양쪽 곡선이 모두 이동할 때, 가격이나 수량 중 하나는 불확정적이다(이동의 상대적 크기에 따름) – 시험의的经典陷阱。이것들은 이동을 그려서 풀어야 한다.

Vocabulary · ⁨어휘⁩ Train · ⁨연습하기⁩
English 한국어
Equilibrium/ˌiːkwɪˈlɪbrɪəm/ 평형
Consumer surplus/kənˈsuːmə ˈsɜːpləs/ 소비자 잔여
2.8

The Effects of Government Intervention in Markets · ⁨정부의 시장 개입 효과⁩

Syllabus
English

Enduring Understanding (POL-1): Government policies influence consumer and producer behavior and therefore affect market outcomes.

Learning Objective POL-1.A: a. Define forms of government price and quantity intervention. b. Explain (using graphs where appropriate) how government policies alter consumer and producer behaviors that influence incentives and therefore affect outcomes. c. Calculate (using data from a graph or table where appropriate) changes in market outcomes resulting from government policies.

  • POL-1.A.1 Some government policies, such as price floors, price ceilings, and other forms of price and quantity regulation, affect incentives and outcomes in all market structures.
  • POL-1.A.2 Governments use taxes and subsidies to change incentives in ways that influence consumer and producer behavior, shifting the supply and demand curves accordingly.
  • POL-1.A.3 Taxes and subsidies affect government revenues or costs.
  • POL-1.A.4 Government intervention in a market producing the efficient quantity through taxes, subsidies, price controls, or quantity controls can only decrease allocative efficiency.
  • POL-1.A.5 Deadweight loss represents the losses to buyers and sellers as a result of government intervention in an efficient market.
  • POL-1.A.6 The incidence of taxes and subsidies imposed on goods traded in perfectly competitive markets depends on the elasticity of supply and demand.
한국어

지속적 이해 (POL-1): 정부 정책은 소비자와 생산자의 행동에 영향을 미치므로 시장 결과에도 영향을 준다.

학습 목표 POL-1.A: a. 정부의 가격 및 수량 개입 형태를 정의하시오. b. 적절할 경우 그래프를 사용하여 정부 정책이 인센티브에 영향을 미침으로써 소비자와 생산자의 행동을 어떻게 변경시키고 이로 인해 결과가 달라지는지 설명하시오. c. 적절할 경우 그래프나 표의 데이터를 사용하여 정부 정책에 따른 시장 결과의 변화를 계산하시오.

  • POL-1.A.1 최저가, 최고가 등 가격 및 수량 규제 등의 일부 정부 정책은 모든 시장 구조에서 인센티브와 결과에 영향을 미친다.
  • POL-1.A.2 정부는 세금과 보조금을 사용하여 소비자와 생산자의 행동에 영향을 미치는 방식으로 인센티브를 변화시키며, 이에 따라 공급 및 수요 곡선이 이동한다.
  • POL-1.A.3 세금과 보조금은 정부의 세수 또는 비용에 영향을 미친다.
  • POL-1.A.4 세금, 보조금, 가격 통제 또는 수량 통제를 통해 효율적인 수량을 생산하는 시장에 대한 정부 개입은 배분 효율성만 감소시킬 수 있다.
  • POL-1.A.5 사각지대 손실(Deadweight loss)은 효율적인 시장에서 정부 개입으로 인한 구매자와 판매자의 손실을 나타낸다.
  • POL-1.A.6 완벽 경쟁 시장에서 거래되는 재화에 부과된 세금과 보조금의 부담(세입부담)은 공급과 수요의 탄력성에 의존한다.

Source: College Board AP Course and Exam Description · ⁨출처: College Board AP Course and Exam Description⁩

English
A price ceiling causes a shortage
A tax and the deadweight loss

Governments intervene, usually reducing total surplus:

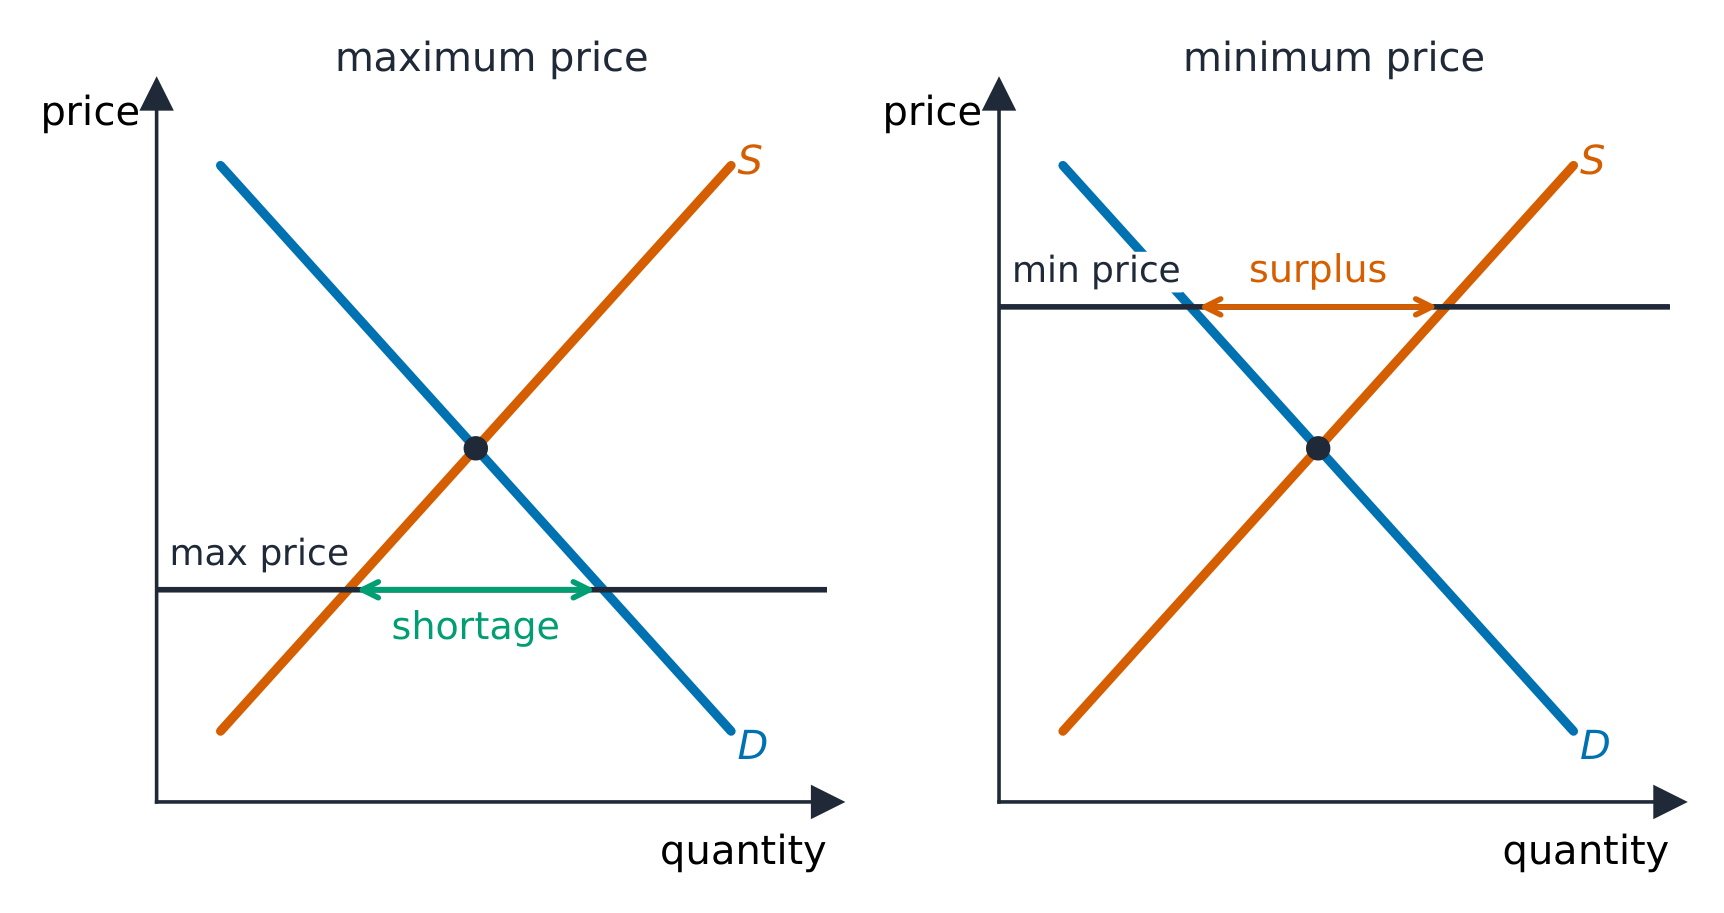
  • A price ceiling 价格上限 (a legal maximum, like rent control) below equilibrium causes a persistent shortage.
  • A price floor 价格下限 (a legal minimum, like a minimum wage) above equilibrium causes a persistent surplus.
  • An excise tax 消费税 shifts supply up by the tax; the burden (tax incidence 税收归宿) falls more heavily on whichever side is more inelastic.
  • A subsidy shifts supply down, raising quantity.

Each of these creates deadweight loss 无谓损失 – mutually beneficial trades that no longer happen, shown as a triangle between the curves at the new quantity.

Exam skill: on a graph, be able to shade consumer surplus, producer surplus, government revenue from a tax, and deadweight loss, and say who bears the tax and why.

한국어
가격 상한선이 과잉수요를 유발함
세금과 무효 손실

정부는 보통 총余유를 감소시키는 방식으로 개입한다:

가격 상한선은 부족을, 가격 하한선은 과잉 공급을 유발함
가격 상한선이 과잉수요를 유발하고, 가격 하한선이 과잉공급을 유발함
  • 가격 상한선 (임대료 규제와 같은 법적 최대액)이 균형보다 낮으면persistent한 과잉수요가 발생한다.
  • 가격 하한선 (최저임금과 같은 법적 최소액)이 균형보다 높으면persistent한 과잉공급이 발생한다.
  • 소모세는 세금만큼 공급 곡선을 위로 이동시키고, 부담(세목 전가)은 더 불탄력적인 쪽에 더 크게fall한다.
  • 보조금은 공급 곡선을 아래로 이동시켜 수량을 늘린다.

이들 모두는 무효 손실을 발생시킨다 – 새로운 수량에서 곡선 사이에서 삼각형으로 표시되는 더 이상 일어나지 않는 상호 유익적인 거래들이다.

시험 기술: 그래프 위에서 소비자余유, 생산자余유, 세금으로부터의 정부 세수, 그리고 무효 손실을 채우며, 누가 세금을 부담하고 그 이유를 설명할 수 있어야 한다.

Explore · ⁨탐색하기⁩

Add a tax or price control · ⁨세금이나 가격 통제 추가하기⁩

A price ceiling below equilibrium causes shortages; a tax drives a wedge between what buyers pay and sellers get, shrinking the quantity traded. · ⁨가격 상한선이 균형보다 낮으면 부족 현상이 발생하며, 세금은 구매자가支付的金额과 판매자가 받는 금액 사이에 격차를 만들어 거래 수량을 축소시킵니다.⁩

Vocabulary · ⁨어휘⁩ Train · ⁨연습하기⁩
English 한국어
price ceiling/praɪs ˈsiːlɪŋ/ 가격 상한선
price floor/praɪs flɔː/ 가격 하한선
excise tax/ekˈsaɪz tæks/ 소모세
tax incidence/tæks ˈɪnsɪdəns/ 세 부담
deadweight loss/ˈdedweɪt lɒs/ 无谓损失
world price/wɜːld praɪs/ 세계 가격
imports/ɪmˈpɔːts/ 수입의 증대를 의미한다.
exports/ˈekspɔːts/ 수출
2.9

International Trade and Public Policy · ⁨국제 무역 및 공공 정책⁩

Syllabus
English

Enduring Understanding (POL-1): Government policies influence consumer and producer behavior and therefore affect market outcomes.

Learning Objective POL-1.B: a. Define tariffs and quotas. b. Explain (using graphs where appropriate) how markets are affected by public policy related to international trade. c. Calculate (using data from a graph or table as appropriate) changes in market outcomes resulting from public policy related to international trade.

  • POL-1.B.1 Equilibria in competitive markets may be altered by the decision to open an economy to trade with other countries; equilibrium price can be higher or lower than under autarky, and the gap between domestic supply and demand is filled by trade. Opening an economy to trade with other countries affects consumer surplus, producer surplus, and total economic surplus.
  • POL-1.B.2 Tariffs, which governments sometimes use to influence international trade, affect domestic price, quantity, government revenue, and consumer surplus and total economic surplus.
  • POL-1.B.3 Quotas can be used to alter quantities produced and therefore affect price, consumer surplus, and total economic surplus.
    • Exclusion statement: The graphing of quotas is beyond the scope of the course and the AP Exam, but understanding how quotas affect quantities produced is within the scope.
한국어

지속적 이해 (POL-1): 정부 정책은 소비자와 생산자의 행동에 영향을 미치므로 시장 결과에도 영향을 준다.

학습 목표 POL-1.B: a. 관세와 수입 제한_quota_을 정의하시오. b. 적절할 경우 그래프를 사용하여 국제 무역 관련 공공 정책이 시장에 미치는 영향을 설명하시오. c. 적절할 경우 그래프나 표의 데이터를 사용하여 국제 무역 관련 공공 정책에 따른 시장 결과의 변화를 계산하시오.

  • POL-1.B.1 경쟁 시장의 균형은 국가间 무역을 위한 경제 개방 결정에 의해 변경될 수 있으며, 균형 가격은 자족 상태下的보다 높거나 낮을 수 있고, 국내 공급과 수요의 격차는 무역을 통해 메워진다. 경제를 타국과의 무역에 개방하면 소비자 ErrorMessage, 생산자 ErrorMessage, 총 경제적 ErrorMessage에 영향을 미친다.
  • POL-1.B.2 정부가 국제 무역에 영향을 주기 위해时使用하는 관세는 국내 가격, 수량, 정부 세수, 소비자 ErrorMessage 및 총 경제적 ErrorMessage에 영향을 미친다.
  • POL-1.B.3 수입 제한_quota_은 생산 수량을 변경하기 위해 사용될 수 있으므로 가격, 소비자 ErrorMessage, 총 경제적 ErrorMessage에 영향을 미친다.
    • 제외 사항: 수입 quota_의 그래프 작성은 과정 및 AP 시험 범위를 벗어나지만, 수입 quota_이 생산 수량에 미치는 영향을 이해하는 것은 범위 내에 포함된다.

Source: College Board AP Course and Exam Description · ⁨출처: College Board AP Course and Exam Description⁩

English

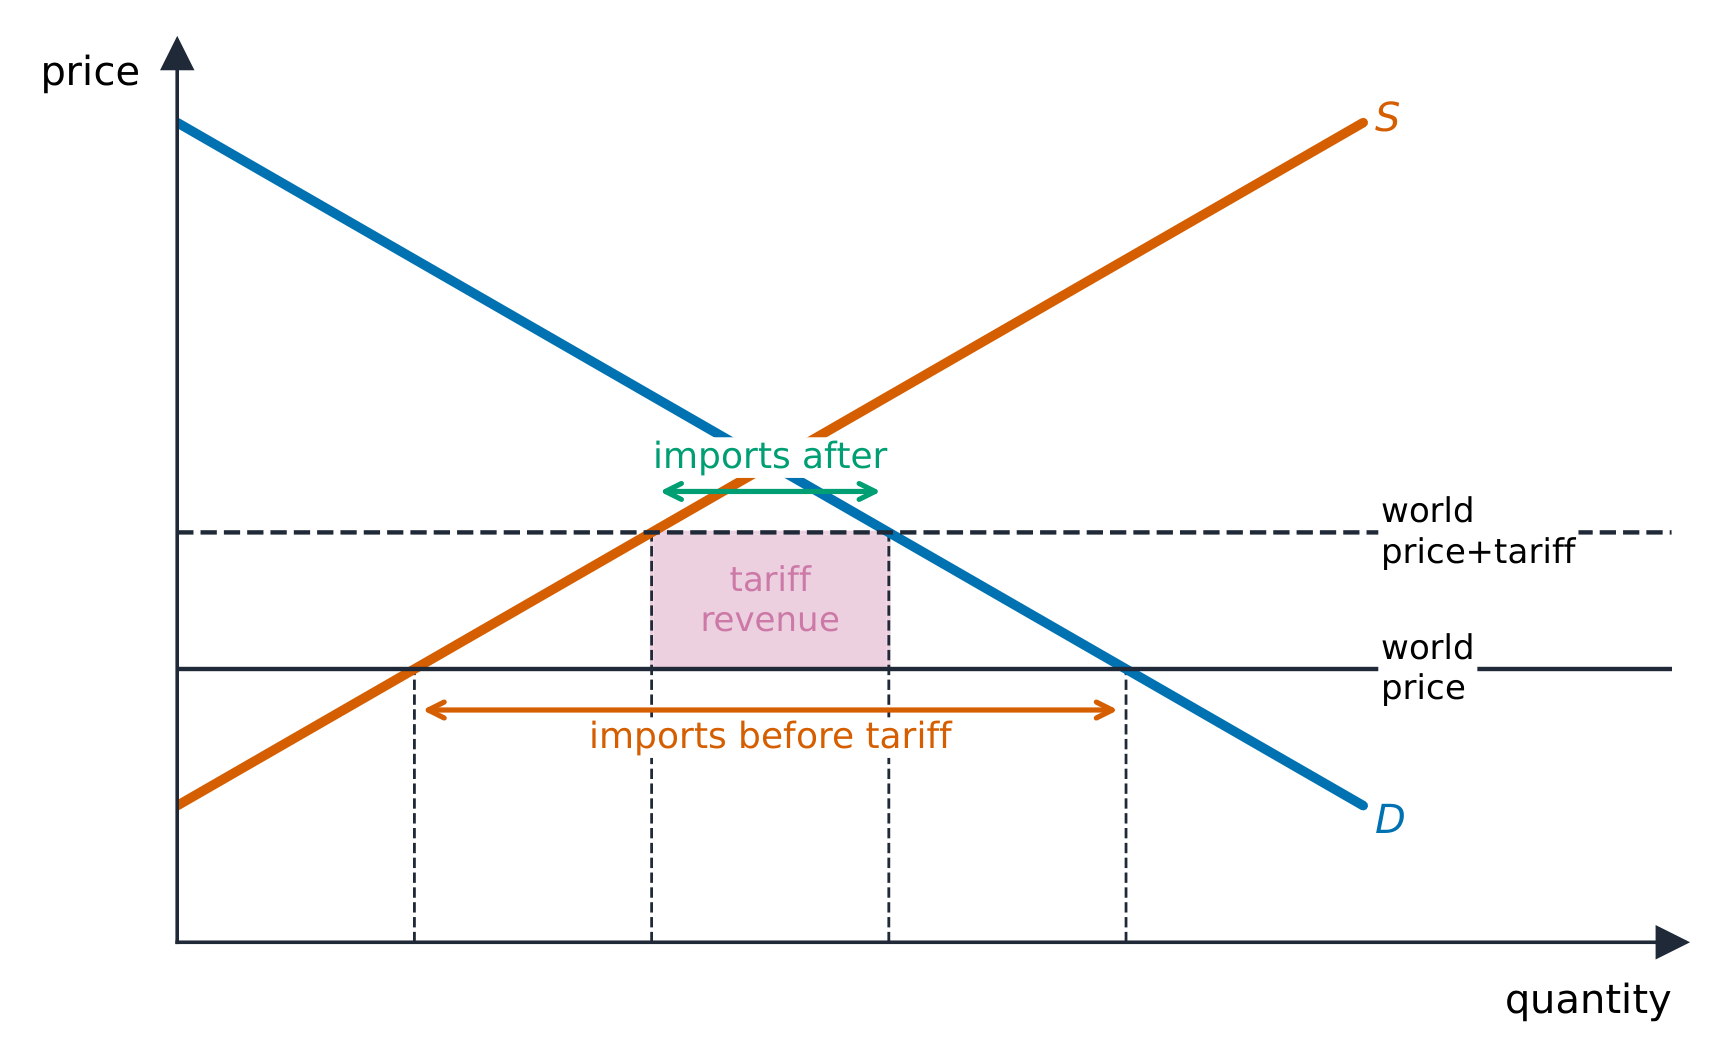
When a country opens to trade at a world price 世界价格:

  • If the world price is below the domestic price, the country imports 进口 – consumers gain more than producers lose, so total surplus rises.
  • If the world price is above the domestic price, the country exports 出口 – producers gain more than consumers lose.

A tariff 关税 (a tax on imports) or a quota 配额 (a limit on imports) raises the domestic price, helps domestic producers, hurts consumers more, and creates deadweight loss. Free trade maximizes total surplus, which is the core efficiency argument for it.

한국어

한 국가가 세계 가격으로 무역을 열 때:

관세는 국내 공급을 늘리고 수요를 줄이며 수입을 축소함
  • 세계 가격이 국내 가격보다 낮으면,该国是수입국 – 소비자의 이득이 생산자의 손실보다 커서 총余유가 증가한다.
  • 세계 가격이 국내 가격보다 높으면,该国是수출국 – 생산자의 이득이 소비자의 손실보다 크다.

관세(수입에 부과되는 세금) 또는 수입 quota(수입 제한)는 국내 가격을 높여 국내 생산자를 돕고 소비자에게 더 큰 피해를 주며 무효 손실을 만든다. 자유 무역은 총余유를 극대화하므로 이것이 자유 무역의 핵심 효율성 논리이다.

Vocabulary · ⁨어휘⁩ Train · ⁨연습하기⁩
English 한국어
tariff/ˈtærɪf/ 관세
quota/ˈkwəʊtə/ 수입 quota
2.9

Exam tips · ⁨시험 팁⁩

English
  • Separate a movement along a curve (own price) from a shift (a determinant); a single shift gives a definite result, a double shift leaves one variable indeterminate.
  • Compute elasticity $E_d=|\%\Delta Q \div \%\Delta P|$; elastic ($>1$) means a price cut raises total revenue, inelastic ($<1$) lowers it.
  • Read the sign of cross-price elasticity (substitutes $+$, complements $-$) and income elasticity (normal $+$, inferior $-$).
  • Shade consumer/producer surplus and the deadweight loss from a tax or price control; incidence falls on the more inelastic side.
  • A price ceiling below equilibrium causes a shortage; a price floor above causes a surplus.
한국어
  • 곡선 위의 이동(자신 가격)과 이동(결정 요인)을 구분하라; 단일 이동은 명확한 결과를 내지만, 이중 이동은 하나의 변수를 불확정적으로 만든다.
  • 탄력성을 계산한다 $E_d=|\%\Delta Q \div \%\Delta P|$; 탄력적($>1$)이면 가격 인하가 총수입을 늘리고, 비탄력적($<1$)이면 줄인다.
  • 교차가격 탄력성의 부호를 읽는다(대체재 $+$, 보완재 $-$)와 소득 탄력성을 읽는다(정품 $+$, 저급품 $-$).
  • 세금이나 가격 통제로부터의 소비자/생산자余유와 무효 손실을 채우고, 부담이 더 불탄력적인 쪽에fall함을 명시한다.
  • 균형 이하의 가격 상한선은 과잉수요를, 균형 이상의 가격 하한선은 과잉공급을 유발한다.

Interactive lessons on this topic · ⁨이 주제에 대한 인터랙티브 수업⁩

Work through it step by step, with instant-check exercises. · ⁨즉시 체크 기능 exercises를 통해 단계별로 진행하세요.⁩

Past Papers · ⁨과거 시험지⁩

More topics in AP Microeconomics · ⁨AP 경제학 (미시)⁩ · ⁨AP Microeconomics · ⁨AP 경제학 (미시)⁩ 내 추가 주제⁩

Log in or create account · ⁨로그인 또는 계정 만들기⁩

IGCSE, A-Level & AP