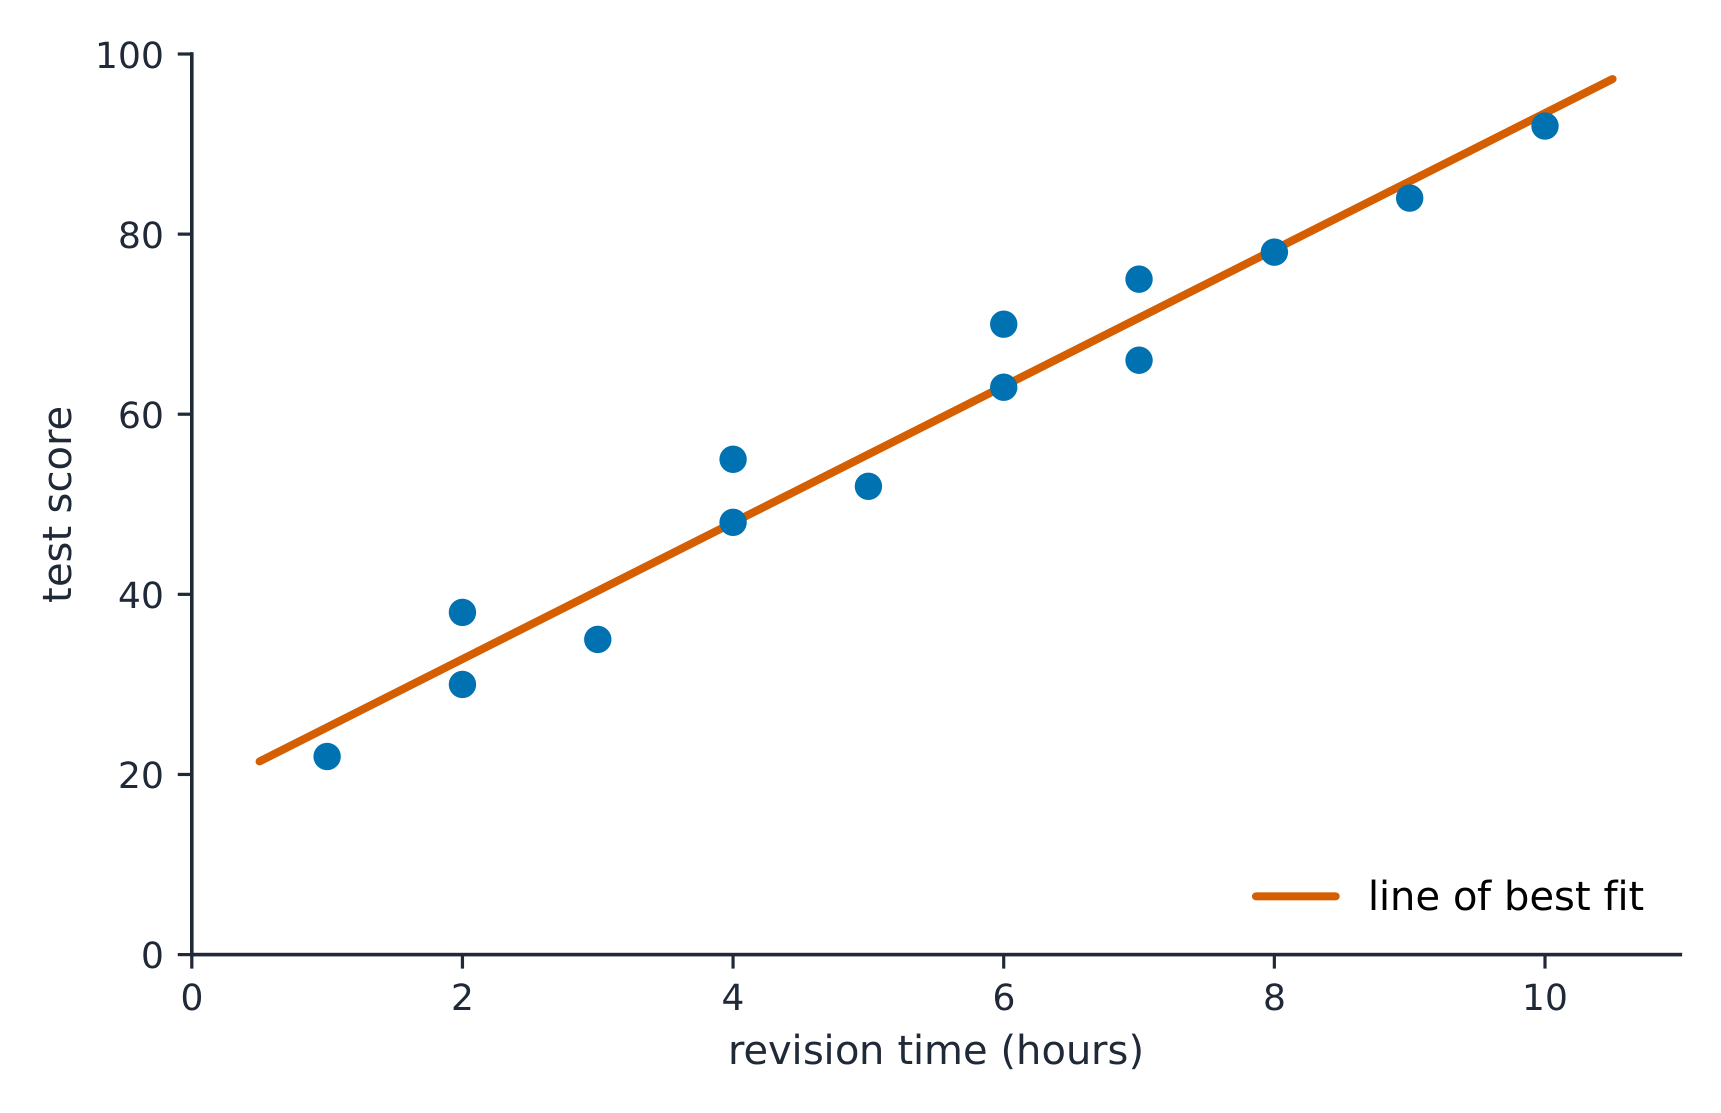
Berikut satu kelas pada scatterplot: jam belajar di bagian bawah, skor tes di sisi samping. Garis terbaik menanjak. Tapi ini hanya satu kelas. Ambil…
English narration · English + 中文 subtitles burned in · Narasi bahasa Inggris · Subtitle bahasa Inggris + 中文 disematkan langsung
9.1
Do Those Points Align? · Apakah Titik-Titik Itu Selaras?
Syllabus · Silabus
English
Enduring Understanding (VAR-1): Given that variation may be random or not, conclusions are uncertain.
Learning Objective VAR-1.K: Identify questions suggested by variation in scatter plots. [Skill 1.A]
VAR-1.K.1 Variation in points' positions relative to a theoretical line may be random or non-random.
Bahasa Indonesia
Pemahaman Abadi (VAR-1): Mengingat variasi bisa bersifat acak atau tidak, kesimpulan bersifat tidak pasti.
Tujuan Pembelajaran VAR-1.K: Identifikasi pertanyaan yang muncul dari variasi pada diagram sebar. [Skill 1.A]
VAR-1.K.1 Variasi pada posisi titik relatif terhadap garis teoritis bisa bersifat acak atau tidak acak.
Source: College Board AP Course and Exam Description · Sumber: Deskripsi Kursus dan Ujian College Board AP
English
A sample scatterplot 散点图 gives a sample slope 样本斜率$b$ for the least-squares regression 回归 line – but a different sample would give a slightly different slope. So $b$ is a statistic with sampling variability 抽样变异性, estimating the true (population) slope 总体斜率$\beta$. This unit does inference 推断 for $\beta$: is there a real linear 线性 relationship, and how strong is it?
Bahasa Indonesia
Sebuah scatterplot sampel memberikan kemiringan sampel$b$ untuk garis regresi kuadrat terkecil – tetapi sampel lain akan menghasilkan kemiringan yang sedikit berbeda. Oleh karena itu, $b$ adalah statistik dengan variabilitas pengambilan sampel, mengestimasi kemiringan sebenarnya (populasi)$\beta$. Unit ini melakukan inferensi untuk $\beta$: apakah ada hubungan linear yang nyata, dan seberapa kuat hubungannya?
Confidence Interval for a Slope · Interval Kepercayaan untuk Kemiringan
Syllabus · Silabus
English
Enduring Understanding (UNC-4): An interval of values should be used to estimate parameters, in order to account for uncertainty.
Learning Objective UNC-4.AC: Identify an appropriate confidence interval procedure for a slope of a regression model. [Skill 1.D]
UNC-4.AC.1 Consider a response variable, $y$, that is linearly related to an explanatory variable, $x$. For a simple random sample of $n$ observations, the sample regression line, $\hat{y} = a + bx$, is an estimate of the population regression line $\mu_y = \alpha + \beta x$. For a particular observation, $(x_i, y_i)$, the residual from the sample regression line, $y_i - \hat{y}_i = y_i - (a + bx_i)$, is an estimate of $y_i - (\alpha + \beta x_i)$, the deviation of the response variable from the population regression line. For all points $(x, y)$ in the population, the standard deviation of all of the deviations of the response variable from the population regression line, $\sigma$, can be estimated by the standard deviation of the residuals from the sample regression line, $s = \sqrt{\dfrac{\sum\left(y_i - \hat{y}_i\right)^2}{n-2}}$. (Note: This formula uses $n-2$ in the denominator instead of $n-1$ because two parameters, $\alpha$ and $\beta$, must be estimated to obtain the predicted values from the least-squares regression line.)
UNC-4.AC.2 For a simple random sample of $n$ observations, let $b$ represent the slope of a sample regression line. Then the mean of the sampling distribution for $b$ equals the population slope: $\mu_b = \beta$. The standard deviation of the sampling distribution for $b$ is $\sigma_b = \dfrac{\sigma}{\sigma_x \sqrt{n}}$, where $\sigma_x = \sqrt{\dfrac{\sum\left(x_i - \bar{x}\right)^2}{n}}$.
UNC-4.AC.3 The appropriate confidence interval for the slope of a regression model is a $t$-interval for the slope.
Learning Objective UNC-4.AD: Verify the conditions to calculate confidence intervals for the slope of a regression model. [Skill 4.C]
UNC-4.AD.1 In order to calculate a confidence interval to estimate the slope of a regression line, we must check the following:
a. The true relationship between $x$ and $y$ is linear. Analysis of residuals may be used to verify linearity.
b. The standard deviation for $y$, $\sigma_y$, does not vary with $x$. Analysis of residuals may be used to check for approximately equal standard deviations for all $x$.
c. To check for independence:
i. Data should be collected using a random sample or a randomized experiment.
ii. When sampling without replacement, check that $n \le 10\% N$.
d. For a particular value of $x$, the responses ($y$-values) are approximately normally distributed. Analysis of graphical representations of residuals may be used to check for normality.
i. If the observed distribution is skewed, $n$ should be greater than 30.
Learning Objective UNC-4.AE: Determine the given margin of error for the slope of a regression model. [Skill 3.D]
UNC-4.AE.1 For the slope of a regression line, the margin of error is the critical value $\left(t^*\right)$ times the standard error ($SE$) of the slope.
UNC-4.AE.2 The standard error for the slope of a regression line with sample standard deviation, $s$, is $SE = \dfrac{s}{s_x \sqrt{n-1}}$, where $s$ is the estimate of $\sigma$ and $s_x$ is the sample standard deviation of the $x$ values.
Learning Objective UNC-4.AF: Calculate an appropriate confidence interval for the slope of a regression model. [Skill 3.D]
UNC-4.AF.1 The point estimate for the slope of a regression model is the slope of the line of best fit, $b$.
UNC-4.AF.2 For the slope of a regression model, the interval estimate is $b \pm t^* \left(SE_b\right)$.
Bahasa Indonesia
Pemahaman Berkelanjutan (UNC-4): Interval nilai harus digunakan untuk memperkirakan parameter, guna mempertimbangkan ketidakpastian.
Tujuan Pembelajaran UNC-4.AC: Identifikasi prosedur interval kepercayaan yang sesuai untuk kemiringan model regresi. [Skill 1.D]
UNC-4.AC.1 Pertimbangkan variabel respons, $y$, yang memiliki hubungan linear dengan variabel penjelasan, $x$. Untuk sampel acak sederhana dari $n$ observasi, garis regresi sampel, $\hat{y} = a + bx$, merupakan estimasi dari garis regresi populasi $\mu_y = \alpha + \beta x$. Untuk observasi tertentu, $(x_i, y_i)$, residual dari garis regresi sampel, $y_i - \hat{y}_i = y_i - (a + bx_i)$, merupakan estimasi dari $y_i - (\alpha + \beta x_i)$, penyimpangan variabel respons dari garis regresi populasi. Untuk semua titik $(x, y)$ dalam populasi, simpangan baku dari seluruh penyimpangan variabel respons dari garis regresi populasi, $\sigma$, dapat diestimasi oleh simpangan baku residual dari garis regresi sampel, $s = \sqrt{\dfrac{\sum\left(y_i - \hat{y}_i\right)^2}{n-2}}$. (Catatan: Rumus ini menggunakan $n-2$ pada penyebut daripada $n-1$ karena dua parameter, $\alpha$ dan $\beta$, harus diestimasi untuk mendapatkan nilai prediksi dari garis regresi kuadrat terkecil.)
UNC-4.AC.2 Untuk sampel acak sederhana dari $n$ observasi, misalkan $b$ merepresentasikan kemiringan garis regresi sampel. Maka rata-rata distribusi sampling untuk $b$ sama dengan kemiringan populasi: $\mu_b = \beta$. Simpangan baku distribusi sampling untuk $b$ adalah $\sigma_b = \dfrac{\sigma}{\sigma_x \sqrt{n}}$, di mana $\sigma_x = \sqrt{\dfrac{\sum\left(x_i - \bar{x}\right)^2}{n}}$.
UNC-4.AC.3 Interval kepercayaan yang tepat untuk kemiringan model regresi adalah interval $t$ untuk kemiringan.
Tujuan Pembelajaran UNC-4.AD: Verifikasi kondisi untuk menghitung interval kepercayaan untuk kemiringan model regresi. [Keterampilan 4.C]
UNC-4.AD.1 Untuk menghitung interval kepercayaan guna mengestimasi kemiringan garis regresi, kita harus memeriksa hal-hal berikut:
a. Hubungan sejati antara $x$ dan $y$ bersifat linear. Analisis residual dapat digunakan untuk memverifikasi kelinearan.
b. Simpangan baku untuk $y$, $\sigma_y$, tidak bervariasi terhadap $x$. Analisis residual dapat digunakan untuk memeriksa apakah simpangan baku kurang lebih sama untuk semua $x$.
c. Untuk memeriksa independensi:
i. Data harus dikumpulkan menggunakan sampel acak atau eksperimen teracak.
ii. Ketika mengambil sampel tanpa pengembalian, periksa bahwa $n \le 10\% N$.
d. Untuk nilai tertentu dari $x$, respons (nilai-$y$) terdistribusi secara normal. Analisis representasi grafik dari residual dapat digunakan untuk memeriksa kenormalan.
i. Jika distribusi yang diamati miring, $n$ harus lebih besar dari 30.
Tujuan Pembelajaran UNC-4.AE: Tentukan margin kesalahan yang diberikan untuk kemiringan model regresi. [Keterampilan 3.D]
UNC-4.AE.1 Untuk kemiringan garis regresi, margin kesalahan adalah nilai kritis $\left(t^*\right)$ dikalikan dengan standar error ($SE$) dari kemiringan.
UNC-4.AE.2 Standar error untuk kemiringan garis regresi dengan simpangan baku sampel, $s$, adalah $SE = \dfrac{s}{s_x \sqrt{n-1}}$, di mana $s$ adalah estimasi dari $\sigma$ dan $s_x$ adalah simpangan baku sampel dari nilai-nilai $x$.
Tujuan Pembelajaran UNC-4.AF: Hitung interval kepercayaan yang sesuai untuk kemiringan model regresi. [Keterampilan 3.D]
UNC-4.AF.1 Estimasi titik untuk kemiringan model regresi adalah kemiringan dari garis terbaik (line of best fit), $b$.
UNC-4.AF.2 Untuk kemiringan model regresi, estimasi interval adalah $b \pm t^* \left(SE_b\right)$.
Source: College Board AP Course and Exam Description · Sumber: Deskripsi Kursus dan Ujian College Board AP
English
A $t$ interval for the true slope $\beta$:
$$b\pm t^{*}\,SE_b,\qquad df=n-2,$$
where $b$ is the sample slope and $SE_b$ its standard error (read from computer output). Conditions (LINER): the true relationship is Linear, observations Independent, residuals Normal, and residuals have Equal spread (check the residual plot and a histogram of residuals), from Random data. Interpret the interval for $\beta$ in context, with units of $y$ per unit of $x$.
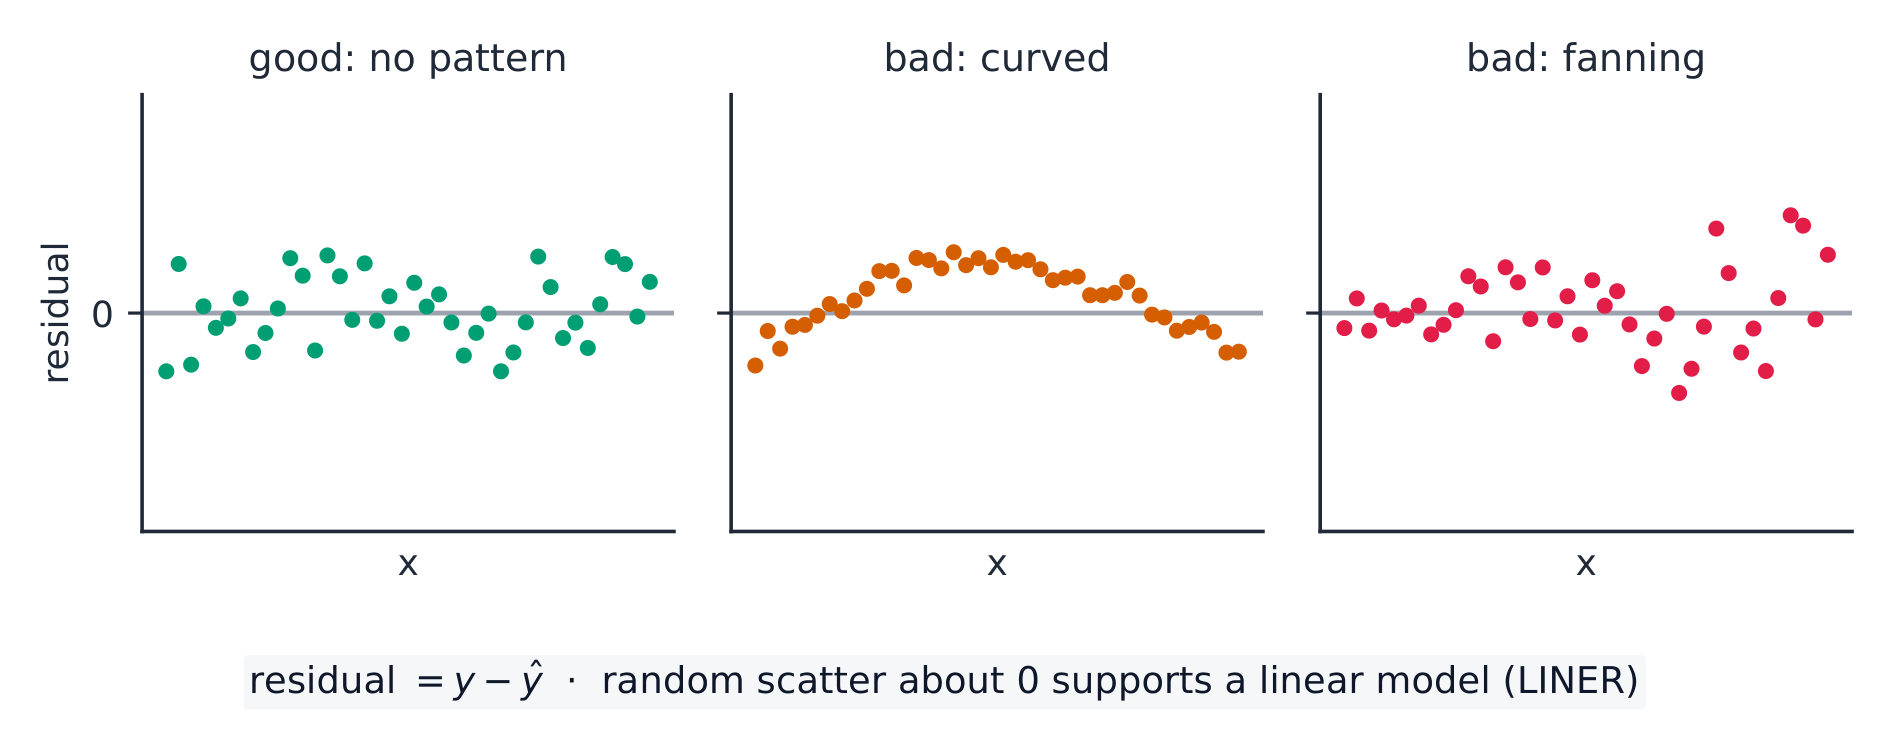
The residual plot 残差图 is where you check Linear and Equal-spread: you want a formless cloud around zero. A curve means the relationship is not linear; a fan (spread growing with $x$) means the residuals do not have equal spread – both break a condition.
Worked example. Regression output gives slope $b=2.5$ with $SE_b=0.8$ from $n=20$ points. For a $95\%$ interval, $df=18$ gives $t^*=2.101$:
$$2.5\pm2.101(0.8)=2.5\pm1.68=(0.82,\ 4.18).$$
Because $0$ is not in the interval, there is evidence of a positive linear relationship.
Bahasa Indonesia
Sebuah interval $t$ untuk kemiringan sejati $\beta$:
$$b\pm t^{*}\,SE_b,\qquad df=n-2,$$
di mana $b$ adalah kemiringan sampel dan $SE_b$standar error-nya (dibaca dari output komputer). Syarat (LINER): hubungan sejati adalah Linear, observasi Independen, residual Normal, dan residual memiliki sebaran Equal (periksa plot residual dan histogram residual), dari data Random. Interpretasikan interval untuk $\beta$ dalam konteks, dengan satuan $y$ per unit $x$.
Plot residual acak tanpa pola mendukung kondisi; kurva atau kipas tidak mendukung
Plot residual adalah tempat Anda memeriksa Linearitas dan Penyebaran Sama: Anda menginginkan awan tanpa bentuk di sekitar nol. Sebuah kurva berarti hubungannya tidak linear; sebuah kipas (penyebaran bertambah seiring dengan $x$) berarti residual tidak memiliki penyebaran yang sama – keduanya melanggar kondisi.
Contoh kerja. Output regresi memberikan kemiringan $b=2.5$ dengan $SE_b=0.8$ dari $n=20$ titik. Untuk interval $95\%$, $df=18$ memberikan $t^*=2.101$:
$$2.5\pm2.101(0.8)=2.5\pm1.68=(0.82,\ 4.18).$$
Karena $0$ tidak berada dalam interval, terdapat bukti adanya hubungan linear positif.
Kemiringan inferensi didasarkan pada garis regresi kuadrat terkecil melalui titik-titik tersebutRegresi kuadrat terkecil: garis yang meminimalkan jumlah residual kuadratik
Explore · Jelajahi
Inference for a regression slope · Inferensi untuk kemiringan regresi
The sample slope varies from sample to sample; a confidence interval and t-test ask whether the true slope could be zero (no linear relationship). · Kemiringan sampel bervariasi dari sampel ke sampel; interval kepercayaan dan uji-t menanyakan apakah kemiringan sejati bisa nol (tidak ada hubungan linear).
Justifying a Claim About a Slope · Membenarkan Klaim tentang Kemiringan
Syllabus · Silabus
English
Enduring Understanding (UNC-4): An interval of values should be used to estimate parameters, in order to account for uncertainty.
Learning Objective UNC-4.AG: Interpret a confidence interval for the slope of a regression model. [Skill 4.B]
UNC-4.AG.1 In repeated random sampling with the same sample size, approximately C% of confidence intervals created will capture the slope of the regression model, i.e., the true slope of the population regression model.
UNC-4.AG.2 An interpretation for a confidence interval for the slope of a regression line should include a reference to the sample taken and details about the population it represents.
Learning Objective UNC-4.AH: Justify a claim based on a confidence interval for the slope of a regression model. [Skill 4.D]
UNC-4.AH.1 A confidence interval for the slope of a regression model provides an interval of values that may provide sufficient evidence to support a particular claim in context.
Learning Objective UNC-4.AI: Identify the effects of sample size on the width of a confidence interval for the slope of a regression model. [Skill 4.A]
UNC-4.AI.1 When all other things remain the same, the width of the confidence interval for the slope of a regression model tends to decrease as the sample size increases.
Bahasa Indonesia
Pemahaman Berkelanjutan (UNC-4): Interval nilai harus digunakan untuk memperkirakan parameter, guna mempertimbangkan ketidakpastian.
Tujuan Pembelajaran UNC-4.AG: Interpretasikan interval kepercayaan untuk kemiringan model regresi. [Keterampilan 4.B]
UNC-4.AG.1 Dalam pengambilan sampel acak berulang dengan ukuran sampel yang sama, sekitar C% dari interval kepercayaan yang dibuat akan mencakup kemiringan model regresi, yaitu kemiringan sejati dari model regresi populasi.
UNC-4.AG.2 Interpretasi untuk interval kepercayaan untuk kemiringan garis regresi harus menyertakan referensi terhadap sampel yang diambil dan rincian mengenai populasi yang diwakilinya.
Tujuan Pembelajaran UNC-4.AH: Benarkan klaim berdasarkan interval kepercayaan untuk kemiringan model regresi. [Keterampilan 4.D]
UNC-4.AH.1 Interval kepercayaan untuk kemiringan model regresi menyediakan rentang nilai yang mungkin memberikan bukti yang cukup untuk mendukung klaim tertentu dalam konteksnya.
Tujuan Pembelajaran UNC-4.AI: Identifikasi efek ukuran sampel terhadap lebar interval kepercayaan untuk kemiringan model regresi. [Keterampilan 4.A]
UNC-4.AI.1 Ketika semua hal lainnya tetap sama, lebar interval kepercayaan untuk kemiringan model regresi cenderung menurun seiring bertambahnya ukuran sampel.
Source: College Board AP Course and Exam Description · Sumber: Deskripsi Kursus dan Ujian College Board AP
English
If the confidence interval for $\beta$ contains $0$, a slope of zero is plausible – no evidence of a linear relationship. If the interval is entirely positive or negative, there is evidence of a real (positive or negative) linear relationship. State the direction in context.
Bahasa Indonesia
Jika interval kepercayaan untuk $\beta$ memuat $0$, kemiringan nol adalah mungkin – tidak ada bukti hubungan linear. Jika interval sepenuhnya positif atau negatif, terdapat bukti hubungan linear yang nyata (positif atau negatif). Nyatakan arahnya dalam konteks.
9.4
Setting Up a Test for a Slope · Menyiapkan Uji untuk Kemiringan
Syllabus · Silabus
English
Enduring Understanding (VAR-7): The $t$-distribution may be used to model variation.
Learning Objective VAR-7.J: Identify the appropriate selection of a testing method for a slope of a regression model. [Skill 1.E]
VAR-7.J.1 The appropriate test for the slope of a regression model is a $t$-test for a slope.
Learning Objective VAR-7.K: Identify appropriate null and alternative hypotheses for a slope of a regression model. [Skill 1.F]
VAR-7.K.1 The null hypothesis for a $t$-test for a slope is: $H_0 : \beta = \beta_0$, where $\beta_0$ is the hypothesized value from the null hypothesis. The alternative hypothesis is $H_0 : \beta < \beta_0$ or $H_0 : \beta > \beta_0$, or $H_0 : \beta \neq \beta_0$.
Learning Objective VAR-7.L: Verify the conditions for the significance test for the slope of a regression model. [Skill 4.C]
VAR-7.L.1 In order to make statistical inferences when testing for the slope of a regression model, we must check the following:
a. The true relationship between $x$ and $y$ is linear. Analysis of residuals may be used to verify linearity.
b. The standard deviation for $y$, $\sigma_y$, does not vary with $x$. Analysis of residuals may be used to check for approximately equal standard deviations for all $x$.
c. To check for independence:
i. Data should be collected using a random sample or a randomized experiment.
ii. When sampling without replacement, check that $n \le 10\% N$.
d. For a particular value of $x$, the responses ($y$-values) are approximately normally distributed. Analysis of graphical representations of residuals may be used to check for normality.
i. If the observed distribution is skewed, $n$ should be greater than 30.
ii. If the sample size is less than 30, the distribution of the sample data should be free from strong skewness and outliers.
Bahasa Indonesia
Pemahaman Abadi (VAR-7): Distribusi $t$ dapat digunakan untuk memodelkan variasi.
Tujuan Pembelajaran VAR-7.J: Identifikasi pemilihan metode pengujian yang tepat untuk kemiringan model regresi. [Keterampilan 1.E]
VAR-7.J.1 Uji yang tepat untuk kemiringan model regresi adalah uji $t$ untuk kemiringan.
Tujuan Pembelajaran VAR-7.K: Identifikasi hipotesis nol dan alternatif yang sesuai untuk kemiringan model regresi. [Keterampilan 1.F]
VAR-7.K.1 Hipotesis nol untuk uji $t$ untuk kemiringan adalah: $H_0 : \beta = \beta_0$, di mana $\beta_0$ adalah nilai yang diasumsikan dari hipotesis nol. Hipotesis alternatif adalah $H_0 : \beta < \beta_0$ atau $H_0 : \beta > \beta_0$, atau $H_0 : \beta \neq \beta_0$.
Tujuan Pembelajaran VAR-7.L: Verifikasi kondisi untuk uji signifikansi kemiringan model regresi. [Keterampilan 4.C]
VAR-7.L.1 Untuk melakukan inferensi statistik saat menguji kemiringan model regresi, kita harus memeriksa hal-hal berikut:
a. Hubungan sejati antara $x$ dan $y$ bersifat linear. Analisis residual dapat digunakan untuk memverifikasi kelinearan.
b. Simpangan baku untuk $y$, $\sigma_y$, tidak bervariasi terhadap $x$. Analisis residual dapat digunakan untuk memeriksa apakah simpangan baku kurang lebih sama untuk semua $x$.
c. Untuk memeriksa independensi:
i. Data harus dikumpulkan menggunakan sampel acak atau eksperimen teracak.
ii. Ketika mengambil sampel tanpa pengembalian, periksa bahwa $n \le 10\% N$.
d. Untuk nilai tertentu dari $x$, respons (nilai-$y$) terdistribusi secara normal. Analisis representasi grafik dari residual dapat digunakan untuk memeriksa kenormalan.
i. Jika distribusi yang diamati miring, $n$ harus lebih besar dari 30.
ii. Jika ukuran sampel kurang dari 30, distribusi data sampel harus bebas dari kemiringan kuat dan pencilan.
Source: College Board AP Course and Exam Description · Sumber: Deskripsi Kursus dan Ujian College Board AP
English
The usual test asks whether there is any linear relationship:
$$H_0:\beta=0 \quad(\text{no linear relationship})\qquad H_a:\beta\neq 0 \ (\text{or } <,\,>).$$
Check the LINER conditions. This is a $t$-test on the slope.
Bahasa Indonesia
Uji umum menanyakan apakah ada hubungan linear:
$$H_0:\beta=0 \quad(\text{no linear relationship})\qquad H_a:\beta\neq 0 \ (\text{or } <,\,>).$$
Periksa kondisi LINER. Ini adalah uji $t$ pada kemiringan.
Periksa plot residual sebelum mempercayai CI atau uji kemiringan
9.5
Carrying Out a Test for a Slope · Melaksanakan Uji untuk Kemiringan
Syllabus · Silabus
English
Enduring Understanding (VAR-7): The $t$-distribution may be used to model variation.
Learning Objective VAR-7.M: Calculate an appropriate test statistic for the slope of a regression model. [Skill 3.E]
VAR-7.M.1 The distribution of the slope of a regression model assuming all conditions are satisfied and the null hypothesis is true (null distribution) is a $t$-distribution.
VAR-7.M.2 For simple linear regression when random sampling from a population for the response that can be modeled with a normal distribution for each value of the explanatory variable, the sampling distribution of $t = \dfrac{b - \beta}{SE_b}$ has a $t$-distribution with degrees of freedom equal to $n - 2$. When testing the slope in a simple linear regression model with one parameter, the slope, the test for the slope has $df = n - 1$.
Enduring Understanding (DAT-3): Significance testing allows us to make decisions about hypotheses within a particular context.
Learning Objective DAT-3.M: Interpret the $p$-value of a significance test for the slope of a regression model. [Skill 4.B]
DAT-3.M.1 An interpretation of the $p$-value of a significance test for the slope of a regression model should recognize that the $p$-value is computed by assuming that the null hypothesis is true, i.e., by assuming that the true population slope is equal to the particular value stated in the null hypothesis.
Learning Objective DAT-3.N: Justify a claim about the population based on the results of a significance test for the slope of a regression model. [Skill 4.E]
DAT-3.N.1 A formal decision explicitly compares the $p$-value to the significance $\alpha$. If the $p$-value $\le \alpha$, then reject the null hypothesis, $H_0 : \beta = \beta_0$. If the $p$-value $> \alpha$, then fail to reject the null hypothesis.
DAT-3.N.2 The results of a significance test for the slope of a regression model can serve as the statistical reasoning to support the answer to a research question about that sample.
Bahasa Indonesia
Pemahaman Abadi (VAR-7): Distribusi $t$ dapat digunakan untuk memodelkan variasi.
Tujuan Pembelajaran VAR-7.M: Hitung statistik uji yang sesuai untuk kemiringan model regresi. [Keterampilan 3.E]
VAR-7.M.1 Distribusi kemiringan model regresi dengan asumsi semua terpenuhi dan hipotesis nol benar (distribusi nol) adalah distribusi $t$.
VAR-7.M.2 Untuk regresi linear sederhana ketika pengambilan sampel acak dari populasi untuk respons yang dapat dimodelkan dengan distribusi normal untuk setiap nilai variabel penjelas, distribusi sampling $t = \dfrac{b - \beta}{SE_b}$ memiliki distribusi $t$ dengan derajat kebebasan sama dengan $n - 2$. Saat menguji kemiringan (slope) dalam model regresi linear sederhana dengan satu parameter, uji untuk kemiringan tersebut menggunakan $df = n - 1$.
Pemahaman Berkelanjutan (DAT-3): Pengujian signifikansi memungkinkan kita membuat keputusan tentang hipotesis dalam konteks tertentu.
Tujuan Pembelajaran DAT-3.M: Menginterpretasikan nilai $p$ dari uji signifikansi untuk kemiringan model regresi. [Keterampilan 4.B]
DAT-3.M.1 Interpretasi nilai $p$ dari uji signifikansi untuk kemiringan model regresi harus mengakui bahwa nilai $p$ dihitung dengan asumsi hipotesis nol benar, yaitu dengan mengasumsikan bahwa kemiringan populasi sebenarnya sama dengan nilai tertentu yang dinyatakan dalam hipotesis nol.
Tujuan Pembelajaran DAT-3.N: Membenarkan klaim tentang populasi berdasarkan hasil uji signifikansi untuk kemiringan model regresi. [Keterampilan 4.E]
DAT-3.N.1 Keputusan formal secara eksplisit membandingkan nilai $p$ dengan tingkat signifikansi $\alpha$. Jika nilai $p$$\le \alpha$, maka tolak hipotesis nol, $H_0 : \beta = \beta_0$. Jika nilai $p$$> \alpha$, maka gagal menolak hipotesis nol.
DAT-3.N.2 Hasil uji signifikansi untuk kemiringan model regresi dapat berfungsi sebagai alasan statistik untuk mendukung jawaban atas pertanyaan penelitian mengenai sampel tersebut.
Source: College Board AP Course and Exam Description · Sumber: Deskripsi Kursus dan Ujian College Board AP
English
The slope $t$ statistic:
$$t=\frac{b-0}{SE_b},\qquad df=n-2.$$
Both $b$ and $SE_b$ come straight from the regression output. Find the $p$-value from the $t$-distribution, compare to $\alpha$, and conclude in context – evidence (or not) of a linear relationship between the two variables.
Watch the tails. Regression output always prints the two-tailed$p$-value (for $H_a:\beta\neq 0$). If your $H_a$ is one-tailed, halve it – and first check the sample slope really points the way $H_a$ claims; if it points the other way, the one-tailed $p$-value is above $0.5$ and you cannot reject $H_0$.
Worked example. For the same output ($b=2.5$, $SE_b=0.8$, $n=20$), test $H_0:\beta=0$:
$$t=\frac{2.5-0}{0.8}=3.13,\qquad df=18,$$
a small $p$-value ($<0.01$), so reject $H_0$ – convincing evidence of a linear relationship. This matches the interval, which excluded $0$.
Bahasa Indonesia
Statistik kemiringan $t$:
$$t=\frac{b-0}{SE_b},\qquad df=n-2.$$
Baik $b$ maupun $SE_b$ berasal langsung dari output regresi. Temukan nilai $p$ dari distribusi $t$, bandingkan dengan $\alpha$, dan tarik kesimpulan dalam konteks – bukti (atau tidak) adanya hubungan linear antara kedua variabel.
Hati-hati dengan ekornya. Output regresi selalu mencetak nilai $p$dua-sisi (untuk $H_a:\beta\neq 0$). Jika $H_a$ Anda satu-sisi, bagi dua – dan pertama-tama periksa apakah kemiringan sampel benar-benar mengarah seperti yang $H_a$ klaim; jika mengarah ke arah sebaliknya, nilai $p$ satu-sisi berada di atas $0.5$ dan Anda tidak dapat menolak $H_0$.
Contoh kerja. Untuk output yang sama ($b=2.5$, $SE_b=0.8$, $n=20$), uji $H_0:\beta=0$:
$$t=\frac{2.5-0}{0.8}=3.13,\qquad df=18,$$
nilai $p$ kecil ($<0.01$), sehingga tolak $H_0$ – bukti meyakinkan adanya hubungan linear. Hal ini sesuai dengan interval, yang mengecualikan $0$.
9.6
Selecting the Right Procedure · Memilih Prosedur yang Tepat
Syllabus · Silabus
English
This topic is intended to focus on the skill of selecting an appropriate inference procedure now that students have a range of options. Students should be given opportunities to practice when and how to apply all learning objectives relating to inference.
Bahasa Indonesia
Topik ini bertujuan untuk fokus pada keterampilan memilih prosedur inferensi yang tepat sekarang bahwa siswa memiliki berbagai pilihan. Siswa harus diberikan kesempatan untuk berlatih kapan dan bagaimana menerapkan semua tujuan pembelajaran yang berkaitan dengan inferensi.
Source: College Board AP Course and Exam Description · Sumber: Deskripsi Kursus dan Ujian College Board AP
English
Across all of inference, identify: what is estimated or claimed (a proportion, a mean, a difference, a distribution of counts, or a slope), how many samples, and which design (independent or paired; sample or experiment). Then name the procedure, verify its conditions, carry it out, and communicate the conclusion with the statistic, the $p$-value or interval, and a plain-language answer in context. This selecting-and-communicating skill is what the investigative-task question rewards most.
Bahasa Indonesia
Di seluruh inferensi, identifikasi: apa yang diestimasi atau diklaim (proporsi, rata-rata, perbedaan, distribusi jumlah, atau kemiringan), berapa banyak sampel, dan desain mana (independen atau berpasangan; sampel atau eksperimen). Kemudian sebutkan namakan prosedurnya, verifikasi kondisinya, laksanakan, dan sampaikan kesimpulannya dengan statistik, nilai $p$ atau interval, serta jawaban bahasa sederhana dalam konteks. Keterampilan memilih dan menyampaikan ini adalah hal yang paling dihargai dalam soal tugas investigatif.
9.6
Exam tips · Tips ujian
English
Inference for a slope tests whether the true slope is $0$ (no linear relationship).
If a slope's confidence interval includes 0, you cannot conclude a real linear relationship – the variables may still be related in a curved way.
Read the slope, standard error, t-statistic, and p-value straight from computer output – but the printed p-value is two-tailed, so halve it for a one-tailed $H_a$.
Check the regression conditions (linearity, independence, roughly normal residuals, equal spread) via the residual plot.
Interpret the interval and test in context, tied to the true slope.
Bahasa Indonesia
Inferensi untuk kemiringan menguji apakah kemiringan sejati adalah $0$ (tidak ada hubungan linear).
Jika interval kepercayaan kemiringan memuat 0, Anda tidak dapat menyimpulkan adanya hubungan linear yang nyata – variabel masih bisa saling berhubungan secara melengkung.
Baca kemiringan, standar error, statistik t, dan p-value langsung dari output komputer – tetapi p-value yang dicetak adalah dua-sisi, jadi bagi dua untuk satu-sisi $H_a$.
Periksa kondisi regresi (linealitas, independensi, residual kira-kira normal, penyebaran sama) melalui plot residual.
Interpretasikan interval dan uji dalam konteks, terkait dengan kemiringan sejati.
Interactive lessons on this topic · Pelajaran interaktif untuk topik ini
Work through it step by step, with instant-check exercises. · Kerjakan langkah demi langkah, dengan latihan pengecekan instan.
Pick one and the site follows you — notes, papers, videos and practice all open on it. · Pilih satu dan situs mengikuti Anda — catatan, kertas, video, dan latihan semua terbuka di sana.
Type to search notes, lessons, code, vocabulary and past-paper questions across every subject. · Ketik untuk mencari catatan, pelajaran, kode, kosakata, dan pertanyaan soal lama di setiap mata pelajaran.