Skip to content · ⁨Lompat ke konten⁩

Inference for Categorical Data: Chi-Square · ⁨Inferensi untuk Data Kategorikal: Chi-Square⁩

AP Statistics · ⁨AP Statistik⁩ · Topic 8 · ⁨Topik 8⁩

Video lesson for this topic · ⁨Pelajaran video untuk topik ini⁩ Open the video page · ⁨Buka halaman video⁩
7:49

Inferensi untuk Data Kategorikal: Chi-Square

Lempar dadu adil enam puluh kali. Setiap sisi seharusnya muncul sepuluh kali. Tapi tidak pernah terjadi — delapan di sini, thirteen di sana. Celahnya selalu ada. Jadi lempar lagi…

English narration · English + 中文 subtitles burned in · ⁨Narasi bahasa Inggris · Subtitle bahasa Inggris + 中文 disematkan langsung⁩

8.1

Are My Results Unexpected? · ⁨Apakah Hasil Saya Tidak Terduga?⁩

Syllabus · ⁨Silabus⁩
English

Enduring Understanding (VAR-1): Given that variation may be random or not, conclusions are uncertain.

Learning Objective VAR-1.J: Identify questions suggested by variation between observed and expected counts in categorical data. [Skill 1.A]

  • VAR-1.J.1 Variation between what we find and what we expect to find may be random or not.
Bahasa Indonesia

Pemahaman Abadi (VAR-1): Mengingat variasi bisa bersifat acak atau tidak, kesimpulan bersifat tidak pasti.

Tujuan Pembelajaran VAR-1.J: Identifikasi pertanyaan yang muncul dari variasi antara jumlah yang diamati dan jumlah yang diharapkan dalam data kategorikal. [Keterampilan 1.A]

  • VAR-1.J.1 Variasi antara apa yang kita temukan dan apa yang kita harapkan dapat bersifat acak atau tidak.
Source: College Board AP Course and Exam Description · ⁨Sumber: Deskripsi Kursus dan Ujian College Board AP⁩

English

When data are counts spread across several categories, we test whether the observed counts differ from what a claim predicts. The tool is the chi-square 卡方 ($\chi^2$) statistic, which adds up the standardized gaps between observed and expected counts:

$$\chi^2=\sum \frac{(\text{observed}-\text{expected})^2}{\text{expected}}.$$
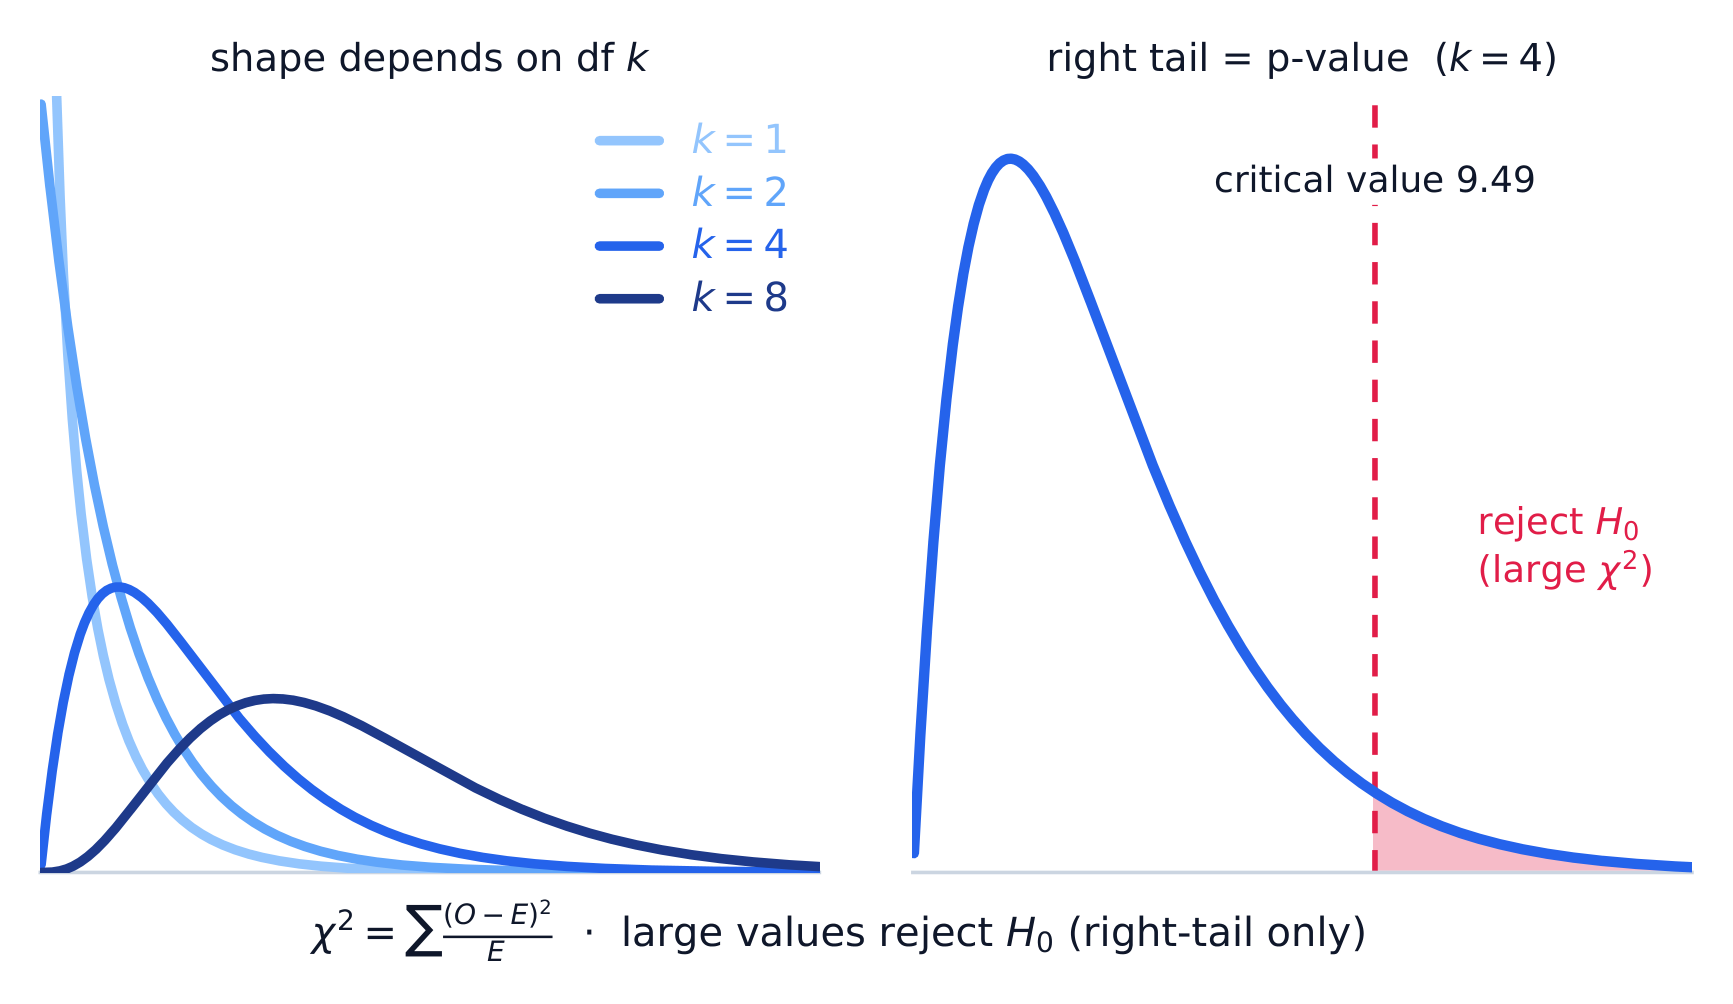
A large $\chi^2$ means the observed counts are far from expected – evidence against the claim. The chi-square distribution is right-skewed and depends on its degrees of freedom 自由度.

Bahasa Indonesia

Ketika data berupa jumlah yang tersebar di beberapa kategori, kita menguji apakah jumlah yang diamati berbeda dari apa yang diprediksi oleh sebuah klaim. Alatnya adalah statistik chi-square ($\chi^2$), yang menjumlahkan gap standar antara jumlah diamati dan yang diharapkan:

$$\chi^2=\sum \frac{(\text{observed}-\text{expected})^2}{\text{expected}}.$$
Nilai-$\chi^2$ yang besar berarti jumlah diamati jauh dari yang diharapkan – bukti melawan klaim. Distribusi chi-square memiliki kemencengan kanan dan bergantung pada derajat kebebasannya.

Vocabulary · ⁨Kosa kata⁩ Train · ⁨Latih⁩
English Bahasa Indonesia
chi-square/kaɪ skweə/ chi-square
degrees of freedom/dɪˈɡriːz ɒv ˈfriːdəm/ derajat kebebasan
8.2

Setting Up a Goodness-of-Fit Test · ⁨Menyiapkan Uji Kecocokan-Sesuai⁩

Syllabus · ⁨Silabus⁩
English

Enduring Understanding (VAR-8): The chi-square distribution may be used to model variation.

Learning Objective VAR-8.A: Describe chi-square distributions. [Skill 3.C]

  • VAR-8.A.1 Expected counts of categorical data are counts consistent with the null hypothesis. In general, an expected count is a sample size times a probability.

    The chi-square statistic measures the distance between observed and expected counts relative to expected counts.

    Chi-square distributions have positive values and are skewed right. Within a family of density curves, the skew becomes less pronounced with increasing degrees of freedom.

Learning Objective VAR-8.B: Identify the null and alternative hypotheses in a test for a distribution of proportions in a set of categorical data. [Skill 1.F]

  • VAR-8.B.1 For a chi-square goodness-of-fit test, the null hypothesis specifies null proportions for each category, and the alternative hypothesis is that at least one of these proportions is not as specified in the null hypothesis.

Learning Objective VAR-8.C: Identify an appropriate testing method for a distribution of proportions in a set of categorical data. [Skill 1.E]

  • VAR-8.C.1 When considering a distribution of proportions for one categorical variable, the appropriate test is the chi-square test for goodness of fit.

Learning Objective VAR-8.D: Calculate expected counts for the chi-square test for goodness of fit. [Skill 3.A]

  • VAR-8.D.1 Expected counts for a chi-square goodness-of-fit test are (sample size)(null proportion).

Learning Objective VAR-8.E: Verify the conditions for making statistical inferences when testing goodness of fit for a chi-square distribution. [Skill 4.C]

  • VAR-8.E.1 In order to make statistical inferences for a chi-square test for goodness of fit we must check the following:
    • a. To check for independence:
      • i. Data should be collected using a random sample or randomized experiment.
      • ii. When sampling without replacement, check that $n \leq 10\%N$.
    • b. The chi-square test for goodness of fit becomes more accurate with more observations, so large counts should be used (shape).
      • i. A conservative check for large counts is that all expected counts should be greater than 5.
Bahasa Indonesia

Pemahaman Abadi (VAR-8): Distribusi chi-square dapat digunakan untuk memodelkan variasi.

Tujuan Pembelajaran VAR-8.A: Deskripsikan distribusi chi-square. [Keterampilan 3.C]

  • VAR-8.A.1 Jumlah harapan dari data kategorikal adalah jumlah yang konsisten dengan hipotesis nol. Secara umum, jumlah harapan adalah ukuran sampel dikalikan dengan probabilitas.

    Statistik chi-square mengukur jarak antara jumlah yang diamati dan jumlah harapan relatif terhadap jumlah harapan.

    Distribusi chi-square memiliki nilai positif dan miring ke kanan. Dalam keluarga kurva kepadatan, kemiringan menjadi kurang mencolok seiring bertambahnya derajat kebebasan.

Tujuan Pembelajaran VAR-8.B: Identifikasi hipotesis nol dan alternatif dalam uji distribusi proporsi pada himpunan data kategorikal. [Keterampilan 1.F]

  • VAR-8.B.1 Untuk uji kesesuaian chi-square, hipotesis nol menetapkan proporsi nol untuk setiap kategori, dan hipotesis alternatif menyatakan bahwa setidaknya satu dari proporsi tersebut tidak sesuai seperti yang ditentukan dalam hipotesis nol.

Tujuan Pembelajaran VAR-8.C: Identifikasi metode pengujian yang tepat untuk distribusi proporsi dalam himpunan data kategorikal. [Keterampilan 1.E]

  • VAR-8.C.1 Saat mempertimbangkan distribusi proporsi untuk satu variabel kategorikal, uji yang tepat adalah uji chi-square untuk kesesuaian.

Tujuan Pembelajaran VAR-8.D: Hitung jumlah harapan untuk uji kesesuaian chi-square. [Keterampilan 3.A]

  • VAR-8.D.1 Jumlah harapan untuk uji kesesuaian chi-square adalah (ukuran sampel)(proporsi nol).

Tujuan Pembelajaran VAR-8.E: Verifikasi kondisi untuk membuat inferensi statistik ketika menguji kesesuaian untuk distribusi chi-square. [Keterampilan 4.C]

  • VAR-8.E.1 Agar dapat membuat inferensi statistik untuk uji kesesuaian chi-square, kita harus memeriksa hal-hal berikut:
    • a. Untuk memeriksa kemandirian:
      • i. Data harus dikumpulkan menggunakan sampel acak atau eksperimen diacak.
      • ii. Ketika mengambil sampel tanpa pengembalian, periksa bahwa $n \leq 10\%N$.
    • b. Uji kesesuaian chi-square menjadi lebih akurat dengan semakin banyak observasi, sehingga jumlah besar harus digunakan (bentuk).
      • i. Pengecekan konservatif untuk jumlah besar adalah semua jumlah harapan harus lebih besar dari 5.

Source: College Board AP Course and Exam Description · ⁨Sumber: Deskripsi Kursus dan Ujian College Board AP⁩

English
The chi-square (χ²) test

A goodness-of-fit (GOF) 拟合优度 test checks whether one categorical variable follows a claimed distribution (e.g. "the die is fair"). Hypotheses:

$$H_0:\text{the distribution is as claimed}\qquad H_a:\text{at least one proportion differs}.$$
Expected count for each category $=n\times(\text{claimed proportion})$. Conditions: random sample, all expected counts $\ge 5$, and the 10% condition.

Bahasa Indonesia
Uji chi-square (χ²)

Uji kecocokan-sesuai (GOF) memeriksa apakah satu variabel kategorik mengikuti distribusi yang diklaim (mis. "dadu itu adil"). Hipotesis:

$$H_0:\text{the distribution is as claimed}\qquad H_a:\text{at least one proportion differs}.$$
Jumlah harapan untuk setiap kategori $=n\times(\text{claimed proportion})$. Syarat: sampel acak, semua jumlah harapan $\ge 5$, dan syarat 10%.

Distribusi chi-square dan daerah penolakan ekornya di sebelah kanan
Distribusi chi-square memiliki kemencengan kanan. Statistik yang besar jatuh di ekor kanan yang diarsir melampaui nilai kritis – di situlah Anda menolak model.
8.3

Carrying Out a Goodness-of-Fit Test · ⁨Melaksanakan Uji Kecocokan-Sesuai⁩

Syllabus · ⁨Silabus⁩
Enduring UnderstandingLearning ObjectiveEssential Knowledge

VAR-8
The chi-square distribution may be used to model variation.

VAR-8.F
Calculate the appropriate statistic for the chi-square test for goodness of fit. [Skill 3.E]

  • VAR-8.F.1 The test statistic for the chi-square test for goodness of fit is
    • Equation: $\chi^2 = \sum \dfrac{(Observed\ count - Expected\ count)^2}{Expected\ count}$, with $degrees\ of\ freedom = number\ of\ categories - 1$.
  • VAR-8.F.2 The distribution of the test statistic assuming the null hypothesis is true (null distribution) can be either a randomization distribution or, when a probability model is assumed to be true, a theoretical distribution (chi-square).

VAR-8.G
Determine the $p$-value for chi-square test for goodness of fit significance test. [Skill 3.E]

  • VAR-8.G.1 The $p$-value for a chi-square test for goodness of fit for a number of degrees of freedom is found using the appropriate table or computer generated output.

DAT-3
Significance testing allows us to make decisions about hypotheses within a particular context.

DAT-3.I
Interpret the $p$-value for the chi-square test for goodness of fit. [Skill 4.B]

  • DAT-3.I.1 An interpretation of the $p$-value for the chi-square test for goodness of fit is the probability, given the null hypothesis and probability model are true, of obtaining a test statistic as, or more, extreme than the observed value.

DAT-3.J
Justify a claim about the population based on the results of a chi-square test for goodness of fit. [Skill 4.E]

  • DAT-3.J.1 A decision to either reject or fail to reject the null hypothesis is based on comparison of the $p$-value to the significance level, $\alpha$.
  • DAT-3.J.2 The results of a chi-square test for goodness of fit can serve as the statistical reasoning to support the answer to a research question about the population that was sampled.

Source: College Board AP Course and Exam Description · ⁨Sumber: Deskripsi Kursus dan Ujian College Board AP⁩

English

Compute $\chi^2=\sum\dfrac{(O-E)^2}{E}$ with $df=(\text{number of categories})-1$. Find the $p$-value from the chi-square distribution (upper tail), compare to $\alpha$, and conclude in context. A large component of the sum points to the category that deviates most.

Worked example. A die rolled $60$ times gives counts $8,10,12,9,11,10$. If it is fair, each expected count is $60/6=10$, so

$$\chi^2=\frac{(8-10)^2}{10}+\frac{(10-10)^2}{10}+\frac{(12-10)^2}{10}+\frac{(9-10)^2}{10}+\frac{(11-10)^2}{10}+\frac{(10-10)^2}{10}=0.4+0+0.4+0.1+0.1+0=1.0,$$
with $df=6-1=5$. Write out every category, including the two that match their expected count exactly and so add $0$ – the sum runs over all six categories, and $df$ counts categories, not just the ones that differ. This $\chi^2$ is small (a large $p$-value), so we fail to reject $H_0$ – no evidence the die is unfair.

Bahasa Indonesia

Hitung $\chi^2=\sum\dfrac{(O-E)^2}{E}$ dengan $df=(\text{number of categories})-1$. Temukan nilai-$p$ dari distribusi chi-square (ekor atas), bandingkan dengan $\alpha$, dan buat kesimpulan dalam konteks. Komponen jumlah yang besar menunjukkan kategori yang menyimpang paling banyak.

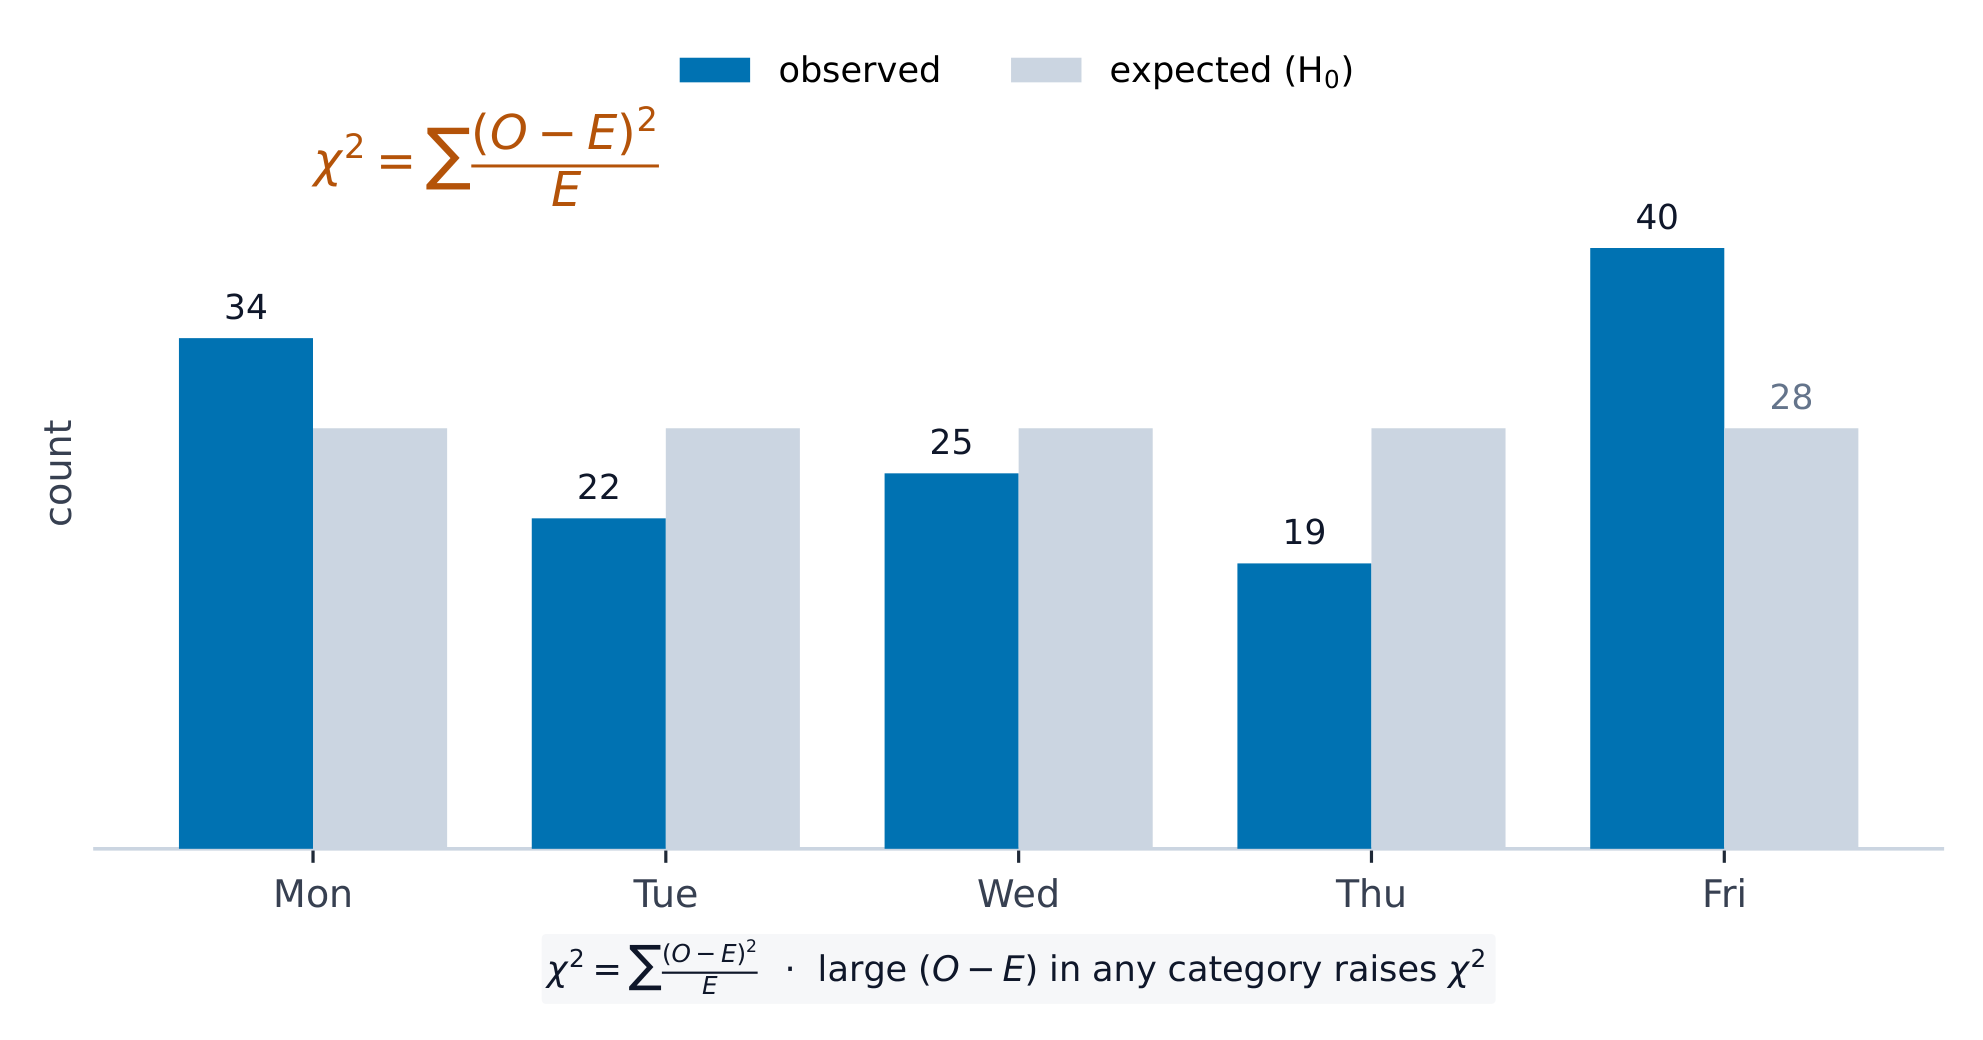
Uji chi-kuadrat membandingkan jumlah pengamatan dengan jumlah yang diharapkan di bawah hipotesis nol
Chi-square membandingkan jumlah diamati dengan yang diharapkan di bawah hipotesis nol

Contoh terpecahkan. Dadu dilempar $60$ kali menghasilkan jumlah $8,10,12,9,11,10$. Jika adil, setiap jumlah harapan adalah $60/6=10$, sehingga

$$\chi^2=\frac{(8-10)^2}{10}+\frac{(10-10)^2}{10}+\frac{(12-10)^2}{10}+\frac{(9-10)^2}{10}+\frac{(11-10)^2}{10}+\frac{(10-10)^2}{10}=0.4+0+0.4+0.1+0.1+0=1.0,$$
dengan $df=6-1=5$. Tuliskan setiap kategori, termasuk dua yang sesuai persis dengan jumlah harapannya dan sehingga menambahkan $0$ – jumlah berjalan melalui semua enam kategori, dan $df$ menghitung kategorinya, bukan hanya yang berbeda. Nilai-$\chi^2$ ini kecil (nilai-$p$ besar), jadi kami gagal menolak $H_0$ – tidak ada bukti dadu tidak adil.

Explore · ⁨Jelajahi⁩

Explore the chi-square distribution and its p-value · ⁨Jelajahi distribusi chi-square dan nilai-p-nya⁩

The p-value is the area in the right tail beyond your test statistic, so a larger $\chi^2$ means a smaller p-value. Drag $\chi^2$ to watch that area shrink, and drag df to see the whole family change shape — strongly right-skewed at small df, more symmetric as df grows. · ⁨Nilai-p adalah area di ekor kanan di luar statistik uji Anda, jadi $\chi^2$ yang lebih besar berarti nilai-p yang lebih kecil. Seret $\chi^2$ untuk melihat area itu mengecil, dan seret df untuk melihat seluruh keluarga berubah bentuk — sangat miring kanan pada df kecil, lebih simetris saat df bertambah.⁩

8.4

Expected Counts in Two-Way Tables · ⁨Jumlah Harapan dalam Tabel Dua Arah⁩

Syllabus · ⁨Silabus⁩
English

Enduring Understanding (VAR-8): The chi-square distribution may be used to model variation.

Learning Objective VAR-8.H: Calculate expected counts for two-way tables of categorical data. [Skill 3.A]

  • VAR-8.H.1 The expected count in a particular cell of a two-way table of categorical data can be calculated using the formula:
    • Equation: $expected\ count = \dfrac{(row\ total)(column\ total)}{table\ total}$.
Bahasa Indonesia

Pemahaman Abadi (VAR-8): Distribusi chi-square dapat digunakan untuk memodelkan variasi.

Tujuan Pembelajaran VAR-8.H: Hitung jumlah harapan untuk tabel dua arah data kategorikal. [Keterampilan 3.A]

  • VAR-8.H.1 Jumlah harapan dalam sel tertentu pada tabel dua arah data kategorikal dapat dihitung menggunakan rumus:
    • Persamaan: $expected\ count = \dfrac{(row\ total)(column\ total)}{table\ total}$.

Source: College Board AP Course and Exam Description · ⁨Sumber: Deskripsi Kursus dan Ujian College Board AP⁩

English

For a two-way table, the expected count in a cell (under "no association") is

$$E=\frac{(\text{row total})\times(\text{column total})}{\text{grand total}}.$$
This is the count you would see if the row and column variables were unrelated.

Worked example. In a two-way table a cell's row total is $40$, its column total is $50$, and the grand total is $200$. Its expected count is $E=\dfrac{40\times50}{200}=10$. Repeating for every cell gives the expected table to compare against the observed one.

Bahasa Indonesia

Untuk tabel dua arah, jumlah harapan dalam sebuah sel (di bawah "tidak ada asosiasi") adalah

$$E=\frac{(\text{row total})\times(\text{column total})}{\text{grand total}}.$$
Ini adalah jumlah yang akan Anda lihat jika variabel baris dan kolom saling tidak related.

Contoh terpecahkan. Dalam tabel dua arah, total baris sebuah sel adalah $40$, total kolomnya adalah $50$, dan total keseluruhan adalah $200$. Jumlah harapannya adalah $E=\dfrac{40\times50}{200}=10$. Pengulangan untuk setiap sel memberikan tabel harapan untuk dibandingkan dengan yang diamati.

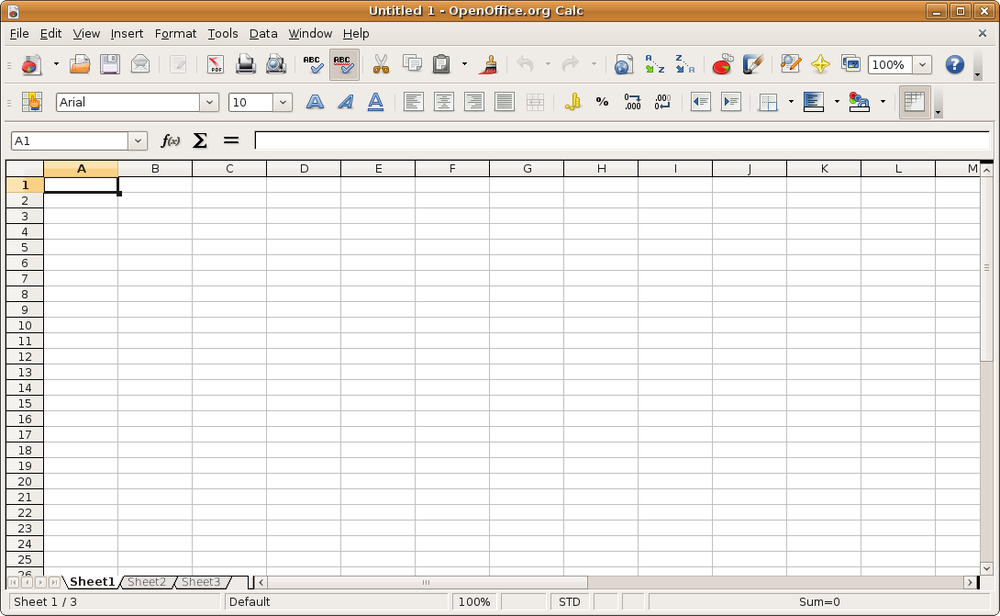
Sebuah spreadsheet mengorganisir jumlah kategorik sebelum uji chi-square
8.5

Homogeneity or Independence? · ⁨Homogenitas atau Independensi?⁩

Syllabus · ⁨Silabus⁩
English

Enduring Understanding (VAR-8): The chi-square distribution may be used to model variation.

Learning Objective VAR-8.I: Identify the null and alternative hypotheses for a chi-square test for homogeneity or independence. [Skill 1.F]

  • VAR-8.I.1 The appropriate hypotheses for a chi-square test for homogeneity are:

    $H_0$: There is no difference in distributions of a categorical variable across populations or treatments.

    $H_a$: There is a difference in distributions of a categorical variable across populations or treatments.

  • VAR-8.I.2 The appropriate hypotheses for a chi-square test for independence are:

    $H_0$: There is no association between two categorical variables in a given population or the two categorical variables are independent.

    $H_a$: Two categorical variables in a population are associated or dependent.

Learning Objective VAR-8.J: Identify an appropriate testing method for comparing distributions in two-way tables of categorical data. [Skill 1.E]

  • VAR-8.J.1 When comparing distributions to determine whether proportions in each category for categorical data collected from different populations are the same, the appropriate test is the chi-square test for homogeneity.
  • VAR-8.J.2 To determine whether row and column variables in a two-way table of categorical data might be associated in the population from which the data were sampled, the appropriate test is the chi-square test for independence.

Learning Objective VAR-8.K: Verify the conditions for making statistical inferences when testing a chi-square distribution for independence or homogeneity. [Skill 4.C]

  • VAR-8.K.1 In order to make statistical inferences for a chi-square test for two-way tables (homogeneity or independence), we must verify the following:
    • a. To check for independence:
      • i. For a test for independence: Data should be collected using a simple random sample.
      • ii. For a test for homogeneity: Data should be collected using a stratified random sample or randomized experiment.
      • iii. When sampling without replacement, check that $n \leq 10\%N$.
    • b. The chi-square tests for independence and homogeneity become more accurate with more observations, so large counts should be used (shape).
      • i. A conservative check for large counts is that all expected counts should be greater than 5.
Bahasa Indonesia

Pemahaman Abadi (VAR-8): Distribusi chi-square dapat digunakan untuk memodelkan variasi.

Tujuan Pembelajaran VAR-8.I: Identifikasi hipotesis nol dan hipotesis alternatif untuk uji chi-square untuk homogenitas atau independensi. [Skill 1.F]

  • VAR-8.I.1 Hipotesis yang sesuai untuk uji chi-square untuk homogenitas adalah:

    $H_0$: Tidak ada perbedaan dalam distribusi variabel kategorikal di seluruh populasi atau perlakuan.

    $H_a$: Ada perbedaan dalam distribusi variabel kategorikal di seluruh populasi atau perlakuan.

  • VAR-8.I.2 Hipotesis yang sesuai untuk uji chi-square untuk independensi adalah:

$H_0$: Tidak ada asosiasi antara dua variabel kategorikal dalam suatu populasi tertentu atau kedua variabel kategorikal tersebut saling bebas.

$H_a$: Dua variabel kategorikal dalam suatu populasi memiliki asosiasi atau saling bergantung.

Tujuan Pembelajaran VAR-8.J: Identifikasi metode pengujian yang sesuai untuk membandingkan distribusi dalam tabel dua arah data kategorikal. [Skill 1.E]

  • VAR-8.J.1 Saat membandingkan distribusi untuk menentukan apakah proporsi dalam setiap kategori untuk data kategorikal yang dikumpulkan dari populasi berbeda adalah sama, uji yang sesuai adalah uji chi-square untuk homogenitas.
  • VAR-8.J.2 Untuk menentukan apakah variabel baris dan kolom dalam tabel dua arah data kategorikal mungkin memiliki asosiasi dalam populasi tempat data diambil sampelnya, uji yang sesuai adalah uji chi-square untuk independensi.

Tujuan Pembelajaran VAR-8.K: Verifikasi kondisi untuk melakukan inferensi statistik ketika menguji distribusi chi-square untuk independensi atau homogenitas. [Skill 4.C]

  • VAR-8.K.1 Agar dapat melakukan inferensi statistik untuk uji chi-square untuk tabel dua arah (homogenitas atau independensi), kita harus memverifikasi hal berikut:
    • a. Untuk memeriksa kemandirian:
      • i. Untuk uji independensi: Data harus dikumpulkan menggunakan sampel acak sederhana.
      • ii. Untuk uji homogenitas: Data harus dikumpulkan menggunakan sampel acak bertingkat atau eksperimen teracak.
      • iii. Saat mengambil sampel tanpa pengembalian, periksa bahwa $n \leq 10\%N$.
    • b. Uji chi-square untuk independensi dan homogenitas menjadi lebih akurat dengan semakin banyak observasi, sehingga jumlah besar (bentuk) harus digunakan.
      • i. Pengecekan konservatif untuk jumlah besar adalah semua jumlah harapan harus lebih besar dari 5.

Source: College Board AP Course and Exam Description · ⁨Sumber: Deskripsi Kursus dan Ujian College Board AP⁩

English

Two tests use the same $\chi^2$ math but answer different questions:

  • Test for homogeneity 同质性: are the distributions of one categorical variable the same across several populations or groups (separate samples/treatments)?
  • Test for independence 独立性: are two categorical variables associated within a single population (one sample, two variables measured)?

The design (several samples vs one sample) decides which name and hypotheses to use.

Bahasa Indonesia

Dua uji menggunakan matematika $\chi^2$ yang sama tetapi menjawab pertanyaan berbeda:

  • Uji homogenitas: apakah distribusi satu variabel kategorik sama di seluruh beberapa populasi atau kelompok (sampel/perlakuan terpisah)?
  • Uji independensi: apakah dua variabel kategorik terkait dalam satu populasi (satu sampel, dua variabel diukur)?

Desain (beberapa sampel vs satu sampel) menentukan nama dan hipotesis mana yang digunakan.

8.6

Carrying Out a Test for Homogeneity or Independence · ⁨Melaksanakan Uji Homogenitas atau Independensi⁩

Syllabus · ⁨Silabus⁩
Enduring UnderstandingLearning ObjectiveEssential Knowledge

VAR-8
The chi-square distribution may be used to model variation.

VAR-8.L
Calculate the appropriate statistic for a chi-square test for homogeneity or independence. [Skill 3.E]

  • VAR-8.L.1 The appropriate test statistic for a chi-square test for homogeneity or independence is the chi-square statistic:
    • Equation: $\chi^2 = \sum \dfrac{(Observed\ count - Expected\ count)^2}{Expected\ count}$, with degrees of freedom equal to: $(number\ of\ rows - 1)(number\ of\ columns - 1)$.

VAR-8.M
Determine the $p$-value for a chi-square significance test for independence or homogeneity. [Skill 3.E]

  • VAR-8.M.1 The $p$-value for a chi-square test for independence or homogeneity for a number of degrees of freedom is found using the appropriate table or technology.
  • VAR-8.M.2 For a test of independence or homogeneity for a two-way table, the $p$-value is the proportion of values in a chi-square distribution with appropriate degrees of freedom that are equal to or larger than the test statistic.

DAT-3
Significance testing allows us to make decisions about hypotheses within a particular context.

DAT-3.K
Interpret the $p$-value for the chi-square test for homogeneity or independence. [Skill 4.B]

  • DAT-3.K.1 An interpretation of the $p$-value for the chi-square test for homogeneity or independence is the probability, given the null hypothesis and probability model are true, of obtaining a test statistic as, or more, extreme than the observed value.

DAT-3.L
Justify a claim about the population based on the results of a chi-square test for homogeneity or independence. [Skill 4.E]

  • DAT-3.L.1 A decision to either reject or fail to reject the null hypothesis for a chi-square test for homogeneity or independence is based on comparison of the $p$-value to the significance level, $\alpha$.
  • DAT-3.L.2 The results of a chi-square test for homogeneity or independence can serve as the statistical reasoning to support the answer to a research question about the population that was sampled (independence) or the populations that were sampled (homogeneity).

Source: College Board AP Course and Exam Description · ⁨Sumber: Deskripsi Kursus dan Ujian College Board AP⁩

English

Compute expected counts, then $\chi^2=\sum\dfrac{(O-E)^2}{E}$ over all cells, with

$$df=(\text{rows}-1)(\text{columns}-1).$$
Conditions: random data, all expected counts $\ge 5$, 10% condition. Find the $p$-value, compare to $\alpha$, and conclude in context – evidence of a difference between groups (homogeneity) or of an association (independence).

Bahasa Indonesia

Hitung jumlah harapan, kemudian $\chi^2=\sum\dfrac{(O-E)^2}{E}$ melintasi semua sel, dengan

$$df=(\text{rows}-1)(\text{columns}-1).$$
Kondisi: data acak, semua jumlah harapan $\ge 5$, kondisi 10%. Temukan nilai-$p$, bandingkan dengan $\alpha$, dan buat kesimpulan dalam konteks – bukti adanya perbedaan antar kelompok (homogenitas) atau asosiasi (independensi).

8.7

Choosing the Right Categorical Procedure · ⁨Memilih Prosedur Kategorik yang Tepat⁩

Syllabus · ⁨Silabus⁩
English

This topic is intended to focus on the skill of selecting an appropriate inference procedure now that students have a range of options. Students should be given opportunities to practice when and how to apply all learning objectives relating to inference for categorical data.

Bahasa Indonesia

Topik ini bertujuan untuk fokus pada keterampilan memilih prosedur inferensi yang tepat sekarang bahwa siswa telah memiliki berbagai pilihan. Siswa harus diberikan kesempatan untuk berpraktik kapan dan bagaimana menerapkan semua tujuan pembelajaran yang berkaitan dengan inferensi untuk data kategorikal.

Source: College Board AP Course and Exam Description · ⁨Sumber: Deskripsi Kursus dan Ujian College Board AP⁩

English

Decide by the setup: one categorical variable against a claimed distribution $\Rightarrow$ goodness-of-fit; one sample cross-classified by two variables $\Rightarrow$ independence; several samples/groups compared $\Rightarrow$ homogeneity. Comparing just two proportions can use either a two-proportion $z$-test or a chi-square test, but only for a two-tailed alternative, where they agree exactly ($\chi^2=z^2$). A chi-square test is always two-tailed, so it cannot give a directional conclusion: if $H_a$ is one-tailed (say $p_1>p_2$), use the $z$-test.

Bahasa Indonesia

Putuskan berdasarkan pengaturan: satu variabel kategorikal terhadap distribusi yang diklaim $\Rightarrow$ kesesuaian; satu sampel diklasifikasikan silang oleh dua variabel $\Rightarrow$ ketergantungan; beberapa sampel/kelompok dibandingkan $\Rightarrow$ homogenitas. Membandingkan hanya dua proporsi dapat menggunakan uji dua-proporsi $z$ atau uji chi-kuadrat, tetapi hanya untuk alternatif dua-sisi, di mana keduanya setuju persis ($\chi^2=z^2$). Uji chi-kuadrat selalu dua-sisi, sehingga tidak dapat memberikan kesimpulan arah: jika $H_a$ adalah satu-sisi (misalnya $p_1>p_2$), gunakan uji $z$.

Explore · ⁨Jelajahi⁩

Which chi-square test is this? · ⁨Uji chi-square mana ini?⁩

All three tests use the same $\chi^2$ arithmetic, so the marks are won by naming the right one. The design decides — how many samples were taken, and how many variables were measured on each unit. · ⁨Ketiga uji menggunakan aritmatika $\chi^2$ yang sama, sehingga poin diraih dengan menyebutkan nama yang tepat. Desain yang menentukan — berapa banyak sampel yang diambil, dan berapa banyak variabel yang diukur pada setiap unit.⁩

8.7

Exam tips · ⁨Tips ujian⁩

English
  • Use $\chi^2=\sum\tfrac{(O-E)^2}{E}$ for categorical data; always divide by the expected count.
  • Pick the right test: goodness-of-fit (one variable), independence, or homogeneity (two-way table).
  • Compute expected counts as $\tfrac{\text{row total}\times\text{column total}}{\text{grand total}}$ and check each is $\ge5$.
  • A large $\chi^2$ (small p-value) means observed counts differ from expected by more than chance.
  • State degrees of freedom correctly (categories $-1$, or $(r-1)(c-1)$).
Bahasa Indonesia
  • Gunakan $\chi^2=\sum\tfrac{(O-E)^2}{E}$ untuk data kategorikal; selalu bagi dengan jumlah diharapkan.
  • Pilih uji yang tepat: goodness-of-fit (satu variabel), independensi, atau homogenitas (tabel dua arah).
  • Hitung jumlah diharapkan sebagai $\tfrac{\text{row total}\times\text{column total}}{\text{grand total}}$ dan periksa setiap nilai $\ge5$.
  • Nilai $\chi^2$ yang besar (p-value kecil) berarti jumlah observasi berbeda dari jumlah diharapkan lebih banyak daripada yang terjadi secara kebetulan.
  • Nyatakan derajat kebebasan dengan benar (kategori $-1$, atau $(r-1)(c-1)$).
Vocabulary · ⁨Kosa kata⁩ Train · ⁨Latih⁩
English Bahasa Indonesia
goodness-of-fit (GOF)/ˈɡʊdnəs ɒv fɪt/ kesesuaian-kecocokan (GOF)
Test for homogeneity/test fɔː ˈhɒməʊdʒneɪti/ Uji homogenitas
Test for independence/test fɔː ˌɪndɪˈpendəns/ Uji independensi

Interactive lessons on this topic · ⁨Pelajaran interaktif untuk topik ini⁩

Work through it step by step, with instant-check exercises. · ⁨Kerjakan langkah demi langkah, dengan latihan pengecekan instan.⁩

Past Papers · ⁨Soal-Soil Masa Lalu⁩

More topics in AP Statistics · ⁨AP Statistik⁩ · ⁨Topik lain dalam AP Statistics · ⁨AP Statistik⁩⁩

Log in or create account · ⁨Masuk atau buat akun⁩

IGCSE, A-Level & AP