Sebuah kota ingin tahu berapa banyak orang yang mendukung kebijakan baru. Kita tidak bisa menanyakan kepada semua orang, jadi kita menanyakan kepada dua ratus secara acak. Seratus dua puluh mengatakan ya — enam puluh…
English narration · English + 中文 subtitles burned in · Narasi bahasa Inggris · Subtitle bahasa Inggris + 中文 disematkan langsung
6.1
Why Be Normal? · Mengapa Harus Normal?
Syllabus · Silabus
English
Enduring Understanding (VAR-1): Given that variation may be random or not, conclusions are uncertain.
Learning Objective VAR-1.H: Identify questions suggested by variation in the shapes of distributions of samples taken from the same population. [Skill 1.A]
VAR-1.H.1 Variation in shapes of data distributions may be random or not.
Bahasa Indonesia
Pemahaman Abadi (VAR-1): Mengingat variasi bisa bersifat acak atau tidak, kesimpulan bersifat tidak pasti.
Tujuan Pembelajaran VAR-1.H: Identifikasi pertanyaan yang ditunjukkan oleh variasi pada bentuk distribusi sampel yang diambil dari populasi yang sama. [Keterampilan 1.A]
VAR-1.H.1 Variasi pada bentuk distribusi data mungkin bersifat acak atau tidak.
Source: College Board AP Course and Exam Description · Sumber: Deskripsi Kursus dan Ujian College Board AP
English
Because a sample proportion $\hat{p}$ is approximately normally distributed (when the conditions hold), we can measure how far a sample result is from a claimed value in standard errors, and turn that into a probability. This is what makes inference 推断 – drawing conclusions about a population from a sample – possible.
Bahasa Indonesia
Karena proporsi sampel $\hat{p}$ berdistribusi secara normal (ketika kondisinya terpenuhi), kita dapat mengukur seberapa jauh hasil sampel dari nilai yang diklaim dalam satuan standar error, dan mengubahnya menjadi probabilitas. Inilah yang membuat inferensi – menarik kesimpulan tentang populasi dari sampel – mungkin.
6.2
Confidence Interval for a Proportion · Interval Kepercayaan untuk Proporsi
Syllabus · Silabus
English
Enduring Understanding (UNC-4): An interval of values should be used to estimate parameters, in order to account for uncertainty.
Learning Objective UNC-4.A: Identify an appropriate confidence interval procedure for a population proportion. [Skill 1.D]
UNC-4.A.1 The appropriate confidence interval procedure for a one-sample proportion for one categorical variable is a one sample $z$-interval for a proportion.
Learning Objective UNC-4.B: Verify the conditions for calculating confidence intervals for a population proportion. [Skill 4.C]
UNC-4.B.1 In order to make assumptions necessary for inference on population proportions, means, and slopes, we must check for independence in data collection methods and for selection of the appropriate sampling distribution.
UNC-4.B.2 In order to calculate a confidence interval to estimate a population proportion, $p$, we must check for independence and that the sampling distribution is approximately normal.
a. To check for independence:
i. Data should be collected using a random sample or a randomized experiment.
ii. When sampling without replacement, check that $n \leq 10\%N$, where $N$ is the size of the population.
b. To check that the sampling distribution of $\hat{p}$ is approximately normal (shape):
i. For categorical variables, check that both the number of successes, $n\hat{p}$, and the number of failures, $n(1-\hat{p})$ are at least 10 so that the sample size is large enough to support an assumption of normality.
Learning Objective UNC-4.C: Determine the margin of error for a given sample size and an estimate for the sample size that will result in a given margin of error for a population proportion. [Skill 3.D]
UNC-4.C.1 Based on sample data, the standard error of a statistic is an estimate for the standard deviation for the statistic. The standard error of $\hat{p}$ is $SE_{\hat{p}} = \sqrt{\dfrac{\hat{p}(1-\hat{p})}{n}}$.
UNC-4.C.2 A margin of error gives how much a value of a sample statistic is likely to vary from the value of the corresponding population parameter.
UNC-4.C.3 For categorical variables, the margin of error is the critical value ($z^*$) times the standard error (SE) of the relevant statistic, which equals $z^* \sqrt{\dfrac{\hat{p}(1-\hat{p})}{n}}$ for a one sample proportion.
UNC-4.C.4 The formula for margin of error can be rearranged to solve for $n$, the minimum sample size needed to achieve a given margin of error. For this purpose, use a guess for $\hat{p}$ or use $\hat{p} = 0.5$ in order to find an upper bound for the sample size that will result in a given margin of error.
Learning Objective UNC-4.D: Calculate an appropriate confidence interval for a population proportion. [Skill 3.D]
UNC-4.D.1 In general, an interval estimate can be constructed as point estimate ± (margin of error). For a one-sample proportion, the interval estimate is $\hat{p} \pm z^* \sqrt{\dfrac{\hat{p}(1-\hat{p})}{n}}$.
Clarifying statement: Formulas for interval estimates do not appear explicitly on the AP Statistics Formula Sheet provided with the AP Statistics Exam. However, these formulas do not need to be memorized, as they can be constructed based on the general test statistic formula and the relevant standard error formulas that are provided on the formula sheet.
UNC-4.D.2 Critical values represent the boundaries encompassing the middle C% of the standard normal distribution, where C% is an approximate confidence level for a proportion.
Learning Objective UNC-4.E: Calculate an interval estimate based on a confidence interval for a population proportion. [Skill 3.D]
UNC-4.E.1 Confidence intervals for population proportions can be used to calculate interval estimates with specified units.
Bahasa Indonesia
Pemahaman Berkelanjutan (UNC-4): Interval nilai harus digunakan untuk memperkirakan parameter, guna mempertimbangkan ketidakpastian.
Tujuan Pembelajaran UNC-4.A: Identifikasi prosedur interval kepercayaan yang sesuai untuk proporsi populasi. [Keterampilan 1.D]
UNC-4.A.1 Prosedur interval kepercayaan yang tepat untuk proporsi satu sampel untuk satu variabel kategorikal adalah interval-z satu sampel $z$ untuk proporsi.
Tujuan Pembelajaran UNC-4.B: Verifikasi kondisi untuk menghitung interval kepercayaan untuk proporsi populasi. [Keterampilan 4.C]
UNC-4.B.1 Agar dapat membuat asumsi yang diperlukan untuk inferensi terhadap proporsi populasi, rata-rata, dan kemiringan (slope), kita harus memeriksa independence dalam metode pengumpulan data serta pemilihan distribusi sampling yang sesuai.
UNC-4.B.2 Agar dapat menghitung interval kepercayaan untuk memperkirakan proporsi populasi, $p$, kita harus memeriksa independence dan memastikan bahwa distribusi sampling mendekati normal.
a. Untuk memeriksa kemandirian:
i. Data harus dikumpulkan menggunakan sampel acak atau eksperimen teracak.
ii. Ketika pengambilan sampel tanpa pengembalian, periksa bahwa $n \leq 10\%N$, di mana $N$ adalah ukuran populasi.
b. Untuk memeriksa bahwa distribusi sampling dari $\hat{p}$ mendekati normal (bentuk):
i. Untuk variabel kategorikal, periksa bahwa baik jumlah keberhasilan, $n\hat{p}$, maupun jumlah kegagalan, $n(1-\hat{p})$, minimal 10 agar ukuran sampel cukup besar untuk mendukung asumsi normalitas.
Tujuan Pembelajaran UNC-4.C: Menentukan margin of error untuk ukuran sampel tertentu dan memperkirakan ukuran sampel yang akan menghasilkan margin of error tertentu untuk proporsi populasi. [Skill 3.D]
UNC-4.C.1 Berdasarkan data sampel, standard error dari suatu statistik adalah estimasi untuk standar deviasi statistik tersebut. Standard error dari $\hat{p}$ adalah $SE_{\hat{p}} = \sqrt{\dfrac{\hat{p}(1-\hat{p})}{n}}$.
UNC-4.C.2 Margin of error memberikan gambaran seberapa jauh nilai statistik sampel mungkin berfluktuasi dari nilai parameter populasi yang bersesuaian.
UNC-4.C.3 Untuk variabel kategorikal, margin of error adalah nilai kritis ($z^*$) dikalikan dengan standard error (SE) dari statistik yang relevan, yang sama dengan $z^* \sqrt{\dfrac{\hat{p}(1-\hat{p})}{n}}$ untuk proporsi satu sampel.
UNC-4.C.4 Rumus margin of error dapat diubah susunannya untuk menyelesaikan $n$, yaitu ukuran sampel minimum yang diperlukan untuk mencapai margin of error tertentu. Untuk tujuan ini, gunakan tebakan untuk $\hat{p}$ atau gunakan $\hat{p} = 0.5$ guna menemukan batas atas ukuran sampel yang akan menghasilkan margin of error tertentu.
Tujuan Pembelajaran UNC-4.D: Menghitung interval kepercayaan yang sesuai untuk proporsi populasi. [Skill 3.D]
UNC-4.D.1 Secara umum, estimasi interval dapat disusun sebagai estimasi titik ± (margin of error). Untuk proporsi satu sampel, estimasi intervalnya adalah $\hat{p} \pm z^* \sqrt{\dfrac{\hat{p}(1-\hat{p})}{n}}$.
Pernyataan penjelas: Rumus untuk estimasi interval tidak muncul secara eksplisit pada Lembar Rumus AP Statistics yang disertakan dalam Ujian AP Statistics. Namun, rumus-rumus ini tidak perlu dihafal karena dapat disusun berdasarkan rumus statistik uji umum dan rumus standard error yang relevan yang disediakan pada lembar rumus.
UNC-4.D.2 Nilai kritis merepresentasikan batas-batas yang mencakup C% bagian tengah dari distribusi normal standar, di mana C% adalah tingkat kepercayaan yang kira-kira untuk proporsi.
Tujuan Pembelajaran UNC-4.E: Menghitung estimasi interval berdasarkan interval kepercayaan untuk proporsi populasi. [Skill 3.D]
UNC-4.E.1 Interval kepercayaan untuk proporsi populasi dapat digunakan untuk menghitung estimasi interval dengan satuan yang ditentukan.
Source: College Board AP Course and Exam Description · Sumber: Deskripsi Kursus dan Ujian College Board AP
English
What a confidence interval means
A confidence interval 置信区间 estimates the parameter as a range: statistic $\pm$margin of error 误差幅度.
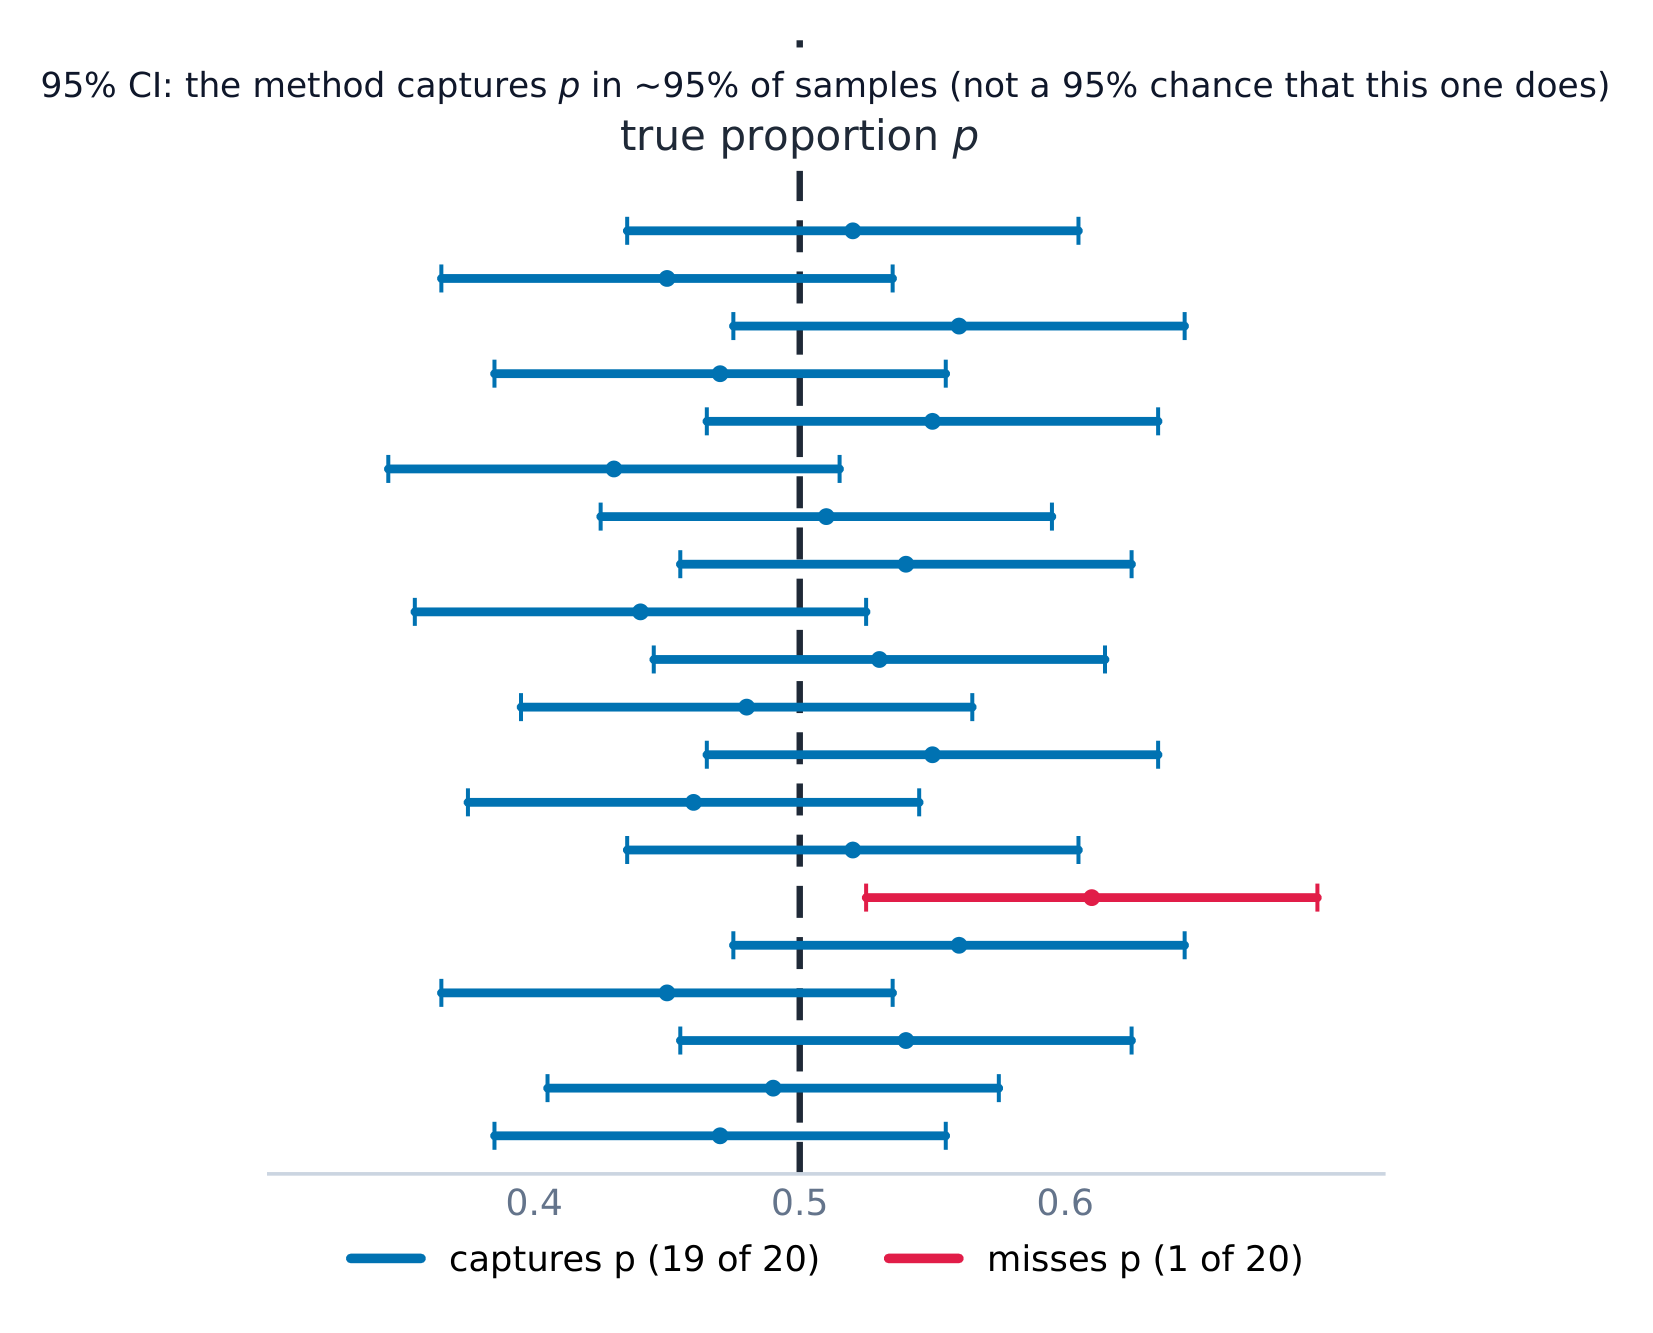
$z^{*}$ is the critical value for the confidence level 置信水平 (e.g. $1.96$ for 95%). Conditions: random sample, Large Counts ($n\hat p\ge 10$ and $n(1-\hat p)\ge 10$), and the 10% condition. Interpret it: "We are 95% confident the true proportion of... is between... and...". Interpret the level: "In 95% of samples, this method produces an interval that captures the true proportion."
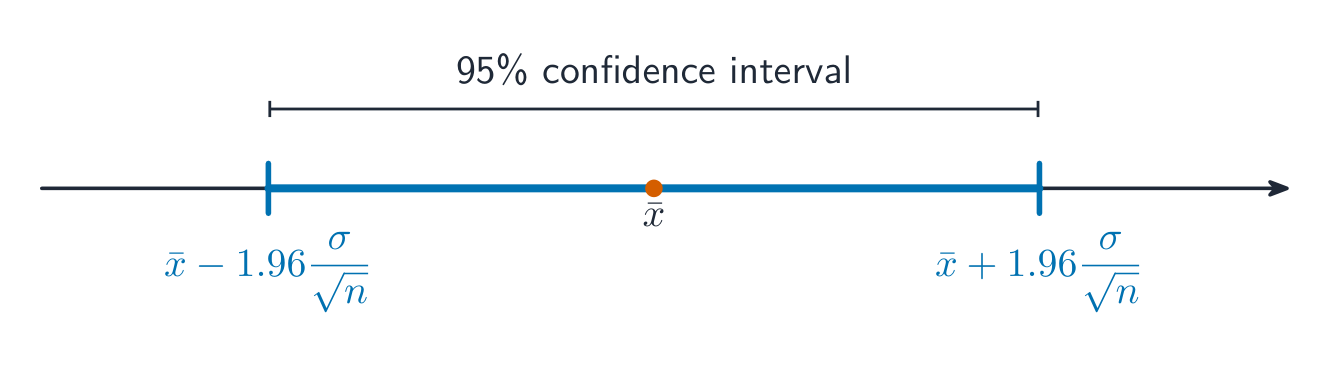
Worked example. In a random sample of $200$ people, $120$ support a policy, so $\hat{p}=0.60$. A $95\%$ interval uses $z^*=1.96$:
We are $95\%$ confident the true proportion of supporters is between $53.2\%$ and $66.8\%$.
Choosing the sample size. To keep the margin of error no larger than a target $m$, set $z^{*}\sqrt{\dfrac{\hat p(1-\hat p)}{n}}\le m$ and solve for $n$. When you have no estimate of $\hat p$, use $\hat p=0.5$: it makes $\hat p(1-\hat p)$ as large as possible, giving the safe (largest) required sample size. Always round the result up to the next whole person.
Worked example. How many people must you survey for a $95\%$ interval with margin of error at most $0.03$? Using $\hat p=0.5$ and $z^*=1.96$:
$z^{*}$ adalah nilai kritis untuk tingkat kepercayaan (mis. $1.96$ untuk 95%). Kondisi: sampel acak, Jumlah Besar ($n\hat p\ge 10$ dan $n(1-\hat p)\ge 10$), dan kondisi 10%. Interpretasikan: "Kami yakin 95% bahwa proporsi sebenarnya dari... berada antara... dan...". Interpretasikan tingkatnya: "Dalam 95% sampel, metode ini menghasilkan interval yang menangkap proporsi sebenarnya."
Di atas banyak sampel, sekitar 95% dari interval kepercayaan 95% menangkap proporsi sebenarnya
Contoh kerja. Dalam sampel acak $200$ orang, $120$ mendukung kebijakan, sehingga $\hat{p}=0.60$. Interval $95\%$ menggunakan $z^*=1.96$:
Kami $95\%$ percaya proporsi pendukung sebenarnya berada antara $53.2\%$ dan $66.8\%$.
Interval kepercayaan 95% mencapai 1,96 standar error di setiap sisi estimasi
Memilih ukuran sampel. Untuk menjaga margin of error tidak lebih besar dari target $m$, tetapkan $z^{*}\sqrt{\dfrac{\hat p(1-\hat p)}{n}}\le m$ dan selesaikan untuk $n$. Ketika Anda tidak memiliki estimasi $\hat p$, gunakan $\hat p=0.5$: hal ini membuat $\hat p(1-\hat p)$ sebesar mungkin, memberikan ukuran sampel yang dibutuhkan (teraman/terbesar). Selalu bulatkan hasilnya ke atas ke orang utuh terdekat.
Contoh kerja. Berapa banyak orang yang harus Anda survei untuk interval $95\%$ dengan margin of error paling banyak $0.03$? Menggunakan $\hat p=0.5$ dan $z^*=1.96$:
Justifying a Claim from an Interval · Membenarkan Klaim dari Interval
Syllabus · Silabus
English
Enduring Understanding (UNC-4): An interval of values should be used to estimate parameters, in order to account for uncertainty.
Learning Objective UNC-4.F: Interpret a confidence interval for a population proportion. [Skill 4.B]
UNC-4.F.1 A confidence interval for a population proportion either contains the population proportion or it does not, because each interval is based on random sample data, which varies from sample to sample.
UNC-4.F.2 We are C% confident that the confidence interval for a population proportion captures the population proportion.
UNC-4.F.3 In repeated random sampling with the same sample size, approximately C% of confidence intervals created will capture the population proportion.
UNC-4.F.4 Interpreting a confidence interval for a one-sample proportion should include a reference to the sample taken and details about the population it represents.
Illustrative examples for UNC-4.F.4: For interpreting a 99% confidence interval of (0.268, 0.292), based on the proportion of a nationally representative sample of twelfth-grade students who answered a particular multiple choice question correctly: "We are 99 percent confident that the interval from 0.268 to 0.292 contains the population proportion of all United States twelfth-grade students who would answer this question correctly" (2011 FRQ 6(a)).
Learning Objective UNC-4.G: Justify a claim based on a confidence interval for a population proportion. [Skill 4.D]
UNC-4.G.1 A confidence interval for a population proportion provides an interval of values that may provide sufficient evidence to support a particular claim in context.
Learning Objective UNC-4.H: Identify the relationships between sample size, width of a confidence interval, confidence level, and margin of error for a population proportion. [Skill 4.A]
UNC-4.H.1 When all other things remain the same, the width of the confidence interval for a population proportion tends to decrease as the sample size increases. For a population proportion, the width of the interval is proportional to $\dfrac{1}{\sqrt{n}}$.
UNC-4.H.2 For a given sample, the width of the confidence interval for a population proportion increases as the confidence level increases.
UNC-4.H.3 The width of a confidence interval for a population proportion is exactly twice the margin of error.
Bahasa Indonesia
Pemahaman Berkelanjutan (UNC-4): Interval nilai harus digunakan untuk memperkirakan parameter, guna mempertimbangkan ketidakpastian.
Tujuan Pembelajaran UNC-4.F: Menafsirkan interval kepercayaan untuk proporsi populasi. [Skill 4.B]
UNC-4.F.1 Interval kepercayaan untuk proporsi populasi either contains the population proportion or it does not, karena setiap interval didasarkan pada data sampel acak, yang bervariasi dari sampel ke sampel.
UNC-4.F.2 Kita memiliki tingkat kepercayaan C% bahwa interval kepercayaan untuk proporsi populasi menangkap proporsi populasi.
UNC-4.F.3 Dalam pengambilan sampel acak berulang dengan ukuran sampel yang sama, sekitar C% dari interval kepercayaan yang dibuat akan menangkap proporsi populasi.
UNC-4.F.4 Menafsirkan interval kepercayaan untuk proporsi satu sampel harus menyertakan referensi terhadap sampel yang diambil dan detail mengenai populasi yang diwakilinya.
Contoh ilustratif untuk UNC-4.F.4: Untuk menafsirkan interval kepercayaan 99% sebesar (0,268; 0,292), berdasarkan proporsi siswa kelas dua belas dalam sampel yang mewakili nasional yang menjawab pertanyaan pilihan ganda tertentu dengan benar: "Kami memiliki tingkat kepercayaan 99 persen bahwa interval dari 0,268 hingga 0,292 memuat proporsi populasi seluruh siswa kelas dua belas Amerika Serikat yang akan menjawab pertanyaan ini dengan benar" (Soal FRQ 2011 No. 6(a)).
Tujuan Pembelajaran UNC-4.G: Membenarkan klaim berdasarkan interval kepercayaan untuk proporsi populasi. [Skill 4.D]
UNC-4.G.1 Interval kepercayaan untuk proporsi populasi menyediakan rentang nilai yang mungkin memberikan bukti yang cukup untuk mendukung klaim tertentu dalam konteks.
Tujuan Pembelajaran UNC-4.H: Mengidentifikasi hubungan antara ukuran sampel, lebar interval kepercayaan, tingkat kepercayaan, dan margin of error untuk proporsi populasi. [Skill 4.A]
UNC-4.H.1 Ketika semua hal lain tetap sama, lebar interval kepercayaan untuk proporsi populasi cenderung menurun seiring dengan peningkatan ukuran sampel. Untuk proporsi populasi, lebar interval sebanding dengan $\dfrac{1}{\sqrt{n}}$.
UNC-4.H.2 Untuk sampel tertentu, lebar interval kepercayaan untuk proporsi populasi meningkat seiring dengan meningkatnya tingkat kepercayaan.
UNC-4.H.3 Lebar interval kepercayaan untuk proporsi populasi tepat sama dengan dua kali margin of error.
Source: College Board AP Course and Exam Description · Sumber: Deskripsi Kursus dan Ujian College Board AP
English
To judge a claimed value: if it lies inside the interval, the data are consistent with it; if it lies outside, the data give evidence against it. Base the conclusion on whether the plausible values include the claim, in context.
Bahasa Indonesia
Untuk menilai nilai yang diklaim: jika terletak di dalam interval, data konsisten dengannya; jika terletak di luar, data memberikan bukti melawannya. Dasar kesimpulan pada apakah nilai yang masuk akal mencakup klaim, dalam konteks.
6.4
Setting Up a Test for a Proportion · Menyiapkan Tes untuk Proporsi
Syllabus · Silabus
English
Enduring Understanding (VAR-6): The normal distribution may be used to model variation.
Learning Objective VAR-6.D: Identify the null and alternative hypotheses for a population proportion. [Skill 1.F]
VAR-6.D.1 The null hypothesis is the situation that is assumed to be correct unless evidence suggests otherwise, and the alternative hypothesis is the situation for which evidence is being collected.
VAR-6.D.2 For hypotheses about parameters, the null hypothesis contains an equality reference (=, ≥, or ≤), while the alternative hypothesis contains a strict inequality (<, >, or ≠). The type of inequality in the alternative hypothesis is based on the question of interest. Alternative hypotheses with < or > are called one-sided, and alternative hypotheses with ≠ are called two-sided. Although the null hypothesis for a one-sided test may include an inequality symbol, it is still tested at the boundary of equality.
VAR-6.D.3 The null hypothesis for a population proportion is: $H_0 : p = p_0$, where $p_0$ is the null hypothesized value for the population proportion.
VAR-6.D.4 A one-sided alternative hypothesis for a proportion is either $H_a : p < p_0$ or $H_a : p > p_0$. A two-sided alternate hypothesis is $H_a : p_1 \neq p_2$.
VAR-6.D.5 For a one-sample $z$-test for a population proportion, the null hypothesis specifies a value for the population proportion, usually one indicating no difference or effect.
Learning Objective VAR-6.E: Identify an appropriate testing method for a population proportion. [Skill 1.E]
VAR-6.E.1 For a single categorical variable, the appropriate testing method for a population proportion is a one-sample $z$-test for a population proportion.
Learning Objective VAR-6.F: Verify the conditions for making statistical inferences when testing a population proportion. [Skill 4.C]
VAR-6.F.1 In order to make statistical inferences when testing a population proportion, we must check for independence and that the sampling distribution is approximately normal:
a. To check for independence:
i. Data should be collected using a random sample or a randomized experiment.
ii. When sampling without replacement, check that $n \leq 10\%N$.
b. To check that the sampling distribution of $\hat{p}$ is approximately normal (shape):
i. Assuming that $H_0$ is true $(p = p_0)$, verify that both the number of successes, $np_0$, and the number of failures, $n(1-p_0)$ are at least 10 so that that the sample size is large enough to support an assumption of normality.
Bahasa Indonesia
Pemahaman Abadi (VAR-6): Distribusi normal dapat digunakan untuk memodelkan variasi.
Tujuan Pembelajaran VAR-6.D: Mengidentifikasi hipotesis nol dan hipotesis alternatif untuk proporsi populasi. [Skill 1.F]
VAR-6.D.1 Hipotesis nol adalah situasi yang diasumsikan benar kecuali ada bukti yang menunjukkan sebaliknya, dan hipotesis alternatif adalah situasi untuk mana bukti sedang dikumpulkan.
VAR-6.D.2 Untuk hipotesis tentang parameter, hipotesis nol memuat referensi kesamaan (=, ≥, atau ≤), sedangkan hipotesis alternatif memuat ketaksamaan ketat (<, >, atau ≠). Jenis ketaksamaan dalam hipotesis alternatif didasarkan pada pertanyaan yang diteliti. Hipotesis alternatif dengan < or > disebut satu sisi, dan hipotesis alternatif dengan ≠ disebut dua sisi. Meskipun hipotesis nol untuk uji satu sisi mungkin mencakup simbol ketaksamaan, hipotesis tersebut tetap diuji pada batas kesamaan.
VAR-6.D.3 Hipotesis nol untuk proporsi populasi adalah: $H_0 : p = p_0$, di mana $p_0$ adalah nilai yang diasumsikan nol untuk proporsi populasi.
VAR-6.D.4 Hipotesis alternatif satu sisi untuk proporsi adalah either $H_a : p < p_0$ or $H_a : p > p_0$. Hipotesis alternatif dua sisi adalah $H_a : p_1 \neq p_2$.
VAR-6.D.5 Untuk uji $z$-satu sampel untuk proporsi populasi, hipotesis nol menentukan nilai untuk proporsi populasi, biasanya satu yang menunjukkan tidak ada perbedaan atau efek.
Tujuan Pembelajaran VAR-6.E: Identifikasi metode pengujian yang tepat untuk proporsi populasi. [Keterampilan 1.E]
VAR-6.E.1 Untuk satu variabel kategorikal tunggal, metode pengujian yang tepat untuk proporsi populasi adalah uji $z$-satu sampel untuk proporsi populasi.
Tujuan Pembelajaran VAR-6.F: Verifikasi kondisi untuk membuat inferensi statistik saat menguji proporsi populasi. [Keterampilan 4.C]
VAR-6.F.1 Agar dapat membuat inferensi statistik saat menguji proporsi populasi, kita harus memeriksa independensi dan bahwa distribusi sampling mendekati normal:
a. Untuk memeriksa kemandirian:
i. Data harus dikumpulkan menggunakan sampel acak atau eksperimen teracak.
ii. Ketika mengambil sampel tanpa pengembalian, periksa bahwa $n \leq 10\%N$.
b. Untuk memeriksa bahwa distribusi sampling dari $\hat{p}$ mendekati normal (bentuk):
i. Dengan asumsi bahwa $H_0$ benar $(p = p_0)$, verifikasi bahwa jumlah keberhasilan, $np_0$, dan jumlah kegagalan, $n(1-p_0)$ keduanya minimal 10 sehingga ukuran sampel cukup besar untuk mendukung asumsi normalitas.
Source: College Board AP Course and Exam Description · Sumber: Deskripsi Kursus dan Ujian College Board AP
English
A significance test 显著性检验 weighs evidence against a claim. State a null hypothesis 原假设$H_0$ and an alternative hypothesis 备择假设$H_a$ about the parameter $p$:
Check the same conditions (random, Large Counts using $p_0$, 10%). The test statistic 检验统计量 counts standard errors from $p_0$:
$$z=\frac{\hat p-p_0}{\sqrt{p_0(1-p_0)/n}}.$$
Worked example. A company claims $90\%$ satisfaction ($p_0=0.90$); a sample of $100$ finds $84$ satisfied ($\hat{p}=0.84$). Test $H_0:p=0.90$ vs $H_a:p\neq0.90$ at $\alpha=0.05$:
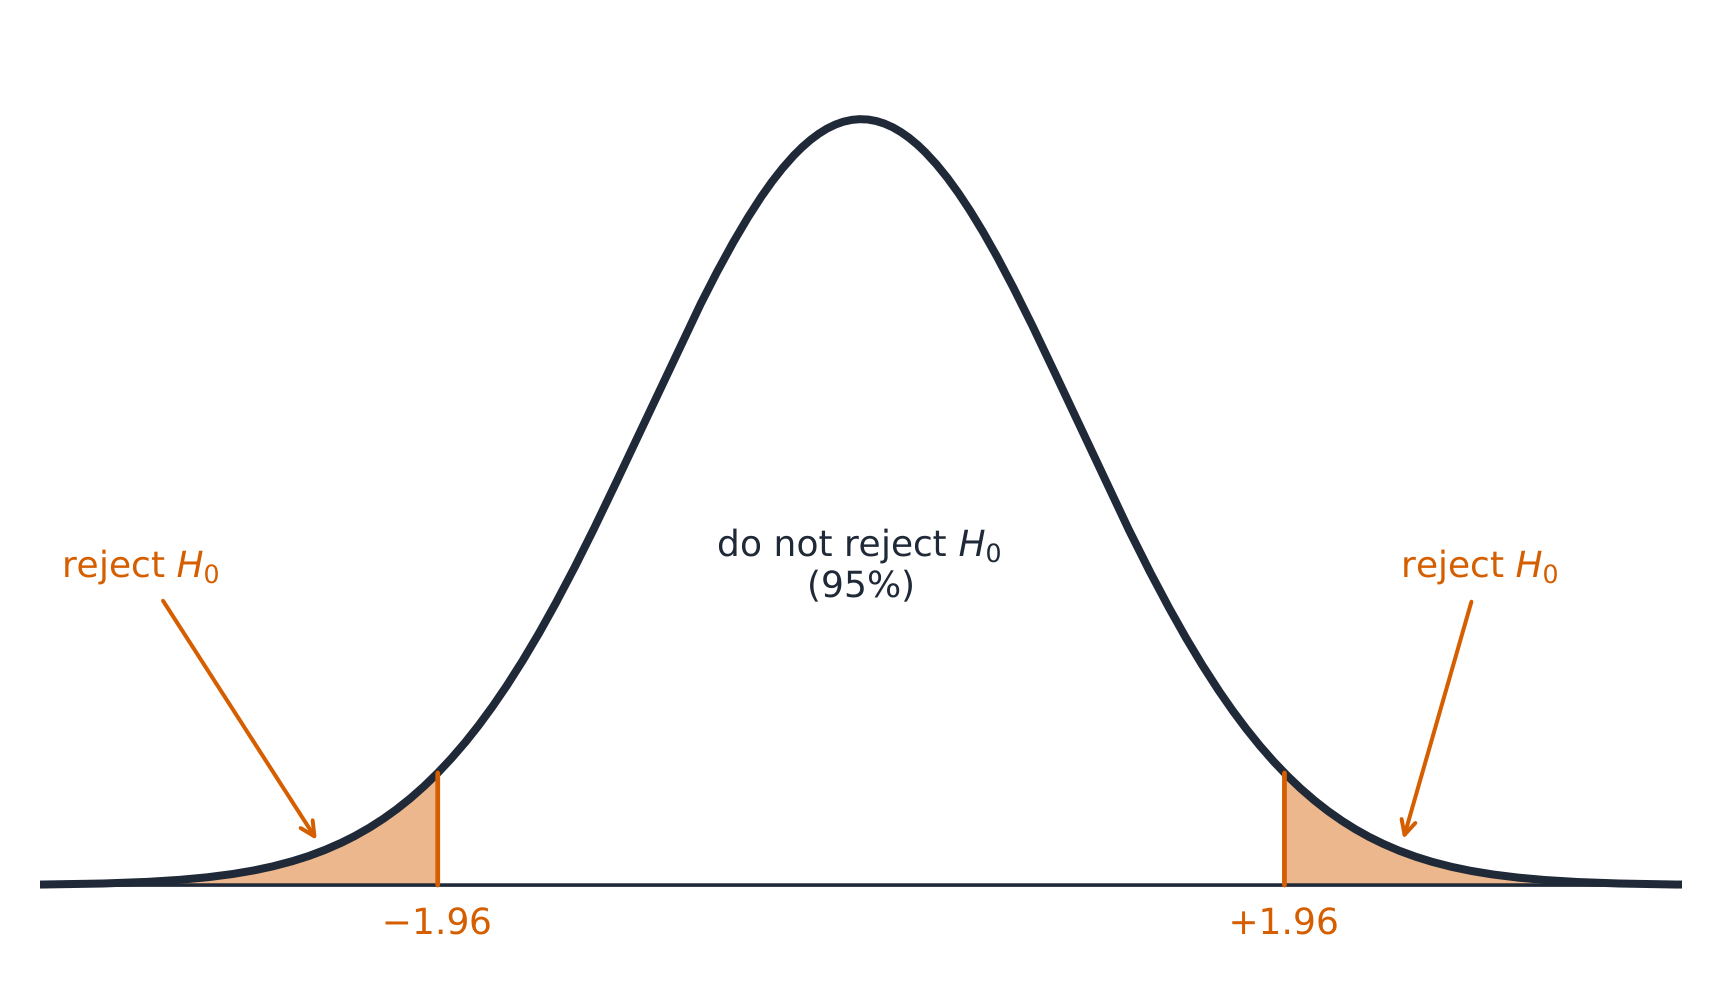
giving a two-tailed $p$-value of about $2(0.023)=0.046$. Since $0.046<0.05$, reject $H_0$ – there is evidence the true satisfaction rate differs from (is below) $90\%$.
Bahasa Indonesia
Uji signifikansi menimbang bukti melawan sebuah klaim. Nyatakan hipotesis nol$H_0$ dan hipotesis alternatif$H_a$ tentang parameter $p$:
Periksa kondisi yang sama (acak, Jumlah Besar menggunakan $p_0$, 10%). Statistik uji menghitung jumlah standar error dari $p_0$:
$$z=\frac{\hat p-p_0}{\sqrt{p_0(1-p_0)/n}}.$$
Contoh terpecahkan. Sebuah perusahaan mengklaim $90\%$ kepuasan ($p_0=0.90$); sampel dari $100$ menemukan $84$ puas ($\hat{p}=0.84$). Uji $H_0:p=0.90$ vs $H_a:p\neq0.90$ pada $\alpha=0.05$:
memberikan nilai-$p$ dua-sided sekitar $2(0.023)=0.046$. Karena $0.046<0.05$, tolak $H_0$ – ada bukti bahwa tingkat kepuasan sebenarnya berbeda dari (di bawah) $90\%$.
Uji dua-sided 5% menolak hipotesis nol di ekor yang diarsir
6.5
Interpreting p-Values · Menafsirkan Nilai-p
Syllabus · Silabus
English
Enduring Understanding (VAR-6): The normal distribution may be used to model variation.
Learning Objective VAR-6.G: Calculate an appropriate test statistic and $p$-value for a population proportion. [Skill 3.E]
VAR-6.G.1 The distribution of the test statistic assuming the null hypothesis is true (null distribution) can be either a randomization distribution or when a probability model is assumed to be true, a theoretical distribution ($z$).
VAR-6.G.2 When using a $z$-test, the standardized test statistic can be written: $\text{test statistic} = \dfrac{\text{sample statistic} - \text{null value of the parameter}}{\text{standard deviation of the statistic}}$. This is called a $z$-statistic for proportions.
VAR-6.G.3 The test statistic for a population proportion is: $z = \dfrac{\hat{p} - p_0}{\sqrt{\dfrac{p_0(1-p_0)}{n}}}$.
Clarifying statement: The formulas for test statistics do not appear explicitly on the AP Statistics Formula Sheet provided with the AP Statistics Exam. However, these formulas do not need to be memorized, as they can be constructed based on the general test statistic formula and the relevant standard error formulas that are provided on the formula sheet.
VAR-6.G.4 A $p$-value is the probability of obtaining a test statistic as extreme or more extreme than the observed test statistic when the null hypothesis and probability model are assumed to be true. The significance level may be given or determined by the researcher.
Enduring Understanding (DAT-3): Significance testing allows us to make decisions about hypotheses within a particular context.
Learning Objective DAT-3.A: Interpret the $p$-value of a significance test for a population proportion. [Skill 4.B]
DAT-3.A.1 The $p$-value is the proportion of values for the null distribution that are as extreme or more extreme than the observed value of the test statistic. This is:
a. The proportion at or above the observed value of the test statistic, if the alternative is >.
b. The proportion at or below the observed value of the test statistic, if the alternative is <.
c. The proportion less than or equal to the negative of the absolute value of the test statistic plus the proportion greater than or equal to the absolute value of the test statistic, if the alternative is ≠.
DAT-3.A.2 An interpretation of the $p$-value of a significance test for a one-sample proportion should recognize that the $p$-value is computed by assuming that the probability model and null hypothesis are true, i.e., by assuming that the true population proportion is equal to the particular value stated in the null hypothesis.
Bahasa Indonesia
Pemahaman Abadi (VAR-6): Distribusi normal dapat digunakan untuk memodelkan variasi.
Tujuan Pembelajaran VAR-6.G: Hitung statistik uji dan nilai $p$ yang sesuai untuk proporsi populasi. [Keterampilan 3.E]
VAR-6.G.1 Distribusi statistik uji dengan asumsi hipotesis nol benar (distribusi nol) dapat berupa distribusi randomisasi atau ketika model probabilitas diasumsikan benar, yaitu distribusi teoritis ($z$).
VAR-6.G.2 Saat menggunakan uji $z$, statistik uji terstandarisasi dapat ditulis: $\text{test statistic} = \dfrac{\text{sample statistic} - \text{null value of the parameter}}{\text{standard deviation of the statistic}}$. Ini disebut statistik $z$ untuk proporsi.
VAR-6.G.3 Statistik uji untuk proporsi populasi adalah: $z = \dfrac{\hat{p} - p_0}{\sqrt{\dfrac{p_0(1-p_0)}{n}}}$.
Pernyataan penjelas: Rumus untuk statistik uji tidak muncul secara eksplisit pada Lembar Rumus AP Statistics yang disertakan dengan Ujian AP Statistics. Namun, rumus-rumus ini tidak perlu dihafal, karena dapat disusun berdasarkan rumus statistik uji umum dan rumus kesalahan baku relevan yang disediakan di lembar rumus.
VAR-6.G.4 Nilai $p$ adalah probabilitas mendapatkan statistik uji yang sama ekstrem atau lebih ekstrem dari statistik uji yang diamati ketika hipotesis nol dan model probabilitas diasumsikan benar. Tingkat signifikansi dapat diberikan atau ditentukan oleh peneliti.
Pemahaman Berkelanjutan (DAT-3): Pengujian signifikansi memungkinkan kita membuat keputusan tentang hipotesis dalam konteks tertentu.
Tujuan Pembelajaran DAT-3.A: Interpretasikan nilai $p$ dari uji signifikansi untuk proporsi populasi. [Keterampilan 4.B]
DAT-3.A.1 Nilai $p$ adalah proporsi nilai untuk distribusi nol yang sama ekstrem atau lebih ekstrem dari nilai observasi statistik uji. Ini adalah:
a. Proporsi pada atau di atas nilai observasi statistik uji, jika alternatifnya >.
b. Proporsi pada atau di bawah nilai observasi statistik uji, jika alternatifnya <.
c. Proporsi kurang dari atau sama dengan negatif dari nilai mutlak statistik uji ditambah proporsi lebih dari atau sama dengan nilai mutlak statistik uji, jika alternatifnya ≠.
DAT-3.A.2 Interpretasi nilai $p$ dari uji signifikansi untuk proporsi satu sampel harus mengakui bahwa nilai $p$ dihitung dengan mengasumsikan bahwa model probabilitas dan hipotesis nol benar, yaitu dengan mengasumsikan bahwa proporsi populasi sebenarnya sama dengan nilai tertentu yang disebutkan dalam hipotesis nol.
Source: College Board AP Course and Exam Description · Sumber: Deskripsi Kursus dan Ujian College Board AP
English
What a p-value means
The $p$-value P值 is the probability of getting a sample result as extreme or more extreme than the observed one, assuming $H_0$ is true. A small $p$-value means the data would be surprising if $H_0$ held – evidence against $H_0$. It is not the probability that $H_0$ is true.
Bahasa Indonesia
Apa makna nilai-p
Nilai-$p$ P adalah probabilitas mendapatkan hasil sampel setidaknya se ekstrim atau lebih ekstrim dari yang diamati, dengan asumsi $H_0$ benar. Nilai-$p$ yang kecil berarti data akan mengejutkan jika $H_0$ berlaku – bukti melawan $H_0$. Ini bukan probabilitas bahwa $H_0$ benar.
Explore · Jelajahi
A p-value as a tail area · Nilai-p sebagai area ekor
A p-value is the probability, if the null hypothesis were true, of a result at least this extreme — the shaded tail area. Small p-values cast doubt on the null. · Nilai-p adalah probabilitas, jika hipotesis nol benar, mendapatkan hasil setidaknya seekstrem ini — area ekor yang diarsir. Nilai-p kecil memunculkan keraguan terhadap hipotesis nol.
6.6
Concluding a Test · Menyimpulkan sebuah Uji
Syllabus · Silabus
English
Enduring Understanding (DAT-3): Significance testing allows us to make decisions about hypotheses within a particular context.
Learning Objective DAT-3.B: Justify a claim about the population based on the results of a significance test for a population proportion. [Skill 4.E]
DAT-3.B.1 The significance level, $\alpha$, is the predetermined probability of rejecting the null hypothesis given that it is true.
DAT-3.B.2 A formal decision explicitly compares the $p$-value to the significance level, $\alpha$. If the $p$-value $\leq \alpha$, reject the null hypothesis. If the $p$-value $> \alpha$, fail to reject the null hypothesis.
DAT-3.B.3 Rejecting the null hypothesis means there is sufficient statistical evidence to support the alternative hypothesis. Failing to reject the null means there is insufficient statistical evidence to support the alternative hypothesis.
DAT-3.B.4 The conclusion about the alternative hypothesis must be stated in context.
DAT-3.B.5 A significance test can lead to rejecting or not rejecting the null hypothesis, but can never lead to concluding or proving that the null hypothesis is true. Lack of statistical evidence for the alternative hypothesis is not the same as evidence for the null hypothesis.
DAT-3.B.6 Small $p$-values indicate that the observed value of the test statistic would be unusual if the null hypothesis and probability model were true, and so provide evidence for the alternative. The lower the $p$-value, the more convincing the statistical evidence for the alternative hypothesis.
DAT-3.B.7$p$-values that are not small indicate that the observed value of the test statistic would not be unusual if the null hypothesis and probability model were true, so do not provide convincing statistical evidence for the alternative hypothesis nor do they provide evidence that the null hypothesis is true.
DAT-3.B.8 A formal decision explicitly compares the $p$-value to the significance $\alpha$. If the $p$-value $\leq \alpha$, then reject the null hypothesis, $H_0 : p = p_0$. If the $p$-value $> \alpha$, then fail to reject the null hypothesis.
DAT-3.B.9 The results of a significance test for a population proportion can serve as the statistical reasoning to support the answer to a research question about the population that was sampled.
Bahasa Indonesia
Pemahaman Berkelanjutan (DAT-3): Pengujian signifikansi memungkinkan kita membuat keputusan tentang hipotesis dalam konteks tertentu.
Tujuan Pembelajaran DAT-3.B: Justifikasi klaim tentang populasi berdasarkan hasil uji signifikansi untuk proporsi populasi. [Keterampilan 4.E]
DAT-3.B.1 Tingkat signifikansi, $\alpha$, adalah probabilitas pra-tetap untuk menolak hipotesis nol dengan syarat hipotesis tersebut benar.
DAT-3.B.2 Keputusan formal secara eksplisit membandingkan nilai $p$ ke tingkat signifikansi, $\alpha$. Jika nilai $p$$\leq \alpha$, tolak hipotesis nol. Jika nilai $p$$> \alpha$, gagal tolak hipotesis nol.
DAT-3.B.3 Menolak hipotesis nol berarti terdapat bukti statistik yang cukup untuk mendukung hipotesis alternatif. Gagal menolak hipotesis nol berarti terdapat bukti statistik yang tidak cukup untuk mendukung hipotesis alternatif.
DAT-3.B.4 Kesimpulan mengenai hipotesis alternatif harus dinyatakan dalam konteks.
DAT-3.B.5 Uji signifikansi dapat mengarah pada penolakan atau tidak menolaknya hipotesis nol, tetapi tidak pernah dapat mengarah pada kesimpulan atau pembuktian bahwa hipotesis nol benar. Kurangnya bukti statistik untuk hipotesis alternatif bukanlah sama dengan bukti untuk hipotesis nol.
DAT-3.B.6 Nilai $p$ yang kecil menunjukkan bahwa nilai statistik uji yang diamati akan menjadi tidak biasa jika hipotesis nol dan model probabilitas benar, sehingga memberikan bukti untuk hipotesis alternatif. Semakin rendah nilai $p$, semakin meyakinkan bukti statistik untuk hipotesis alternatif.
DAT-3.B.7 Nilai $p$ yang tidak kecil menunjukkan bahwa nilai statistik uji yang diamati tidak akan menjadi tidak biasa jika hipotesis nol dan model probabilitas benar, sehingga tidak memberikan bukti statistik yang meyakinkan untuk hipotesis alternatif juga tidak memberikan bukti bahwa hipotesis nol benar.
DAT-3.B.8 Keputusan formal secara eksplisit membandingkan nilai $p$ dengan tingkat signifikansi $\alpha$. Jika nilai $p$$\leq \alpha$, maka tolak hipotesis nol, $H_0 : p = p_0$. Jika nilai $p$$> \alpha$, maka gagal menolak hipotesis nol.
DAT-3.B.9 Hasil uji signifikansi untuk proporsi populasi dapat berfungsi sebagai dasar penalaran statistik untuk mendukung jawaban atas pertanyaan penelitian tentang populasi yang telah diambil sampelnya.
Source: College Board AP Course and Exam Description · Sumber: Deskripsi Kursus dan Ujian College Board AP
English
Compare the $p$-value to the significance level 显著性水平$\alpha$ (often $0.05$):
$p\le\alpha$: reject $H_0$ – there is convincing evidence for $H_a$.
$p>\alpha$: fail to reject $H_0$ – not enough evidence for $H_a$ (never "accept $H_0$").
Always write the conclusion in context, linking back to the claim.
Bahasa Indonesia
Bandingkan nilai-$p$ dengan tingkat signifikansi$\alpha$ (sering kali $0.05$):
$p\le\alpha$: tolak $H_0$ – ada bukti meyakinkan untuk $H_a$.
$p>\alpha$: gagal tolak $H_0$ – tidak cukup bukti untuk $H_a$ (jangan pernah "terima $H_0$").
Selalu tuliskan kesimpulan dalam konteks, mengaitkannya kembali ke klaim.
6.7
Type I and Type II Errors · Kesalahan Tipe I dan Tipe II
Syllabus · Silabus
Enduring Understanding
Learning Objective
Essential Knowledge
UNC-5
Probabilities of Type I and Type II errors influence inference.
UNC-5.A
Identify Type I and Type II errors. [Skill 1.B]
UNC-5.A.1 A Type I error occurs when the null hypothesis is true and is rejected (false positive).
UNC-5.A.2 A Type II error occurs when the null hypothesis is false and is not rejected (false negative).
Table of Errors: With Actual Population Value across the top ($H_0$ true; $H_a$ true) and Decision down the side (Reject $H_0$; Fail to Reject $H_0$): Reject $H_0$ when $H_0$ true = Type I Error; Reject $H_0$ when $H_a$ true = Correct Decision; Fail to Reject $H_0$ when $H_0$ true = Correct Decision; Fail to Reject $H_0$ when $H_a$ true = Type II Error.
UNC-5.B
Calculate the probability of a Type I and Type II errors. [Skill 3.A]
UNC-5.B.1 The significance level, $\alpha$, is the probability of making a Type I error, if the null hypothesis is true.
UNC-5.B.2 The power of a test is the probability that a test will correctly reject a false null hypothesis.
UNC-5.B.3 The probability of making a Type II error $= 1 - power$.
UNC-5.C
Identify factors that affect the probability of errors in significance testing. [Skill 4.A]
UNC-5.C.1 The probability of a Type II error decreases when any of the following occurs, provided the others do not change:
i. Sample size(s) increases.
ii. Significance level ($\alpha$) of a test increases.
iii. Standard error decreases.
iv. True parameter value is farther from the null.
UNC-5.D
Interpret Type I and Type II errors. [Skill 4.B]
UNC-5.D.1 Whether a Type I or a Type II error is more consequential depends upon the situation.
UNC-5.D.2 Since the significance level, $\alpha$, is the probability of a Type I error, the consequences of a Type I error influence decisions about a significance level.
Source: College Board AP Course and Exam Description · Sumber: Deskripsi Kursus dan Ujian College Board AP
English
Type I and Type II errors
A Type I error 第一类错误: rejecting a true$H_0$ (a false alarm). Its probability is $\alpha$.
A Type II error 第二类错误: failing to reject a false$H_0$ (a missed detection). Its probability is $\beta$.
The power 检验效能$=1-\beta$ is the chance of correctly detecting a real effect. Power rises with a larger sample, a larger effect, or a larger $\alpha$.
Describe each error and its consequence in the problem's context.
Bahasa Indonesia
Kesalahan Tipe I dan Tipe II
Kesalahan Tipe I: menolak $H_0$ yang benar (alarm palsu). Probabilitasnya adalah $\alpha$.
Kesalahan Tipe II: gagal menolak $H_0$ yang salah (deteksi yang terlewat). Probabilitasnya adalah $\beta$.
Daya uji$=1-\beta$ adalah peluang mendeteksi efek nyata dengan benar. Daya uji meningkat dengan sampel yang lebih besar, efek yang lebih besar, atau $\alpha$ yang lebih besar.
Jelaskan setiap kesalahan dan konsekuensinya dalam konteks masalah.
Explore · Jelajahi
Two ways a test can be wrong · Dua cara uji bisa salah
A Type I error rejects a true null (false alarm); a Type II error keeps a false null (a miss). Lowering one usually raises the other. · Kesalahan Tipe I menolak hipotesis nol yang benar (alarm palsu); kesalahan Tipe II mempertahankan hipotesis nol yang salah (kegagalan mendeteksi). Menurunkan satu biasanya meningkatkan yang lain.
6.8
Confidence Interval for a Difference of Proportions · Interval Kepercayaan untuk Selisih Proporsi
Syllabus · Silabus
English
Enduring Understanding (UNC-4): An interval of values should be used to estimate parameters, in order to account for uncertainty.
Learning Objective UNC-4.I: Identify an appropriate confidence interval procedure for a comparison of population proportions. [Skill 1.D]
UNC-4.I.1 The appropriate confidence interval procedure for a two-sample comparison of proportions for one categorical variable is a two-sample $z$-interval for a difference between population proportions.
Learning Objective UNC-4.J: Verify the conditions for calculating confidence intervals for a difference between population proportions. [Skill 4.C]
UNC-4.J.1 In order to calculate confidence intervals to estimate a difference between proportions, we must check for independence and that the sampling distribution is approximately normal:
a. To check for independence:
i. Data should be collected using two independent, random samples or a randomized experiment.
ii. When sampling without replacement, check that $n_1 \leq 10\%N_1$ and $n_2 \leq 10\%N_2$.
b. To check that sampling distribution of $\hat{p}_1 - \hat{p}_2$ is approximately normal (shape).
i. For categorical variables, check that $n_1\hat{p}_1$, $n_1(1-\hat{p}_1)$, $n_2\hat{p}_2$, and $n_2\left(1-\hat{p}_2\right)$ are all greater than or equal to some predetermined value, typically either 5 or 10.
Learning Objective UNC-4.K: Calculate an appropriate confidence interval for a comparison of population proportions. [Skill 3.D]
UNC-4.K.1 For a comparison of proportions, the interval estimate is $(\hat{p}_1 - \hat{p}_2) \pm z^* \sqrt{\dfrac{\hat{p}_1(1-\hat{p}_1)}{n_1} + \dfrac{\hat{p}_2(1-\hat{p}_2)}{n_2}}$.
Clarifying statement: Formulas for interval estimates do not appear explicitly on the AP Statistics Formula Sheet provided with the AP Statistics Exam. However, these formulas do not need to be memorized, as they can be constructed based on the general test statistic formula and the relevant standard error formulas that are provided on the formula sheet.
Learning Objective UNC-4.L: Calculate an interval estimate based on a confidence interval for a difference of proportions. [Skill 3.D]
UNC-4.L.1 Confidence intervals for a difference in proportions can be used to calculate interval estimates with specified units.
Bahasa Indonesia
Pemahaman Berkelanjutan (UNC-4): Interval nilai harus digunakan untuk memperkirakan parameter, guna mempertimbangkan ketidakpastian.
Tujuan Pembelajaran UNC-4.I: Identifikasi prosedur interval kepercayaan yang tepat untuk perbandingan proporsi populasi. [Keterampilan 1.D]
UNC-4.I.1 Prosedur interval kepercayaan yang tepat untuk perbandingan dua sampel proporsi untuk satu variabel kategorikal adalah interval $z$ dua-sampel untuk perbedaan antara proporsi populasi.
Tujuan Pembelajaran UNC-4.J: Verifikasi kondisi untuk menghitung interval kepercayaan untuk perbedaan antar proporsi populasi. [Keterampilan 4.C]
UNC-4.J.1 Untuk menghitung interval kepercayaan guna memperkirakan perbedaan antar proporsi, kita harus memeriksa independensi dan bahwa distribusi sampling mendekati normal:
a. Untuk memeriksa kemandirian:
i. Data harus dikumpulkan menggunakan dua sampel acak yang independen atau eksperimen acak.
ii. Saat pengambilan sampel tanpa pengembalian, periksa bahwa $n_1 \leq 10\%N_1$ dan $n_2 \leq 10\%N_2$.
b. Untuk memeriksa bahwa distribusi sampling dari $\hat{p}_1 - \hat{p}_2$ mendekati normal (bentuk).
i. Untuk variabel kategorikal, periksa bahwa $n_1\hat{p}_1$, $n_1(1-\hat{p}_1)$, $n_2\hat{p}_2$, dan $n_2\left(1-\hat{p}_2\right)$ semuanya lebih besar atau sama dengan nilai yang telah ditentukan sebelumnya, biasanyaeither 5 atau 10.
Tujuan Pembelajaran UNC-4.K: Hitung interval kepercayaan yang sesuai untuk perbandingan proporsi populasi. [Keterampilan 3.D]
UNC-4.K.1 Untuk perbandingan proporsi, estimasi interval adalah $(\hat{p}_1 - \hat{p}_2) \pm z^* \sqrt{\dfrac{\hat{p}_1(1-\hat{p}_1)}{n_1} + \dfrac{\hat{p}_2(1-\hat{p}_2)}{n_2}}$.
Pernyataan penjelas: Rumus untuk estimasi interval tidak muncul secara eksplisit pada Lembar Rumus AP Statistics yang disertakan dalam Ujian AP Statistics. Namun, rumus-rumus ini tidak perlu dihafal karena dapat disusun berdasarkan rumus statistik uji umum dan rumus standard error yang relevan yang disediakan pada lembar rumus.
Tujuan Pembelajaran UNC-4.L: Hitung estimasi interval berdasarkan interval kepercayaan untuk perbedaan proporsi. [Keterampilan 3.D]
UNC-4.L.1 Interval kepercayaan untuk perbedaan proporsi dapat digunakan untuk menghitung estimasi interval dengan satuan yang ditentukan.
Source: College Board AP Course and Exam Description · Sumber: Deskripsi Kursus dan Ujian College Board AP
Kondisi harus terpenuhi di kedua sampel, dan sampel harus independen.
6.9
Justifying a Claim About Two Proportions · Membenarkan Klaim tentang Dua Proporsi
Syllabus · Silabus
English
Enduring Understanding (UNC-4): An interval of values should be used to estimate parameters, in order to account for uncertainty.
Learning Objective UNC-4.M: Interpret a confidence interval for a difference of proportions. [Skill 4.B]
UNC-4.M.1 In repeated random sampling with the same sample size, approximately C% of confidence intervals created will capture the difference in population proportions.
UNC-4.M.2 Interpreting a confidence interval for difference between population proportions should include a reference to the sample taken and details about the population it represents.
Learning Objective UNC-4.N: Justify a claim based on a confidence interval for a difference of proportions. [Skill 4.D]
UNC-4.N.1 A confidence interval for difference in population proportions provides an interval of values that may provide sufficient evidence to support a particular claim in context.
Bahasa Indonesia
Pemahaman Berkelanjutan (UNC-4): Interval nilai harus digunakan untuk memperkirakan parameter, guna mempertimbangkan ketidakpastian.
Tujuan Pembelajaran UNC-4.M: Interpretasikan interval kepercayaan untuk perbedaan proporsi. [Keterampilan 4.B]
UNC-4.M.1 Dalam pengambilan sampel acak berulang dengan ukuran sampel yang sama, sekitar C% dari interval kepercayaan yang dibuat akan menangkap perbedaan proporsi populasi.
UNC-4.M.2 Menginterpretasikan interval kepercayaan untuk perbedaan antar proporsi populasi harus mencakup referensi terhadap sampel yang diambil dan detail mengenai populasi yang diwakilinya.
Tujuan Pembelajaran UNC-4.N: Benarkan sebuah klaim berdasarkan interval kepercayaan untuk perbedaan proporsi. [Keterampilan 4.D]
UNC-4.N.1 Interval kepercayaan untuk perbedaan proporsi populasi menyediakan rentang nilai yang mungkin memberikan bukti cukup untuk mendukung klaim tertentu dalam konteksnya.
Source: College Board AP Course and Exam Description · Sumber: Deskripsi Kursus dan Ujian College Board AP
English
If the interval for $p_1-p_2$ contains $0$, the data are consistent with no difference; if it lies entirely above or below $0$, there is evidence of a difference (in that direction). State the direction and context.
Bahasa Indonesia
Jika interval untuk $p_1-p_2$ berisi $0$, data konsisten dengan tidak ada perbedaan; jika berada sepenuhnya di atas atau di bawah $0$, ada bukti perbedaan (arah tersebut). Nyatakan arah dan konteksnya.
6.10
Setting Up a Test for a Difference · Menyiapkan Uji untuk Perbedaan
Syllabus · Silabus
English
Enduring Understanding (VAR-6): The normal distribution may be used to model variation.
Learning Objective VAR-6.H: Identify the null and alternative hypotheses for a difference of two population proportions. [Skill 1.F]
VAR-6.H.1 For a two-sample test for a difference of two proportions, the null hypothesis specifies a value of $0$ for the difference in population proportions, indicating no difference or effect.
VAR-6.H.2 The null hypothesis for a difference in proportions is: $H_0 : p_1 = p_2$, or $H_0 : p_1 - p_2 = 0$.
VAR-6.H.3 A one-sided alternative hypothesis for a difference in proportions is $H_a : p_1 < p_2$, or, $H_a : p_1 > p_2$. A two-sided alternative hypothesis for a difference of proportions is $H_a : p_1 \neq p_2$.
Learning Objective VAR-6.I: Identify an appropriate testing method for the difference of two population proportions. [Skill 1.E]
VAR-6.I.1 For a single categorical variable, the appropriate testing method for the difference of two population proportions is a two-sample $z$-test for a difference between two population proportions.
Learning Objective VAR-6.J: Verify the conditions for making statistical inferences when testing a difference of two population proportions. [Skill 4.C]
VAR-6.J.1 In order to make statistical inferences when testing a difference between population proportions, we must check for independence and that the sampling distribution is approximately normal:
a. To check for independence:
i. Data should be collected using two independent, random samples or a randomized experiment.
ii. When sampling without replacement, check that $n_1 \leq 10\%N_1$ and $n_2 \leq 10\%N_2$.
b. To check that the sampling distribution of $\hat{p}_1 - \hat{p}_2$ is approximately normal (shape):
i. For the combined sample, define the combined (or pooled) proportion, $\hat{p}_c = \dfrac{n_1\hat{p}_1 + n_2\hat{p}_2}{n_1 + n_2}$. Assuming that $H_0$ is true $(p_1 - p_2 = 0$ or $p_1 = p_2)$, check that $n_1\hat{p}_c$, $n_1\left(1-\hat{p}_c\right)$, $n_2\hat{p}_c$, and $n_2\left(1-\hat{p}_c\right)$ are all greater than or equal to some predetermined value, typically either 5 or 10.
Bahasa Indonesia
Pemahaman Abadi (VAR-6): Distribusi normal dapat digunakan untuk memodelkan variasi.
Tujuan Pembelajaran VAR-6.H: Identifikasi hipotesis nol dan alternatif untuk perbedaan dua proporsi populasi. [Keterampilan 1.F]
VAR-6.H.1 Untuk tes dua sampel atas perbedaan dua proporsi, hipotesis nol menentukan nilai $0$ untuk perbedaan proporsi populasi, yang menunjukkan tidak adanya perbedaan atau efek.
VAR-6.H.2 Hipotesis nol untuk perbedaan proporsi adalah: $H_0 : p_1 = p_2$, atau $H_0 : p_1 - p_2 = 0$.
VAR-6.H.3 Hipotesis alternatif satu arah untuk perbedaan proporsi adalah $H_a : p_1 < p_2$, atau, $H_a : p_1 > p_2$. Hipotesis alternatif dua arah untuk perbedaan proporsi adalah $H_a : p_1 \neq p_2$.
Tujuan Pembelajaran VAR-6.I: Identifikasi metode pengujian yang tepat untuk perbedaan dua proporsi populasi. [Keterampilan 1.E]
VAR-6.I.1 Untuk satu variabel kategorikal tunggal, metode pengujian yang tepat untuk perbedaan dua proporsi populasi adalah uji-t dua sampel $z$ untuk perbedaan antara dua proporsi populasi.
Tujuan Pembelajaran VAR-6.J: Verifikasi kondisi untuk melakukan inferensi statistik saat menguji perbedaan dua proporsi populasi. [Keterampilan 4.C]
VAR-6.J.1 Untuk melakukan inferensi statistik saat menguji perbedaan antara proporsi populasi, kita harus memeriksa kemandirian dan bahwa distribusi samplingnya mendekati normal:
a. Untuk memeriksa kemandirian:
i. Data harus dikumpulkan menggunakan dua sampel acak yang independen atau eksperimen acak.
ii. Saat pengambilan sampel tanpa pengembalian, periksa bahwa $n_1 \leq 10\%N_1$ dan $n_2 \leq 10\%N_2$.
b. Untuk memeriksa bahwa distribusi sampling dari $\hat{p}_1 - \hat{p}_2$ mendekati normal (bentuk):
i. Untuk sampel gabungan, tentukan proporsi gabungan (atau tercampur), $\hat{p}_c = \dfrac{n_1\hat{p}_1 + n_2\hat{p}_2}{n_1 + n_2}$. Asumsikan bahwa $H_0$ benar $(p_1 - p_2 = 0$ atau $p_1 = p_2)$, periksa bahwa $n_1\hat{p}_c$, $n_1\left(1-\hat{p}_c\right)$, $n_2\hat{p}_c$, dan $n_2\left(1-\hat{p}_c\right)$ semuanya lebih besar atau sama dengan nilai tertentu yang telah ditentukan sebelumnya, biasanya 5 atau 10.
Source: College Board AP Course and Exam Description · Sumber: Deskripsi Kursus dan Ujian College Board AP
English
Hypotheses compare the two proportions: $H_0: p_1=p_2$ versus $H_a: p_1\neq p_2$ (or $<,>$). Because $H_0$ says the proportions are equal, use a combined (pooled) 合并 sample proportion $\hat p_c=\dfrac{\text{total successes}}{\text{total sample size}}$ to estimate the common $p$.
Bahasa Indonesia
Hipotesis membandingkan dua proporsi: $H_0: p_1=p_2$ versus $H_a: p_1\neq p_2$ (atau $<,>$). Karena $H_0$ mengatakan proporsinya sama, gunakan proporsi sampel gabungan (pooled)$\hat p_c=\dfrac{\text{total successes}}{\text{total sample size}}$ untuk memperkirakan $p$ bersama.
6.11
Carrying Out a Test for a Difference · Melakukan Uji untuk Perbedaan
Syllabus · Silabus
English
Enduring Understanding (VAR-6): The normal distribution may be used to model variation.
Learning Objective VAR-6.K: Calculate an appropriate test statistic for the difference of two population proportions. [Skill 3.E]
VAR-6.K.1 The test statistic for a difference in proportions is: $z = \dfrac{(\hat{p}_1 - \hat{p}_2) - 0}{\sqrt{\hat{p}_c(1-\hat{p}_c)}\sqrt{\dfrac{1}{n_1} + \dfrac{1}{n_2}}}$, where $\hat{p}_c = \dfrac{n_1\hat{p}_1 + n_2\hat{p}_2}{n_1 + n_2}$.
Clarifying statement: The formulas for test statistics do not appear explicitly on the AP Statistics Formula Sheet provided with the AP Statistics Exam. However, these formulas do not need to be memorized, as they can be constructed based on the general test statistic formula and the standard error formulas for each of the relevant test statistics that are provided on the formula sheet.
Enduring Understanding (DAT-3): Significance testing allows us to make decisions about hypotheses within a particular context.
Learning Objective DAT-3.C: Interpret the $p$-value of a significance test for a difference of population proportions. [Skill 4.B]
DAT-3.C.1 An interpretation of the $p$-value of a significance test for a difference of two population proportions should recognize that the $p$-value is computed by assuming that the null hypothesis is true, i.e., by assuming that the true population proportions are equal to each other.
Learning Objective DAT-3.D: Justify a claim about the population based on the results of a significance test for a difference of population proportions. [Skill 4.E]
DAT-3.D.1 A formal decision explicitly compares the $p$-value to the significance $\alpha$. If the $p\text{-value} \leq \alpha$, then reject the null hypothesis, $H_0 : p_1 = p_2$, or $H_0 : p_1 - p_2 = 0$. If the $p$-value $> \alpha$, then fail to reject the null hypothesis.
DAT-3.D.2 The results of a significance test for a difference of two population proportions can serve as the statistical reasoning to support the answer to a research question about the two populations that were sampled.
Bahasa Indonesia
Pemahaman Abadi (VAR-6): Distribusi normal dapat digunakan untuk memodelkan variasi.
Tujuan Pembelajaran VAR-6.K: Hitung statistik uji yang sesuai untuk perbedaan dua proporsi populasi. [Keterampilan 3.E]
VAR-6.K.1 Statistik uji untuk perbedaan proporsi adalah: $z = \dfrac{(\hat{p}_1 - \hat{p}_2) - 0}{\sqrt{\hat{p}_c(1-\hat{p}_c)}\sqrt{\dfrac{1}{n_1} + \dfrac{1}{n_2}}}$, di mana $\hat{p}_c = \dfrac{n_1\hat{p}_1 + n_2\hat{p}_2}{n_1 + n_2}$.
Pernyataan penjelas: Rumus untuk statistik uji tidak muncul secara eksplisit pada Lembar Rumus AP Statistics yang disertakan dengan Ujian AP Statistics. Namun, rumus-rumus ini tidak perlu dihafal, karena dapat disusun berdasarkan formula statistik uji umum dan formula standar error untuk setiap statistik uji relevan yang disediakan pada lembar rumus.
Pemahaman Berkelanjutan (DAT-3): Pengujian signifikansi memungkinkan kita membuat keputusan tentang hipotesis dalam konteks tertentu.
Tujuan Pembelajaran DAT-3.C: Interpretasikan nilai $p$ dari pengujian signifikansi atas perbedaan proporsi populasi. [Keterampilan 4.B]
DAT-3.C.1 Interpretasi nilai $p$ dari pengujian signifikansi atas perbedaan dua proporsi populasi harus mengakui bahwa nilai $p$ dihitung dengan asumsi bahwa hipotesis nol benar, yaitu dengan asumsi bahwa proporsi populasi sebenarnya sama satu sama lain.
Tujuan Pembelajaran DAT-3.D: Justifikasi klaim tentang populasi berdasarkan hasil pengujian signifikansi atas perbedaan proporsi populasi. [Keterampilan 4.E]
DAT-3.D.1 Keputusan formal secara eksplisit membandingkan nilai $p$ dengan tingkat signifikansi $\alpha$. Jika $p\text{-value} \leq \alpha$, maka tolak hipotesis nol, $H_0 : p_1 = p_2$, atau $H_0 : p_1 - p_2 = 0$. Jika nilai $p$$> \alpha$, maka gagal menolak hipotesis nol.
DAT-3.D.2 Hasil pengujian signifikansi atas perbedaan dua proporsi populasi dapat berfungsi sebagai penalaran statistik untuk mendukung jawaban atas pertanyaan penelitian mengenai dua populasi yang diambil sampelnya.
Source: College Board AP Course and Exam Description · Sumber: Deskripsi Kursus dan Ujian College Board AP
Temukan nilai-$p$ dari model normal, bandingkan dengan $\alpha$, dan simpulkan dalam konteks – logika empat langkah yang sama seperti uji satu-proporsi.
6.11
Exam tips · Tips ujian
English
State the conditions (random, 10%, large counts $np,\,nq\ge10$) before any proportion inference.
A confidence interval = estimate $\pm$ margin of error; "95% confident" refers to the method's long-run capture rate.
For a test, write $H_0$ and $H_a$, compute the test statistic, find the p-value, and compare to $\alpha$.
A small p-value is evidence against$H_0$; failing to reject does not prove $H_0$.
Larger samples shrink the margin of error; a higher confidence level widens it.
Bahasa Indonesia
Nyatakan kondisi (acak, 10%, jumlah besar $np,\,nq\ge10$) sebelum inferensi proporsi apa pun.
Interval kepercayaan = estimasi $\pm$ margin of error; "percaya 95%" merujuk pada metode tingkat penangkapan jangka panjang.
Untuk uji, tulis $H_0$ dan $H_a$, hitung statistik uji, temukan nilai-p, dan bandingkan dengan $\alpha$.
Nilai-p kecil adalah bukti melawan$H_0$; gagal menolak tidak membuktikan$H_0$.
Sampel yang lebih besar menyempitkan margin of error; tingkat kepercayaan yang lebih tinggi melebarkannya.
Interactive lessons on this topic · Pelajaran interaktif untuk topik ini
Work through it step by step, with instant-check exercises. · Kerjakan langkah demi langkah, dengan latihan pengecekan instan.
Pick one and the site follows you — notes, papers, videos and practice all open on it. · Pilih satu dan situs mengikuti Anda — catatan, kertas, video, dan latihan semua terbuka di sana.
Type to search notes, lessons, code, vocabulary and past-paper questions across every subject. · Ketik untuk mencari catatan, pelajaran, kode, kosakata, dan pertanyaan soal lama di setiap mata pelajaran.