Skip to content · ⁨דלג לתוכן⁩

Inference for Categorical Data: Chi-Square · ⁨מסקנה עבור נתונים קטגוריאליים: קו-ריבוע (Chi-Square)⁩

AP Statistics · ⁨סטטיסטיקה - AP⁩ · Topic 8 · ⁨נושא 8⁩

Video lesson for this topic · ⁨שיעור וידאו לנושא זה⁩ Open the video page · ⁨פתח את עמוד הוידאו⁩
7:49

מסקנה עבור נתונים קטגוריאליים: קו-ריבוע (Chi-Square)

גלול קוביית משחק הוגנת שישים פעמים. כל צד אמור לצאת עשר פעמים. אבל זה לעולם לא קורה — שמונה כאן, שנים-עשר שם. הפער תמיד קיים. אז גלול עוד פעם…

English narration · English + 中文 subtitles burned in · ⁨קריאת קול באנגלית · תרגום אנגלי + סינית שרוף בתוך הסרטון⁩

8.1

Are My Results Unexpected? · ⁨האם התוצאות שלי אינן צפויות?⁩

Syllabus · ⁨סיילבוס⁩
English

Enduring Understanding (VAR-1): Given that variation may be random or not, conclusions are uncertain.

Learning Objective VAR-1.J: Identify questions suggested by variation between observed and expected counts in categorical data. [Skill 1.A]

  • VAR-1.J.1 Variation between what we find and what we expect to find may be random or not.
עברית

הבנה מתמשכת (VAR-1): בשל כך ששינוי עשוי להיות אקראי או לא, המסקנות הן לא וודאות.

מטרות למידה VAR-1.J: זיהוי שאלות הנובעות מהשונות בין ספירות נצפות וספירות מצופות בנתונים קטגוריאליים. [מיומנות 1.A]

  • VAR-1.J.1 השונות בין מה שאנו מוצאים לבין מה שאנו מצפים למצוא עשויה להיות מקרית או לא.
Source: College Board AP Course and Exam Description · ⁨מקור: תיאור הקורס והמבחן של College Board AP⁩

English

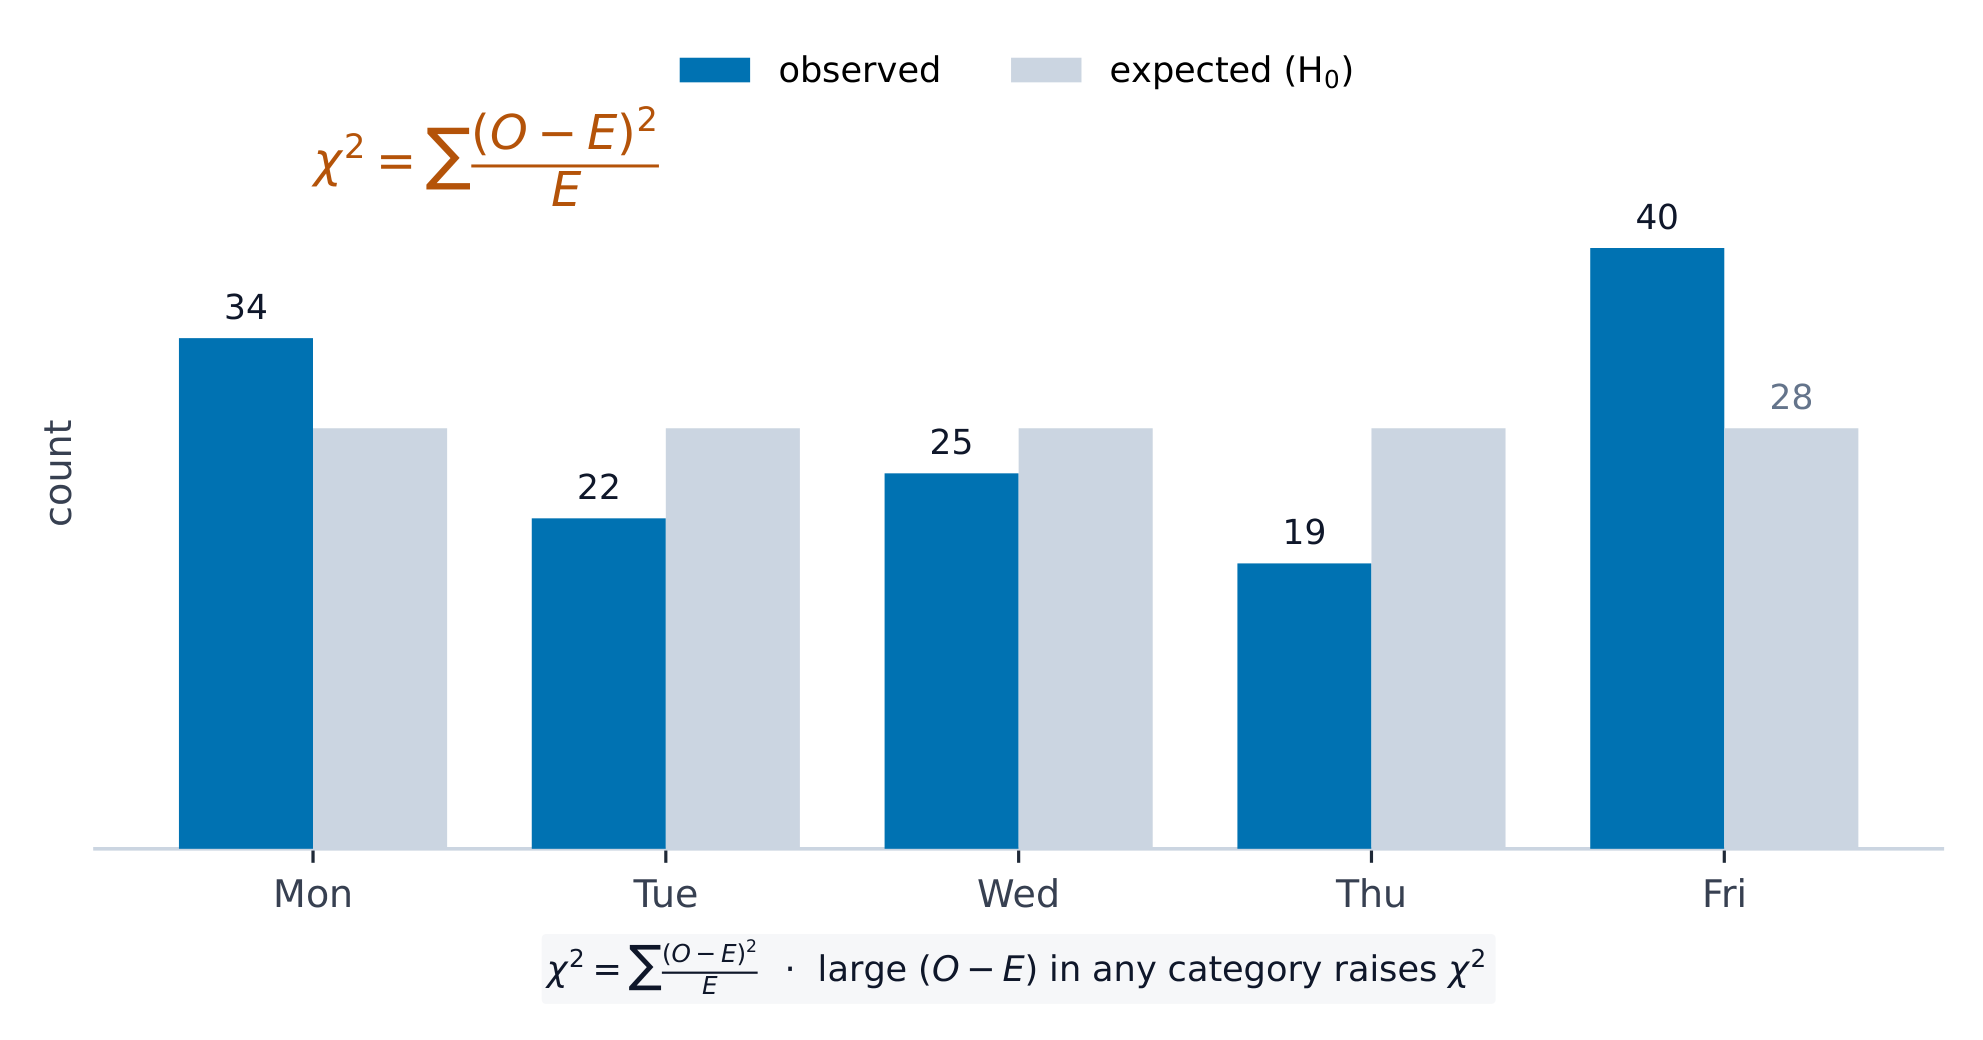
When data are counts spread across several categories, we test whether the observed counts differ from what a claim predicts. The tool is the chi-square 卡方 ($\chi^2$) statistic, which adds up the standardized gaps between observed and expected counts:

$$\chi^2=\sum \frac{(\text{observed}-\text{expected})^2}{\text{expected}}.$$
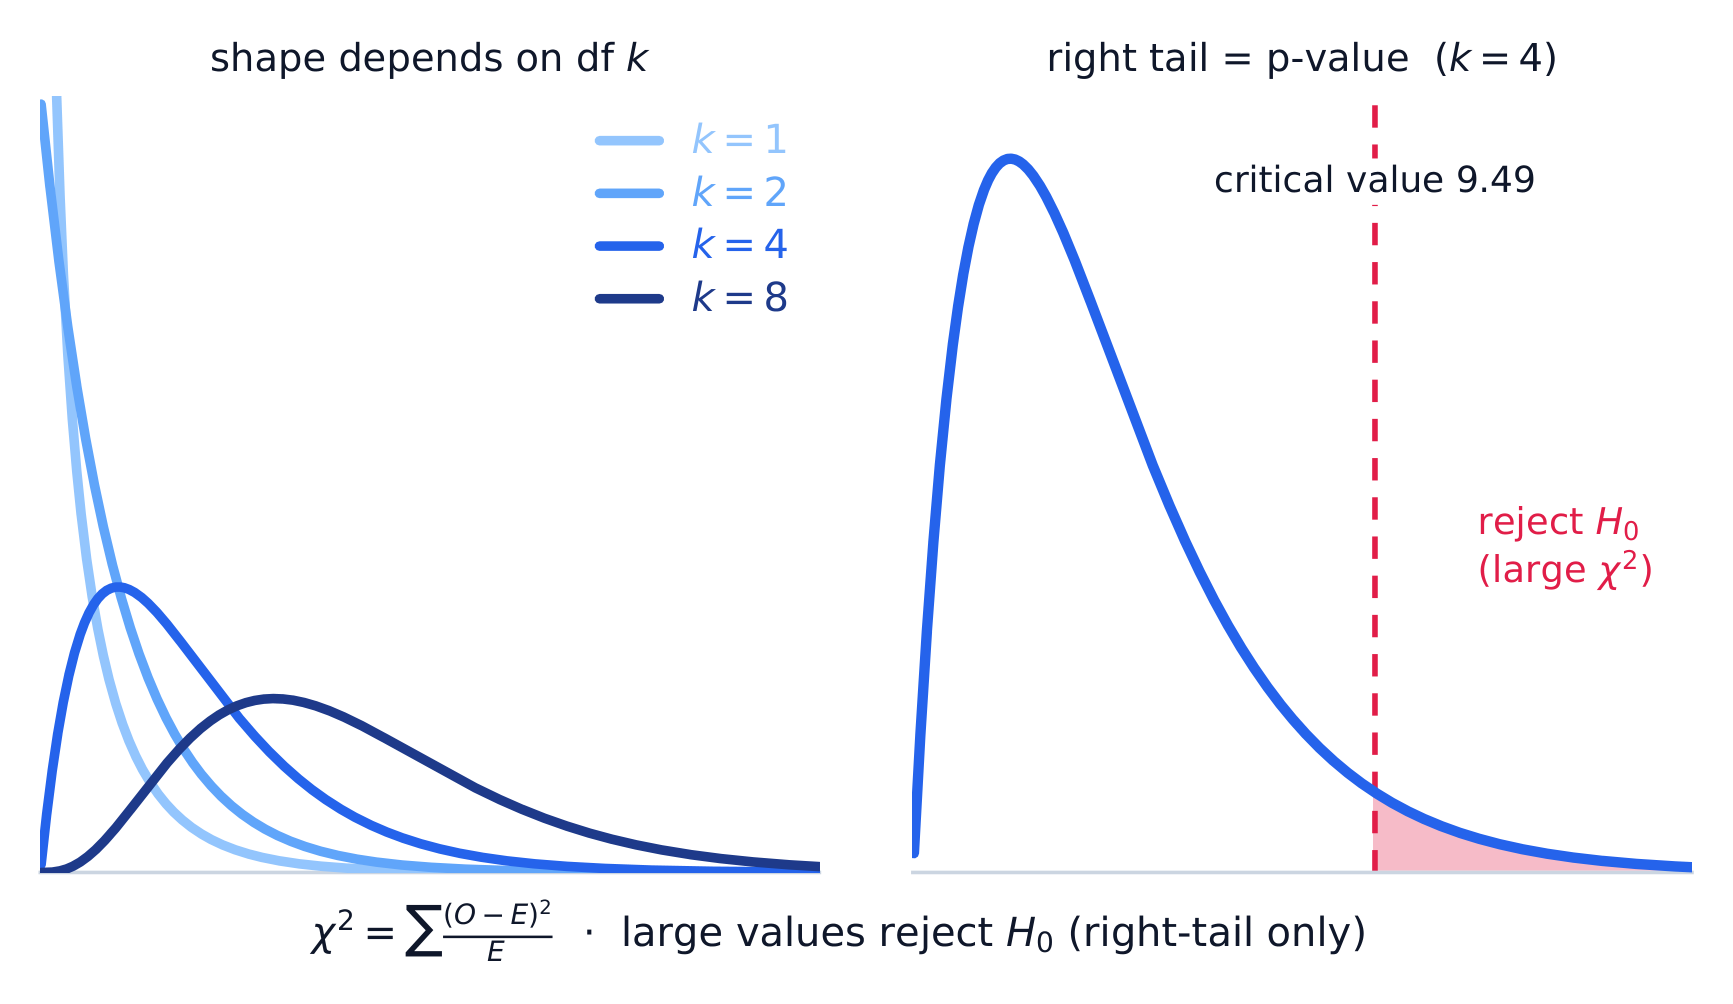
A large $\chi^2$ means the observed counts are far from expected – evidence against the claim. The chi-square distribution is right-skewed and depends on its degrees of freedom 自由度.

עברית

כאשר הנתונים הם ספירות המפורסות על פני מספר קטגוריות, אנו בודקים האם הספירות הנצפות שונות ממה שהטענה מנבאת. הכלי הוא סטטיסטיקת כיסוי ריבועי ($\chi^2$), שמסכמת את הפער הסטנדרטי בין ספירות נצפות למצופות:

$$\chi^2=\sum \frac{(\text{observed}-\text{expected})^2}{\text{expected}}.$$
ערך גדול של $\chi^2$ מעיד שהספירות הנצפות הרחקות ממצופות – עדות נגד הטענה. התפלגות כיסוי ריבועי היא שיפוע ימינה ותלויה ב-דרגות החופש שלה.

8.2

Setting Up a Goodness-of-Fit Test · ⁨הכנת בדיקת התאמה⁩

Syllabus · ⁨סיילבוס⁩
English

Enduring Understanding (VAR-8): The chi-square distribution may be used to model variation.

Learning Objective VAR-8.A: Describe chi-square distributions. [Skill 3.C]

  • VAR-8.A.1 Expected counts of categorical data are counts consistent with the null hypothesis. In general, an expected count is a sample size times a probability.

    The chi-square statistic measures the distance between observed and expected counts relative to expected counts.

    Chi-square distributions have positive values and are skewed right. Within a family of density curves, the skew becomes less pronounced with increasing degrees of freedom.

Learning Objective VAR-8.B: Identify the null and alternative hypotheses in a test for a distribution of proportions in a set of categorical data. [Skill 1.F]

  • VAR-8.B.1 For a chi-square goodness-of-fit test, the null hypothesis specifies null proportions for each category, and the alternative hypothesis is that at least one of these proportions is not as specified in the null hypothesis.

Learning Objective VAR-8.C: Identify an appropriate testing method for a distribution of proportions in a set of categorical data. [Skill 1.E]

  • VAR-8.C.1 When considering a distribution of proportions for one categorical variable, the appropriate test is the chi-square test for goodness of fit.

Learning Objective VAR-8.D: Calculate expected counts for the chi-square test for goodness of fit. [Skill 3.A]

  • VAR-8.D.1 Expected counts for a chi-square goodness-of-fit test are (sample size)(null proportion).

Learning Objective VAR-8.E: Verify the conditions for making statistical inferences when testing goodness of fit for a chi-square distribution. [Skill 4.C]

  • VAR-8.E.1 In order to make statistical inferences for a chi-square test for goodness of fit we must check the following:
    • a. To check for independence:
      • i. Data should be collected using a random sample or randomized experiment.
      • ii. When sampling without replacement, check that $n \leq 10\%N$.
    • b. The chi-square test for goodness of fit becomes more accurate with more observations, so large counts should be used (shape).
      • i. A conservative check for large counts is that all expected counts should be greater than 5.
עברית

הבנה מתמשכת (VAR-8): ניתן להשתמש בחלוקת קארטא-ריבוע כדי לדגם השונות.

מטרות למידה VAR-8.A: לתאר חלוקות קארטא-ריבוע. [מיומנות 3.C]

  • VAR-8.A.1 ספירות מצופות בנתונים קטגוריאליים הן ספירות תואמות להיפוטזה האפסית. באופן כללי, ספירה מצופה היא גודל הדגימה כפול הסברת הסתברות.

    סטטיסטיקת קארטא-ריבוע מודדת את המרחק בין ספירות נצפות לספירות מצופות ביחס לספירות המצופות.

    חלוקות קארטא-ריבוע נוטות לערכים חיוביים ומלוות בעיוות ימי. בתוך משפחת פונקציות הצפיפות, העיוות הופך לפחות בולט עם עליית דרגות החופש.

מטרות למידה VAR-8.B: לזהות את ההיפוטזה האפסית וההיפוטזה החלופית במבחן לחלוקת אחוזים בנתונים קטגוריאליים. [מיומנות 1.F]

  • VAR-8.B.1 עבור מבחן התאמה בקארטא-ריבוע, ההיפוטזה האפסית קובעת את אחוזי האפס לכל קטגוריה, וההיפוטזה החלופית היא שמינימום אחד מאחוזים אלו אינו כפי שנקבע בהיפוטזה האפסית.

מטרות למידה VAR-8.C: לזהות שיטת בדיקה מתאימה לחלוקת אחוזים בנתונים קטגוריאליים. [מיומנות 1.E]

  • VAR-8.C.1 בבחינת חלוקת אחוזים עבור משתנה קטגוריאלי אחד, המבחן המתאים הוא מבחן קארטא-ריבוע להתאמה.

מטרות למידה VAR-8.D: לחשב ספירות מצופות למבחן התאמה בקארטא-ריבוע. [מיומנות 3.A]

  • VAR-8.D.1 ספירות מצופות למבחן התאמה בקארטא-ריבוע הן (גודל הדגימה) × (אחוז האפס).

מטרות למידה VAR-8.E: לוודא את התנאים לבצע מסקנות סטטיסטיות בעת בדיקת התאמה לחלוקת קארטא-ריבוע. [מיומנות 4.C]

  • VAR-8.E.1 כדי לבצע מסקנות סטטיסטיות מבחינת בדיקת קוואי-ריבוע להתאמה, יש לוודא את הדברים הבאים:
    • א. לבדיקת עצמאות:
      • i. הנתונים צריכים להיות אסופים באמצעות דגימה אקראית או ניסוי מקורזל.
      • ii. כאשר דוגמה נלקחת ללא החזרה, בדוק כי $n \leq 10\%N$.
    • ב. בדיקת קוואי-ריבוע להתאמה נעשית מדויקת יותר ככל שיש יותר תצפיות, ולכן יש להשתמש בספירות גדולות (צורה).
      • i. בדיקה שמרנית לספירות גדולות היא שכל הספירות המצופות צריכות להיות גדולות מ-5.

Source: College Board AP Course and Exam Description · ⁨מקור: תיאור הקורס והמבחן של College Board AP⁩

English
The chi-square (χ²) test

A goodness-of-fit (GOF) 拟合优度 test checks whether one categorical variable follows a claimed distribution (e.g. "the die is fair"). Hypotheses:

$$H_0:\text{the distribution is as claimed}\qquad H_a:\text{at least one proportion differs}.$$
Expected count for each category $=n\times(\text{claimed proportion})$. Conditions: random sample, all expected counts $\ge 5$, and the 10% condition.

עברית
בדיקת כיסוי ריבועי (χ²)

בדיקת התאמה (GOF) בודקת האם משתנה קטגוריאלי אחד עוקב אחרי התפלגות טעונה (למשל "הקוביה הוגנת"). הנחות:

$$H_0:\text{the distribution is as claimed}\qquad H_a:\text{at least one proportion differs}.$$
הספירה הצפויה לכל קטגוריה $=n\times(\text{claimed proportion})$. תנאים: דגימה אקראית, כל הספירות הצפויות $\ge 5$, ותנאי ה-10%.

התפלגות כיסוי ריבועי ואזור דחיית הזנב הימני
התפלגות קי-ריבוע היא בעלת עיוות ימיני. ערך סטטיסטי גדול נופל בזנב הימני המוצל, מעבר לערך הקריטי – שם מדיחים את הדגם.
Vocabulary · ⁨מילון מונחים⁩ Train · ⁨אימון⁩
English עברית
chi-square/kaɪ skweə/ קרי-שור
degrees of freedom/dɪˈɡriːz ɒv ˈfriːdəm/ דרגות חופש
goodness-of-fit (GOF)/ˈɡʊdnəs ɒv fɪt/ התאמת תאורה (GOF)
Test for homogeneity/test fɔː ˈhɒməʊdʒneɪti/ מבחן הומוגניות
Test for independence/test fɔː ˌɪndɪˈpendəns/ מבחן עצמאות
8.3

Carrying Out a Goodness-of-Fit Test · ⁨ביצוע מבחן התאמה⁩

Syllabus · ⁨סיילבוס⁩
English

Enduring Understanding (VAR-8): The chi-square distribution may be used to model variation.

Learning Objective VAR-8.F: Calculate the appropriate statistic for the chi-square test for goodness of fit. [Skill 3.E]

  • VAR-8.F.1 The test statistic for the chi-square test for goodness of fit is
    • Equation: $\chi^2 = \sum \dfrac{(Observed\ count - Expected\ count)^2}{Expected\ count}$, with $degrees\ of\ freedom = number\ of\ categories - 1$.
  • VAR-8.F.2 The distribution of the test statistic assuming the null hypothesis is true (null distribution) can be either a randomization distribution or, when a probability model is assumed to be true, a theoretical distribution (chi-square).

Learning Objective VAR-8.G: Determine the $p$-value for chi-square test for goodness of fit significance test. [Skill 3.E]

  • VAR-8.G.1 The $p$-value for a chi-square test for goodness of fit for a number of degrees of freedom is found using the appropriate table or computer generated output.

Enduring Understanding (DAT-3): Significance testing allows us to make decisions about hypotheses within a particular context.

Learning Objective DAT-3.I: Interpret the $p$-value for the chi-square test for goodness of fit. [Skill 4.B]

  • DAT-3.I.1 An interpretation of the $p$-value for the chi-square test for goodness of fit is the probability, given the null hypothesis and probability model are true, of obtaining a test statistic as, or more, extreme than the observed value.

Learning Objective DAT-3.J: Justify a claim about the population based on the results of a chi-square test for goodness of fit. [Skill 4.E]

  • DAT-3.J.1 A decision to either reject or fail to reject the null hypothesis is based on comparison of the $p$-value to the significance level, $\alpha$.
  • DAT-3.J.2 The results of a chi-square test for goodness of fit can serve as the statistical reasoning to support the answer to a research question about the population that was sampled.
עברית

הבנה מתמשכת (VAR-8): ניתן להשתמש בחלוקת קארטא-ריבוע כדי לדגם השונות.

מטרות למידה VAR-8.F: לחשב את הסטטיסטיקה המתאימה לבדיקת קוואי-ריבוע להתאמה. [מיומנות 3.E]

  • VAR-8.F.1 הסטטיסטיקה לבדיקת קוואי-ריבוע להתאמה היא
    • משוואה: $\chi^2 = \sum \dfrac{(Observed\ count - Expected\ count)^2}{Expected\ count}$, עם $degrees\ of\ freedom = number\ of\ categories - 1$.
  • VAR-8.F.2 ההתפלגות של הסטטיסטיקה בתנאי שההנחה האפסית נכונה (התפלגות אפסית) יכולה להיות התפלגות הקלה או, כאשר מניחים מודל הסתברותי נכון, התפלגות תיאורטית (קוואי-ריבוע).

מטרות למידה VAR-8.G: לקבוע את ערך ה-$p$ לבדיקת משמעותיות של בדיקת קוואי-ריבוע להתאמה. [מיומנות 3.E]

  • VAR-8.G.1 ערך ה-$p$ לבדיקת קוואי-ריבוע להתאמה עבור מספר נתוני חופש נמצא באמצעות טבלה מתאימה או פלט מחשבנועי.

הבנה מתמשכת (DAT-3): בדיקת משמעות מאפשרת לנו לקבל החלטות לגבי הנחות בתוך הקשר נתון.

מטרות למידה DAT-3.I: לפרש את ערך ה-$p$ לבדיקת קוואי-ריבוע להתאמה. [מיומנות 4.B]

  • DAT-3.I.1 פרשנות לערך ה-$p$ לבדיקת קוואי-ריבוע להתאמה היא ההסתברות, בתנאי שההנחה האפסית ומודל ההסתברות נכונים, לקבל סטטיסטיקת בדיקה כזו או קיצונית יותר מזו הנצפתה.

מטרות למידה DAT-3.J: להציג טענה על האוכלוסייה על בסיס תוצאות בדיקת קוואי-ריבוע להתאמה. [מיומנות 4.E]

  • DAT-3.J.1 החלטה לדחות או לא לדחות את ההנחה האפסית מבוססת על השוואת ערך ה-$p$ לרמת המשמעותיות, $\alpha$.
  • DAT-3.J.2 תוצאות בדיקת קוואי-ריבוע להתאמה יכולות לשמש כנימוק סטטיסטי לתמיכה בתשובה לשאלת מחקר על האוכלוסייה שנדגמה.

Source: College Board AP Course and Exam Description · ⁨מקור: תיאור הקורס והמבחן של College Board AP⁩

English

Compute $\chi^2=\sum\dfrac{(O-E)^2}{E}$ with $df=(\text{number of categories})-1$. Find the $p$-value from the chi-square distribution (upper tail), compare to $\alpha$, and conclude in context. A large component of the sum points to the category that deviates most.

Worked example. A die rolled $60$ times gives counts $8,10,12,9,11,10$. If it is fair, each expected count is $60/6=10$, so

$$\chi^2=\frac{(8-10)^2}{10}+\frac{(10-10)^2}{10}+\frac{(12-10)^2}{10}+\frac{(9-10)^2}{10}+\frac{(11-10)^2}{10}+\frac{(10-10)^2}{10}=0.4+0+0.4+0.1+0.1+0=1.0,$$
with $df=6-1=5$. Write out every category, including the two that match their expected count exactly and so add $0$ – the sum runs over all six categories, and $df$ counts categories, not just the ones that differ. This $\chi^2$ is small (a large $p$-value), so we fail to reject $H_0$ – no evidence the die is unfair.

עברית

חשב $\chi^2=\sum\dfrac{(O-E)^2}{E}$ עם $df=(\text{number of categories})-1$. מצא את ערך ה$p$ מהתפלגות קי-ריבוע (זנב עליון), השווה ל$\alpha$ והסק תוצאה בהקשר. רכיב גדול בסכום מצביע על הקטגוריה הסוטה ביותר.

קי-ריבוע משווה ספירות נצפות עם אלו הצפויות תחת ההנחה האפסית

דוגמה פותרת. גרילה של קובייה $60$ פעמים נתנה ספירות $8,10,12,9,11,10$. אם היא הוגנת, כל ספירה צפויה היא $60/6=10$, ולכן

$$\chi^2=\frac{(8-10)^2}{10}+\frac{(10-10)^2}{10}+\frac{(12-10)^2}{10}+\frac{(9-10)^2}{10}+\frac{(11-10)^2}{10}+\frac{(10-10)^2}{10}=0.4+0+0.4+0.1+0.1+0=1.0,$$
עם $df=6-1=5$. כתוב כל קטגוריה, כולל שתי הקטגוריות שמתאימות בדיוק לספירה הצפויה שלהן ומוסיפות $0$ – הסכום מתבצע על כל שש הקטגוריות, ו$df$ סופר קטגוריות, לא רק אלו השונות. ערך זה $\chi^2$ קטן (ערך ⟨$p$⟩ גדול), ולכן איננו דוחים את $H_0$ – אין ראיה לכך שהקובייה אינה הוגנת.

Explore · ⁨חקור⁩

Explore the chi-square distribution and its p-value · ⁨חקירת חלוקת קארטא-ריבוע וערך ה-p שלה⁩

The p-value is the area in the right tail beyond your test statistic, so a larger $\chi^2$ means a smaller p-value. Drag $\chi^2$ to watch that area shrink, and drag df to see the whole family change shape — strongly right-skewed at small df, more symmetric as df grows. · ⁨ערך p הוא השטח בזנב הימני מעבר לסטטיסטיקת הבדיקה שלך, ולכן $\chi^2$ גדול יותר משמעותו ערך p קטן יותר. גרור $\chi^2$ כדי לצפות בשטח זה צמצם, וגרור את df כדי לראות את כל המשפחה משנה צורה – שיפוע ימני חזק במספר דרגות חופש קטנים, יותר סימטריכית ככל ש-df גדל.⁩

8.4

Expected Counts in Two-Way Tables · ⁨ספירות צפויות בטבלאות דו-כיווניות⁩

Syllabus · ⁨סיילבוס⁩
English

Enduring Understanding (VAR-8): The chi-square distribution may be used to model variation.

Learning Objective VAR-8.H: Calculate expected counts for two-way tables of categorical data. [Skill 3.A]

  • VAR-8.H.1 The expected count in a particular cell of a two-way table of categorical data can be calculated using the formula:
    • Equation: $expected\ count = \dfrac{(row\ total)(column\ total)}{table\ total}$.
עברית

הבנה מתמשכת (VAR-8): ניתן להשתמש בחלוקת קארטא-ריבוע כדי לדגם השונות.

מטרות למידה VAR-8.H: לחשב ספירות מצופות בטבלאות דו-כיווניות של נתונים קטגוריאליים. [מיומנות 3.A]

  • VAR-8.H.1 הספירה המצופה בתא מסוים בטבלה דו-כיוונית של נתונים קטגוריאליים ניתן לחשב באמצעות הנוסחה:
    • משוואה: $expected\ count = \dfrac{(row\ total)(column\ total)}{table\ total}$.

Source: College Board AP Course and Exam Description · ⁨מקור: תיאור הקורס והמבחן של College Board AP⁩

English

For a two-way table, the expected count in a cell (under "no association") is

$$E=\frac{(\text{row total})\times(\text{column total})}{\text{grand total}}.$$
This is the count you would see if the row and column variables were unrelated.

Worked example. In a two-way table a cell's row total is $40$, its column total is $50$, and the grand total is $200$. Its expected count is $E=\dfrac{40\times50}{200}=10$. Repeating for every cell gives the expected table to compare against the observed one.

עברית

עבור טבלה דו-כיוונית, הספירה הצפויה בתא (תחת "ללא קשר") היא

$$E=\frac{(\text{row total})\times(\text{column total})}{\text{grand total}}.$$
זו הספירה שתצפה לה אם משתני השורה ועמודה היו בלתי קשורים.

דוגמה פותרת. בטבלה דו-כיוונית, סכום השורה של תא הוא $40$, סכום העמודה שלו הוא $50$, והסכום הכללי הוא $200$. הספירה הצפויה שלו היא $E=\dfrac{40\times50}{200}=10$. חזרה על כך לכל תא נותנת את הטבלה הצפויה להשוואה לנטולה.

טבלת מחשוב מארגנת ספירות קטגוריות לפני מבחן קי-ריבוע
8.5

Homogeneity or Independence? · ⁨הומוגניות או עצמאות?⁩

Syllabus · ⁨סיילבוס⁩
English

Enduring Understanding (VAR-8): The chi-square distribution may be used to model variation.

Learning Objective VAR-8.I: Identify the null and alternative hypotheses for a chi-square test for homogeneity or independence. [Skill 1.F]

  • VAR-8.I.1 The appropriate hypotheses for a chi-square test for homogeneity are:

    $H_0$: There is no difference in distributions of a categorical variable across populations or treatments.

    $H_a$: There is a difference in distributions of a categorical variable across populations or treatments.

  • VAR-8.I.2 The appropriate hypotheses for a chi-square test for independence are:

    $H_0$: There is no association between two categorical variables in a given population or the two categorical variables are independent.

    $H_a$: Two categorical variables in a population are associated or dependent.

Learning Objective VAR-8.J: Identify an appropriate testing method for comparing distributions in two-way tables of categorical data. [Skill 1.E]

  • VAR-8.J.1 When comparing distributions to determine whether proportions in each category for categorical data collected from different populations are the same, the appropriate test is the chi-square test for homogeneity.
  • VAR-8.J.2 To determine whether row and column variables in a two-way table of categorical data might be associated in the population from which the data were sampled, the appropriate test is the chi-square test for independence.

Learning Objective VAR-8.K: Verify the conditions for making statistical inferences when testing a chi-square distribution for independence or homogeneity. [Skill 4.C]

  • VAR-8.K.1 In order to make statistical inferences for a chi-square test for two-way tables (homogeneity or independence), we must verify the following:
    • a. To check for independence:
      • i. For a test for independence: Data should be collected using a simple random sample.
      • ii. For a test for homogeneity: Data should be collected using a stratified random sample or randomized experiment.
      • iii. When sampling without replacement, check that $n \leq 10\%N$.
    • b. The chi-square tests for independence and homogeneity become more accurate with more observations, so large counts should be used (shape).
      • i. A conservative check for large counts is that all expected counts should be greater than 5.
עברית

הבנה מתמשכת (VAR-8): ניתן להשתמש בחלוקת קארטא-ריבוע כדי לדגם השונות.

מטרת הלמידה VAR-8.I: זיהוי ההנחות הרווחת והחלופית לבדיקת קוואי-ריבוע לאחדות או לשיפוטיות. [מיומנות 1.F]

  • VAR-8.I.1 ההנחות המתאימות לבדיקת קוואי-ריבוע לאחדות הן:

    $H_0$: אין הבדל בחלוקות של משתנה קטגוריאלי בין אוכלוסיות או טיפולים שונים.

    $H_a$: קיים הבדל בחלוקות של משתנה קטגוריאלי בין אוכלוסיות או טיפולים שונים.

  • VAR-8.I.2 ההנחות המתאימות לבדיקת קוואי-ריבוע לשיפוטיות הן:

    $H_0$: אין קשר בין שני משתנים קטגוריאליים באוכלוסייה נתונה, או שהשניים משתנים הקטגוריאליים הם בלתי תלויים זה בזו.

    $H_a$: שני משתנים קטגוריאליים באוכלוסייה קשורים זה בזו או תלויים זה בזו.

מטרת הלמידה VAR-8.J: זיהוי שיטת בדיקה מתאימה להשוואת חלוקות בטבלאות דו-כיווניות של נתונים קטגוריאליים. [מיומנות 1.E]

  • VAR-8.J.1 בהשוואת חלוקות כדי לקבוע האם הממוצעים בקטגוריה מסוימת לנתונים קטגוריאליים שנאספו מאוכלוסיות שונות זהים, הבדיקה המתאימה היא בדיקת קוואי-ריבוע לאחדות.
  • VAR-8.J.2 כדי לקבוע האם משתני השורה ועמודה בטבלה דו-כיוונית של נתונים קטגוריאליים עשויים להיות קשורים באוכלוסייה שממנה נדגמו הנתונים, הבדיקה המתאימה היא בדיקת קוואי-ריבוע לשיפוטיות.

מטרת הלמידה VAR-8.K: וידוא התנאים לחישוב מסקנות סטטיסטיות בעת ביצוע בדיקת חלוקת קוואי-ריבוע לשיפוטיות או לאחדות. [מיומנות 4.C]

  • VAR-8.K.1 כדי לבצע חישוב מסקנות סטטיסטיות לבדיקת קוואי-ריבוע בטבלאות דו-כיווניות (אחדות או שיפוטיות), עלינו לוודא את הדברים הבאים:
    • א. לבדיקת עצמאות:
      • i. עבור בדיקה לשיפוטיות: הנתונים צריכים להתאסף באמצעות דגימה אקראית פשוטה.
      • ii. עבור בדיקה לאחדות: הנתונים צריכים להתאסף באמצעות דגימה אקראית מחולקת או ניסוי מקרי.
      • iii. כאשר הדגימה מבוצעת ללא החזרה, יש לוודא כי $n \leq 10\%N$.
    • ב. בדיקות הקוואי-ריבוע לשיפוטיות ולאחדות הופכות מדויקות יותר ככל שישנם יותר תצפיות, ולכן יש להשתמש בספירות גדולות (צורה).
      • i. בדיקה שמרנית לספירות גדולות היא שכל הספירות המצופות צריכות להיות גדולות מ-5.

Source: College Board AP Course and Exam Description · ⁨מקור: תיאור הקורס והמבחן של College Board AP⁩

English

Two tests use the same $\chi^2$ math but answer different questions:

  • Test for homogeneity 同质性: are the distributions of one categorical variable the same across several populations or groups (separate samples/treatments)?
  • Test for independence 独立性: are two categorical variables associated within a single population (one sample, two variables measured)?

The design (several samples vs one sample) decides which name and hypotheses to use.

עברית

שני מבחנים משתמשים באותה $\chi^2$ מתמטית אך עונים לשאלות שונות:

  • מבחן הומוגניות: האם ההתפלגויות של משתנה קטגוריאלי אחד הן זהות בין מספר אוכלוסיות או קבוצות (דגימות/טיפולים נפרדים)?
  • מבחן עצמאות: האם שני משתנים קטגוריאליים קשורים בתוך אוכלוסייה אחת (דגימה אחת, שני משתנים שנמדדו)?

העיצוב (דגימות מרובות מול דגימה אחת) קובע איזה שם והנחות לשימוש.

8.6

Carrying Out a Test for Homogeneity or Independence · ⁨ביצוע מבחן הומוגניות או עצמאות⁩

Syllabus · ⁨סיילבוס⁩
English

Enduring Understanding (VAR-8): The chi-square distribution may be used to model variation.

Learning Objective VAR-8.L: Calculate the appropriate statistic for a chi-square test for homogeneity or independence. [Skill 3.E]

  • VAR-8.L.1 The appropriate test statistic for a chi-square test for homogeneity or independence is the chi-square statistic:
    • Equation: $\chi^2 = \sum \dfrac{(Observed\ count - Expected\ count)^2}{Expected\ count}$, with degrees of freedom equal to: $(number\ of\ rows - 1)(number\ of\ columns - 1)$.

Learning Objective VAR-8.M: Determine the $p$-value for a chi-square significance test for independence or homogeneity. [Skill 3.E]

  • VAR-8.M.1 The $p$-value for a chi-square test for independence or homogeneity for a number of degrees of freedom is found using the appropriate table or technology.
  • VAR-8.M.2 For a test of independence or homogeneity for a two-way table, the $p$-value is the proportion of values in a chi-square distribution with appropriate degrees of freedom that are equal to or larger than the test statistic.

Enduring Understanding (DAT-3): Significance testing allows us to make decisions about hypotheses within a particular context.

Learning Objective DAT-3.K: Interpret the $p$-value for the chi-square test for homogeneity or independence. [Skill 4.B]

  • DAT-3.K.1 An interpretation of the $p$-value for the chi-square test for homogeneity or independence is the probability, given the null hypothesis and probability model are true, of obtaining a test statistic as, or more, extreme than the observed value.

Learning Objective DAT-3.L: Justify a claim about the population based on the results of a chi-square test for homogeneity or independence. [Skill 4.E]

  • DAT-3.L.1 A decision to either reject or fail to reject the null hypothesis for a chi-square test for homogeneity or independence is based on comparison of the $p$-value to the significance level, $\alpha$.
  • DAT-3.L.2 The results of a chi-square test for homogeneity or independence can serve as the statistical reasoning to support the answer to a research question about the population that was sampled (independence) or the populations that were sampled (homogeneity).
עברית

הבנה מתמשכת (VAR-8): ניתן להשתמש בחלוקת קארטא-ריבוע כדי לדגם השונות.

מטרת הלמידה VAR-8.L: חישוב הסטטיסטיקה המתאימה לבדיקת קוואי-ריבוע לאחדות או לשיפוטיות. [מיומנות 3.E]

  • VAR-8.L.1 הסטטיסטיקה המתאימה לבדיקת קוואי-ריבוע לאחדות או לשיפוטיות היא סטטיסטיקת קוואי-ריבוע:
    • משוואה: $\chi^2 = \sum \dfrac{(Observed\ count - Expected\ count)^2}{Expected\ count}$, עם דרגות חירות שוות ל: $(number\ of\ rows - 1)(number\ of\ columns - 1)$.

מטרת למידה VAR-8.M: קביעת ערך $p$ לבדיקת משמעותיות של קרי-רבעונית לחיפוי או הומוגניות. [מיומנות 3.E]

  • VAR-8.M.1 ערך $p$ לבדיקת קרי-רבעונית לחיפוי או הומוגניות עבור מספר דרגות חופש נמצא באמצעות הטבלה המתאימה או תוכנת מחשב.
  • VAR-8.M.2 עבור בדיקה של חיפוי או הומוגניות בטבלה דו-מימדית, ערך $p$ הוא החלק היחסי של הערכים בהתפלגות קרי-רבעונית עם דרגות חופש מתאימות שהן שוות או גדולות מהסטטיסטיקה הנבדקת.

הבנה מתמשכת (DAT-3): בדיקת משמעות מאפשרת לנו לקבל החלטות לגבי הנחות בתוך הקשר נתון.

מטרת למידה DAT-3.K: פרשנות ערך $p$ לבדיקת קרי-רבעונית להומוגניות או לחיפוי. [מיומנות 4.B]

  • DAT-3.K.1 פרשנות ערך $p$ לבדיקת קרי-רבעונית להומוגניות או לחיפוי היא ההסתברות, בתנאי שההנחה האפסית ומודל ההסתברות הם נכונים, לקבל סטטיסטיקה נבדקת כזו או אף קיצונית יותר מהערך הנצפה.

מטרת למידה DAT-3.L: נימוק טענה לגבי האוכלוסייה על בסיס תוצאות בדיקת קרי-רבעונית להומוגניות או לחיפוי. [מיומנות 4.E]

  • DAT-3.L.1 החלטת סירוב או אי-סירוב בהנחה האפסית לבדיקת קרי-רבעונית להומוגניות או לחיפוי מבוססת על השוואת ערך $p$ לרמת המשמעות, $\alpha$.
  • DAT-3.L.2 תוצאות בדיקת קרי-רבעונית להומוגניות או לחיפוי יכולות לשמש כנימוק סטטיסטי לתמיכה בתשובה לשאלת מחקר לגבי האוכלוסייה שנדגמה (חיפוי) או האוכלוסיות שנדגמו (הומוגניות).

Source: College Board AP Course and Exam Description · ⁨מקור: תיאור הקורס והמבחן של College Board AP⁩

English

Compute expected counts, then $\chi^2=\sum\dfrac{(O-E)^2}{E}$ over all cells, with

$$df=(\text{rows}-1)(\text{columns}-1).$$
Conditions: random data, all expected counts $\ge 5$, 10% condition. Find the $p$-value, compare to $\alpha$, and conclude in context – evidence of a difference between groups (homogeneity) or of an association (independence).

עברית

חשב ספירות צפויות, ואז $\chi^2=\sum\dfrac{(O-E)^2}{E}$ על כל התאים, עם

$$df=(\text{rows}-1)(\text{columns}-1).$$
תנאים: נתונים אקראיים, כל הספירות המצופיות $\ge 5$, תנאי 10%. מצאו את ערך $p$, השוו אותו ל$\alpha$, והסיקו בהקשר – עדות להבדל בין קבוצות (הומוגניות) או לקשר (עצמאות).

8.7

Choosing the Right Categorical Procedure · ⁨בחירת הליך הקטגורי הנכון⁩

Syllabus · ⁨סיילבוס⁩
English

This topic is intended to focus on the skill of selecting an appropriate inference procedure now that students have a range of options. Students should be given opportunities to practice when and how to apply all learning objectives relating to inference for categorical data.

עברית

נושא זה נועד להתמקד במיומנות בחירת הליך אינפראנס מתאים, לאחר שהתלמידים רכשו מגוון אפשרויות. יש לספק לתלמידים הזדמנויות לתרגול מתי וכיצד ליישם את כל מטרות הלמידה הקשורות לאינפראנס לנתונים קטגוריאליים.

Source: College Board AP Course and Exam Description · ⁨מקור: תיאור הקורס והמבחן של College Board AP⁩

English

Decide by the setup: one categorical variable against a claimed distribution $\Rightarrow$ goodness-of-fit; one sample cross-classified by two variables $\Rightarrow$ independence; several samples/groups compared $\Rightarrow$ homogeneity. Comparing just two proportions can use either a two-proportion $z$-test or a chi-square test, but only for a two-tailed alternative, where they agree exactly ($\chi^2=z^2$). A chi-square test is always two-tailed, so it cannot give a directional conclusion: if $H_a$ is one-tailed (say $p_1>p_2$), use the $z$-test.

עברית

החלטו לפי העיצוב: משתנה קטגורי אחד מול חלוקה טעונה $\Rightarrow$ התאמה-טובה; מדגם אחד הממויין בצלב על ידי שני משתנים $\Rightarrow$ עצמאות; מספר מדגמים/קבוצות המשווים $\Rightarrow$ הומוגניות. השוואה של שתי פרופורציות יכולה להשתמש במבחן שתי פרופורציות $z$ או במבחן קרי-ריבוע, אך רק עבור חלופה דו-צדדית, שבה הם תואמים בדיוק ($\chi^2=z^2$). מבחן קרי-ריבוע הוא תמיד דו-צדדי, ולכן לא יכול לתת מסקנה כיוונית: אם $H_a$ חד-צדדי (למשל $p_1>p_2$), השתמשו במבחן $z$.

Explore · ⁨חקור⁩

Which chi-square test is this? · ⁨איזה מבחן קארטא-ריבוע זה?⁩

All three tests use the same $\chi^2$ arithmetic, so the marks are won by naming the right one. The design decides — how many samples were taken, and how many variables were measured on each unit. · ⁨לשלושת המבחנים משתמשים באותו $\chi^2$ חישוב, ולכן הניקוד נגבה על ידי זיהוי הנכון. העיצוב הוא הקובע — כמה דגימות נלקחו, וכמה משתנים נמדדו על כל יחידה.⁩

8.7

Exam tips · ⁨טיפים לבחינות⁩

English
  • Use $\chi^2=\sum\tfrac{(O-E)^2}{E}$ for categorical data; always divide by the expected count.
  • Pick the right test: goodness-of-fit (one variable), independence, or homogeneity (two-way table).
  • Compute expected counts as $\tfrac{\text{row total}\times\text{column total}}{\text{grand total}}$ and check each is $\ge5$.
  • A large $\chi^2$ (small p-value) means observed counts differ from expected by more than chance.
  • State degrees of freedom correctly (categories $-1$, or $(r-1)(c-1)$).
עברית
  • השתמשו ב$\chi^2=\sum\tfrac{(O-E)^2}{E}$ לנתונים קטגוריאליים; תמיד חלקו בספירה המצופה.
  • בחרו את המבחן הנכון: התאמה-לכוח (משתנה אחד), עצמאות, או הומוגניות (טבלת שני-כיוונים).
  • חשבו ספירות מצופות כ$\tfrac{\text{row total}\times\text{column total}}{\text{grand total}}$ ובדקו שכל אחת היא ≥$\ge5$.
  • ערך-$\chi^2$ גדול (ערך-p קטן) מעיד על כך שהספירות הנצפות שונות מהמצופות יותר מכפי שהייתם צפויות מקר.
  • ציינו נדרגות חופש נכונה (קטגוריות $-1$, או $(r-1)(c-1)$).

Interactive lessons on this topic · ⁨שיעורים אינטראקטיביים בנושא זה⁩

Work through it step by step, with instant-check exercises. · ⁨לעבור על הדברים צעד אחר צעד, עם תרגילים לבדיקה מיידית.⁩

Past Papers · ⁨מבחני עבר⁩

More topics in AP Statistics · ⁨סטטיסטיקה - AP⁩ · ⁨נושאים נוספים בAP Statistics · ⁨סטטיסטיקה - AP⁩⁩

Log in or create account · ⁨היכנס או צור חשבון⁩

IGCSE, A-Level & AP