עיר רוצה לדעת כמה אנשים תומכים במדיניות חדשה. לא ניתן לשאול את כולם, אז שואלים מאה עשרה באופן אקראי. מאה ועשרה אומרים כן — שישים…
English narration · English + 中文 subtitles burned in · קריאת קול באנגלית · תרגום אנגלי + סינית שרוף בתוך הסרטון
6.1
Why Be Normal? · מדוע להיות נורמלי?
Syllabus · סיילבוס
English
Enduring Understanding (VAR-1): Given that variation may be random or not, conclusions are uncertain.
Learning Objective VAR-1.H: Identify questions suggested by variation in the shapes of distributions of samples taken from the same population. [Skill 1.A]
VAR-1.H.1 Variation in shapes of data distributions may be random or not.
עברית
הבנה מתמשכת (VAR-1): בשל כך ששינוי עשוי להיות אקראי או לא, המסקנות הן לא וודאות.
מטרת למידה VAR-1.H: זיהוי שאלות המוצעות על ידי השונות בצורות של חלוקות של דגימות שנלקחו מאותה אוכלוסייה. [מיומנות 1.A]
VAR-1.H.1 השונות בצורות של חלוקות הנתונים עשויה להיות אקראית או לא.
Source: College Board AP Course and Exam Description · מקור: תיאור הקורס והמבחן של College Board AP
English
Because a sample proportion $\hat{p}$ is approximately normally distributed (when the conditions hold), we can measure how far a sample result is from a claimed value in standard errors, and turn that into a probability. This is what makes inference 推断 – drawing conclusions about a population from a sample – possible.
עברית
מכיוון שיחס הדוגמה $\hat{p}$ מתפלג בקירוב נורמלית (כשהתנאים מתקיימים), אנו יכולים למדוד עד כמה תוצאת הדוגמה רחוקה מערך טעון בשגיאות סטנדרטיות, ולהפוך זאת להסתברות. זה מה שהופך את ההסקה – גיבת מסקנות לגבי אוכלוסייה מתוך דוגמה – לאפשרית.
6.2
Confidence Interval for a Proportion · רווח ביטחון ליחס
Syllabus · סיילבוס
English
Enduring Understanding (UNC-4): An interval of values should be used to estimate parameters, in order to account for uncertainty.
Learning Objective UNC-4.A: Identify an appropriate confidence interval procedure for a population proportion. [Skill 1.D]
UNC-4.A.1 The appropriate confidence interval procedure for a one-sample proportion for one categorical variable is a one sample $z$-interval for a proportion.
Learning Objective UNC-4.B: Verify the conditions for calculating confidence intervals for a population proportion. [Skill 4.C]
UNC-4.B.1 In order to make assumptions necessary for inference on population proportions, means, and slopes, we must check for independence in data collection methods and for selection of the appropriate sampling distribution.
UNC-4.B.2 In order to calculate a confidence interval to estimate a population proportion, $p$, we must check for independence and that the sampling distribution is approximately normal.
a. To check for independence:
i. Data should be collected using a random sample or a randomized experiment.
ii. When sampling without replacement, check that $n \leq 10\%N$, where $N$ is the size of the population.
b. To check that the sampling distribution of $\hat{p}$ is approximately normal (shape):
i. For categorical variables, check that both the number of successes, $n\hat{p}$, and the number of failures, $n(1-\hat{p})$ are at least 10 so that the sample size is large enough to support an assumption of normality.
Learning Objective UNC-4.C: Determine the margin of error for a given sample size and an estimate for the sample size that will result in a given margin of error for a population proportion. [Skill 3.D]
UNC-4.C.1 Based on sample data, the standard error of a statistic is an estimate for the standard deviation for the statistic. The standard error of $\hat{p}$ is $SE_{\hat{p}} = \sqrt{\dfrac{\hat{p}(1-\hat{p})}{n}}$.
UNC-4.C.2 A margin of error gives how much a value of a sample statistic is likely to vary from the value of the corresponding population parameter.
UNC-4.C.3 For categorical variables, the margin of error is the critical value ($z^*$) times the standard error (SE) of the relevant statistic, which equals $z^* \sqrt{\dfrac{\hat{p}(1-\hat{p})}{n}}$ for a one sample proportion.
UNC-4.C.4 The formula for margin of error can be rearranged to solve for $n$, the minimum sample size needed to achieve a given margin of error. For this purpose, use a guess for $\hat{p}$ or use $\hat{p} = 0.5$ in order to find an upper bound for the sample size that will result in a given margin of error.
Learning Objective UNC-4.D: Calculate an appropriate confidence interval for a population proportion. [Skill 3.D]
UNC-4.D.1 In general, an interval estimate can be constructed as point estimate ± (margin of error). For a one-sample proportion, the interval estimate is $\hat{p} \pm z^* \sqrt{\dfrac{\hat{p}(1-\hat{p})}{n}}$.
Clarifying statement: Formulas for interval estimates do not appear explicitly on the AP Statistics Formula Sheet provided with the AP Statistics Exam. However, these formulas do not need to be memorized, as they can be constructed based on the general test statistic formula and the relevant standard error formulas that are provided on the formula sheet.
UNC-4.D.2 Critical values represent the boundaries encompassing the middle C% of the standard normal distribution, where C% is an approximate confidence level for a proportion.
Learning Objective UNC-4.E: Calculate an interval estimate based on a confidence interval for a population proportion. [Skill 3.D]
UNC-4.E.1 Confidence intervals for population proportions can be used to calculate interval estimates with specified units.
עברית
הבנה מתמשכת (UNC-4): יש להשתמש בטווח ערכים כדי להעריך פרמטרים, כדי להתחשב בחוסר ודאות.
מטרת למידה UNC-4.A: לזהות הליך מרווח סמך מתאים לפרופורציה באוכלוסייה. [מיומנות 1.D]
UNC-4.A.1 הprocedure appropriate confidence interval for a one-sample proportion for one categorical variable is a one sample $z$-interval for a proportion.
מטרת למידה UNC-4.B: ודא את התנאים לחישוב מרווחי סמך לפרופורציה באוכלוסייה. [מיומנות 4.C]
UNC-4.B.1 כדי לבצע הנחות הכרחיות להסקות לגבי פרופורציות, ממוצעים ומשיפועים באוכלוסייה, יש לבדוק עצמאות בשיטות איסוף הנתונים ולבחון את בחירת ההתפלגות הדגימה המתאימה.
UNC-4.B.2 כדי לחשב מרווח סמך להערכת פרופורציה באוכלוסייה, $p$, יש לבדוק עצמאות ולהבטיח שההתפלגות הדגימה היא בקירוב נורמלית.
א. לבדיקת עצמאות:
i. הנתונים צריכים להיות אסופים באמצעות דגימה אקראית או ניסוי מקומי (Randomized Experiment).
ii. כאשר דוגמין ללא החזרה, יש לבדוק ש-$n \leq 10\%N$, כאשר $N$ הוא גודל האוכלוסייה.
ב. לבדיקה שההתפלגות הדגימה של $\hat{p}$ היא בקירוב נורמלית (צורה):
i. למשתנים קטגוריאליים, יש לוודא שגם מספר ההצלחות, $n\hat{p}$, וגם מספר הכישלונות, $n(1-\hat{p})$, הם לפחות 10, כך הגודל של הדגימה יהיה מספק כדי לתמוך בהנחת הנורמליות.
מטרת למידה UNC-4.C: קבע את שגיאת הסמך לדגימה נתונה והערכה לגודל דגימה שיוביל לשגיאת סמך נתונה לפרופורציה באוכלוסייה. [מיומנות 3.D]
UNC-4.C.1 על בסיס נתוני דגימה, השגיאה הסטנדרטית של סטטיסטיקה היא הערכה לסטיית התקן שלה. השגיאה הסטנדרטית של $\hat{p}$ היא $SE_{\hat{p}} = \sqrt{\dfrac{\hat{p}(1-\hat{p})}{n}}$.
UNC-4.C.2 שגיאת סמך מציינת כמה ערך של סטטיסטיקת דגימה נוטה להשתנות מערך הפרמטר המתאים באוכלוסייה.
UNC-4.C.3 למשתנים קטגוריאליים, שגיאת הסמך היא הערך הקריטי ($z^*$) כפול השגיאה הסטנדרטית (SE) של הסטטיסטיקה הרלוונטית, המשווה ל-$z^* \sqrt{\dfrac{\hat{p}(1-\hat{p})}{n}}$ עבור פרופורציה מדגימה אחת.
UNC-4.C.4 ניתן לעבד את הנוסחה לשגיאת סמך כדי לחשב את $n$, גודל הדגימה המינימלי הנדרש כדי להשיג שגיאת סמך נתונה. לצורך זה, השתמש בערך משוער עבור $\hat{p}$ או ב-$\hat{p} = 0.5$ כדי למצוא גבול עליון לגודל הדגימה שיוביל לשגיאת סמך נתונה.
מטרת למידה UNC-4.D: חשב מרווח סמך מתאים לפרופורציה באוכלוסייה. [מיומנות 3.D]
UNC-4.D.1 באופן כללי, מרווח הערכה יכול להיות בנוי כ-ערך נקודתי ± (שגיאת סמך). עבור פרופורציה מדגימה אחת, מרווח ההערכה הוא $\hat{p} \pm z^* \sqrt{\dfrac{\hat{p}(1-\hat{p})}{n}}$.
הבהרה: נוסחאות להערכות מרווח לא מופיעות במפורש בדף הנוסחאות של AP Statistics המצורף לבחינת AP Statistics. עם זאת, אין צורך לזכור אותן כי ניתן לבנות אותן על בסיס הנוסחה הכללית לסטטיסטיקת הבדיקה ונוסחאות השגיאה הסטנדרטית הרלוונטיות המופיעות בדף הנוסחאות.
UNC-4.D.2 ערכים קריטים מייצגים את הגבולות המקיפים את המרכז C% של ההתפלגות הנורמלית הסטנדרטית, כאשר C% הוא רמת סמך מקריבה עבור פרופורציה.
מטרת למידה UNC-4.E: חשב הערכת מרווח על בסיס מרווח סמך לפרופורציה באוכלוסייה. [מיומנות 3.D]
UNC-4.E.1 מרווחי סמך לפרופורציות באוכלוסייה יכולים לשמש לחישוב הערכות מרווח עם יחידות ספציפיות.
Source: College Board AP Course and Exam Description · מקור: תיאור הקורס והמבחן של College Board AP
English
What a confidence interval means
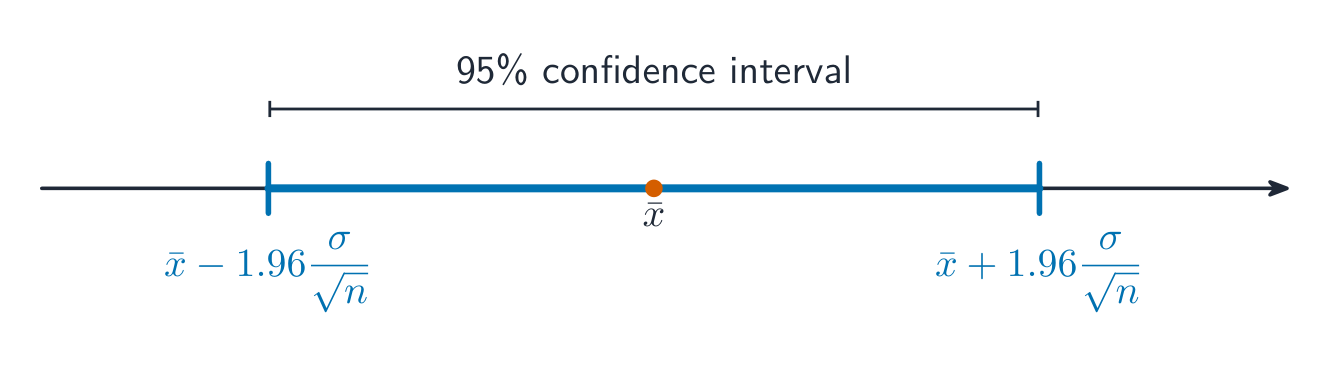
A confidence interval 置信区间 estimates the parameter as a range: statistic $\pm$margin of error 误差幅度.
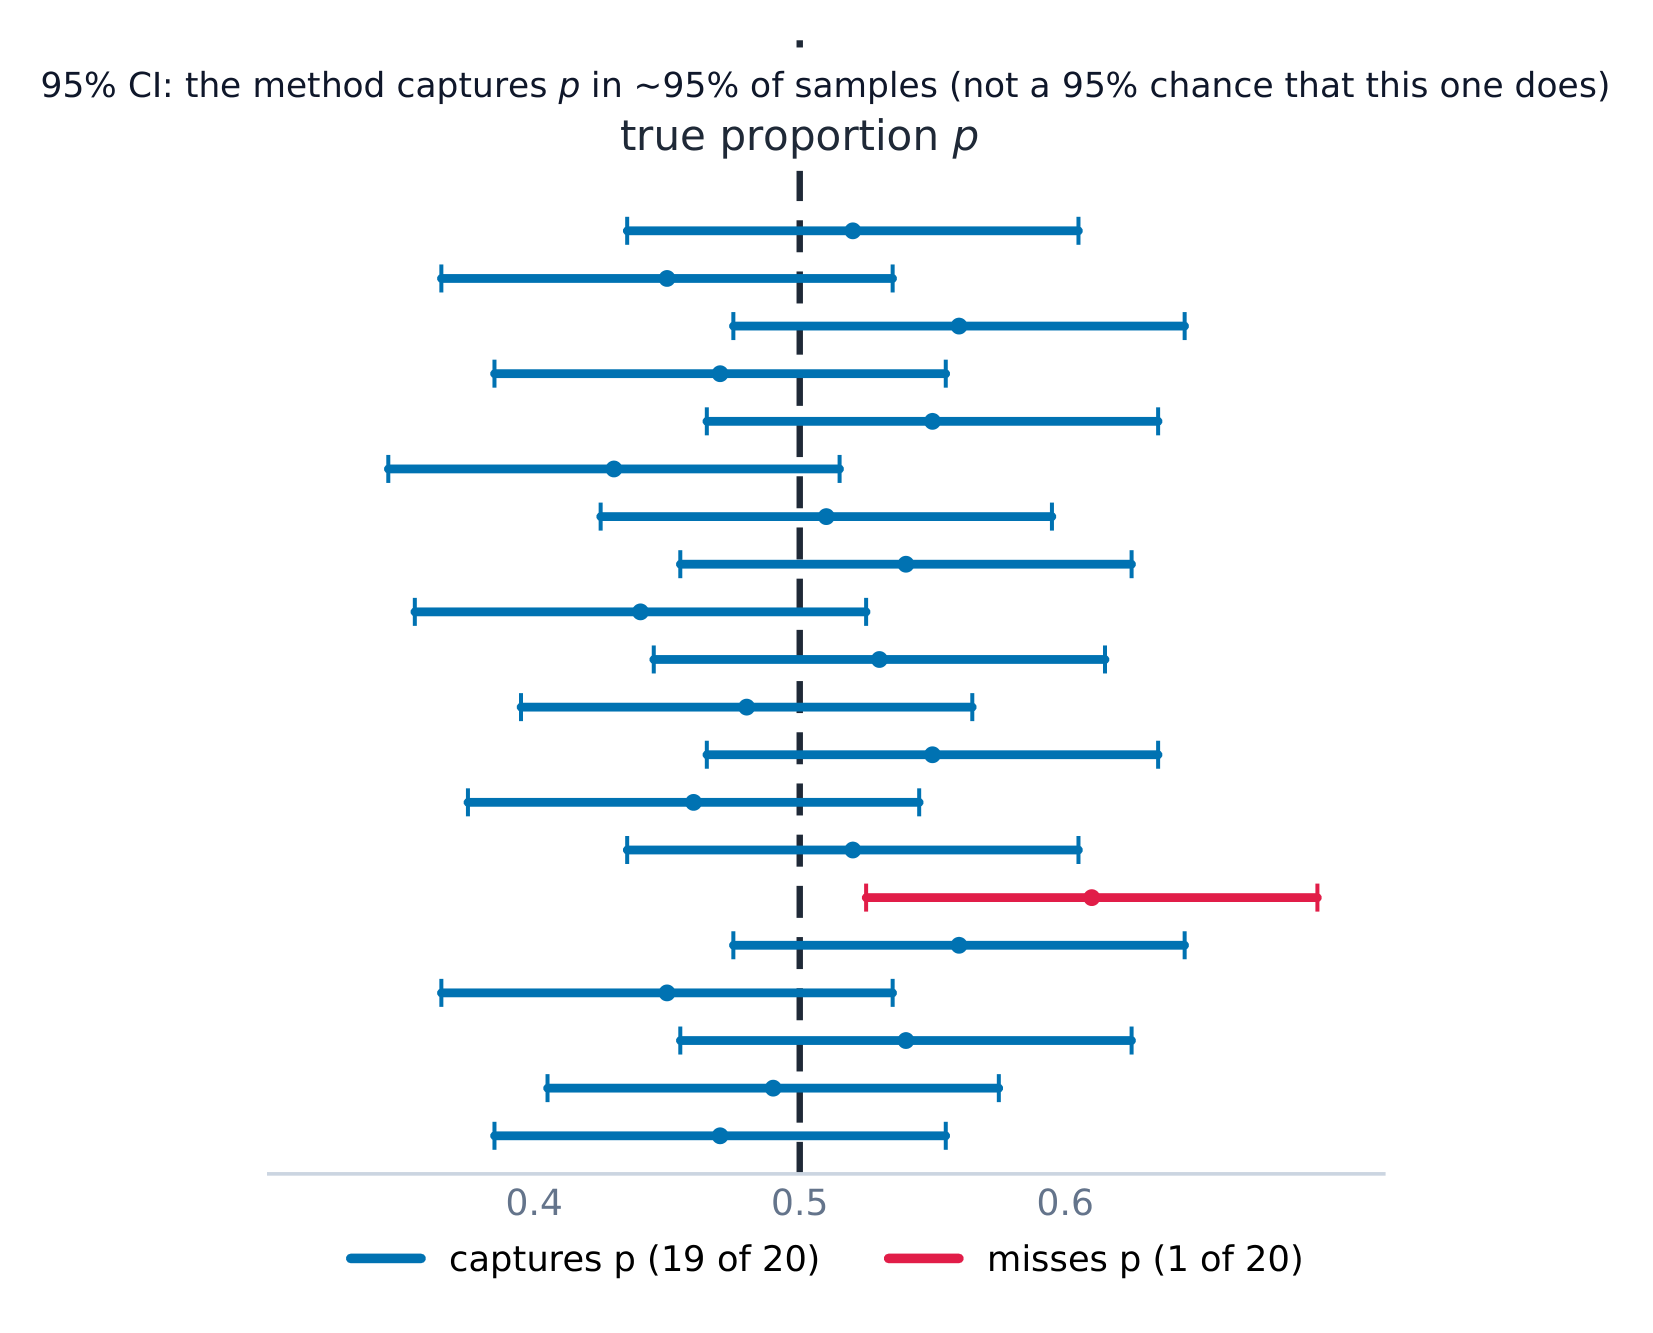
$z^{*}$ is the critical value for the confidence level 置信水平 (e.g. $1.96$ for 95%). Conditions: random sample, Large Counts ($n\hat p\ge 10$ and $n(1-\hat p)\ge 10$), and the 10% condition. Interpret it: "We are 95% confident the true proportion of... is between... and...". Interpret the level: "In 95% of samples, this method produces an interval that captures the true proportion."
Worked example. In a random sample of $200$ people, $120$ support a policy, so $\hat{p}=0.60$. A $95\%$ interval uses $z^*=1.96$:
We are $95\%$ confident the true proportion of supporters is between $53.2\%$ and $66.8\%$.
Choosing the sample size. To keep the margin of error no larger than a target $m$, set $z^{*}\sqrt{\dfrac{\hat p(1-\hat p)}{n}}\le m$ and solve for $n$. When you have no estimate of $\hat p$, use $\hat p=0.5$: it makes $\hat p(1-\hat p)$ as large as possible, giving the safe (largest) required sample size. Always round the result up to the next whole person.
Worked example. How many people must you survey for a $95\%$ interval with margin of error at most $0.03$? Using $\hat p=0.5$ and $z^*=1.96$:
$z^{*}$ היא הערך הקריטי לרמת הביטחון (למשל $1.96$ עבור 95%). תנאים: דוגמה אקראית, ספירות גדולות ($n\hat p\ge 10$ ו$n(1-\hat p)\ge 10$), ותנאי ה-10%. פרש אותה: "אנו בטוחים ב-95% שהיחס האמיתי של... נמצא בין... ובין...". פרש את הרמה: "ב-95% מהדוגמאות, שיטה זו מייצרת רווח שתופס את היחס האמיתי."
לאורך דוגמאות רבות, כ-95% מרווחי הביטחון של 95% תופסים את היחס האמיתי
דוגמה פותרת. בדוגמה אקראית של $200$ אנשים, $120$ תומכים במדיניות, ולכן $\hat{p}=0.60$. רווח $95\%$ משתמש ב$z^*=1.96$:
אנו בטוחים ב$95\%$ שהיחס האמיתי של התומכים נמצא בין $53.2\%$ לבין $66.8\%$.
רווח ביטחון של 95% מגיע ל-1.96 שגיאות סטנדרטיות בכל צד מההערכה
בחירת גודל הדוגמה. כדי לשמור על שגיאת הגבוי לא גדולה יותר ממטרה $m$, הצב $z^{*}\sqrt{\dfrac{\hat p(1-\hat p)}{n}}\le m$ והפר for $n$. כאשר אין לך הערכה של $\hat p$, השתמש ב$\hat p=0.5$: זה גורם ל$\hat p(1-\hat p)$ להיות גדול ככל האפשר, ומניב את גודל הדוגמה הנדרש הבטוח (הגדול ביותר). תמיד עגל את התוצאה כלפי מעלה למספר שלם הבא.
דוגמה פותרת. כמה אנשים יש לבדוק עבור מרווח ביטחון ב-$95\%$ עם שגיאת סטייה מקסימלית של $0.03$? באמצעות $\hat p=0.5$ ו-$z^*=1.96$:
Justifying a Claim from an Interval · נימוק טענה מתוך רווח
Syllabus · סיילבוס
English
Enduring Understanding (UNC-4): An interval of values should be used to estimate parameters, in order to account for uncertainty.
Learning Objective UNC-4.F: Interpret a confidence interval for a population proportion. [Skill 4.B]
UNC-4.F.1 A confidence interval for a population proportion either contains the population proportion or it does not, because each interval is based on random sample data, which varies from sample to sample.
UNC-4.F.2 We are C% confident that the confidence interval for a population proportion captures the population proportion.
UNC-4.F.3 In repeated random sampling with the same sample size, approximately C% of confidence intervals created will capture the population proportion.
UNC-4.F.4 Interpreting a confidence interval for a one-sample proportion should include a reference to the sample taken and details about the population it represents.
Illustrative examples for UNC-4.F.4: For interpreting a 99% confidence interval of (0.268, 0.292), based on the proportion of a nationally representative sample of twelfth-grade students who answered a particular multiple choice question correctly: "We are 99 percent confident that the interval from 0.268 to 0.292 contains the population proportion of all United States twelfth-grade students who would answer this question correctly" (2011 FRQ 6(a)).
Learning Objective UNC-4.G: Justify a claim based on a confidence interval for a population proportion. [Skill 4.D]
UNC-4.G.1 A confidence interval for a population proportion provides an interval of values that may provide sufficient evidence to support a particular claim in context.
Learning Objective UNC-4.H: Identify the relationships between sample size, width of a confidence interval, confidence level, and margin of error for a population proportion. [Skill 4.A]
UNC-4.H.1 When all other things remain the same, the width of the confidence interval for a population proportion tends to decrease as the sample size increases. For a population proportion, the width of the interval is proportional to $\dfrac{1}{\sqrt{n}}$.
UNC-4.H.2 For a given sample, the width of the confidence interval for a population proportion increases as the confidence level increases.
UNC-4.H.3 The width of a confidence interval for a population proportion is exactly twice the margin of error.
עברית
הבנה מתמשכת (UNC-4): יש להשתמש בטווח ערכים כדי להעריך פרמטרים, כדי להתחשב בחוסר ודאות.
מטרת למידה UNC-4.F: פרש מרווח סמך לפרופורציה באוכלוסייה. [מיומנות 4.B]
UNC-4.F.1 מרווח סמך לפרופורציה באוכלוסייה או מכיל את הפרופורציה או שאינו מכיל אותה, שכן כל מרווח מבוסס על נתוני דגימה אקראיים, המשתנים מדגימה לדגימה.
UNC-4.F.2 יש לנו ביטחון של C% שהמרווח הביטחון עבור פרופורציה באוכלוסיא יכלול את הפרופורציה האוכלוסייתית.
UNC-4.F.3 בדגימה אקראית חוזרת עם אותה גודל דוגמה, כ- C% מהמרווחים הביטחוניים שנוצרים יכללו את הפרופורציה האוכלוסייתית.
UNC-4.F.4 פרשנות מרווח ביטחון לפרופורציה מדוגמה אחת צריכה להכליל התייחסות לדוגמה שנלקחה ומפרטים על האוכלוסיא שהיא מייצגת.
דוגמאות תומכות ל-UNC-4.F.4: לעבר פרשנות מרווח ביטחון של 99% בקרוב (0.268, 0.292), המבוסס על פרופורציה של דגימה נציגה לאומית של תלמידי כיתה י"ב שענו נכון לשאלת רב-בחירה מסוימת: "יש לנו ביטחון של 99% שהמרווח מ-0.268 עד 0.292 מכיל את הפרופורציה האוכלוסייתית של כל תלמידי כיתה י"ב בארצות הברית שיענו נכון לשאלה זו" (2011 FRQ 6(a)).
מטרות למידה UNC-4.G: להצדיק טענה המבוססת על מרווח ביטחון לפרופורציה באוכלוסיא. [מיומנות 4.D]
UNC-4.G.1 מרווח ביטחון לפרופורציה באוכלוסיא מספק מרווח ערכים שיכול לספק ראיות מספיקות לתמוך בטענה מסוימת בהקשר נתון.
מטרות למידה UNC-4.H: לזהות את הקשרים בין גודל הדוגמה, רוחב מרווח ביטחון, רמת ביטחון ושגיאת סטייה לפרופורציה באוכלוסיא. [מיומנות 4.A]
UNC-4.H.1 כאשר שאר הדברים נשארים זהים, רוחב המרווח הביטחוני לפרופורציה באוכלוסיא נוטה לצמצום כאשר גודל הדוגמה גדל. עבור פרופורציה באוכלוסיא, רוחב המרווח פרופורציונלי ל $\dfrac{1}{\sqrt{n}}$.
UNC-4.H.2 עבור דוגמה נתונה, רוחב המרווח הביטחוני לפרופורציה באוכלוסיא עולה כאשר רמת הביטחון עולה.
UNC-4.H.3 רוחב מרווח הביטחון לפרופורציה באוכלוסיא הוא בדיוק פעמיים משגיאת הסטייה.
Source: College Board AP Course and Exam Description · מקור: תיאור הקורס והמבחן של College Board AP
English
To judge a claimed value: if it lies inside the interval, the data are consistent with it; if it lies outside, the data give evidence against it. Base the conclusion on whether the plausible values include the claim, in context.
עברית
כדי לשפוט ערך טעון: אם הוא נמצא בתוך הרווח, הנתונים תואמים אותו; אם הוא נמצא חוץ ממנו, הנתונים מספקים ראיה נגדו. בסיס את המסקנה על כך האם הערכים הסבירים כוללים את הטענה, בהקשר הרלוונטי.
6.4
Setting Up a Test for a Proportion · הגדרת מבחן לפרופורציה
Syllabus · סיילבוס
English
Enduring Understanding (VAR-6): The normal distribution may be used to model variation.
Learning Objective VAR-6.D: Identify the null and alternative hypotheses for a population proportion. [Skill 1.F]
VAR-6.D.1 The null hypothesis is the situation that is assumed to be correct unless evidence suggests otherwise, and the alternative hypothesis is the situation for which evidence is being collected.
VAR-6.D.2 For hypotheses about parameters, the null hypothesis contains an equality reference (=, ≥, or ≤), while the alternative hypothesis contains a strict inequality (<, >, or ≠). The type of inequality in the alternative hypothesis is based on the question of interest. Alternative hypotheses with < or > are called one-sided, and alternative hypotheses with ≠ are called two-sided. Although the null hypothesis for a one-sided test may include an inequality symbol, it is still tested at the boundary of equality.
VAR-6.D.3 The null hypothesis for a population proportion is: $H_0 : p = p_0$, where $p_0$ is the null hypothesized value for the population proportion.
VAR-6.D.4 A one-sided alternative hypothesis for a proportion is either $H_a : p < p_0$ or $H_a : p > p_0$. A two-sided alternate hypothesis is $H_a : p_1 \neq p_2$.
VAR-6.D.5 For a one-sample $z$-test for a population proportion, the null hypothesis specifies a value for the population proportion, usually one indicating no difference or effect.
Learning Objective VAR-6.E: Identify an appropriate testing method for a population proportion. [Skill 1.E]
VAR-6.E.1 For a single categorical variable, the appropriate testing method for a population proportion is a one-sample $z$-test for a population proportion.
Learning Objective VAR-6.F: Verify the conditions for making statistical inferences when testing a population proportion. [Skill 4.C]
VAR-6.F.1 In order to make statistical inferences when testing a population proportion, we must check for independence and that the sampling distribution is approximately normal:
a. To check for independence:
i. Data should be collected using a random sample or a randomized experiment.
ii. When sampling without replacement, check that $n \leq 10\%N$.
b. To check that the sampling distribution of $\hat{p}$ is approximately normal (shape):
i. Assuming that $H_0$ is true $(p = p_0)$, verify that both the number of successes, $np_0$, and the number of failures, $n(1-p_0)$ are at least 10 so that that the sample size is large enough to support an assumption of normality.
עברית
הבנה מתמשכת (VAR-6): ניתן להשתמש בחלוקה נורמלית כדי לדגם תנודות.
מטרות למידה VAR-6.D: לזהות את ההיפותזות האפס והחלופיות לפרופורציה באוכלוסיא. [מיומנות 1.F]
VAR-6.D.1 ההיפותזה האפס היא המצב הנחשב לנכון אלא אם כן ישנן ראיות המעידות על הפך, וההיפותזה החלופית היא המצב עבורו נאספת ראיות.
VAR-6.D.2 עבור היפותזות לגבי פרמטרים, ההיפותזה האפס מכילה התייחסות לשוויון (=, ≥ או ≤), בעוד שההיפותזה החלופית מכילה אי-שוויון מחמיר (<, >, או ≠). סוג האי-שוויון בהיפותזה החלופית מבוסס על השאלה הרלוונטית. היפותזות חלופיות עם < or > נקראות חד-צדדיות, והיפותזות חלופיות עם ≠ נקראות דו-צדדיות. למרות שההיפותזה האפס לבדיקה חד-צדדית עשויה להכיל סימן אי-שוויון, היא עדיין נבדקת בגבול השוויון.
VAR-6.D.3 ההיפותזה האפס לפרופורציה באוכלוסיא היא: $H_0 : p = p_0$, כאשר $p_0$ הוא הערך המיוחס אפס לפרופורציה באוכלוסיא.
VAR-6.D.4 היפותזה חלופית חד-צדדית לפרופורציה היא או $H_a : p < p_0$ או $H_a : p > p_0$. היפותזה חלופית דו-צדדית היא $H_a : p_1 \neq p_2$.
VAR-6.D.5 עבור one-sample $z$-test for a population proportion, the null hypothesis specifies a value for the population proportion, usually one indicating no difference or effect.
מטרות למידה VAR-6.E: לזהות שיטת בדיקה מתאימה לפרופורציה באוכלוסיא. [מיומנות 1.E]
VAR-6.E.1 עבור single categorical variable, the appropriate testing method for a population proportion is a one-sample $z$-test for a population proportion.
מטרות למידה VAR-6.F: לאמת את התנאים לעשיית סטטיסטיקה סטטיסטית בעת בדיקת פרופורציה באוכלוסיא. [מיומנות 4.C]
VAR-6.F.1 כדי לבצע מסקנות סטטיסטיות במבחן פרופורציה באוכלוסייה, יש לוודא עצמאות ובדוק שההתפלגות הדגימה היא בקירוב נורמלית:
א. לבדיקת עצמאות:
i. הנתונים צריכים להיות אסופים באמצעות דגימה אקראית או ניסוי מקומי (Randomized Experiment).
ii. כאשר דוגמה נלקחת ללא החזרה, בדוק כי $n \leq 10\%N$.
ב. לבדיקה שההתפלגות הדגימה של $\hat{p}$ היא בקירוב נורמלית (צורה):
i. בהנחה ש-$H_0$ נכון, $(p = p_0)$, ודא כי גם מספר ההצלחות, $np_0$, וגם מספר הכישלונות, $n(1-p_0)$, הם לפחות 10, כך הגודל של הדגימה יהיה גדול מספיק כדי לתמוך בהנחת הנורמליות.
Source: College Board AP Course and Exam Description · מקור: תיאור הקורס והמבחן של College Board AP
English
A significance test 显著性检验 weighs evidence against a claim. State a null hypothesis 原假设$H_0$ and an alternative hypothesis 备择假设$H_a$ about the parameter $p$:
Check the same conditions (random, Large Counts using $p_0$, 10%). The test statistic 检验统计量 counts standard errors from $p_0$:
$$z=\frac{\hat p-p_0}{\sqrt{p_0(1-p_0)/n}}.$$
Worked example. A company claims $90\%$ satisfaction ($p_0=0.90$); a sample of $100$ finds $84$ satisfied ($\hat{p}=0.84$). Test $H_0:p=0.90$ vs $H_a:p\neq0.90$ at $\alpha=0.05$:
giving a two-tailed $p$-value of about $2(0.023)=0.046$. Since $0.046<0.05$, reject $H_0$ – there is evidence the true satisfaction rate differs from (is below) $90\%$.
עברית
מבחן מובהקות שוקל את העדויות נגד טענה. נסח היפוטזה אפס$H_0$ והיפוטזה אלטרנטיבית$H_a$ לגבי הפרמטר $p$:
בדוק את אותם תנאים (אקראיות, ספירות גדולות באמצעות $p_0$, 10%). הסטטיסטיקה למבחן סופרת את מספר השגיאות הסטנדרטיות מהערך $p_0$:
$$z=\frac{\hat p-p_0}{\sqrt{p_0(1-p_0)/n}}.$$
דוגמה מופעלת. חברה טוענת ש$90\%$ מהלקוחות מרוצים ($p_0=0.90$); במדגם של $100$ נמצאו $84$ מרוצים ($\hat{p}=0.84$). בוצעו מבחן עבור $H_0:p=0.90$ מול $H_a:p\neq0.90$ ברמת $\alpha=0.05$:
שהוביל לערך-$p$ דו-צדי של כ-$2(0.023)=0.046$. מכיוון ש-$0.046<0.05$, דוחים את $H_0$ – יש עדות לכך שרמת השביעות האמיתית שונה מ-$90\%$ (או נמוכה ממנה).
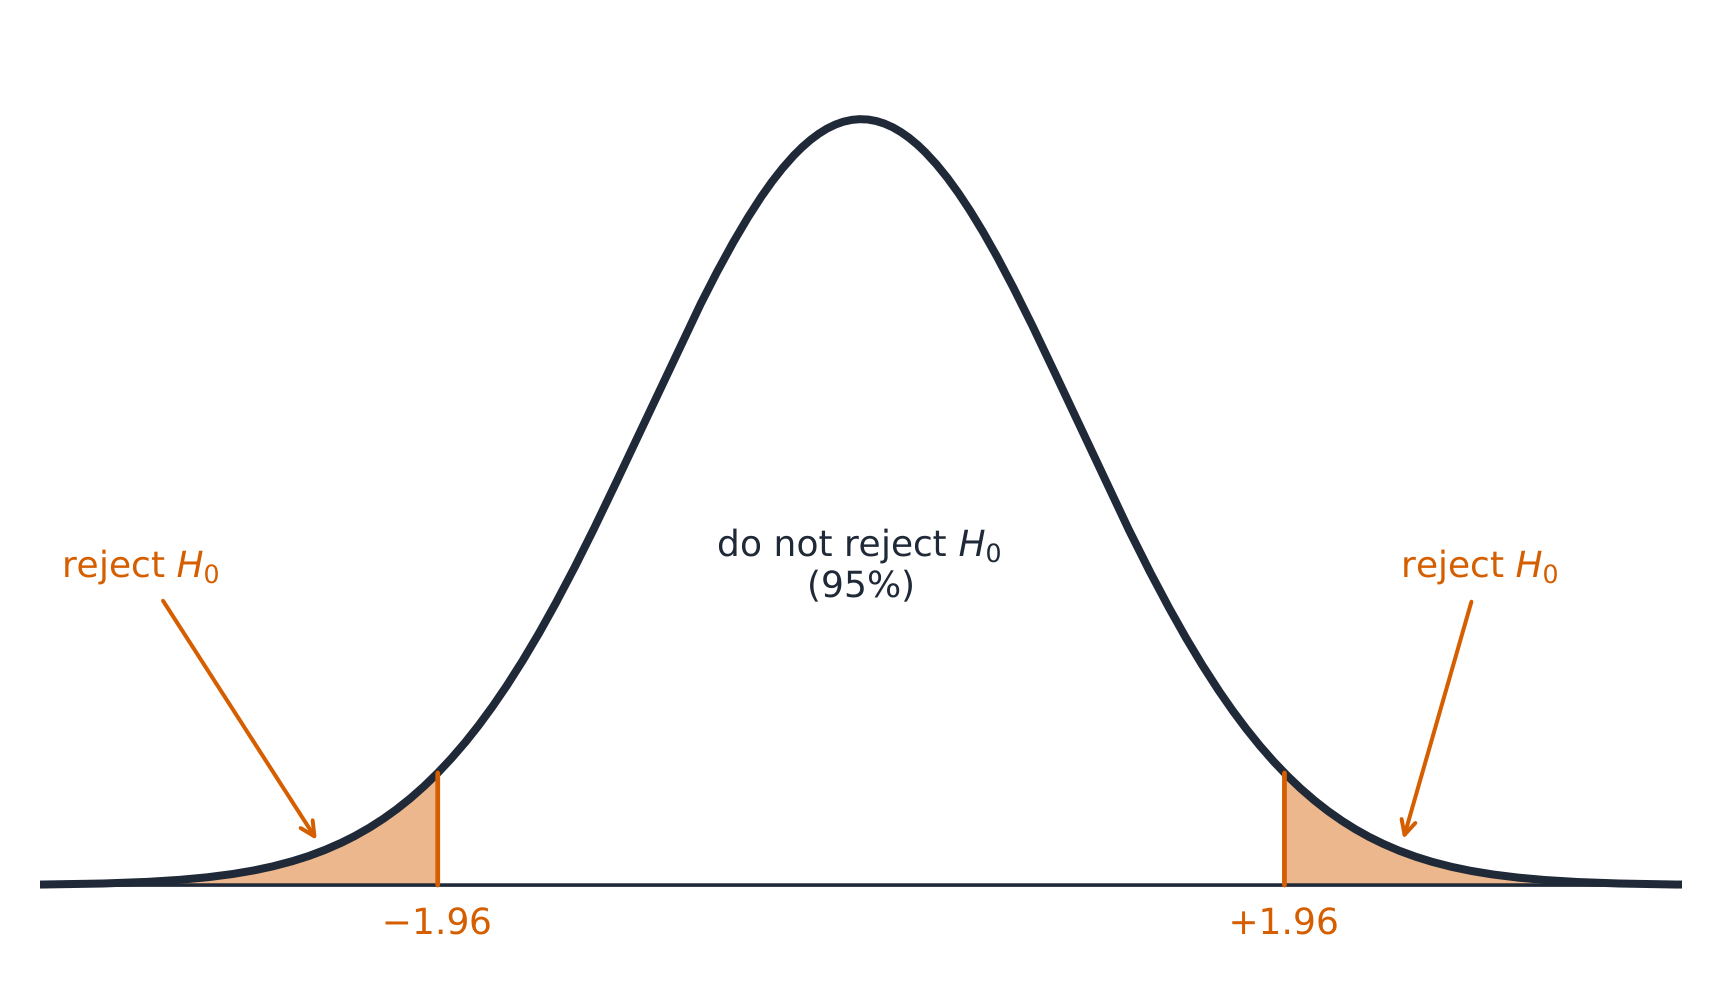
מבחן דו-צדי ברמת 5% דוחה את ההיפוטזה האפס בזנבות המוצלים
6.5
Interpreting p-Values · פרשנות ערכי-p
Syllabus · סיילבוס
English
Enduring Understanding (VAR-6): The normal distribution may be used to model variation.
Learning Objective VAR-6.G: Calculate an appropriate test statistic and $p$-value for a population proportion. [Skill 3.E]
VAR-6.G.1 The distribution of the test statistic assuming the null hypothesis is true (null distribution) can be either a randomization distribution or when a probability model is assumed to be true, a theoretical distribution ($z$).
VAR-6.G.2 When using a $z$-test, the standardized test statistic can be written: $\text{test statistic} = \dfrac{\text{sample statistic} - \text{null value of the parameter}}{\text{standard deviation of the statistic}}$. This is called a $z$-statistic for proportions.
VAR-6.G.3 The test statistic for a population proportion is: $z = \dfrac{\hat{p} - p_0}{\sqrt{\dfrac{p_0(1-p_0)}{n}}}$.
Clarifying statement: The formulas for test statistics do not appear explicitly on the AP Statistics Formula Sheet provided with the AP Statistics Exam. However, these formulas do not need to be memorized, as they can be constructed based on the general test statistic formula and the relevant standard error formulas that are provided on the formula sheet.
VAR-6.G.4 A $p$-value is the probability of obtaining a test statistic as extreme or more extreme than the observed test statistic when the null hypothesis and probability model are assumed to be true. The significance level may be given or determined by the researcher.
Enduring Understanding (DAT-3): Significance testing allows us to make decisions about hypotheses within a particular context.
Learning Objective DAT-3.A: Interpret the $p$-value of a significance test for a population proportion. [Skill 4.B]
DAT-3.A.1 The $p$-value is the proportion of values for the null distribution that are as extreme or more extreme than the observed value of the test statistic. This is:
a. The proportion at or above the observed value of the test statistic, if the alternative is >.
b. The proportion at or below the observed value of the test statistic, if the alternative is <.
c. The proportion less than or equal to the negative of the absolute value of the test statistic plus the proportion greater than or equal to the absolute value of the test statistic, if the alternative is ≠.
DAT-3.A.2 An interpretation of the $p$-value of a significance test for a one-sample proportion should recognize that the $p$-value is computed by assuming that the probability model and null hypothesis are true, i.e., by assuming that the true population proportion is equal to the particular value stated in the null hypothesis.
עברית
הבנה מתמשכת (VAR-6): ניתן להשתמש בחלוקה נורמלית כדי לדגם תנודות.
מטרות למידה VAR-6.G: חשב סטטיסטיקת מבחן מתאימה וערך $p$ לפרופורציה באוכלוסייה. [מיומנות 3.E]
VAR-6.G.1 התפלגות סטטיסטיקת המבחן בהנחה שההנחה האפסית נכונה (התפלגות אפסית) יכולה להיות או התפלגות רנדומליזציה או, כאשר מניחים שמודל הסבירות הוא נכון, התפלגות תיאורטית ($z$).
VAR-6.G.2 בשימוש במבחן $z$, ניתן לכתוב את סטטיסטיקת המבחן הסטנדרטיזציה כך: $\text{test statistic} = \dfrac{\text{sample statistic} - \text{null value of the parameter}}{\text{standard deviation of the statistic}}$. זה נקרא סטטיסטיקת $z$ לפרופורציות.
הבהרה: הנוסחאות לסטטיסטיקות מבחן אינן מופיעות במפורש בדף הנוסחאות המצורף למבחן AP Statistics. עם זאת, אין צורך לשנן אותן, שכן ניתן להרכיב אותן על בסיס הנוסחה הכללית לסטטיסטיקת מבחן ונוסחאות סטיית התקן הרלוונטיות המופיעות בדף הנוסחאות.
VAR-6.G.4 ערך $p$ הוא ההסתברות לקבל סטטיסטיקת מבחן קיצונית ככלונית או יותר מקיצונית מזו שנצפתה, בהנחה שההנחה האפסית ומודל הסבירות הם נכונים. רמת המשמעותיות עשויה להיות נתונה או קבועה בידי החוקר.
הבנה מתמשכת (DAT-3): בדיקת משמעות מאפשרת לנו לקבל החלטות לגבי הנחות בתוך הקשר נתון.
מטרות למידה DAT-3.A: פרשן את ערך $p$ של מבחן משמעותיות לפרופורציה באוכלוסייה. [מיומנות 4.B]
DAT-3.A.1 ערך $p$ הוא היחס בין הערכים להתפלגות האפסית הקיצוניים ככלונית או יותר מקיצוניים מהערך שנצפה בסטטיסטיקת המבחן. זהו:
א. היחס בערך או מעל לערך שנצפה בסטטיסטיקת המבחן, אם ההנחה החלופית היא >.
ב. היחס בערך או מתחת לערך שנצפה בסטטיסטיקת המבחן, אם ההנחה החלופית היא <.
ג. היחס הקטן מהערך המוחלט השלילי של סטטיסטיקת המבחן פלוס היחס הגדול מהערך המוחלט של סטטיסטיקת המבחן, אם ההנחה החלופית היא ≠.
DAT-3.A.2 פרשנות של ערך $p$ של מבחן משמעותיות לפרופורציה לדגימה אחת צריכה להכיר בכך שערך $p$ מחושב בהנחה שמודל הסבירות וההנחה האפסית נכונות, כלומר, בהנחה שהפרופורציה האמיתית באוכלוסייה שווה לערך הספציפי המצוין בהנחה האפסית.
Source: College Board AP Course and Exam Description · מקור: תיאור הקורס והמבחן של College Board AP
English
What a p-value means
The $p$-value P值 is the probability of getting a sample result as extreme or more extreme than the observed one, assuming $H_0$ is true. A small $p$-value means the data would be surprising if $H_0$ held – evidence against $H_0$. It is not the probability that $H_0$ is true.
עברית
מהו ערך p
ה-ערך-$p$ P הוא הסיכוי לקבל תוצאת מדגם בנויה או קיצונית יותר מאשר זו שנצפתה, בהנחה ש$H_0$ נכון. ערך-$p$ קטן מעיד על כך שהנתונים היו מפתיעים אם $H_0$ היה נכון – עדות נגד $H_0$. זה אינו הסיכוי ש$H_0$ נכון.
Explore · חקור
A p-value as a tail area · ערך p כשטח זנב
A p-value is the probability, if the null hypothesis were true, of a result at least this extreme — the shaded tail area. Small p-values cast doubt on the null. · ערך p הוא ההסתברות, אם ההיפותזה האפסית הייתה נכונה, לתוצאה שקצה או יותר — שטח הזנב המוצל. ערכי p קטנים מטילים ספק בהיפותזה האפסית.
6.6
Concluding a Test · ניסוף המבחן
Syllabus · סיילבוס
English
Enduring Understanding (DAT-3): Significance testing allows us to make decisions about hypotheses within a particular context.
Learning Objective DAT-3.B: Justify a claim about the population based on the results of a significance test for a population proportion. [Skill 4.E]
DAT-3.B.1 The significance level, $\alpha$, is the predetermined probability of rejecting the null hypothesis given that it is true.
DAT-3.B.2 A formal decision explicitly compares the $p$-value to the significance level, $\alpha$. If the $p$-value $\leq \alpha$, reject the null hypothesis. If the $p$-value $> \alpha$, fail to reject the null hypothesis.
DAT-3.B.3 Rejecting the null hypothesis means there is sufficient statistical evidence to support the alternative hypothesis. Failing to reject the null means there is insufficient statistical evidence to support the alternative hypothesis.
DAT-3.B.4 The conclusion about the alternative hypothesis must be stated in context.
DAT-3.B.5 A significance test can lead to rejecting or not rejecting the null hypothesis, but can never lead to concluding or proving that the null hypothesis is true. Lack of statistical evidence for the alternative hypothesis is not the same as evidence for the null hypothesis.
DAT-3.B.6 Small $p$-values indicate that the observed value of the test statistic would be unusual if the null hypothesis and probability model were true, and so provide evidence for the alternative. The lower the $p$-value, the more convincing the statistical evidence for the alternative hypothesis.
DAT-3.B.7$p$-values that are not small indicate that the observed value of the test statistic would not be unusual if the null hypothesis and probability model were true, so do not provide convincing statistical evidence for the alternative hypothesis nor do they provide evidence that the null hypothesis is true.
DAT-3.B.8 A formal decision explicitly compares the $p$-value to the significance $\alpha$. If the $p$-value $\leq \alpha$, then reject the null hypothesis, $H_0 : p = p_0$. If the $p$-value $> \alpha$, then fail to reject the null hypothesis.
DAT-3.B.9 The results of a significance test for a population proportion can serve as the statistical reasoning to support the answer to a research question about the population that was sampled.
עברית
הבנה מתמשכת (DAT-3): בדיקת משמעות מאפשרת לנו לקבל החלטות לגבי הנחות בתוך הקשר נתון.
מטרות למידה DAT-3.B: הנחה טענה לגבי האוכלוסייה על בסיס תוצאות מבחן משמעותיות לפרופורציה באוכלוסייה. [מיומנות 4.E]
DAT-3.B.1 רמת המשמעותיות, $\alpha$, היא ההסתברות שקבועה מראש לדחיית ההנחה האפסית בהנחה שהיא נכונה.
DAT-3.B.2 החלטה פורמלית משווה במפורש את ערך $p$ לרמת המשמעותיות, $\alpha$. אם ערך $p$$\leq \alpha$, דחה את ההנחה האפסית. אם ערך $p$$> \alpha$, אל תדחה את ההנחה האפסית.
DAT-3.B.3 דחיית ההיפוטזה הרווחית משמעותה שיש מספיק ערך סטטיסטי לתמוך בהיפוטזה החלופית. אי-דחיית ההיפוטזה הרווחית משמעותה שאין מספיק ערך סטטיסטי לתמוך בהיפוטזה החלופית.
DAT-3.B.4 המסקנה לגבי ההיפוטזה החלופית חייבת להיות מובעת בהקשר.
DAT-3.B.5 מבחן משמעותיות יכול להוביל לדחייה או לאי-דחיית ההיפוטזה הרווחית, אך לעולם לא יוביל למסקנה או להוכחה שההיפוטזה הרווחית נכונה. חוסר בערכים סטטיסטיים עבור ההיפוטזה החלופית אינו זהה לערכים עבור ההיפוטזה הרווחית.
DAT-3.B.6 ערכי $p$ קטנים מצביעים על כך שערכו הנצפה של סטטיסטית הבדיקה היה לא רגיל אם ההיפוטזה הרווחית והמודל האפשרותי היו נכונים, ולכן מספקים ערכים עבור ההיפוטזה החלופית. ככל שהערך $p$ נמוך יותר, כך הערכים הסטטיסטיים עבור ההיפוטזה החלופית משכנעים יותר.
DAT-3.B.7 ערכי $p$ שאינם קטנים מציעים כי הערכו הנצפה של סטטיסטית הבדיקה לא היה לא רגיל אם ההיפוטזה הרווחית והמודל האפשרותי היו נכונים, ולכן אינם מספקים ערכים סטטיסטיים משכנעים עבור ההיפוטזה החלופית ואינם מספקים ערכים שההיפוטזה הרווחית נכונה.
DAT-3.B.8 החלטה פורמלית مقارنة במפורש את הערך $p$ עם הרמת המשמעותיות $\alpha$. אם הערך $p$$\leq \alpha$, אז דוחים את ההיפוטזה הרווחית, $H_0 : p = p_0$. אם הערך $p$$> \alpha$, אז מתעלמים מדחיית ההיפוטזה הרווחית.
DAT-3.B.9 תוצאות מבחן משמעותיות לפרופורציית אוכלוסייה יכולות לשמש כהיתוך סטטיסטי לתמוך בתשובה לשאלת מחקר לגבי האוכלוסייה שנדגמה.
Source: College Board AP Course and Exam Description · מקור: תיאור הקורס והמבחן של College Board AP
English
Compare the $p$-value to the significance level 显著性水平$\alpha$ (often $0.05$):
$p\le\alpha$: reject $H_0$ – there is convincing evidence for $H_a$.
$p>\alpha$: fail to reject $H_0$ – not enough evidence for $H_a$ (never "accept $H_0$").
Always write the conclusion in context, linking back to the claim.
עברית
השוו את ערך-$p$ לרמת מובהקות$\alpha$ (לרוב $0.05$):
ערך-$p\le\alpha$: דוחים את $H_0$ – יש עדות משכנעת ל$H_a$.
ערך-$p>\alpha$: אין דוחים את $H_0$ – אין מספיק עדות ל$H_a$ (לעולם "קבלת $H_0$").
תמיד כתבו את הסיכום בהקשר, בקישור לחזרה לטענה המקורית.
6.7
Type I and Type II Errors · שגיאות סוג I וסוג II
Syllabus · סיילבוס
Enduring Understanding
Learning Objective
Essential Knowledge
UNC-5
Probabilities of Type I and Type II errors influence inference.
UNC-5.A
Identify Type I and Type II errors. [Skill 1.B]
UNC-5.A.1 A Type I error occurs when the null hypothesis is true and is rejected (false positive).
UNC-5.A.2 A Type II error occurs when the null hypothesis is false and is not rejected (false negative).
Table of Errors: With Actual Population Value across the top ($H_0$ true; $H_a$ true) and Decision down the side (Reject $H_0$; Fail to Reject $H_0$): Reject $H_0$ when $H_0$ true = Type I Error; Reject $H_0$ when $H_a$ true = Correct Decision; Fail to Reject $H_0$ when $H_0$ true = Correct Decision; Fail to Reject $H_0$ when $H_a$ true = Type II Error.
UNC-5.B
Calculate the probability of a Type I and Type II errors. [Skill 3.A]
UNC-5.B.1 The significance level, $\alpha$, is the probability of making a Type I error, if the null hypothesis is true.
UNC-5.B.2 The power of a test is the probability that a test will correctly reject a false null hypothesis.
UNC-5.B.3 The probability of making a Type II error $= 1 - power$.
UNC-5.C
Identify factors that affect the probability of errors in significance testing. [Skill 4.A]
UNC-5.C.1 The probability of a Type II error decreases when any of the following occurs, provided the others do not change:
i. Sample size(s) increases.
ii. Significance level ($\alpha$) of a test increases.
iii. Standard error decreases.
iv. True parameter value is farther from the null.
UNC-5.D
Interpret Type I and Type II errors. [Skill 4.B]
UNC-5.D.1 Whether a Type I or a Type II error is more consequential depends upon the situation.
UNC-5.D.2 Since the significance level, $\alpha$, is the probability of a Type I error, the consequences of a Type I error influence decisions about a significance level.
Source: College Board AP Course and Exam Description · מקור: תיאור הקורס והמבחן של College Board AP
English
Type I and Type II errors
A Type I error 第一类错误: rejecting a true$H_0$ (a false alarm). Its probability is $\alpha$.
A Type II error 第二类错误: failing to reject a false$H_0$ (a missed detection). Its probability is $\beta$.
The power 检验效能$=1-\beta$ is the chance of correctly detecting a real effect. Power rises with a larger sample, a larger effect, or a larger $\alpha$.
Describe each error and its consequence in the problem's context.
עברית
שגיאות סוג I וסוג II
שגיאת סוג I: דחיית $H_0$נכון (אזעקת שווא). הסיכוי שלה הוא $\alpha$.
שגיאת סוג II: אי-דחיית $H_0$שגוי (גילוי פסול). הסיכוי שלה הוא $\beta$.
ה-כוח$=1-\beta$ הוא הסיכוי לגלות אפקט אמיתי. הכוח עולה עם גודל מדגם גדול יותר, אפקט גדול יותר, או רמת $\alpha$ גדולה יותר.
תאר כל שגיאה והשפעתה בהקשר של הבעיה.
Explore · חקור
Two ways a test can be wrong · שתי דרכים שבהן מבחן יכול להיות שגוי
A Type I error rejects a true null (false alarm); a Type II error keeps a false null (a miss). Lowering one usually raises the other. · שגיאה מסוג I דוחה היפותזה אפסית נכונה (אזעקת שווא); שגיאה מסוג II משאירה היפותזה אפסית שגויה (פספוס). הורדת אחת בדרך כלל מגביהה את השנייה.
6.8
Confidence Interval for a Difference of Proportions · מרווח ביטחון להפרש בין פרופורציות
Syllabus · סיילבוס
English
Enduring Understanding (UNC-4): An interval of values should be used to estimate parameters, in order to account for uncertainty.
Learning Objective UNC-4.I: Identify an appropriate confidence interval procedure for a comparison of population proportions. [Skill 1.D]
UNC-4.I.1 The appropriate confidence interval procedure for a two-sample comparison of proportions for one categorical variable is a two-sample $z$-interval for a difference between population proportions.
Learning Objective UNC-4.J: Verify the conditions for calculating confidence intervals for a difference between population proportions. [Skill 4.C]
UNC-4.J.1 In order to calculate confidence intervals to estimate a difference between proportions, we must check for independence and that the sampling distribution is approximately normal:
a. To check for independence:
i. Data should be collected using two independent, random samples or a randomized experiment.
ii. When sampling without replacement, check that $n_1 \leq 10\%N_1$ and $n_2 \leq 10\%N_2$.
b. To check that sampling distribution of $\hat{p}_1 - \hat{p}_2$ is approximately normal (shape).
i. For categorical variables, check that $n_1\hat{p}_1$, $n_1(1-\hat{p}_1)$, $n_2\hat{p}_2$, and $n_2\left(1-\hat{p}_2\right)$ are all greater than or equal to some predetermined value, typically either 5 or 10.
Learning Objective UNC-4.K: Calculate an appropriate confidence interval for a comparison of population proportions. [Skill 3.D]
UNC-4.K.1 For a comparison of proportions, the interval estimate is $(\hat{p}_1 - \hat{p}_2) \pm z^* \sqrt{\dfrac{\hat{p}_1(1-\hat{p}_1)}{n_1} + \dfrac{\hat{p}_2(1-\hat{p}_2)}{n_2}}$.
Clarifying statement: Formulas for interval estimates do not appear explicitly on the AP Statistics Formula Sheet provided with the AP Statistics Exam. However, these formulas do not need to be memorized, as they can be constructed based on the general test statistic formula and the relevant standard error formulas that are provided on the formula sheet.
Learning Objective UNC-4.L: Calculate an interval estimate based on a confidence interval for a difference of proportions. [Skill 3.D]
UNC-4.L.1 Confidence intervals for a difference in proportions can be used to calculate interval estimates with specified units.
עברית
הבנה מתמשכת (UNC-4): יש להשתמש בטווח ערכים כדי להעריך פרמטרים, כדי להתחשב בחוסר ודאות.
מטרת למידה UNC-4.I: זיהוי הליך מתאים לביטחון להשוואת פרופורציות באוכלוסייה. [כישור 1.D]
UNC-4.I.1 הליך הביטחון המתאים להשוואה דו-דגימתית של פרופורציות עבור משתנה קטגוריאלי אחד הוא interval ביטחון דו-דגימתי $z$ להפרש בין פרופורציות באוכלוסייה.
מטרת למידה UNC-4.J: וידוא התנאים לחישוב intervalי ביטחון להפרש בין פרופורציות באוכלוסייה. [כישור 4.C]
UNC-4.J.1 כדי לחשב intervalי ביטחון להערכת הפרש בין פרופורציות, עלינו לבדוק עצמאות ולהבטיח שהתפלגות הדגימה היא בקירוב נורמלית:
א. לבדיקת עצמאות:
i. הנתונים צריכים להיות אספים באמצעות שני דגימות אקראיות עצמאיות או ניסוי מקרי.
ii. כאשר דוגמין ללא החזרה, יש לוודא כי $n_1 \leq 10\%N_1$ ו-stereotip $n_2 \leq 10\%N_2$.
b. לבדוק שהתפלגות הדגימה של $\hat{p}_1 - \hat{p}_2$ היא בקירוב נורמלית (צורה).
i. עבור משתנים קטגוריאליים, לבדוק ש$n_1\hat{p}_1$, $n_1(1-\hat{p}_1)$, $n_2\hat{p}_2$ ו$n_2\left(1-\hat{p}_2\right)$ כולם גדולים או שווים לערך קבוע מראש, לרוב 5 או 10.
מטרת למידה UNC-4.K: חישוב interval ביטחון מתאים להשוואת פרופורציות באוכלוסייה. [כישור 3.D]
הבהרה: נוסחאות להערכות מרווח לא מופיעות במפורש בדף הנוסחאות של AP Statistics המצורף לבחינת AP Statistics. עם זאת, אין צורך לזכור אותן כי ניתן לבנות אותן על בסיס הנוסחה הכללית לסטטיסטיקת הבדיקה ונוסחאות השגיאה הסטנדרטית הרלוונטיות המופיעות בדף הנוסחאות.
מטרת למידה UNC-4.L: חישוב הערכת interval על בסיס interval ביטחון להפרש פרופורציות. [כישור 3.D]
UNC-4.L.1 ניתן להשתמש בintervalי ביטחון להפרש פרופורציות כדי לחשב הערכות interval עם יחידות מצוינות.
Source: College Board AP Course and Exam Description · מקור: תיאור הקורס והמבחן של College Board AP
התנאים חייבים להתקיים בשני הדוגמאות, והדוגמאות חייבות להיות עצמאיות.
6.9
Justifying a Claim About Two Proportions · הנמקת טענה לגבי שתי פרופורציות
Syllabus · סיילבוס
English
Enduring Understanding (UNC-4): An interval of values should be used to estimate parameters, in order to account for uncertainty.
Learning Objective UNC-4.M: Interpret a confidence interval for a difference of proportions. [Skill 4.B]
UNC-4.M.1 In repeated random sampling with the same sample size, approximately C% of confidence intervals created will capture the difference in population proportions.
UNC-4.M.2 Interpreting a confidence interval for difference between population proportions should include a reference to the sample taken and details about the population it represents.
Learning Objective UNC-4.N: Justify a claim based on a confidence interval for a difference of proportions. [Skill 4.D]
UNC-4.N.1 A confidence interval for difference in population proportions provides an interval of values that may provide sufficient evidence to support a particular claim in context.
עברית
הבנה מתמשכת (UNC-4): יש להשתמש בטווח ערכים כדי להעריך פרמטרים, כדי להתחשב בחוסר ודאות.
מטרת למידה UNC-4.M: פרש interval ביטחון להפרש פרופורציות. [כישור 4.B]
UNC-4.M.1 בדגימות אקראיות חוזרות עם אותו גודל דגימה, כ-C% מ-intervalי הביטחון שנצרו יכללו את ההפרש בפרופורציות באוכלוסייה.
UNC-4.M.2 פירוש מרווח סמך להפרש בין פרופורציות אוכלוסייתיות צריך לכלול התייחסות לדוגמה שנלקחה ומפרטים על האוכלוסייה שהיא מייצגת.
יעד לימוד UNC-4.N: נימוק טענה על בסיס מרווח סמך להפרש של פרופורציות. [מיומנות 4.D]
UNC-4.N.1 מרווח סמך להפרש בין פרופורציות אוכלוסייתיות מספק טווח ערכים שיכול לספק ראיות מספיקות לתמיכה בטענה ספציפית בהקשר נתון.
Source: College Board AP Course and Exam Description · מקור: תיאור הקורס והמבחן של College Board AP
English
If the interval for $p_1-p_2$ contains $0$, the data are consistent with no difference; if it lies entirely above or below $0$, there is evidence of a difference (in that direction). State the direction and context.
עברית
אם המרווח עבור $p_1-p_2$ כולל $0$, הנתונים תואמים היעדר הבדל; אם הוא נמצא כולו מעל או מתחת ל$0$, קיים עיון להבדל (בכיוון זה). ציין את הכיוון וההקשר.
6.10
Setting Up a Test for a Difference · הצגת מבחן להפרש
Syllabus · סיילבוס
English
Enduring Understanding (VAR-6): The normal distribution may be used to model variation.
Learning Objective VAR-6.H: Identify the null and alternative hypotheses for a difference of two population proportions. [Skill 1.F]
VAR-6.H.1 For a two-sample test for a difference of two proportions, the null hypothesis specifies a value of $0$ for the difference in population proportions, indicating no difference or effect.
VAR-6.H.2 The null hypothesis for a difference in proportions is: $H_0 : p_1 = p_2$, or $H_0 : p_1 - p_2 = 0$.
VAR-6.H.3 A one-sided alternative hypothesis for a difference in proportions is $H_a : p_1 < p_2$, or, $H_a : p_1 > p_2$. A two-sided alternative hypothesis for a difference of proportions is $H_a : p_1 \neq p_2$.
Learning Objective VAR-6.I: Identify an appropriate testing method for the difference of two population proportions. [Skill 1.E]
VAR-6.I.1 For a single categorical variable, the appropriate testing method for the difference of two population proportions is a two-sample $z$-test for a difference between two population proportions.
Learning Objective VAR-6.J: Verify the conditions for making statistical inferences when testing a difference of two population proportions. [Skill 4.C]
VAR-6.J.1 In order to make statistical inferences when testing a difference between population proportions, we must check for independence and that the sampling distribution is approximately normal:
a. To check for independence:
i. Data should be collected using two independent, random samples or a randomized experiment.
ii. When sampling without replacement, check that $n_1 \leq 10\%N_1$ and $n_2 \leq 10\%N_2$.
b. To check that the sampling distribution of $\hat{p}_1 - \hat{p}_2$ is approximately normal (shape):
i. For the combined sample, define the combined (or pooled) proportion, $\hat{p}_c = \dfrac{n_1\hat{p}_1 + n_2\hat{p}_2}{n_1 + n_2}$. Assuming that $H_0$ is true $(p_1 - p_2 = 0$ or $p_1 = p_2)$, check that $n_1\hat{p}_c$, $n_1\left(1-\hat{p}_c\right)$, $n_2\hat{p}_c$, and $n_2\left(1-\hat{p}_c\right)$ are all greater than or equal to some predetermined value, typically either 5 or 10.
עברית
הבנה מתמשכת (VAR-6): ניתן להשתמש בחלוקה נורמלית כדי לדגם תנודות.
מטרת למידה VAR-6.H: זיהוי ההיפותזה הרווחית והחלופית להבדל בין שני פרופורציות באוכלוסיות. [מיומנות 1.F]
VAR-6.H.1 במבחן דו-דגימתי להבדל בין שני פרופורציות, ההיפותזה הרווחית מציינת ערך של $0$ להבדל בפרופורציות באוכלוסיות, המעיד על אין הבדל או אפקט.
מטרת למידה VAR-6.I: זיהוי שיטת בדיקה מתאימה להבדל בין שני פרופורציות באוכלוסיות. [מיומנות 1.E]
VAR-6.I.1 למשתנה קטגוריאלי יחיד, שיטת הבדיקה המתאימה להבדל בין שני פרופורציות באוכלוסיות היא מבחן $z$ דו-דגימתי להבדל בין שני פרופורציות באוכלוסיות.
מטרת למידה VAR-6.J: אימות התנאים לביצוע היסקים סטטיסטיים בזמן בדיקה של ההבדל בין שני פרופורציות באוכלוסיות. [מיומנות 4.C]
VAR-6.J.1 כדי לבצע מסקנות סטטיסטיות בעת בדיקת הפרש בין פרופורציות באוכלוסייה, יש לוודא עצמאות ולבדוק שההתפלגות הדגימה היא בקירוב נורמלית:
א. לבדיקת עצמאות:
i. הנתונים צריכים להיות אספים באמצעות שני דגימות אקראיות עצמאיות או ניסוי מקרי.
ii. כאשר דוגמין ללא החזרה, יש לוודא כי $n_1 \leq 10\%N_1$ ו-stereotip $n_2 \leq 10\%N_2$.
ב. לבדיקה שההתפלגות הדגימה של $\hat{p}_1 - \hat{p}_2$ היא בקירוב נורמלית (צורה):
i. עבור הדגימה המשותפת, הגדר את הפרופורציה המשותפת (או המשולבת), $\hat{p}_c = \dfrac{n_1\hat{p}_1 + n_2\hat{p}_2}{n_1 + n_2}$. בהנחה ש-stereotip $H_0$ נכון, ⟨stereo $(p_1 - p_2 = 0$⟩ או ⟨stereo $p_1 = p_2)$⟩, בדוק כי $n_1\hat{p}_c$, $n_1\left(1-\hat{p}_c\right)$, $n_2\hat{p}_c$ ו-stereotip $n_2\left(1-\hat{p}_c\right)$ כולם גדולים או שווים לערך קבוע מראש, לרוב 5 או 10.
Source: College Board AP Course and Exam Description · מקור: תיאור הקורס והמבחן של College Board AP
English
Hypotheses compare the two proportions: $H_0: p_1=p_2$ versus $H_a: p_1\neq p_2$ (or $<,>$). Because $H_0$ says the proportions are equal, use a combined (pooled) 合并 sample proportion $\hat p_c=\dfrac{\text{total successes}}{\text{total sample size}}$ to estimate the common $p$.
עברית
ההיפוטיזים משווים בין שתי הפרופורציות: $H_0: p_1=p_2$ מול $H_a: p_1\neq p_2$ (או $<,>$). מכיוון שהיפוזה $H_0$ אומרת שהפרופורציות שוות, השתמש בפרופורציית דוגמה משולבת (pooled)$\hat p_c=\dfrac{\text{total successes}}{\text{total sample size}}$ כדי להעריך את הפרופורציה המשותפת $p$.
6.11
Carrying Out a Test for a Difference · ביצוע מבחן להפרש
Syllabus · סיילבוס
Enduring Understanding
Learning Objective
Essential Knowledge
VAR-6
The normal distribution may be used to model variation.
VAR-6.K
Calculate an appropriate test statistic for the difference of two population proportions. [Skill 3.E]
VAR-6.K.1 The test statistic for a difference in proportions is: $z = \dfrac{(\hat{p}_1 - \hat{p}_2) - 0}{\sqrt{\hat{p}_c(1-\hat{p}_c)}\sqrt{\dfrac{1}{n_1} + \dfrac{1}{n_2}}}$, where $\hat{p}_c = \dfrac{n_1\hat{p}_1 + n_2\hat{p}_2}{n_1 + n_2}$.
Clarifying statement: The formulas for test statistics do not appear explicitly on the AP Statistics Formula Sheet provided with the AP Statistics Exam. However, these formulas do not need to be memorized, as they can be constructed based on the general test statistic formula and the standard error formulas for each of the relevant test statistics that are provided on the formula sheet.
DAT-3
Significance testing allows us to make decisions about hypotheses within a particular context.
DAT-3.C
Interpret the $p$-value of a significance test for a difference of population proportions. [Skill 4.B]
DAT-3.C.1 An interpretation of the $p$-value of a significance test for a difference of two population proportions should recognize that the $p$-value is computed by assuming that the null hypothesis is true, i.e., by assuming that the true population proportions are equal to each other.
DAT-3.D
Justify a claim about the population based on the results of a significance test for a difference of population proportions. [Skill 4.E]
DAT-3.D.1 A formal decision explicitly compares the $p$-value to the significance $\alpha$. If the $p\text{-value} \leq \alpha$, then reject the null hypothesis, $H_0 : p_1 = p_2$, or $H_0 : p_1 - p_2 = 0$. If the $p$-value $> \alpha$, then fail to reject the null hypothesis.
DAT-3.D.2 The results of a significance test for a difference of two population proportions can serve as the statistical reasoning to support the answer to a research question about the two populations that were sampled.
Source: College Board AP Course and Exam Description · מקור: תיאור הקורס והמבחן של College Board AP
Pick one and the site follows you — notes, papers, videos and practice all open on it. · בחרו נושא אחד והאתר יעקוב אחריו — הערות, מסמכים, וידאו ותרגולים פתוחים בו.
Type to search notes, lessons, code, vocabulary and past-paper questions across every subject. · הקלד כדי לחפש הערות, שיעורים, קוד, אוצר מילים ושאלות מבחנים בכל הנושאים.