مدينة تريد معرفة عدد الأشخاص الذين يدعمون سياسة جديدة. لا يمكننا سؤال الجميع، لذا نسأل مائة وعشرين عشوائياً.مائة وعشائة يقولون نعم — ستون…
English narration · English + 中文 subtitles burned in · سرد باللغة الإنجليزية · ترجمة مدمجة بالإنجليزية + الصينية
6.1
Why Be Normal? · لماذا الطبيعية؟
Syllabus · المنهج
English
Enduring Understanding (VAR-1): Given that variation may be random or not, conclusions are uncertain.
Learning Objective VAR-1.H: Identify questions suggested by variation in the shapes of distributions of samples taken from the same population. [Skill 1.A]
VAR-1.H.1 Variation in shapes of data distributions may be random or not.
العربية
الفهم الدائم (VAR-1): بما أن التباين قد يكون عشوائياً أو غير ذلك، فإن الاستنتاجات تكون غير مؤكدة.
هدف التعلم VAR-1.H: تحديد الأسئلة التي تقترحها الاختلافات في أشكال توزيعات العينات المستخرجة من نفس المجتمع. [مهارة 1.A]
VAR-1.H.1 قد تكون الاختلافات في أشكال توزيعات البيانات عشوائية أو غير عشوائية.
Source: College Board AP Course and Exam Description · المصدر: وصف دورة وامتحان College Board AP
English
Because a sample proportion $\hat{p}$ is approximately normally distributed (when the conditions hold), we can measure how far a sample result is from a claimed value in standard errors, and turn that into a probability. This is what makes inference 推断 – drawing conclusions about a population from a sample – possible.
العربية
لأن نسبة العينة $\hat{p}$ موزعة طبيعياً تقريباً (عندما تنطبق الشروط)، يمكننا قياس مدى تباعد نتيجة العينة عن قيمة مدّعى بها بالأخطاء المعيارية، وتحويل ذلك إلى احتمال. هذا هو ما يجعل الاستدلال – استخلاص استنتاجات حول مجتمع من عينة – ممكناً.
6.2
Confidence Interval for a Proportion · فترة الثقة لنسبة
Syllabus · المنهج
English
Enduring Understanding (UNC-4): An interval of values should be used to estimate parameters, in order to account for uncertainty.
Learning Objective UNC-4.A: Identify an appropriate confidence interval procedure for a population proportion. [Skill 1.D]
UNC-4.A.1 The appropriate confidence interval procedure for a one-sample proportion for one categorical variable is a one sample $z$-interval for a proportion.
Learning Objective UNC-4.B: Verify the conditions for calculating confidence intervals for a population proportion. [Skill 4.C]
UNC-4.B.1 In order to make assumptions necessary for inference on population proportions, means, and slopes, we must check for independence in data collection methods and for selection of the appropriate sampling distribution.
UNC-4.B.2 In order to calculate a confidence interval to estimate a population proportion, $p$, we must check for independence and that the sampling distribution is approximately normal.
a. To check for independence:
i. Data should be collected using a random sample or a randomized experiment.
ii. When sampling without replacement, check that $n \leq 10\%N$, where $N$ is the size of the population.
b. To check that the sampling distribution of $\hat{p}$ is approximately normal (shape):
i. For categorical variables, check that both the number of successes, $n\hat{p}$, and the number of failures, $n(1-\hat{p})$ are at least 10 so that the sample size is large enough to support an assumption of normality.
Learning Objective UNC-4.C: Determine the margin of error for a given sample size and an estimate for the sample size that will result in a given margin of error for a population proportion. [Skill 3.D]
UNC-4.C.1 Based on sample data, the standard error of a statistic is an estimate for the standard deviation for the statistic. The standard error of $\hat{p}$ is $SE_{\hat{p}} = \sqrt{\dfrac{\hat{p}(1-\hat{p})}{n}}$.
UNC-4.C.2 A margin of error gives how much a value of a sample statistic is likely to vary from the value of the corresponding population parameter.
UNC-4.C.3 For categorical variables, the margin of error is the critical value ($z^*$) times the standard error (SE) of the relevant statistic, which equals $z^* \sqrt{\dfrac{\hat{p}(1-\hat{p})}{n}}$ for a one sample proportion.
UNC-4.C.4 The formula for margin of error can be rearranged to solve for $n$, the minimum sample size needed to achieve a given margin of error. For this purpose, use a guess for $\hat{p}$ or use $\hat{p} = 0.5$ in order to find an upper bound for the sample size that will result in a given margin of error.
Learning Objective UNC-4.D: Calculate an appropriate confidence interval for a population proportion. [Skill 3.D]
UNC-4.D.1 In general, an interval estimate can be constructed as point estimate ± (margin of error). For a one-sample proportion, the interval estimate is $\hat{p} \pm z^* \sqrt{\dfrac{\hat{p}(1-\hat{p})}{n}}$.
Clarifying statement: Formulas for interval estimates do not appear explicitly on the AP Statistics Formula Sheet provided with the AP Statistics Exam. However, these formulas do not need to be memorized, as they can be constructed based on the general test statistic formula and the relevant standard error formulas that are provided on the formula sheet.
UNC-4.D.2 Critical values represent the boundaries encompassing the middle C% of the standard normal distribution, where C% is an approximate confidence level for a proportion.
Learning Objective UNC-4.E: Calculate an interval estimate based on a confidence interval for a population proportion. [Skill 3.D]
UNC-4.E.1 Confidence intervals for population proportions can be used to calculate interval estimates with specified units.
العربية
الفهم الدائم (UNC-4): يجب استخدام فترة من القيم لتقدير المعايير، وذلك لحساب عدم اليقين.
هدف التعلم UNC-4.A: تحديد إجراء فترة ثقة مناسب لنسبة مجتمع. [مهارة 1.D]
UNC-4.A.1 الإجراء المناسب لفترة الثقة لنسبة عينة واحدة لمتغير تصنيفي واحد هو فترة $z$ لعينة واحدة لنسبة.
هدف التعلم UNC-4.B: التحقق من شروط حساب فترات الثقة لنسبة مجتمع. [مهارة 4.C]
UNC-4.B.1 لكي نتمكن من وضع الافتراضات اللازمة للاستدلال على نسب المجتمع، والمتوسطات، والميول، يجب أن نتحقق من الاستقلالية في طرق جمع البيانات ومن اختيار توزيع العينات المناسب.
UNC-4.B.2 لحساب فترة ثقة لتقدير نسبة المجتمع $p$، يجب التحقق من الاستقلالية وأن يكون توزيع العينات مقاربًا للتوزيع الطبيعي.
أ. للتحقق من الاستقلال:
i. يجب جمع البيانات باستخدام عينة عشوائية أو تجربة عشوائية.
ii. عند العينة بدون إرجاع، تحقق من أن $n \leq 10\%N$، حيث $N$ هو حجم المجتمع.
ب. للتحقق من أن التوزيع المعايني لـ $\hat{p}$ تقريبًا طبيعي (الشكل):
i. للمتغيرات التصنيفية، تحقق من أن عدد النجاحات $n\hat{p}$ وعدد الفشل $n(1-\hat{p})$ كلاهما لا يقل عن 10 حتى تكون حجم العينة كبيرًا بما يكفي لدعم افتراض التوزيع الطبيعي.
الهدف التعليمي UNC-4.C: تحديد هامش الخطأ لعينة بحجم محدد وتقدير لحجم العينة الذي سيؤدي إلى هامش خطأ معين لنسبة المجتمع. [مهارة 3.D]
UNC-4.C.1 بناءً على بيانات العينة، فإن الخطأ المعياري للإحصاء هو تقدير للانحراف المعياري لذلك الإحصاء. الخطأ المعياري لـ $\hat{p}$ هو $SE_{\hat{p}} = \sqrt{\dfrac{\hat{p}(1-\hat{p})}{n}}$.
UNC-4.C.2 يعطي هامش الخطأ مقدار التباين المحتمل لقيمة إحصاء العينة عن قيمة المعامل المقابل للمجتمع.
UNC-4.C.3 للمتغيرات التصنيفية، هامش الخطأ هو القيمة الحرجة ($z^*$) مضروبة في الخطأ المعياري (SE) للإحصاء المعني، والذي يساوي $z^* \sqrt{\dfrac{\hat{p}(1-\hat{p})}{n}}$ لنسبة عينة واحدة.
UNC-4.C.4 يمكن إعادة ترتيب صيغة هامش الخطأ لإيجاد $n$، وهو الحد الأدنى لحجم العينة المطلوب لتحقيق هامش خطأ معين. لهذا الغرض، استخدم تخمينًا لـ $\hat{p}$ أو استخدم $\hat{p} = 0.5$ لإيجاد حد أعلى لحجم العينة الذي سيؤدي إلى هامش خطأ معين.
الهدف التعليمي UNC-4.D: حساب فترة ثقة مناسبة لنسبة المجتمع. [مهارة 3.D]
UNC-4.D.1 بشكل عام، يمكن بناء تقدير للفترة كالتقدير النقطي ± (هامش الخطأ). لنسبة عينة واحدة، تقدير الفترة هو $\hat{p} \pm z^* \sqrt{\dfrac{\hat{p}(1-\hat{p})}{n}}$.
عبارة توضيحية: لا تظهر صيغ تقديرات الفترة بوضوح في ورقة الصيغ المرفقة لامتحان AP الإحصاء. ومع ذلك، لا حاجة لحفظ هذه الصيغ لأنها يمكن بناؤها بناءً على صيغة الإحصاء العام وصيغ الأخطاء المعيارية ذات الصلة المدرجة في ورقة الصيغ.
UNC-4.D.2 تمثل القيم الحرجة الحدود التي تحيط بـ C% الوسطى من التوزيع الطبيعي المعياري، حيث C% هو مستوى ثقة تقريبياً لنسبة ما.
الهدف التعليمي UNC-4.E: حساب تقدير لفترة مبنية على فترة ثقة لنسبة المجتمع. [مهارة 3.D]
UNC-4.E.1 يمكن استخدام فترات الثقة لنسب المجتمع لحساب تقديرات فترات بوحدات محددة.
Source: College Board AP Course and Exam Description · المصدر: وصف دورة وامتحان College Board AP
English
What a confidence interval means
A confidence interval 置信区间 estimates the parameter as a range: statistic $\pm$margin of error 误差幅度.
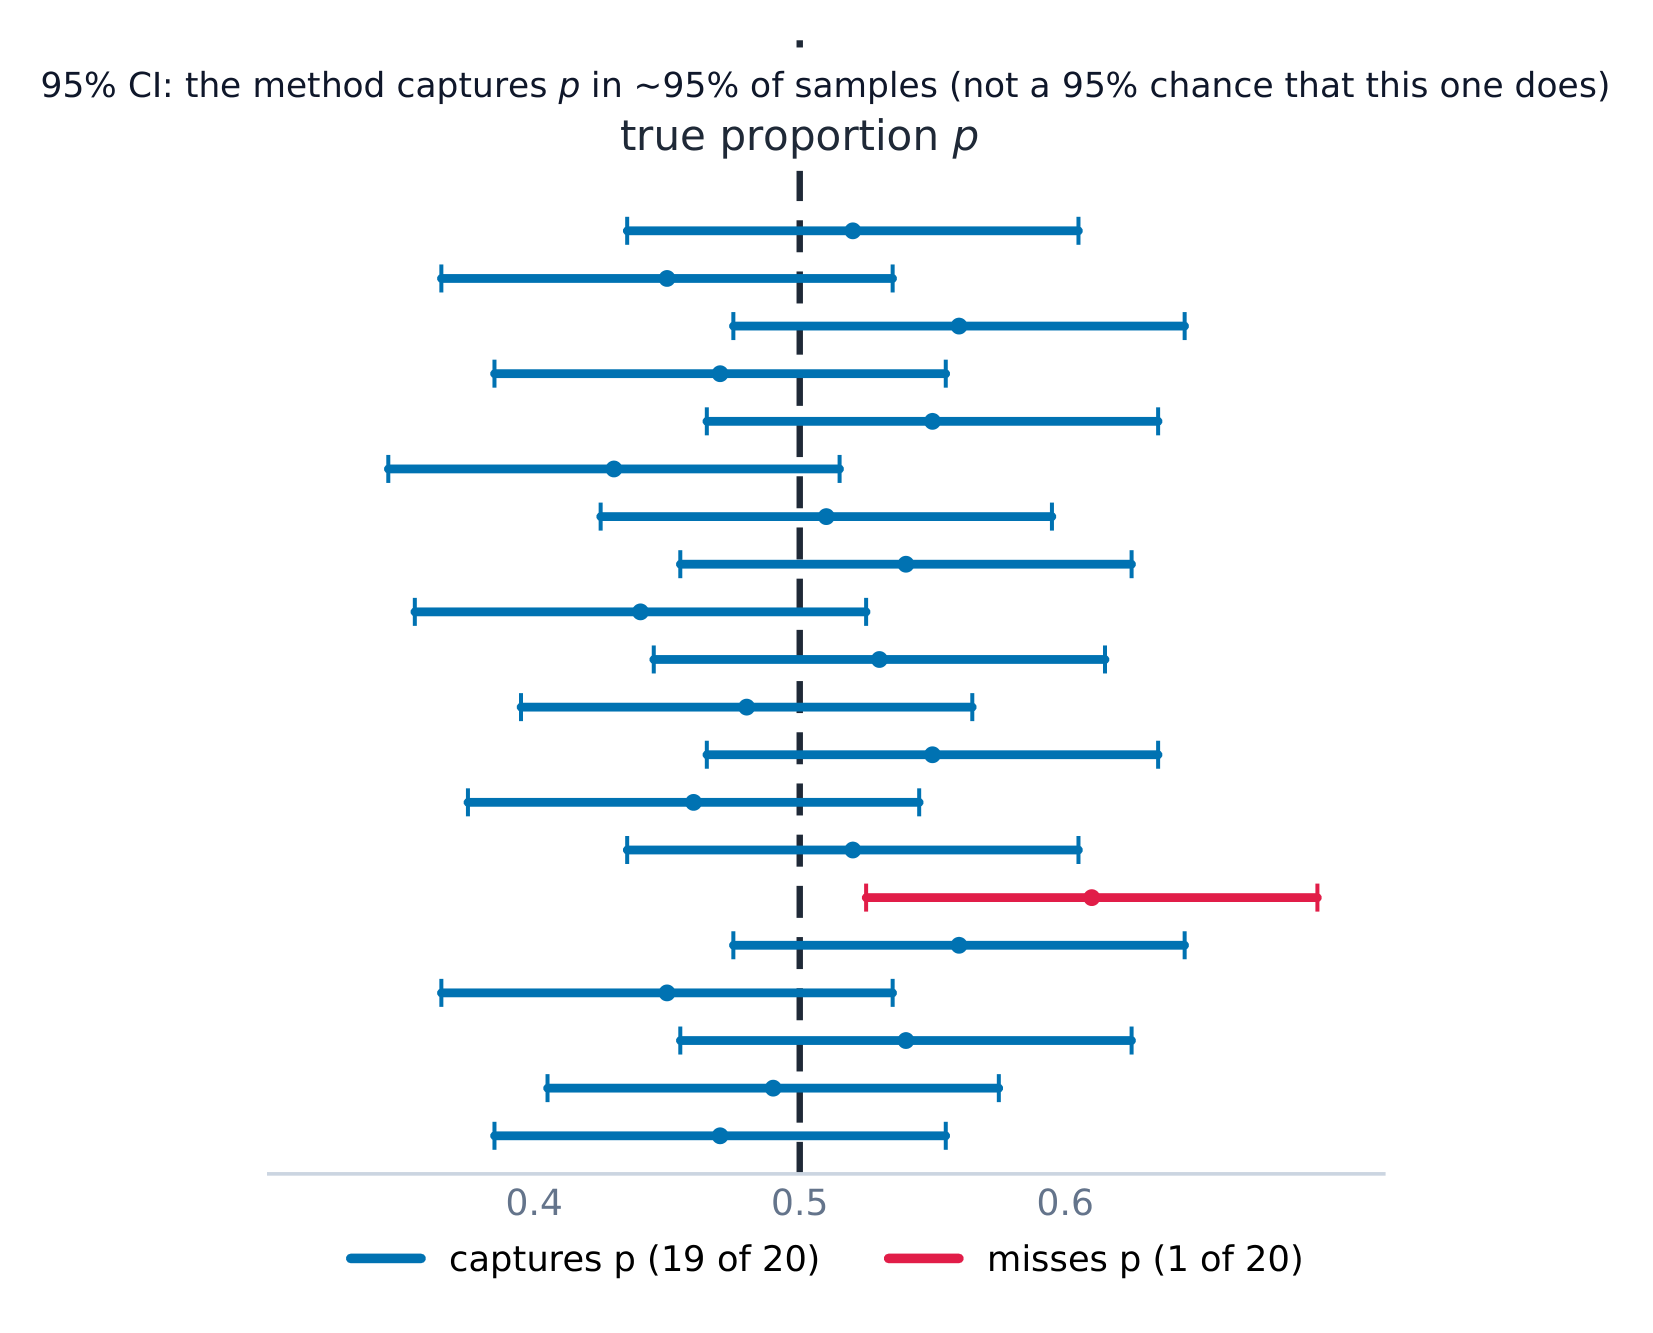
$z^{*}$ is the critical value for the confidence level 置信水平 (e.g. $1.96$ for 95%). Conditions: random sample, Large Counts ($n\hat p\ge 10$ and $n(1-\hat p)\ge 10$), and the 10% condition. Interpret it: "We are 95% confident the true proportion of... is between... and...". Interpret the level: "In 95% of samples, this method produces an interval that captures the true proportion."
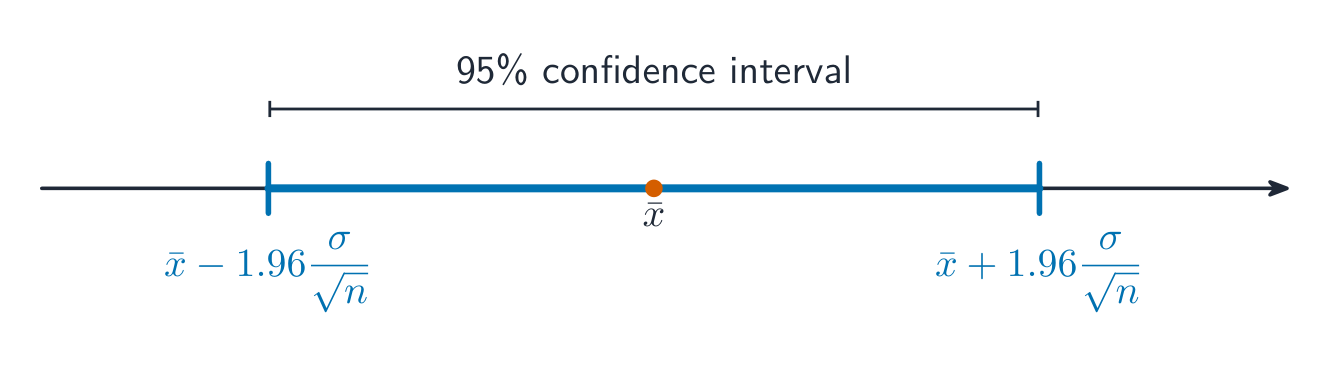
Worked example. In a random sample of $200$ people, $120$ support a policy, so $\hat{p}=0.60$. A $95\%$ interval uses $z^*=1.96$:
We are $95\%$ confident the true proportion of supporters is between $53.2\%$ and $66.8\%$.
Choosing the sample size. To keep the margin of error no larger than a target $m$, set $z^{*}\sqrt{\dfrac{\hat p(1-\hat p)}{n}}\le m$ and solve for $n$. When you have no estimate of $\hat p$, use $\hat p=0.5$: it makes $\hat p(1-\hat p)$ as large as possible, giving the safe (largest) required sample size. Always round the result up to the next whole person.
Worked example. How many people must you survey for a $95\%$ interval with margin of error at most $0.03$? Using $\hat p=0.5$ and $z^*=1.96$:
$z^{*}$ هي القيمة الحرجة لمستوى الثقة (مثلاً $1.96$ لـ 95٪). الشروط: عشوائي العينة، عدد كبير ($n\hat p\ge 10$ و $n(1-\hat p)\ge 10$)، وشروط 10٪. تفسيرها: "نحن واثقون بنسبة 95٪ أن النسبة الحقيقية لـ... تقع بين... و...". تفسير المستوى: "في 95٪ من العينات، تنتج هذه الطريقة فترة تلتقط النسبة الحقيقية.".
على مدى العديد من العينات، تلتقط حوالي 95٪ من فترات الثقة 95٪ النسبة الحقيقية
مثال محلول. في عينة عشوائية تضم $200$ شخصًا، يدعم $120$ سياسة معينة، إذن $\hat{p}=0.60$. تستخدم فترة ثقة $95\%$ القيمة $z^*=1.96$:
نحن واثقون بنسبة $95\%$ أن النسبة الحقيقية للداعمين تقع بين $53.2\%$ و$66.8\%$.
تصل فترة ثقة 95% إلى 1.96 أخطاء معيارية على كل جانب من التقدير
اختيار حجم العينة. للحفاظ على هامش الخطأ لا يتجاوز هدفًا $m$، ضع $z^{*}\sqrt{\dfrac{\hat p(1-\hat p)}{n}}\le m$ وحل لإيجاد $n$. عندما لا يكون لديك تقدير لـ$\hat p$، استخدم $\hat p=0.5$: لأنه يجعل $\hat p(1-\hat p)$ كبيرًا قدر الإمكان، مما يعطي حجم العينة المطلوب (الآمن/الأكبر). قم دائمًا بتقريب النتيجة للأعلى إلى أقرب عدد صحيح من الأشخاص.
مثال محلول. كم عدد الأشخاص الذين يجب استطلاع رأيهم للحصول على فترة $95\%$ بهامش خطأ لا exceeds $0.03$؟ باستخدام $\hat p=0.5$ و$z^*=1.96$:
Justifying a Claim from an Interval · تبرير ادعاء بناءً على فترة
Syllabus · المنهج
English
Enduring Understanding (UNC-4): An interval of values should be used to estimate parameters, in order to account for uncertainty.
Learning Objective UNC-4.F: Interpret a confidence interval for a population proportion. [Skill 4.B]
UNC-4.F.1 A confidence interval for a population proportion either contains the population proportion or it does not, because each interval is based on random sample data, which varies from sample to sample.
UNC-4.F.2 We are C% confident that the confidence interval for a population proportion captures the population proportion.
UNC-4.F.3 In repeated random sampling with the same sample size, approximately C% of confidence intervals created will capture the population proportion.
UNC-4.F.4 Interpreting a confidence interval for a one-sample proportion should include a reference to the sample taken and details about the population it represents.
Illustrative examples for UNC-4.F.4: For interpreting a 99% confidence interval of (0.268, 0.292), based on the proportion of a nationally representative sample of twelfth-grade students who answered a particular multiple choice question correctly: "We are 99 percent confident that the interval from 0.268 to 0.292 contains the population proportion of all United States twelfth-grade students who would answer this question correctly" (2011 FRQ 6(a)).
Learning Objective UNC-4.G: Justify a claim based on a confidence interval for a population proportion. [Skill 4.D]
UNC-4.G.1 A confidence interval for a population proportion provides an interval of values that may provide sufficient evidence to support a particular claim in context.
Learning Objective UNC-4.H: Identify the relationships between sample size, width of a confidence interval, confidence level, and margin of error for a population proportion. [Skill 4.A]
UNC-4.H.1 When all other things remain the same, the width of the confidence interval for a population proportion tends to decrease as the sample size increases. For a population proportion, the width of the interval is proportional to $\dfrac{1}{\sqrt{n}}$.
UNC-4.H.2 For a given sample, the width of the confidence interval for a population proportion increases as the confidence level increases.
UNC-4.H.3 The width of a confidence interval for a population proportion is exactly twice the margin of error.
العربية
الفهم الدائم (UNC-4): يجب استخدام فترة من القيم لتقدير المعايير، وذلك لحساب عدم اليقين.
الهدف التعليمي UNC-4.F: تفسير فترة ثقة لنسبة المجتمع. [مهارة 4.B]
UNC-4.F.1 إما أن تحتوي فترة الثقة لنسبة المجتمع على نسبة المجتمع أو لا، لأن كل فترة مبنية على بيانات عينة عشوائية، والتي تتغير من عينة لأخرى.
UNC-4.F.2 نحن واثقون بنسبة C% أن فترة الثقة لنسبة المجتمع تلتقط نسبة المجتمع.
UNC-4.F.3 في عينات عشوائية متكررة بنفس حجم العينة، ستلتقط حوالي C% من فترات الثقة المنشأة نسبة المجتمع.
UNC-4.F.4 يجب أن يتضمن تفسير فترة الثقة لنسبة عينة واحدة إشارة إلى العينة taken وتفاصيل حول المجتمع الذي تمثله.
أمثلة توضيحية لـ UNC-4.F.4: لتفسير فترة ثقة 99% وهي (0.268, 0.292)، بناءً على نسبة عينة وطنية ممثلة من طلاب الصف الثاني عشر الذين أجابوا على سؤال الاختيار من متعدد بشكل صحيح: "نحن واثقون بنسبة 99% أن الفترة من 0.268 إلى 0.292 تحتوي على نسبة المجتمع لجميع طلاب الصف الثاني عشر في الولايات المتحدة الذين سيجيبون على هذا السؤال بشكل صحيح" (السؤال الحر 2011 رقم 6(أ)).
الهدف التعليمي UNC-4.G: تبرير ادعاء بناءً على فترة ثقة لنسبة المجتمع. [مهارة 4.D]
UNC-4.G.1 توفر فترة الثقة لنسبة المجتمع مجموعة من القيم التي قد تقدم دليلاً كافياً لدعم ادعاء معين في السياق.
الهدف التعليمي UNC-4.H: تحديد العلاقات بين حجم العينة، وعرض فترة الثقة، ومستوى الثقة، وهامش الخطأ لنسبة المجتمع. [مهارة 4.A]
UNC-4.H.1 عندما تظل جميع العوامل الأخرى ثابتة، يميل عرض فترة الثقة لنسبة المجتمع إلى الانخفاض مع زيادة حجم العينة. بالنسبة لنسبة المجتمع، عرض الفترة يتناسب طردياً مع $\dfrac{1}{\sqrt{n}}$.
UNC-4.H.2 لعينة معينة، يزداد عرض فترة الثقة لنسبة المجتمع مع زيادة مستوى الثقة.
UNC-4.H.3 عرض فترة الثقة لنسبة المجتمع يساوي بالضبط ضعف هامش الخطأ.
Source: College Board AP Course and Exam Description · المصدر: وصف دورة وامتحان College Board AP
English
To judge a claimed value: if it lies inside the interval, the data are consistent with it; if it lies outside, the data give evidence against it. Base the conclusion on whether the plausible values include the claim, in context.
العربية
لتقييم قيمة مُدّعى عليها: إذا كانت داخل الفترة، فإن البيانات متسقة معها؛ وإذا كانت خارجها، فإن البيانات تقدم دليلاً ضدها. استند إلى结论 على ما إذا كانت القيم المعقولة تشمل الادعاء، وذلك في السياق.
6.4
Setting Up a Test for a Proportion · إعداد اختبار لنسبة
Syllabus · المنهج
English
Enduring Understanding (VAR-6): The normal distribution may be used to model variation.
Learning Objective VAR-6.D: Identify the null and alternative hypotheses for a population proportion. [Skill 1.F]
VAR-6.D.1 The null hypothesis is the situation that is assumed to be correct unless evidence suggests otherwise, and the alternative hypothesis is the situation for which evidence is being collected.
VAR-6.D.2 For hypotheses about parameters, the null hypothesis contains an equality reference (=, ≥, or ≤), while the alternative hypothesis contains a strict inequality (<, >, or ≠). The type of inequality in the alternative hypothesis is based on the question of interest. Alternative hypotheses with < or > are called one-sided, and alternative hypotheses with ≠ are called two-sided. Although the null hypothesis for a one-sided test may include an inequality symbol, it is still tested at the boundary of equality.
VAR-6.D.3 The null hypothesis for a population proportion is: $H_0 : p = p_0$, where $p_0$ is the null hypothesized value for the population proportion.
VAR-6.D.4 A one-sided alternative hypothesis for a proportion is either $H_a : p < p_0$ or $H_a : p > p_0$. A two-sided alternate hypothesis is $H_a : p_1 \neq p_2$.
VAR-6.D.5 For a one-sample $z$-test for a population proportion, the null hypothesis specifies a value for the population proportion, usually one indicating no difference or effect.
Learning Objective VAR-6.E: Identify an appropriate testing method for a population proportion. [Skill 1.E]
VAR-6.E.1 For a single categorical variable, the appropriate testing method for a population proportion is a one-sample $z$-test for a population proportion.
Learning Objective VAR-6.F: Verify the conditions for making statistical inferences when testing a population proportion. [Skill 4.C]
VAR-6.F.1 In order to make statistical inferences when testing a population proportion, we must check for independence and that the sampling distribution is approximately normal:
a. To check for independence:
i. Data should be collected using a random sample or a randomized experiment.
ii. When sampling without replacement, check that $n \leq 10\%N$.
b. To check that the sampling distribution of $\hat{p}$ is approximately normal (shape):
i. Assuming that $H_0$ is true $(p = p_0)$, verify that both the number of successes, $np_0$, and the number of failures, $n(1-p_0)$ are at least 10 so that that the sample size is large enough to support an assumption of normality.
العربية
فهم دائم (VAR-6): يمكن استخدام التوزيع الطبيعي لنمذجة التنوع.
الهدف التعليمي VAR-6.D: تحديد فرضية الصفر والافتراض البديل لنسبة المجتمع. [مهارة 1.F]
VAR-6.D.1 فرضية الصفر هي الوضع الذي يُفترض أنه صحيح ما لم تشير الأدلة إلى العكس، وفرضية البديل هي الوضع الذي يتم جمع الأدلة له.
VAR-6.D.2 بالنسبة للفرضيات حول المعلمات، تحتوي الفرضية الصفرية على مرجع يساوي (=, ≥, أو ≤)، بينما تحتوي الفرضية البديلة على عدم مساواة صارمة (<, >, أو ≠). يعتمد نوع عدم المساواة في الفرضية البديلة على سؤال البحث. تسمى الفرضيات البديلة ذات < or > أحادية الجانب، والفرضيات البديلة ذات ≠ ثنائية الجانب. على الرغم من أن الفرضية الصفرية للاختبار أحادي الجانب قد تتضمن رمز عدم مساواة، إلا أنها تُختبر دائمًا عند حدود التساوي.
VAR-6.D.3 الفرضية الصفرية لنسبة المجتمع هي: $H_0 : p = p_0$، حيث $p_0$ هي القيمة المفترضة صفرًا لنسبة المجتمع.
VAR-6.D.4 الفرضية البديلة أحادية الجانب للنسبة تكون إما $H_a : p < p_0$ أو $H_a : p > p_0$. أما الفرضية البديلة ثنائية الجانب فهي $H_a : p_1 \neq p_2$.
VAR-6.D.5 بالنسبة لاختبار $z$ لعينة واحدة لنسبة المجتمع، تحدد الفرضية الصفرية قيمة لنسبة المجتمع، وعادة ما تكون قيمة تدل على عدم وجود فرق أو تأثير.
هدف التعلم VAR-6.E: تحديد طريقة اختبار مناسبة لنسبة المجتمع. [مهارة 1.E]
VAR-6.E.1 بالنسبة لمتغير تصنيفي واحد، فإن طريقة الاختبار المناسبة لنسبة المجتمع هي اختبار $z$ لعينة واحدة لنسبة المجتمع.
هدف التعلم VAR-6.F: التحقق من شروط إجراء الاستدلالات الإحصائية عند اختبار نسبة المجتمع. [مهارة 4.C]
VAR-6.F.1 من أجل إجراء استدلالات إحصائية عند اختبار نسبة المجتمع، يجب التحقق من الاستقلال وأن التوزيع العيني تقريبي طبيعي:
أ. للتحقق من الاستقلال:
i. يجب جمع البيانات باستخدام عينة عشوائية أو تجربة عشوائية.
ii. عند أخذ العينات بدون إرجاع، تأكد من أن $n \leq 10\%N$.
ب. للتحقق من أن التوزيع المعايني لـ $\hat{p}$ تقريبًا طبيعي (الشكل):
i. بافتراض أن $H_0$ صحيحة $(p = p_0)$، تحقق من أن عدد النجاحات، $np_0$، وعدد الفشل، $n(1-p_0)$ كلاهما 10 على الأقل بحيث تكون حجم العينة كبيرًا بما يكفي لدعم افتراض الطبيعية.
Source: College Board AP Course and Exam Description · المصدر: وصف دورة وامتحان College Board AP
English
A significance test 显著性检验 weighs evidence against a claim. State a null hypothesis 原假设$H_0$ and an alternative hypothesis 备择假设$H_a$ about the parameter $p$:
Check the same conditions (random, Large Counts using $p_0$, 10%). The test statistic 检验统计量 counts standard errors from $p_0$:
$$z=\frac{\hat p-p_0}{\sqrt{p_0(1-p_0)/n}}.$$
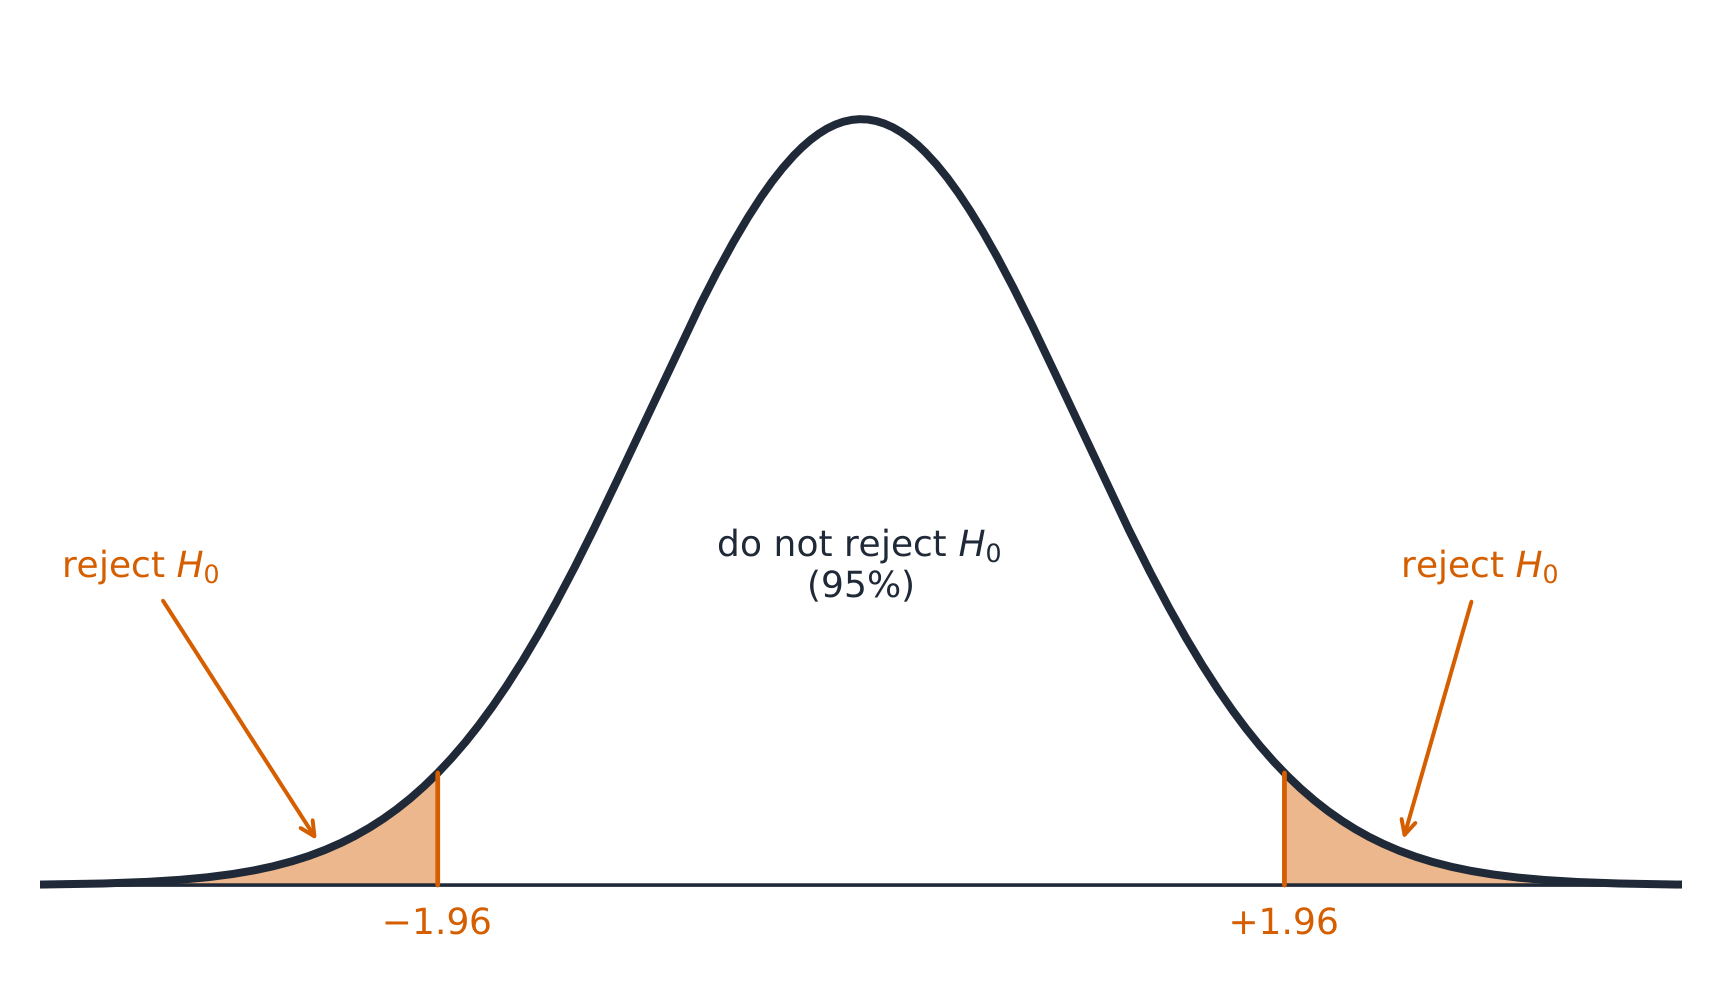
Worked example. A company claims $90\%$ satisfaction ($p_0=0.90$); a sample of $100$ finds $84$ satisfied ($\hat{p}=0.84$). Test $H_0:p=0.90$ vs $H_a:p\neq0.90$ at $\alpha=0.05$:
giving a two-tailed $p$-value of about $2(0.023)=0.046$. Since $0.046<0.05$, reject $H_0$ – there is evidence the true satisfaction rate differs from (is below) $90\%$.
العربية
يوزن اختبار الدلالة الأدلة ضد ادعاء ما. صغ فرضية الصفر$H_0$ والفرضية البديلة$H_a$ حول المعامل $p$:
تحقق من نفس الشروط (عشوائي، عدود كبيرة باستخدام $p_0$، 10%). يُحسب إحصاء الاختبار بعدد الأخطاء المعيارية من $p_0$:
$$z=\frac{\hat p-p_0}{\sqrt{p_0(1-p_0)/n}}.$$
مثال محلول. تدعي شركة أن $90\%$ الرضا ($p_0=0.90$)؛ عينة من $100$ وجدت $84$ راضية ($\hat{p}=0.84$). اختبر $H_0:p=0.90$ مقابل $H_a:p\neq0.90$ عند $\alpha=0.05$:
مقدِّمًا قيمة $p$ ذيلين تقاربها $2(0.023)=0.046$. بما أن $0.046<0.05$، ارفض $H_0$ – هناك دليل على أن معدل الرضا الحقيقي يختلف عن (أو أقل من) $90\%$.
اختبار ذيلين بنسبة 5% يرفض الفرضية الصفرية في الذيلين المظللين
6.5
Interpreting p-Values · تفسير قيم p
Syllabus · المنهج
English
Enduring Understanding (VAR-6): The normal distribution may be used to model variation.
Learning Objective VAR-6.G: Calculate an appropriate test statistic and $p$-value for a population proportion. [Skill 3.E]
VAR-6.G.1 The distribution of the test statistic assuming the null hypothesis is true (null distribution) can be either a randomization distribution or when a probability model is assumed to be true, a theoretical distribution ($z$).
VAR-6.G.2 When using a $z$-test, the standardized test statistic can be written: $\text{test statistic} = \dfrac{\text{sample statistic} - \text{null value of the parameter}}{\text{standard deviation of the statistic}}$. This is called a $z$-statistic for proportions.
VAR-6.G.3 The test statistic for a population proportion is: $z = \dfrac{\hat{p} - p_0}{\sqrt{\dfrac{p_0(1-p_0)}{n}}}$.
Clarifying statement: The formulas for test statistics do not appear explicitly on the AP Statistics Formula Sheet provided with the AP Statistics Exam. However, these formulas do not need to be memorized, as they can be constructed based on the general test statistic formula and the relevant standard error formulas that are provided on the formula sheet.
VAR-6.G.4 A $p$-value is the probability of obtaining a test statistic as extreme or more extreme than the observed test statistic when the null hypothesis and probability model are assumed to be true. The significance level may be given or determined by the researcher.
Enduring Understanding (DAT-3): Significance testing allows us to make decisions about hypotheses within a particular context.
Learning Objective DAT-3.A: Interpret the $p$-value of a significance test for a population proportion. [Skill 4.B]
DAT-3.A.1 The $p$-value is the proportion of values for the null distribution that are as extreme or more extreme than the observed value of the test statistic. This is:
a. The proportion at or above the observed value of the test statistic, if the alternative is >.
b. The proportion at or below the observed value of the test statistic, if the alternative is <.
c. The proportion less than or equal to the negative of the absolute value of the test statistic plus the proportion greater than or equal to the absolute value of the test statistic, if the alternative is ≠.
DAT-3.A.2 An interpretation of the $p$-value of a significance test for a one-sample proportion should recognize that the $p$-value is computed by assuming that the probability model and null hypothesis are true, i.e., by assuming that the true population proportion is equal to the particular value stated in the null hypothesis.
العربية
فهم دائم (VAR-6): يمكن استخدام التوزيع الطبيعي لنمذجة التنوع.
هدف التعلم VAR-6.G: حساب إحصاء اختبار مناسب وقيمة $p$ لنسبة المجتمع. [مهارة 3.E]
VAR-6.G.1 توزيع إحصاء الاختبار بافتراض صحة الفرضية الصفرية (التوزيع الصفري) يمكن أن يكون إما توزيع عشوائي أو، عندما يُفترض نموذج احتمالي صحيح، توزيع نظري ($z$).
VAR-6.G.2 عند استخدام اختبار $z$، يمكن كتابة إحصاء الاختيار المعيار化: $\text{test statistic} = \dfrac{\text{sample statistic} - \text{null value of the parameter}}{\text{standard deviation of the statistic}}$. هذا يسمى إحصاء $z$ للنسب.
عبارة توضيحية: لا تظهر صيغ إحصاءات الاختبار صراحةً في ورقة صيغ AP للإحصاء المرفقة باختبار AP للإحصاء. ومع ذلك، لا حاجة لحفظ هذه الصيغ لأنها يمكن بناؤها بناءً على صيغة إحصاء الاختبار العامة وصيغ الخطأ المعياري ذات الصلة الموضحة في ورقة الصيغ.
VAR-6.G.4 قيمة $p$ هي احتمال الحصول على إحصاء اختبار بحدة أكبر أو مساوٍ لإحصاء الاختبار المرصود عندما يُفترض صحة الفرضية الصفرية ونموذج الاحتمال. قد يتم إعطاء مستوى الدلالة أو تحديده من قبل الباحث.
الفهم الدائم (DAT-3): يسمح اختبار الأهمية باتخاذ قرارات بشأن الفرضيات ضمن سياق معين.
هدف التعلم DAT-3.A: تفسير قيمة $p$ لاختبار دلالة لنسبة المجتمع. [مهارة 4.B]
DAT-3.A.1 قيمة $p$ هي نسبة قيم التوزيع الصفري التي تساوي الحدة أو تتجاوز حدة القيمة المرصودة لإحصاء الاختبار. وهذا:
a. النسبة عند أو فوق القيمة المرصودة لإحصاء الاختبار، إذا كانت الفرضية البديلة >.
b. النسبة عند أو تحت القيمة المرصودة لإحصاء الاختبار، إذا كانت الفرضية البديلة <.
c. النسبة أقل من أو تساوي سالب القيمة المطلقة لإحصاء الاختبار زائد النسبة أكبر من أو تساوي القيمة المطلقة لإحصاء الاختبار، إذا كانت الفرضية البديلة ≠.
DAT-3.A.2 يجب أن يعترف تفسير قيمة $p$ لاختبار دلالة لنسبة عينة واحدة بأن قيمة $p$ يتم حسابها بافتراض أن نموذج الاحتمالفرضية الصفرية صحيحة، أي بافتراض أن نسبة المجتمع الحقيقية تساوي القيمة المحددة في الفرضية الصفرية.
Source: College Board AP Course and Exam Description · المصدر: وصف دورة وامتحان College Board AP
English
What a p-value means
The $p$-value P值 is the probability of getting a sample result as extreme or more extreme than the observed one, assuming $H_0$ is true. A small $p$-value means the data would be surprising if $H_0$ held – evidence against $H_0$. It is not the probability that $H_0$ is true.
العربية
ماذا تعني قيمة p
قيمة $p$ P هي احتمال الحصول على نتيجة عينة بشدة أو أكثر شدة من تلك المرصودة، بافتراض صحة $H_0$. صغر قيمة $p$ يعني أن البيانات ستكون مفاجئة إذا كان $H_0$ صحيحًا – دليل ضد $H_0$. إنها ليست احتمال صحة $H_0$.
Explore · استكشف
A p-value as a tail area · قيمة p كمنطقة ذيل
A p-value is the probability, if the null hypothesis were true, of a result at least this extreme — the shaded tail area. Small p-values cast doubt on the null. · قيمة p هي الاحتمال، إذا كانت الفرضية الصفرية صحيحة، لنتيجة حادة على الأقل بهذه الدرجة — وهي منطقة الذيل المظللة. قيم p الصغيرة تثير الشكوك حول الفرضية الصفرية.
Enduring Understanding (DAT-3): Significance testing allows us to make decisions about hypotheses within a particular context.
Learning Objective DAT-3.B: Justify a claim about the population based on the results of a significance test for a population proportion. [Skill 4.E]
DAT-3.B.1 The significance level, $\alpha$, is the predetermined probability of rejecting the null hypothesis given that it is true.
DAT-3.B.2 A formal decision explicitly compares the $p$-value to the significance level, $\alpha$. If the $p$-value $\leq \alpha$, reject the null hypothesis. If the $p$-value $> \alpha$, fail to reject the null hypothesis.
DAT-3.B.3 Rejecting the null hypothesis means there is sufficient statistical evidence to support the alternative hypothesis. Failing to reject the null means there is insufficient statistical evidence to support the alternative hypothesis.
DAT-3.B.4 The conclusion about the alternative hypothesis must be stated in context.
DAT-3.B.5 A significance test can lead to rejecting or not rejecting the null hypothesis, but can never lead to concluding or proving that the null hypothesis is true. Lack of statistical evidence for the alternative hypothesis is not the same as evidence for the null hypothesis.
DAT-3.B.6 Small $p$-values indicate that the observed value of the test statistic would be unusual if the null hypothesis and probability model were true, and so provide evidence for the alternative. The lower the $p$-value, the more convincing the statistical evidence for the alternative hypothesis.
DAT-3.B.7$p$-values that are not small indicate that the observed value of the test statistic would not be unusual if the null hypothesis and probability model were true, so do not provide convincing statistical evidence for the alternative hypothesis nor do they provide evidence that the null hypothesis is true.
DAT-3.B.8 A formal decision explicitly compares the $p$-value to the significance $\alpha$. If the $p$-value $\leq \alpha$, then reject the null hypothesis, $H_0 : p = p_0$. If the $p$-value $> \alpha$, then fail to reject the null hypothesis.
DAT-3.B.9 The results of a significance test for a population proportion can serve as the statistical reasoning to support the answer to a research question about the population that was sampled.
العربية
الفهم الدائم (DAT-3): يسمح اختبار الأهمية باتخاذ قرارات بشأن الفرضيات ضمن سياق معين.
هدف التعلم DAT-3.B: تبرير ادعاء حول المجتمع بناءً على نتائج اختبار دلالة لنسبة المجتمع. [مهارة 4.E]
DAT-3.B.1 مستوى الدلالة، $\alpha$، هو الاحتمال المسبق لرفض الفرضية الصفرية بشرط كونها صحيحة.
DAT-3.B.2 القرار الرسمي يقارن صراحةً بين قيمة $p$ ومستوى الدلالة، $\alpha$. إذا كانت قيمة $p$$\leq \alpha$، ارفض الفرضية الصفرية. إذا كانت قيمة $p$$> \alpha$، افشل في رفض الفرضية الصفرية.
DAT-3.B.3 رفض الفرضية الصفرية يعني وجود أدلة إحصائية كافية لدعم الفرضية البديلة. فشل في رفض الفرضية الصفرية يعني عدم وجود أدلة إحصائية كافية لدعم الفرضية البديلة.
DAT-3.B.4 يجب صياغة الاستنتاج الخاص بالفرضية البديلة في سياق المشكلة.
DAT-3.B.5 يمكن أن يؤدي اختبار الدلالة إلى رفض الفرضية الصفرية أو عدم رفضها، لكنه لا يمكن أبدًا أن يؤدي إلى الاستنتاج أو إثبات صحة الفرضية الصفرية. عدم وجود أدلة إحصائية للفرضية البديلة ليس نفسه كوجود أدلة للفرضية الصفرية.
DAT-3.B.6 تشير القيم $p$ الصغيرة إلى أن القيمة المرصودة لإحصاءة الاختبار ستكون غير معتادة لو كانت فرضية الصفر والنموذج الاحتمالي صحيحين، وبالتالي تقدم دليلاً على الفرضية البديلة. وكلما كانت قيمة $p$ أقل، كان الدليل الإحصائي للفرضية البديلة أكثر إقناعاً.
DAT-3.B.7 تشير قيم $p$ التي ليست صغيرة إلى أن القيمة المرصودة لإحصاءة الاختبار لن تكون غير معتادة لو كانت فرضية الصفر والنموذج الاحتمالي صحيحين، لذا لا توفر دليلاً إحصائياً مقنعاً للفرضية البديلة ولا توفر دليلاً على صحة فرضية الصفر.
DAT-3.B.8 مقارنة القرار الرسمي صراحةً بين قيمة $p$ ومستوى المعنى $\alpha$. إذا كانت قيمة $p$$\leq \alpha$، فإننا نرفض فرضية الصفر، $H_0 : p = p_0$. وإذا كانت قيمة $p$$> \alpha$، فإننا نفشل في رفض فرضية الصفر.
DAT-3.B.9 يمكن أن تعمل نتائج اختبار المعنى لنسبة المجتمع كأساس استدلالي إحصائي لدعم الإجابة على سؤال بحثي حول المجتمع الذي تم عينته.
Source: College Board AP Course and Exam Description · المصدر: وصف دورة وامتحان College Board AP
English
Compare the $p$-value to the significance level 显著性水平$\alpha$ (often $0.05$):
$p\le\alpha$: reject $H_0$ – there is convincing evidence for $H_a$.
$p>\alpha$: fail to reject $H_0$ – not enough evidence for $H_a$ (never "accept $H_0$").
Always write the conclusion in context, linking back to the claim.
العربية
قارن قيمة $p$ بـمستوى الدلالة$\alpha$ (غالبًا $0.05$):
$p\le\alpha$: ارفض $H_0$ – هناك دليل مقنع لـ $H_a$.
$p>\alpha$: لا ترفض $H_0$ – لا يوجد ما يكفي من الأدلة لـ $H_a$ (لا "تقبل $H_0$" أبدًا).
اكتب الاستنتاج دائمًا في السياق، مع العودة إلى الادعاء.
6.7
Type I and Type II Errors · أخطاء النوع الأول والنوع الثاني
Syllabus · المنهج
English
Enduring Understanding (UNC-5): Probabilities of Type I and Type II errors influence inference.
Learning Objective UNC-5.A: Identify Type I and Type II errors. [Skill 1.B]
UNC-5.A.1 A Type I error occurs when the null hypothesis is true and is rejected (false positive).
UNC-5.A.2 A Type II error occurs when the null hypothesis is false and is not rejected (false negative).
Table of Errors: With Actual Population Value across the top ($H_0$ true; $H_a$ true) and Decision down the side (Reject $H_0$; Fail to Reject $H_0$): Reject $H_0$ when $H_0$ true = Type I Error; Reject $H_0$ when $H_a$ true = Correct Decision; Fail to Reject $H_0$ when $H_0$ true = Correct Decision; Fail to Reject $H_0$ when $H_a$ true = Type II Error.
Learning Objective UNC-5.B: Calculate the probability of a Type I and Type II errors. [Skill 3.A]
UNC-5.B.1 The significance level, $\alpha$, is the probability of making a Type I error, if the null hypothesis is true.
UNC-5.B.2 The power of a test is the probability that a test will correctly reject a false null hypothesis.
UNC-5.B.3 The probability of making a Type II error $= 1 - power$.
Learning Objective UNC-5.C: Identify factors that affect the probability of errors in significance testing. [Skill 4.A]
UNC-5.C.1 The probability of a Type II error decreases when any of the following occurs, provided the others do not change:
i. Sample size(s) increases.
ii. Significance level ($\alpha$) of a test increases.
iii. Standard error decreases.
iv. True parameter value is farther from the null.
Learning Objective UNC-5.D: Interpret Type I and Type II errors. [Skill 4.B]
UNC-5.D.1 Whether a Type I or a Type II error is more consequential depends upon the situation.
UNC-5.D.2 Since the significance level, $\alpha$, is the probability of a Type I error, the consequences of a Type I error influence decisions about a significance level.
العربية
الفهم الدائم (UNC-5): تؤثر احتمالات أخطاء النوع الأول والنوع الثاني على الاستدلال.
الهدف التعليمي UNC-5.A: تحديد أخطاء النوع الأول والنوع الثاني. [مهارة 1.B]
UNC-5.A.1 يحدث خطأ النوع الأول عندما تكون فرضية الصفر صحيحة وتُرفض (إيجابي كاذب).
UNC-5.A.2 يحدث خطأ النوع الثاني عندما تكون فرضية الصفر خاطئة ولا تُرفض (سلبي كاذب).
جدول الأخطاء: مع القيمة الفعلية للسكان في الأعلى ($H_0$ صحيحة؛ $H_a$ صحيحة) والقرار على الجانب (رفض $H_0$؛ عدم رفض $H_0$): رفض $H_0$ عندما تكون $H_0$ صحيحة = خطأ النوع الأول؛ رفض $H_0$ عندما تكون $H_a$ صحيحة = قرار صحيح؛ عدم رفض $H_0$ عندما تكون $H_0$ صحيحة = قرار صحيح؛ عدم رفض $H_0$ عندما تكون $H_a$ صحيحة = خطأ النوع الثاني.
الهدف التعليمي UNC-5.B: حساب احتمالات أخطاء النوع الأول والنوع الثاني. [مهارة 3.A]
UNC-5.B.1 مستوى المعنى، $\alpha$، هو احتمال ارتكاب خطأ النوع الأول، إذا كانت فرضية الصفر صحيحة.
UNC-5.B.2 قوة الاختبار هي احتمال أن يرفض الاختبار بشكل صحيح فرضية صفر خاطئة.
UNC-5.B.3 احتمال ارتكاب خطأ النوع الثاني $= 1 - power$.
الهدف التعليمي UNC-5.C: تحديد العوامل التي تؤثر على احتمالات الأخطاء في اختبارات المعنى. [مهارة 4.A]
UNC-5.C.1 ينخفض احتمال خطأ النوع الثاني عند حدوث أي مما يلي، شريطة عدم تغير البقية:
i. زيادة حجم العينة(ات).
ii. زيادة مستوى المعنى ($\alpha$) للاختبار.
iii. انخفاض الخطأ المعياري.
iv. أن تكون القيمة الفعلية للمعامل أبعد من فرضية الصفر.
الهدف التعليمي UNC-5.D: تفسير أخطاء النوع الأول والنوع الثاني. [مهارة 4.B]
UNC-5.D.1 يعتمد ما إذا كان خطأ النوع الأول أو النوع الثاني أكثر تأثيراً على الموقف.
UNC-5.D.2 بما أن مستوى المعنى، $\alpha$، هو احتمال خطأ النوع الأول، فإن عواقب خطأ النوع الأول تؤثر على القرارات بشأن مستوى المعنى.
Source: College Board AP Course and Exam Description · المصدر: وصف دورة وامتحان College Board AP
English
Type I and Type II errors
A Type I error 第一类错误: rejecting a true$H_0$ (a false alarm). Its probability is $\alpha$.
A Type II error 第二类错误: failing to reject a false$H_0$ (a missed detection). Its probability is $\beta$.
The power 检验效能$=1-\beta$ is the chance of correctly detecting a real effect. Power rises with a larger sample, a larger effect, or a larger $\alpha$.
Describe each error and its consequence in the problem's context.
العربية
أخطاء النوع الأول والنوع الثاني
خطأ النوع الأول: رفض $H_0$صحيح (إنذار كاذب). احتماله هو $\alpha$.
خطأ النوع الثاني: عدم رفض $H_0$خاطئ (فوت الكشف). احتماله هو $\beta$.
القوة$=1-\beta$ هي فرصة اكتشاف تأثير حقيقي بشكل صحيح. تزيد القوة مع عينة أكبر، أو تأثير أكبر، أو $\alpha$ أكبر.
وصف كل خطأ وعاقبته في سياق المسألة.
Explore · استكشف
Two ways a test can be wrong · طريقتان قد يخطئ فيهما الاختبار
A Type I error rejects a true null (false alarm); a Type II error keeps a false null (a miss). Lowering one usually raises the other. · خطأ النوع الأول يرفض فرضية صفرية صحيحة (إنذار كاذب)؛ خطأ النوع الثاني يحافظ على فرضية صفرية خاطئة (فشل في الكشف). خفض أحدهما عادةً ما يرفع الآخر.
6.8
Confidence Interval for a Difference of Proportions · فترة الثقة للفرق بين النسب
Syllabus · المنهج
English
Enduring Understanding (UNC-4): An interval of values should be used to estimate parameters, in order to account for uncertainty.
Learning Objective UNC-4.I: Identify an appropriate confidence interval procedure for a comparison of population proportions. [Skill 1.D]
UNC-4.I.1 The appropriate confidence interval procedure for a two-sample comparison of proportions for one categorical variable is a two-sample $z$-interval for a difference between population proportions.
Learning Objective UNC-4.J: Verify the conditions for calculating confidence intervals for a difference between population proportions. [Skill 4.C]
UNC-4.J.1 In order to calculate confidence intervals to estimate a difference between proportions, we must check for independence and that the sampling distribution is approximately normal:
a. To check for independence:
i. Data should be collected using two independent, random samples or a randomized experiment.
ii. When sampling without replacement, check that $n_1 \leq 10\%N_1$ and $n_2 \leq 10\%N_2$.
b. To check that sampling distribution of $\hat{p}_1 - \hat{p}_2$ is approximately normal (shape).
i. For categorical variables, check that $n_1\hat{p}_1$, $n_1(1-\hat{p}_1)$, $n_2\hat{p}_2$, and $n_2\left(1-\hat{p}_2\right)$ are all greater than or equal to some predetermined value, typically either 5 or 10.
Learning Objective UNC-4.K: Calculate an appropriate confidence interval for a comparison of population proportions. [Skill 3.D]
UNC-4.K.1 For a comparison of proportions, the interval estimate is $(\hat{p}_1 - \hat{p}_2) \pm z^* \sqrt{\dfrac{\hat{p}_1(1-\hat{p}_1)}{n_1} + \dfrac{\hat{p}_2(1-\hat{p}_2)}{n_2}}$.
Clarifying statement: Formulas for interval estimates do not appear explicitly on the AP Statistics Formula Sheet provided with the AP Statistics Exam. However, these formulas do not need to be memorized, as they can be constructed based on the general test statistic formula and the relevant standard error formulas that are provided on the formula sheet.
Learning Objective UNC-4.L: Calculate an interval estimate based on a confidence interval for a difference of proportions. [Skill 3.D]
UNC-4.L.1 Confidence intervals for a difference in proportions can be used to calculate interval estimates with specified units.
العربية
الفهم الدائم (UNC-4): يجب استخدام فترة من القيم لتقدير المعايير، وذلك لحساب عدم اليقين.
الهدف التعليمي UNC-4.I: تحديد إجراء فترة ثقة مناسب لمقارنة نسب المجتمع. [مهارة 1.D]
UNC-4.I.1 الإجراء المناسب لفترة الثقة لمقارنة العينتين للنسب لمتغير تصنيفي واحد هو فترة $z$ ذات عينة واحدة لفرق نسب المجتمع.
الهدف التعليمي UNC-4.J: التحقق من شروط حساب فترات الثقة لفرق نسب المجتمع. [مهارة 4.C]
UNC-4.J.1 لحساب فترات الثقة لتقدير الفرق بين النسب، يجب التحقق من الاستقلال وأن التوزيع العشوائي للتقريب طبيعي:
أ. للتحقق من الاستقلال:
i. يجب جمع البيانات باستخدام عينتين مستقلتين وعشوائيتين أو تجربة معشاة.
ii. عند السحب بدون إرجاع، تحقق من أن $n_1 \leq 10\%N_1$ و $n_2 \leq 10\%N_2$.
ب. للتحقق من أن توزيع التقريب لـ $\hat{p}_1 - \hat{p}_2$ طبيعي تقريباً (الشكل).
i. للمتغيرات التصنيفية، تحقق من أن $n_1\hat{p}_1$، $n_1(1-\hat{p}_1)$، $n_2\hat{p}_2$، و$n_2\left(1-\hat{p}_2\right)$ جميعها أكبر من أو تساوي قيمة محددة مسبقاً، عادة إما 5 أو 10.
الهدف التعليمي UNC-4.K: حساب فترة ثقة مناسبة لمقارنة نسب المجتمع. [مهارة 3.D]
UNC-4.K.1 لمقارنة النسب، تقدير الفترة هو $(\hat{p}_1 - \hat{p}_2) \pm z^* \sqrt{\dfrac{\hat{p}_1(1-\hat{p}_1)}{n_1} + \dfrac{\hat{p}_2(1-\hat{p}_2)}{n_2}}$.
عبارة توضيحية: لا تظهر صيغ تقديرات الفترة بوضوح في ورقة الصيغ المرفقة لامتحان AP الإحصاء. ومع ذلك، لا حاجة لحفظ هذه الصيغ لأنها يمكن بناؤها بناءً على صيغة الإحصاء العام وصيغ الأخطاء المعيارية ذات الصلة المدرجة في ورقة الصيغ.
الهدف التعليمي UNC-4.L: حساب تقدير فترة مبنية على فترة ثقة لفرق النسب. [مهارة 3.D]
UNC-4.L.1 يمكن استخدام فترات الثقة لفرق النسب لحساب تقديرات فترات بوحدات محددة.
Source: College Board AP Course and Exam Description · المصدر: وصف دورة وامتحان College Board AP
يجب تحقق الشروط في كلا العينتين، وأن تكون العينات مستقلة.
6.9
Justifying a Claim About Two Proportions · تبرير ادعاء حول نسبين
Syllabus · المنهج
English
Enduring Understanding (UNC-4): An interval of values should be used to estimate parameters, in order to account for uncertainty.
Learning Objective UNC-4.M: Interpret a confidence interval for a difference of proportions. [Skill 4.B]
UNC-4.M.1 In repeated random sampling with the same sample size, approximately C% of confidence intervals created will capture the difference in population proportions.
UNC-4.M.2 Interpreting a confidence interval for difference between population proportions should include a reference to the sample taken and details about the population it represents.
Learning Objective UNC-4.N: Justify a claim based on a confidence interval for a difference of proportions. [Skill 4.D]
UNC-4.N.1 A confidence interval for difference in population proportions provides an interval of values that may provide sufficient evidence to support a particular claim in context.
العربية
الفهم الدائم (UNC-4): يجب استخدام فترة من القيم لتقدير المعايير، وذلك لحساب عدم اليقين.
الهدف التعليمي UNC-4.M: تفسير فترة ثقة لفرق النسب. [مهارة 4.B]
UNC-4.M.1 في العينات العشوائية المتكررة بنفس حجم العينة، ستلتقط حوالي C% من فترات الثقة المُنشأة الفرق في نسب المجتمع.
UNC-4.M.2 يجب أن يتضمن تفسير فترة الثقة لفرق نسب المجتمع مرجعاً إلى العينة المأخوذة وتفاصيل عن المجتمع الذي تمثل.
الهدف التعليمي UNC-4.N: تبرير ادعاء بناءً على فترة ثقة لفرق النسب. [مهارة 4.D]
UNC-4.N.1 توفر فترة الثقة لفرق نسب المجتمع نطاقاً من القيم قد يوفر دليلاً كافياً لدعم ادعاء معين في السياق.
Source: College Board AP Course and Exam Description · المصدر: وصف دورة وامتحان College Board AP
English
If the interval for $p_1-p_2$ contains $0$, the data are consistent with no difference; if it lies entirely above or below $0$, there is evidence of a difference (in that direction). State the direction and context.
العربية
إذا كانت فترة $p_1-p_2$ تحتوي على $0$، فالبيانات متسقة مع عدم وجود فرق؛ إذا كانت بالكامل فوق أو تحت $0$، فهناك دليل على وجود فرق (في ذلك الاتجاه). حدد الاتجاه والسياق.
6.10
Setting Up a Test for a Difference · إعداد اختبار للفرق
Syllabus · المنهج
English
Enduring Understanding (VAR-6): The normal distribution may be used to model variation.
Learning Objective VAR-6.H: Identify the null and alternative hypotheses for a difference of two population proportions. [Skill 1.F]
VAR-6.H.1 For a two-sample test for a difference of two proportions, the null hypothesis specifies a value of $0$ for the difference in population proportions, indicating no difference or effect.
VAR-6.H.2 The null hypothesis for a difference in proportions is: $H_0 : p_1 = p_2$, or $H_0 : p_1 - p_2 = 0$.
VAR-6.H.3 A one-sided alternative hypothesis for a difference in proportions is $H_a : p_1 < p_2$, or, $H_a : p_1 > p_2$. A two-sided alternative hypothesis for a difference of proportions is $H_a : p_1 \neq p_2$.
Learning Objective VAR-6.I: Identify an appropriate testing method for the difference of two population proportions. [Skill 1.E]
VAR-6.I.1 For a single categorical variable, the appropriate testing method for the difference of two population proportions is a two-sample $z$-test for a difference between two population proportions.
Learning Objective VAR-6.J: Verify the conditions for making statistical inferences when testing a difference of two population proportions. [Skill 4.C]
VAR-6.J.1 In order to make statistical inferences when testing a difference between population proportions, we must check for independence and that the sampling distribution is approximately normal:
a. To check for independence:
i. Data should be collected using two independent, random samples or a randomized experiment.
ii. When sampling without replacement, check that $n_1 \leq 10\%N_1$ and $n_2 \leq 10\%N_2$.
b. To check that the sampling distribution of $\hat{p}_1 - \hat{p}_2$ is approximately normal (shape):
i. For the combined sample, define the combined (or pooled) proportion, $\hat{p}_c = \dfrac{n_1\hat{p}_1 + n_2\hat{p}_2}{n_1 + n_2}$. Assuming that $H_0$ is true $(p_1 - p_2 = 0$ or $p_1 = p_2)$, check that $n_1\hat{p}_c$, $n_1\left(1-\hat{p}_c\right)$, $n_2\hat{p}_c$, and $n_2\left(1-\hat{p}_c\right)$ are all greater than or equal to some predetermined value, typically either 5 or 10.
العربية
فهم دائم (VAR-6): يمكن استخدام التوزيع الطبيعي لنمذجة التنوع.
هدف التعلم VAR-6.H: تحديد فرضية الصفر والفرضية البديلة لفرق نسب مجتمعين. [مهارة 1.F]
VAR-6.H.1 بالنسبة لاختبار عينتين لفرق بين نسبتين، تحدد فرضية الصفر قيمة $0$ لفرق نسب المجتمعين، مما يشير إلى عدم وجود فرق أو تأثير.
هدف التعلم VAR-6.I: تحديد طريقة اختبار مناسبة لفرق نسب مجتمعين. [مهارة 1.E]
VAR-6.I.1 للمتغير التصنيفي الواحد، طريقة الاختبار المناسبة لفرق نسب مجتمعين هي اختبار $z$ لعينتين لفرق بين نسب مجتمعين.
هدف التعلم VAR-6.J: التحقق من شروط إجراء الاستدلالات الإحصائية عند اختبار فرق نسب مجتمعين. [مهارة 4.C]
VAR-6.J.1 لإجراء استدلالات إحصائية عند اختبار فرق بين نسب مجتمعين، يجب التحقق من الاستقلال وأن يكون التوزيع المعايني تقريبًا طبيعيًا:
أ. للتحقق من الاستقلال:
i. يجب جمع البيانات باستخدام عينتين مستقلتين وعشوائيتين أو تجربة معشاة.
ii. عند السحب بدون إرجاع، تحقق من أن $n_1 \leq 10\%N_1$ و $n_2 \leq 10\%N_2$.
ب. للتحقق من أن التوزيع المعايني لـ $\hat{p}_1 - \hat{p}_2$ تقريبًا طبيعي (الشكل):
i. بالنسبة للعينة المدمجة، عرّف النسبة المدمجة (أو المجمعة) $\hat{p}_c = \dfrac{n_1\hat{p}_1 + n_2\hat{p}_2}{n_1 + n_2}$. بافتراض صحة $H_0$، تحقق من أن $(p_1 - p_2 = 0$ و $p_1 = p_2)$ و $n_1\hat{p}_c$ و $n_1\left(1-\hat{p}_c\right)$ و $n_2\hat{p}_c$ و $n_2\left(1-\hat{p}_c\right)$ جميعها أكبر من أو تساوي قيمة محددة مسبقًا، عادةً ما تكون 5 أو 10.
Source: College Board AP Course and Exam Description · المصدر: وصف دورة وامتحان College Board AP
English
Hypotheses compare the two proportions: $H_0: p_1=p_2$ versus $H_a: p_1\neq p_2$ (or $<,>$). Because $H_0$ says the proportions are equal, use a combined (pooled) 合并 sample proportion $\hat p_c=\dfrac{\text{total successes}}{\text{total sample size}}$ to estimate the common $p$.
العربية
المفترضات تقارن النسبين: $H_0: p_1=p_2$ مقابل $H_a: p_1\neq p_2$ (أو $<,>$). نظرًا لأن $H_0$ تقول إن النسب متساوية، استخدم نسبة عينة مشترك (مجمعة)$\hat p_c=\dfrac{\text{total successes}}{\text{total sample size}}$ لتقدير $p$ المشترك.
6.11
Carrying Out a Test for a Difference · إجراء اختبار للفرق
Syllabus · المنهج
English
Enduring Understanding (VAR-6): The normal distribution may be used to model variation.
Learning Objective VAR-6.K: Calculate an appropriate test statistic for the difference of two population proportions. [Skill 3.E]
VAR-6.K.1 The test statistic for a difference in proportions is: $z = \dfrac{(\hat{p}_1 - \hat{p}_2) - 0}{\sqrt{\hat{p}_c(1-\hat{p}_c)}\sqrt{\dfrac{1}{n_1} + \dfrac{1}{n_2}}}$, where $\hat{p}_c = \dfrac{n_1\hat{p}_1 + n_2\hat{p}_2}{n_1 + n_2}$.
Clarifying statement: The formulas for test statistics do not appear explicitly on the AP Statistics Formula Sheet provided with the AP Statistics Exam. However, these formulas do not need to be memorized, as they can be constructed based on the general test statistic formula and the standard error formulas for each of the relevant test statistics that are provided on the formula sheet.
Enduring Understanding (DAT-3): Significance testing allows us to make decisions about hypotheses within a particular context.
Learning Objective DAT-3.C: Interpret the $p$-value of a significance test for a difference of population proportions. [Skill 4.B]
DAT-3.C.1 An interpretation of the $p$-value of a significance test for a difference of two population proportions should recognize that the $p$-value is computed by assuming that the null hypothesis is true, i.e., by assuming that the true population proportions are equal to each other.
Learning Objective DAT-3.D: Justify a claim about the population based on the results of a significance test for a difference of population proportions. [Skill 4.E]
DAT-3.D.1 A formal decision explicitly compares the $p$-value to the significance $\alpha$. If the $p\text{-value} \leq \alpha$, then reject the null hypothesis, $H_0 : p_1 = p_2$, or $H_0 : p_1 - p_2 = 0$. If the $p$-value $> \alpha$, then fail to reject the null hypothesis.
DAT-3.D.2 The results of a significance test for a difference of two population proportions can serve as the statistical reasoning to support the answer to a research question about the two populations that were sampled.
العربية
فهم دائم (VAR-6): يمكن استخدام التوزيع الطبيعي لنمذجة التنوع.
هدف التعلم VAR-6.K: حساب إحصاء اختبار مناسب لفرق نسب مجتمعين. [مهارة 3.E]
عبارة توضيحية: لا تظهر صيغ إحصاءات الاختبار صراحةً في ورقة قوانين AP للإحصاء المقدمة في امتحان AP للإحصاء. ومع ذلك، لا حاجة لحفظ هذه الصيغ، حيث يمكن بناؤها بناءً على صيغة إحصاء الاختبار العامة وصيغ الخطأ المعياري لكل من إحصاءات الاختبار ذات الصلة المدرجة في ورقة القوانين.
الفهم الدائم (DAT-3): يسمح اختبار الأهمية باتخاذ قرارات بشأن الفرضيات ضمن سياق معين.
هدف التعلم DAT-3.C: تفسير قيمة $p$ لاختبار أهمية لفرق نسب مجتمعين. [مهارة 4.B]
DAT-3.C.1 يجب أن يعترف تفسير قيمة $p$ لاختبار أهمية لفرق نسبين مجتمعين بأن قيمة $p$ يتم حسابها بافتراض صحة فرضية الصفر، أي بافتراض أن نسب المجتمع الحقيقية متساوية.
هدف التعلم DAT-3.D: تبرير ادعاء حول المجتمع بناءً على نتائج اختبار أهمية لفرق نسب مجتمعين. [مهارة 4.E]
DAT-3.D.1 المقارنة الرسمية تقيّم قيمة $p$ مقابل مستوى significance $\alpha$. إذا كانت $p\text{-value} \leq \alpha$، فإننا نرفض فرضية الصفر، $H_0 : p_1 = p_2$، أو $H_0 : p_1 - p_2 = 0$. وإذا كانت قيمة $p$$> \alpha$، فإننا نفشل في رفض فرضية الصفر.
DAT-3.D.2 يمكن أن تعمل نتائج اختبار الأهمية لفرق نسب مجتمعين كأساس استدلالي إحصائي لدعم إجابة سؤال بحثي يتعلق بالمجتمعين اللذين تم أخذ العينات منهما.
Source: College Board AP Course and Exam Description · المصدر: وصف دورة وامتحان College Board AP
Pick one and the site follows you — notes, papers, videos and practice all open on it. · اختر واحدًا وسيتبعك الموقع — الملاحظات، الأوراق، الفيديوهات والتدريب جميعها تفتح عليه.
Type to search notes, lessons, code, vocabulary and past-paper questions across every subject. · اكتب للبحث عن ملاحظات، دروس، أكواد، مفردات وأسئلة امتحانات سابقة عبر جميع المواد.