Skip to content · ⁨الانتقال إلى المحتوى⁩

Exploring Two-Variable Data · ⁨استكشاف بيانات متغيرين⁩

AP Statistics · ⁨AP الإحصاء⁩ · Topic 2 · ⁨الموضوع 2⁩

Video lesson for this topic · ⁨درس فيديو لهذا الموضوع⁩ Open the video page · ⁨افتح صفحة الفيديو⁩
7:49

استكشاف بيانات متغيرين

ثلاثون طفلاً من مدرسة ابتدائية واحدة. لكل طفل، رقمين: مقاس الحذاء، ودرجة اختبار القراءة. ضع نقطة واحدة لكل طفل. النمط يصعب…

English narration · English + 中文 subtitles burned in · ⁨سرد باللغة الإنجليزية · ترجمة مدمجة بالإنجليزية + الصينية⁩

2.1

Are Two Variables Related? · ⁨هل هناك علاقة بين متغيرين؟⁩

Syllabus · ⁨المنهج⁩
English

Enduring Understanding (VAR-1): Given that variation may be random or not, conclusions are uncertain.

Learning Objective VAR-1.D: Identify questions to be answered about possible relationships in data. [Skill 1.A]

  • VAR-1.D.1 Apparent patterns and associations in data may be random or not.
العربية

الفهم الدائم (VAR-1): بما أن التباين قد يكون عشوائياً أو غير ذلك، فإن الاستنتاجات تكون غير مؤكدة.

هدف التعلم VAR-1.D: تحديد الأسئلة التي يجب الإجابة عنها حول العلاقات المحتملة في البيانات. [مهارة 1.A]

  • VAR-1.D.1 قد تكون الأنماط والروابط الظاهرة في البيانات عشوائية أو غير ذلك.
Source: College Board AP Course and Exam Description · ⁨المصدر: وصف دورة وامتحان College Board AP⁩

English

Two-variable data let us ask whether two characteristics are associated 关联 – whether knowing one tells you something about the other. An explanatory variable 解释变量 (the "input") may help predict a response variable 响应变量 (the "output"). Association is not the same as causation.

العربية

بيانات المتغيرين تسمح لنا بسؤال ما إذا كان خاصيتان مرتبطتان – هل معرفة واحدة تخبرنا بشيء عن الأخرى. المتغير التوضيحي (الـ "المدخل") قد يساعد في التنبؤ بـالمتغير الاستجابة (الـ "المخرج"). الارتباط ليس نفس السببية.

2.2

Two Categorical Variables · ⁨متغيران فئويان⁩

Syllabus · ⁨المنهج⁩
English

Enduring Understanding (UNC-1): Graphical representations and statistics allow us to identify and represent key features of data.

Learning Objective UNC-1.P: Compare numerical and graphical representations for two categorical variables. [Skill 2.D]

  • UNC-1.P.1 Side-by-side bar graphs, segmented bar graphs, and mosaic plots are examples of bar graphs for one categorical variable, broken down by categories of another categorical variable.
  • UNC-1.P.2 Graphical representations of two categorical variables can be used to compare distributions and/or determine if variables are associated.
  • UNC-1.P.3 A two-way table, also called a contingency table, is used to summarize two categorical variables. The entries in the cells can be frequency counts or relative frequencies.
  • UNC-1.P.4 A joint relative frequency is a cell frequency divided by the total for the entire table.
العربية

الفهم الدائم (UNC-1): تُمكّننا التمثيلات البيانية والإحصاءات من تحديد وميزة الملامح الرئيسية للبيانات.

هدف التعلم UNC-1.P: مقارنة التمثيلات العددية والبيانية لمتغيرين فئيين. [مهارة 2.D]

  • UNC-1.P.1 المدرجات الشريطية جنباً إلى جنب، والمدرجات الشريطية المجزأة، ومخططات الفسيفساء أمثلة على المدرجات الشريطية لمتغير فئ واحد، مقسمة حسب فئات متغير فئ آخر.
  • UNC-1.P.2 يمكن استخدام التمثيلات البيانية لمتغيرين فئيين لمقارنة التوزيعات و/أو تحديد ما إذا كانت المتغيرات مرتبطة.
  • UNC-1.P.3 جدول ثنائي الأبعاد، يُعرف أيضًا باسم جدول التباين، يُستخدم لتلخيص متغيرين فئويين. يمكن أن تكون المدخلات في الخلايا أعدادًا تكرارية أو تكرارات نسبية.
  • UNC-1.P.4 التكرار النسبي المشترك هو تكرار الخلية مقسومًا على الإجمالي الكلي للجدول بأكمله.

Source: College Board AP Course and Exam Description · ⁨المصدر: وصف دورة وامتحان College Board AP⁩

English

A two-way table 双向表 (contingency table) counts individuals by two categorical variables at once. A marginal distribution 边缘分布 is a row or column total written as a fraction of the grand total (the totals themselves are just counts). Comparing the inside cells shows whether the variables are related.

العربية

جدول ثنائي الأبعاد (جدول ترابط) يعدّ الأفراد بناءً على متغيرين فئيين في آن واحد. التوزيع الهامشي هو مجموع صف أو عمود مكتوباً ككسر من المجموع الكلي (المجموعات نفسها مجرد أعداد). مقارنة الخلايا الداخلية تظهر ما إذا كان المتغيران مرتبطين.

2.3

Comparing Groups with Conditional Distributions · ⁨مقارنة المجموعات بالتوزيعات الشرطية⁩

Syllabus · ⁨المنهج⁩
English

Enduring Understanding (UNC-1): Graphical representations and statistics allow us to identify and represent key features of data.

Learning Objective UNC-1.Q: Calculate statistics for two categorical variables. [Skill 2.C]

  • UNC-1.Q.1 The marginal relative frequencies are the row and column totals in a two-way table divided by the total for the entire table.
  • UNC-1.Q.2 A conditional relative frequency is a relative frequency for a specific part of the contingency table (e.g., cell frequencies in a row divided by the total for that row).

Learning Objective UNC-1.R: Compare statistics for two categorical variables. [Skill 2.D]

  • UNC-1.R.1 Summary statistics for two categorical variables can be used to compare distributions and/or determine if variables are associated.
العربية

الفهم الدائم (UNC-1): تُمكّننا التمثيلات البيانية والإحصاءات من تحديد وميزة الملامح الرئيسية للبيانات.

هدف التعلم UNC-1.Q: حساب الإحصاءات لمتغيرين فئويين. [المهارة 2.C]

  • UNC-1.Q.1 التكرارات النسبية الهامشية هي مجاميع الصفوف والأعمدة في الجدول الثنائي الأبعاد مقسومة على الإجمالي الكلي للجدول بأكمله.
  • UNC-1.Q.2 التكرار النسبي الشرطي هو تكرار نسبي جزء محدد من جدول التباين (مثل تكرارات الخلايا في صف مقسومًا على إجمالي ذلك الصف).

هدف التعلم UNC-1.R: مقارنة الإحصاءات لمتغيرين فئويين. [المهارة 2.D]

  • UNC-1.R.1 يمكن استخدام الإحصاءات الوصفية لمتغيرين فئويين لمقارنة التوزيعات و/أو تحديد ما إذا كانت المتغيرات مرتبطة.

Source: College Board AP Course and Exam Description · ⁨المصدر: وصف دورة وامتحان College Board AP⁩

English

A conditional distribution 条件分布 is the distribution of one variable within a fixed category of the other (found by dividing each cell by its row or column total). If the conditional distributions differ across groups, the two variables are associated; if they are the same, there is no association. Segmented bar charts 分段条形图 or mosaic plots display them.

العربية

التوزيع الشرطي هو توزيع أحد المتغيرات داخل فئة ثابتة من الآخر (يُوجد بقسمة كل خلية على مجموع صفها أو عمودها). إذا اختلفت التوزيعات الشرطية عبر المجموعات، فإن المتغيرين مرتبطان؛ إذا كانت متطابقة، فلا يوجد ارتباط. تعرض الرسوم البيانية الشريطية المجزأة أو مخططات الفسيفساء هذه التوزيعات.

2.4

Scatterplots for Two Quantitative Variables · ⁨مخطط التشتث للمتغيرين الكمي⁩

Syllabus · ⁨المنهج⁩
English

Enduring Understanding (UNC-1): Graphical representations and statistics allow us to identify and represent key features of data.

Learning Objective UNC-1.S: Represent bivariate quantitative data using scatterplots. [Skill 2.B]

  • UNC-1.S.1 A bivariate quantitative data set consists of observations of two different quantitative variables made on individuals in a sample or population.
  • UNC-1.S.2 A scatterplot shows two numeric values for each observation, one corresponding to the value on the $x$-axis and one corresponding to the value on the $y$-axis.
  • UNC-1.S.3 An explanatory variable is a variable whose values are used to explain or predict corresponding values for the response variable.

Enduring Understanding (DAT-1): Regression models may allow us to predict responses to changes in an explanatory variable.

Learning Objective DAT-1.A: Describe the characteristics of a scatter plot. [Skill 2.A]

  • DAT-1.A.1 A description of a scatter plot includes form, direction, strength, and unusual features.
  • DAT-1.A.2 The direction of the association shown in a scatterplot, if any, can be described as positive or negative.
  • DAT-1.A.3 A positive association means that as values of one variable increase, the values of the other variable tend to increase. A negative association means that as values of one variable increase, values of the other variable tend to decrease.
  • DAT-1.A.4 The form of the association shown in a scatterplot, if any, can be described as linear or non-linear to varying degrees.
  • DAT-1.A.5 The strength of the association is how closely the individual points follow a specific pattern, e.g., linear, and can be shown in a scatterplot. Strength can be described as strong, moderate, or weak.
  • DAT-1.A.6 Unusual features of a scatter plot include clusters of points or points with relatively large discrepancies between the value of the response variable and a predicted value for the response variable.
العربية

الفهم الدائم (UNC-1): تُمكّننا التمثيلات البيانية والإحصاءات من تحديد وميزة الملامح الرئيسية للبيانات.

هدف التعلم UNC-1.S: تمثيل البيانات الكمية ثنائية المتغيرات باستخدام المخططات الانتشارية. [المهارة 2.B]

  • UNC-1.S.1 تتكون مجموعة بيانات كمية ثنائية المتغيرات من ملاحظات لمتغيرين كميين مختلفين تم إجراؤها على أفراد في عينة أو مجتمع.
  • UNC-1.S.2 يعرض المخطط الانتشاري قيمتين عدديتين لكل ملاحظة، واحدة تقابل القيمة على محور $x$ والأخرى تقابل القيمة على محور $y$.
  • UNC-1.S.3 المتغير المفسر هو متغير تُستخدم قيمه لتفسير أو التنبؤ بالقيم المقابلة للمتغير الاستجابة.

فهم دائم (DAT-1): قد تسمح لنا نماذج الانحدار بالتنبؤ بالاستجابات للتغيرات في متغير مفسر.

هدف التعلم DAT-1.A: وصف خصائص المخطط الانتشاري. [المهارة 2.A]

  • DAT-1.A.1 يتضمن وصف المخطط الانتشاري الشكل والاتجاه والقوة والخصائص غير العادية.
  • DAT-1.A.2 يمكن وصف اتجاه الارتباط الموضح في المخطط الانتشاري، إن وجد، بأنه موجب أو سالب.
  • DAT-1.A.3 يعني الارتباط الموجب أنه كلما زادت قيم أحد المتغيرين، زادت قيم المتغير الآخر. ويعني الارتباط السالب أنه كلما زادت قيم أحد المتغيرين، انخفضت قيم المتغير الآخر.
  • DAT-1.A.4 يمكن وصف شكل الارتباط الموضح في المخطط الانتشاري، إن وجد، بأنه خطي أو غير خطي بدرجات متفاوتة.
  • DAT-1.A.5 قوة الارتباط هي مدى اقتراب النقاط الفردية من نمط معين، مثل الخطي، ويمكن عرضها في مخطط انتشاري. يمكن وصف القوة بأنها قوية أو معتدلة أو ضعيفة.
  • DAT-1.A.6 تشمل الخصائص غير العادية للمخطط الانتشاري تجمعات للنقاط أو نقاط ذات انحرافات كبيرة نسبيًا بين قيمة المتغير الاستجابة وقيمة متوقعة له.

Source: College Board AP Course and Exam Description · ⁨المصدر: وصف دورة وامتحان College Board AP⁩

English

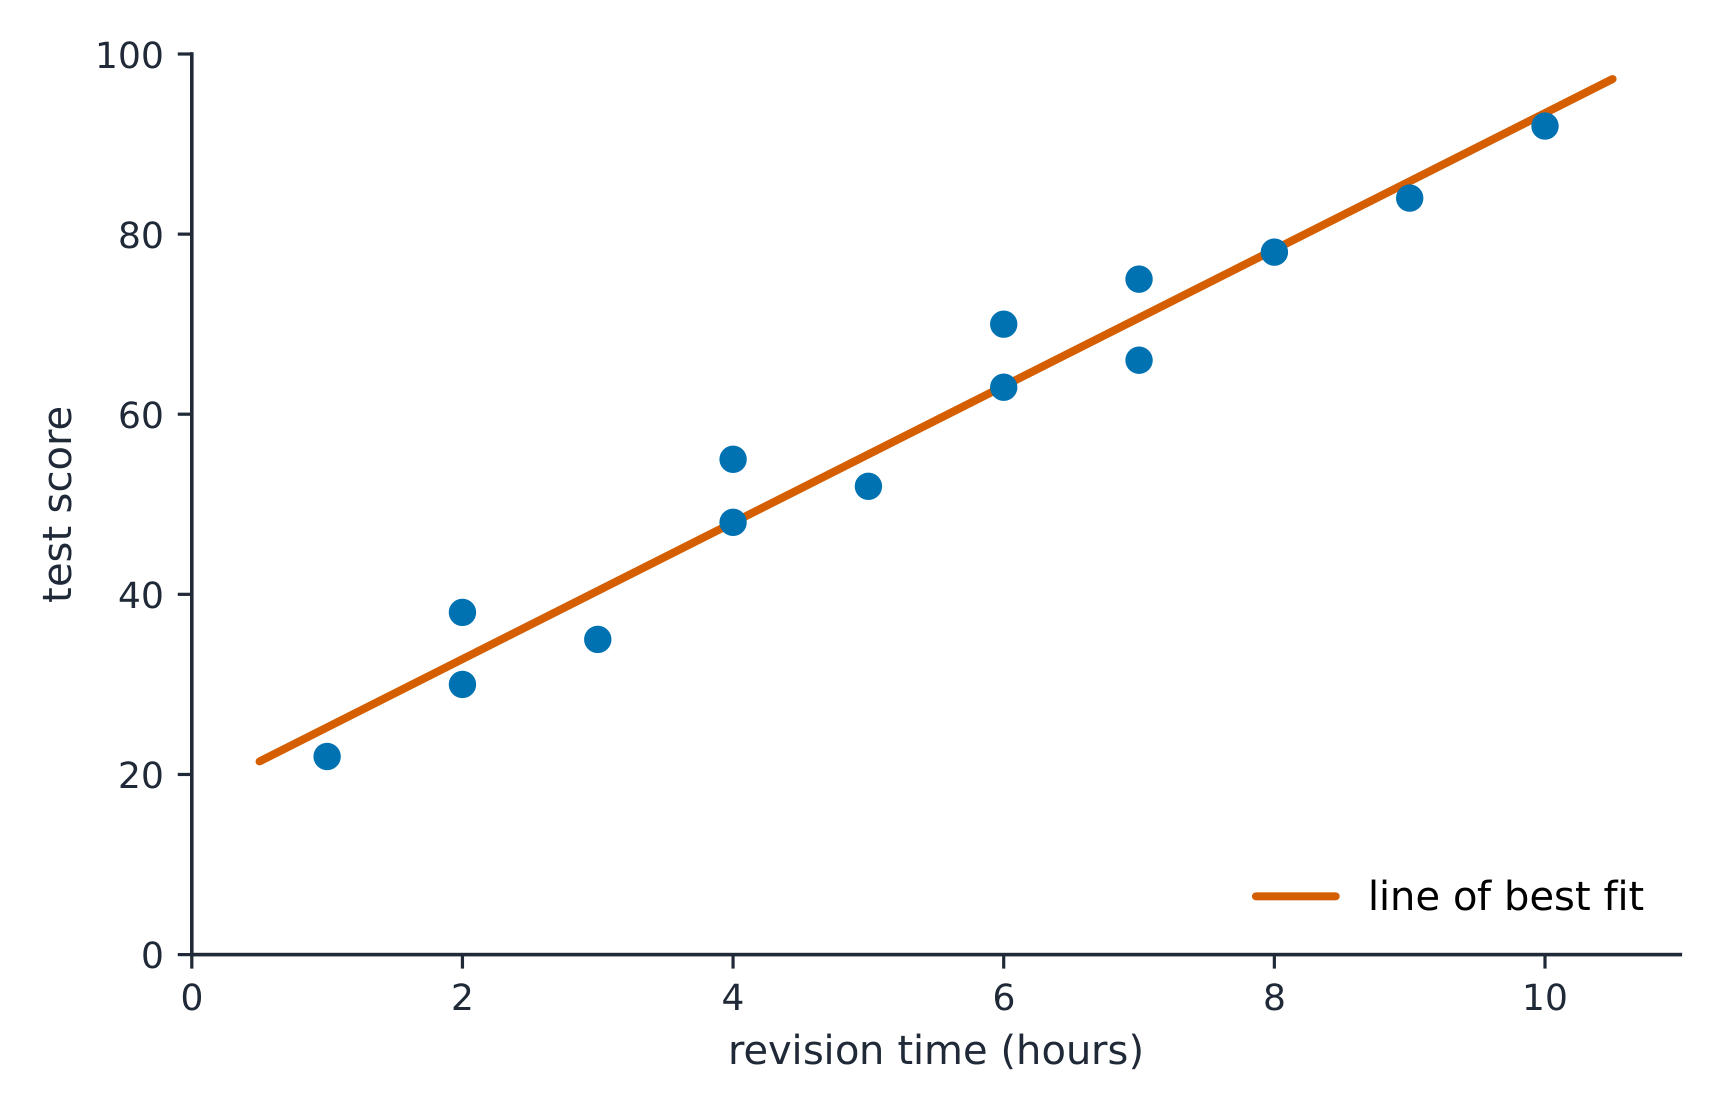
A scatterplot 散点图 plots each individual as a point, explanatory variable on the $x$-axis and response on the $y$-axis. Describe it with DUFS: Direction (positive/negative), Unusual features (outliers, clusters), Form (linear or curved), and Strength (how tightly the points follow the pattern) – always in context.

العربية

يُصوّر مخطط التشتت كل فرد كنقطة، مع وضع المتغير المفسر على محور $x$ والمتغير المستجيب على محور $y$. صغّره باستخدام DUFS: الاتجاه (إيجابي/سلبي)، الخصائص غير المعتادة (نقاط شاذة، تجمعات)، الشكل (خطي أو منحنى)، والقوة (مدى تقارب النقاط مع النمط) – دائماً في السياق.

خط أفضل انحدار يمر عبر وسط النقاط المتناثرة
2.5

Correlation · ⁨الارتباط⁩

Syllabus · ⁨المنهج⁩
English

Enduring Understanding (DAT-1): Regression models may allow us to predict responses to changes in an explanatory variable.

Learning Objective DAT-1.B: Determine the correlation for a linear relationship. [Skill 2.C]

  • DAT-1.B.1 The correlation, $r$, gives the direction and quantifies the strength of the linear association between two quantitative variables.
  • DAT-1.B.2 The correlation coefficient can be calculated by: $r = \dfrac{1}{n-1} \sum \left( \dfrac{x_i - \bar{x}}{s_x} \right) \left( \dfrac{y_i - \bar{y}}{s_y} \right)$. However, the most common way to determine $r$ is by using technology.
  • DAT-1.B.3 A correlation coefficient close to 1 or $-1$ does not necessarily mean that a linear model is appropriate.

Learning Objective DAT-1.C: Interpret the correlation for a linear relationship. [Skill 4.B]

  • DAT-1.C.1 The correlation, $r$, is unit-free, and always between $-1$ and 1, inclusive. A value of $r = 0$ indicates that there is no linear association. A value of $r = 1$ or $r = -1$ indicates that there is a perfect linear association.
  • DAT-1.C.2 A perceived or real relationship between two variables does not mean that changes in one variable cause changes in the other. That is, correlation does not necessarily imply causation.
العربية

فهم دائم (DAT-1): قد تسمح لنا نماذج الانحدار بالتنبؤ بالاستجابات للتغيرات في متغير مفسر.

هدف التعلم DAT-1.B: تحديد معامل الارتباط لعلاقة خطية. [المهارة 2.C]

  • DAT-1.B.1 يعطي معامل الارتباط، $r$، الاتجاه ويقيس قوة الارتباط الخطي بين متغيرين كميين.
  • DAT-1.B.2 يمكن حساب معامل الارتباط بواسطة: $r = \dfrac{1}{n-1} \sum \left( \dfrac{x_i - \bar{x}}{s_x} \right) \left( \dfrac{y_i - \bar{y}}{s_y} \right)$. ومع ذلك، فإن الطريقة الأكثر شيوعًا لتحديد $r$ هي باستخدام التكنولوجيا.
  • DAT-1.B.3 لا يعني بالضرورة أن نموذجًا خطيًا مناسبًا أن يكون معامل ارتباط قريبًا من 1 أو $-1$.

هدف التعلم DAT-1.C: تفسير معامل الارتباط لعلاقة خطية. [المهارة 4.B]

  • DAT-1.C.1 معامل الارتباط $r$ لا وحدة له، ويقع دائمًا بين $-1$ و1 بشكل شامل. تشير القيمة $r = 0$ إلى عدم وجود ارتباط خطي. تشير القيم $r = 1$ أو $r = -1$ إلى وجود ارتباط خطي مثالي.
  • DAT-1.C.2 لا يعني وجود علاقة مدركة أو حقيقية بين متغيرين أن التغيرات في أحدهما تسبب تغيرات في الآخر. أي أن الارتباط لا يعني بالضرورة السببية.

Source: College Board AP Course and Exam Description · ⁨المصدر: وصف دورة وامتحان College Board AP⁩

English
What r actually measures

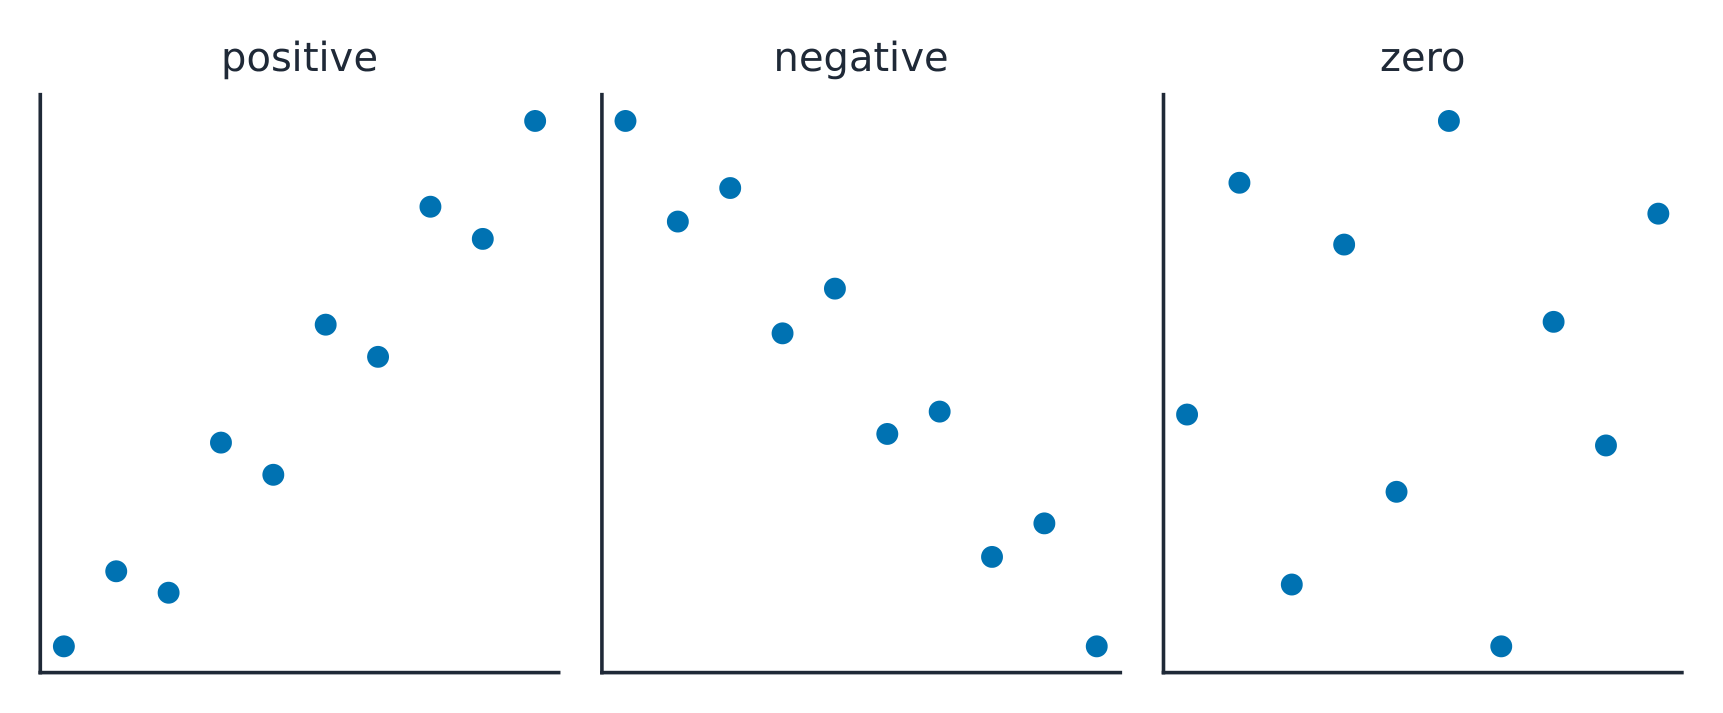
The correlation coefficient 相关系数 $r$ measures the strength and direction of a linear relationship. It runs from $-1$ to $1$: near $\pm 1$ is strong linear, near $0$ is weak linear. $r$ has no units and does not change if you swap the variables. Warnings: $r$ only measures linear strength, it is not resistant to outliers, and a strong $r$ does not prove causation.

العربية
ماذا يقيسه r فعلياً

يقيس معامل الارتباط $r$ قوة واتجاه العلاقة الخطية. ويتراوح بين $-1$ و$1$: ما يقترب من $\pm 1$ يشير إلى علاقة خطية قوية، وما يقترب من $0$ يشير إلى علاقة خطية ضعيفة. لا يمتلك $r$ وحدات قياس ولا يتغير إذا قمت بتبديل المتغيرات. تحذيرات: يقيس $r$ قوة خطية فقط، وهو غير مقاوم للنقاط الشاذة، ولا تثبت $r$ القوية السببية.

الارتباط الإيجابي يرتفع معاً؛ الانحدار السلبي يتحرك في اتجاهات معاكسة
Explore · ⁨استكشف⁩

Strength of a linear relationship · ⁨قوة العلاقة الخطية⁩

Correlation $r$ runs from $-1$ to $1$: near $\pm1$ the points hug a line, near 0 they scatter. Change it and watch the cloud tighten or spread. · ⁨الارتباط $r$ يتراوح بين $-1$ و$1$: بالقرب من $\pm1$ تتجمع النقاط حول خط، قرب 0 تتناثر. غيّره وشاهد السحابة تتكثف أو تنتشر.⁩

2.6

Linear Regression Models · ⁨نماذج الانحدار الخطي⁩

Syllabus · ⁨المنهج⁩
English

Enduring Understanding (DAT-1): Regression models may allow us to predict responses to changes in an explanatory variable.

Learning Objective DAT-1.D: Calculate a predicted response value using a linear regression model. [Skill 2.C]

  • DAT-1.D.1 A simple linear regression model is an equation that uses an explanatory variable, $x$, to predict the response variable, $y$.
  • DAT-1.D.2 The predicted response value, denoted by $\hat{y}$, is calculated as $\hat{y} = a + bx$, where $a$ is the $y$-intercept and $b$ is the slope of the regression line, and $x$ is the value of the explanatory variable.
  • DAT-1.D.3 Extrapolation is predicting a response value using a value for the explanatory variable that is beyond the interval of $x$-values used to determine the regression line. The predicted value is less reliable as an estimate the further we extrapolate.
العربية

فهم دائم (DAT-1): قد تسمح لنا نماذج الانحدار بالتنبؤ بالاستجابات للتغيرات في متغير مفسر.

هدف التعلم DAT-1.D: حساب قيمة استجابة متوقعة باستخدام نموذج انحدار خطي. [المهارة 2.C]

  • DAT-1.D.1 نموذج الانحدار الخطي البسيط هو معادلة تستخدم متغيرًا مفسرًا، $x$، للتنبؤ بالمتغير الاستجابة، $y$.
  • DAT-1.D.2 يتم حساب قيمة الاستجابة المتوقعة، المشار إليها بـ $\hat{y}$، بالمعادلة $\hat{y} = a + bx$، حيث $a$ هو التقاطع على المحور $y$ و$b$ هو ميل خط الانحدار، و$x$ هي قيمة المتغير المفسر.
  • DAT-1.D.3 الاستنباط الخارجي هو التنبؤ بقيمة استجابة باستخدام قيمة للمتغير المفسر تقع خارج نطاق قيم $x$ المستخدمة لتحديد خط الانحدار. تقل موثوقية القيمة المتوقعة كتقدير كلما ابتعدنا أكثر في الاستنباط الخارجي.

Source: College Board AP Course and Exam Description · ⁨المصدر: وصف دورة وامتحان College Board AP⁩

English

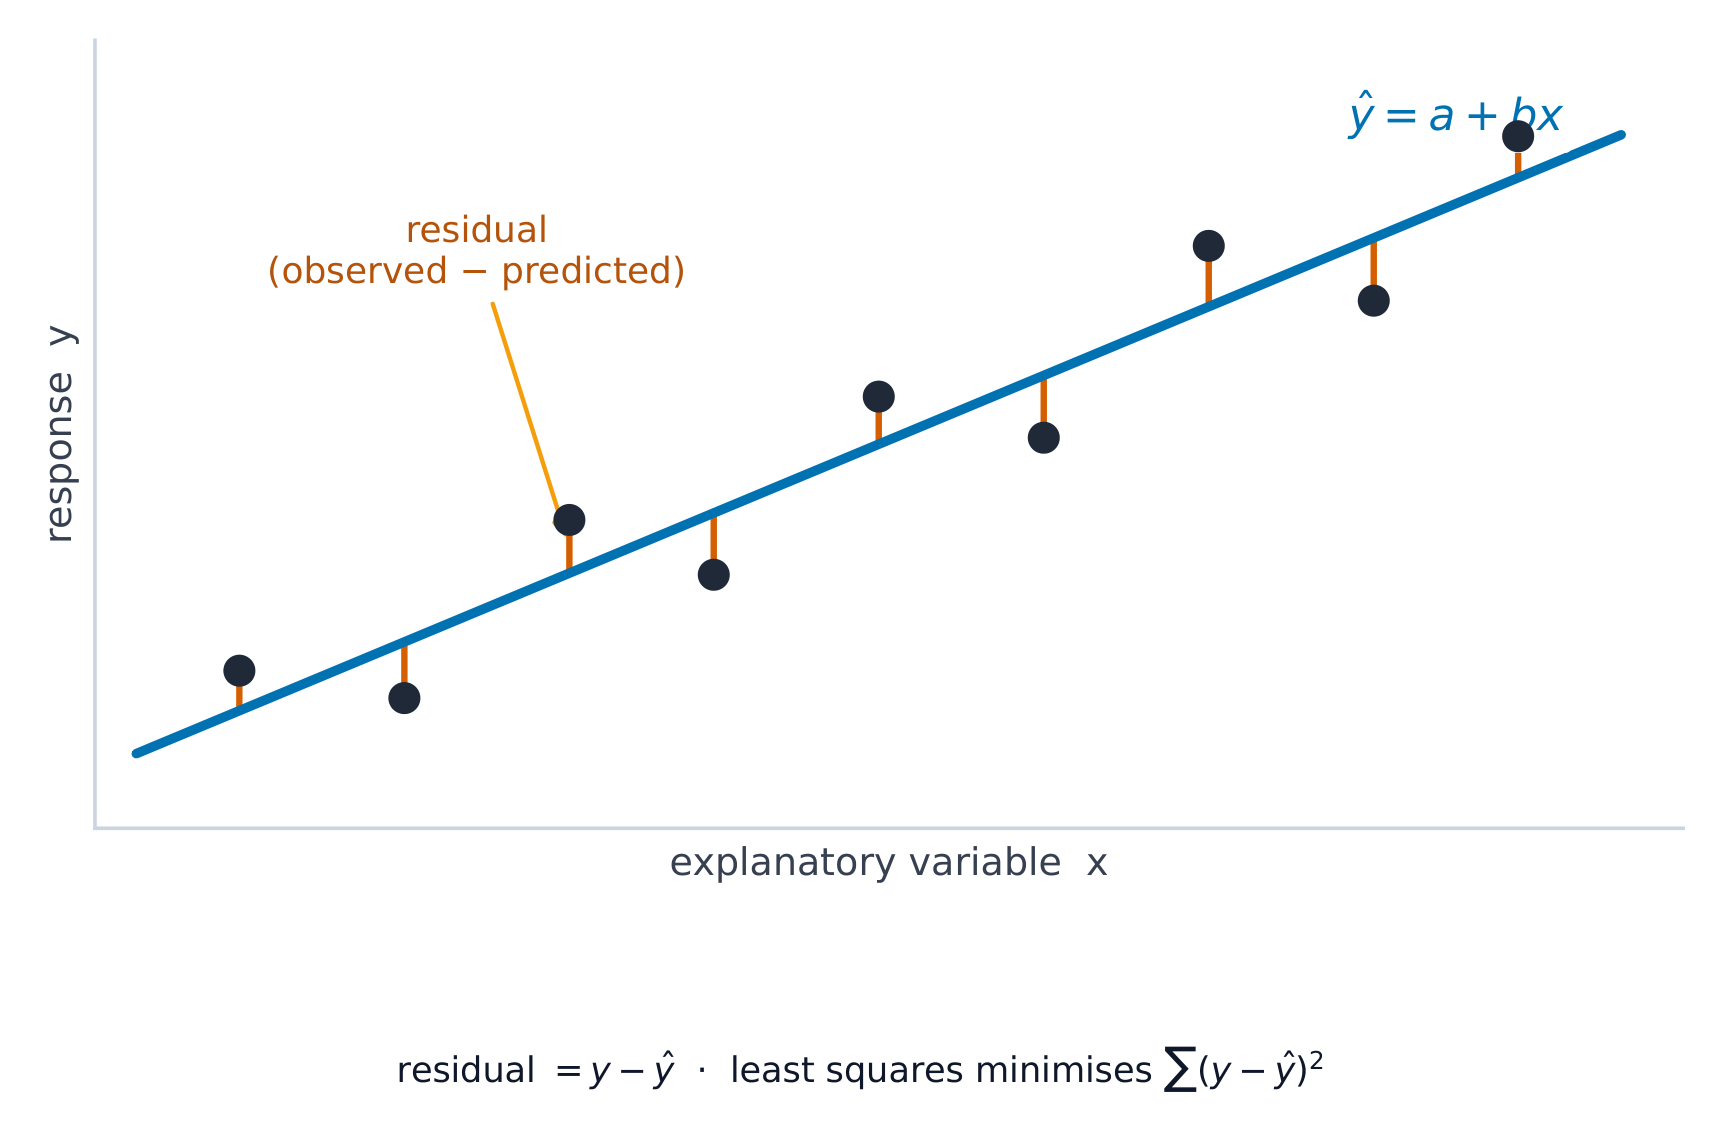
The least-squares regression line 最小二乘回归线 predicts the response: $\hat{y}=a+bx$, where $\hat{y}$ is the predicted response. The slope 斜率 $b$ is the predicted change in $y$ per one-unit increase in $x$; the $y$-intercept 截距 $a$ is the predicted $y$ when $x=0$. Interpret both in context and with units – a graded skill. Avoid extrapolation 外推 (predicting far outside the data).

Worked example. A study of hours studied ($x$) and test score ($y$) gives $\hat{y}=20+3x$. The slope means each extra hour of study is associated with a predicted $3$-point increase. A student who studies $5$ hours is predicted to score $\hat{y}=20+3(5)=35$.

العربية

يتنبأ خط الانحدار بأقل مربعات بالاستجابة: $\hat{y}=a+bx$، حيث $\hat{y}$ هي الاستجابة المتوقعة. يمثل الميل $b$ التغير المتوقع في $y$ لكل زيادة مقدارها وحدة واحدة في $x$؛ بينما يمثل المقطع الصادي $y$ $a$ القيمة المتوقعة لـ $y$ عندما $x=0$. فسر كليهما في السياق ومع الوحدات – مهارة متدرجة. تجنب التشعب (التنبؤ بعيداً عن نطاق البيانات).

مثال محلول. دراسة حول ساعات الدراسة ($x$) والنتيجة في الاختبار ($y$) أعطت $\hat{y}=20+3x$. يعني الميل أن كل ساعة دراسة إضافية ترتبط بزيادة متوقعة بمقدار $3$ نقطة. يُتوقع لطالب يدرس $5$ ساعات أن يحقق نتيجة قدرها $\hat{y}=20+3(5)=35$.

Explore · ⁨استكشف⁩

Fit a least-squares line · ⁨ضبط خط أقل مربعات⁩

A regression line is the best straight-line fit, minimising the squared vertical distances. Its slope predicts how $y$ changes per unit of $x$. · ⁨خط الانحدار هو أفضل ضبط خط مستقيم، يقلل المربعات الرأسية. ميله يتنبأ بكيفية تغير $y$ لكل وحدة من $x$.⁩

2.7

Residuals · ⁨البواقي⁩

Syllabus · ⁨المنهج⁩
English

Enduring Understanding (DAT-1): Regression models may allow us to predict responses to changes in an explanatory variable.

Learning Objective DAT-1.E: Represent differences between measured and predicted responses using residual plots. [Skill 2.B]

  • DAT-1.E.1 The residual is the difference between the actual value and the predicted value: $\text{residual} = y - \hat{y}$.
  • DAT-1.E.2 A residual plot is a plot of residuals versus explanatory variable values or predicted response values.

Learning Objective DAT-1.F: Describe the form of association of bivariate data using residual plots. [Skill 2.A]

  • DAT-1.F.1 Apparent randomness in a residual plot for a linear model is evidence of a linear form to the association between the variables.
  • DAT-1.F.2 Residual plots can be used to investigate the appropriateness of a selected model.
العربية

فهم دائم (DAT-1): قد تسمح لنا نماذج الانحدار بالتنبؤ بالاستجابات للتغيرات في متغير مفسر.

هدف التعلم DAT-1.E: تمثيل الفروقات بين الاستجابات المقاسة والمتوقعة باستخدام مخططات البواقي. [المهارة 2.B]

  • DAT-1.E.1 الباقي هو الفرق بين القيمة الفعلية والقيمة المتوقعة: $\text{residual} = y - \hat{y}$.
  • DAT-1.E.2 مخطط البواقي هو رسم بياني للبواقي مقابل قيم المتغير المفسر أو قيم الاستجابة المتوقعة.

هدف التعلم DAT-1.F: وصف شكل ارتباط البيانات ثنائية المتغيرات باستخدام مخططات البواقي. [المهارة 2.A]

  • DAT-1.F.1 العشوائية الظاهرة في مخطط البواقي لنموذج خطي هي دليل على شكل خطي للارتباط بين المتغيرات.
  • DAT-1.F.2 يمكن استخدام مخططات البواقي للتحقق من مدى مناسبة النموذج المختار.

Source: College Board AP Course and Exam Description · ⁨المصدر: وصف دورة وامتحان College Board AP⁩

English
Least-squares regression

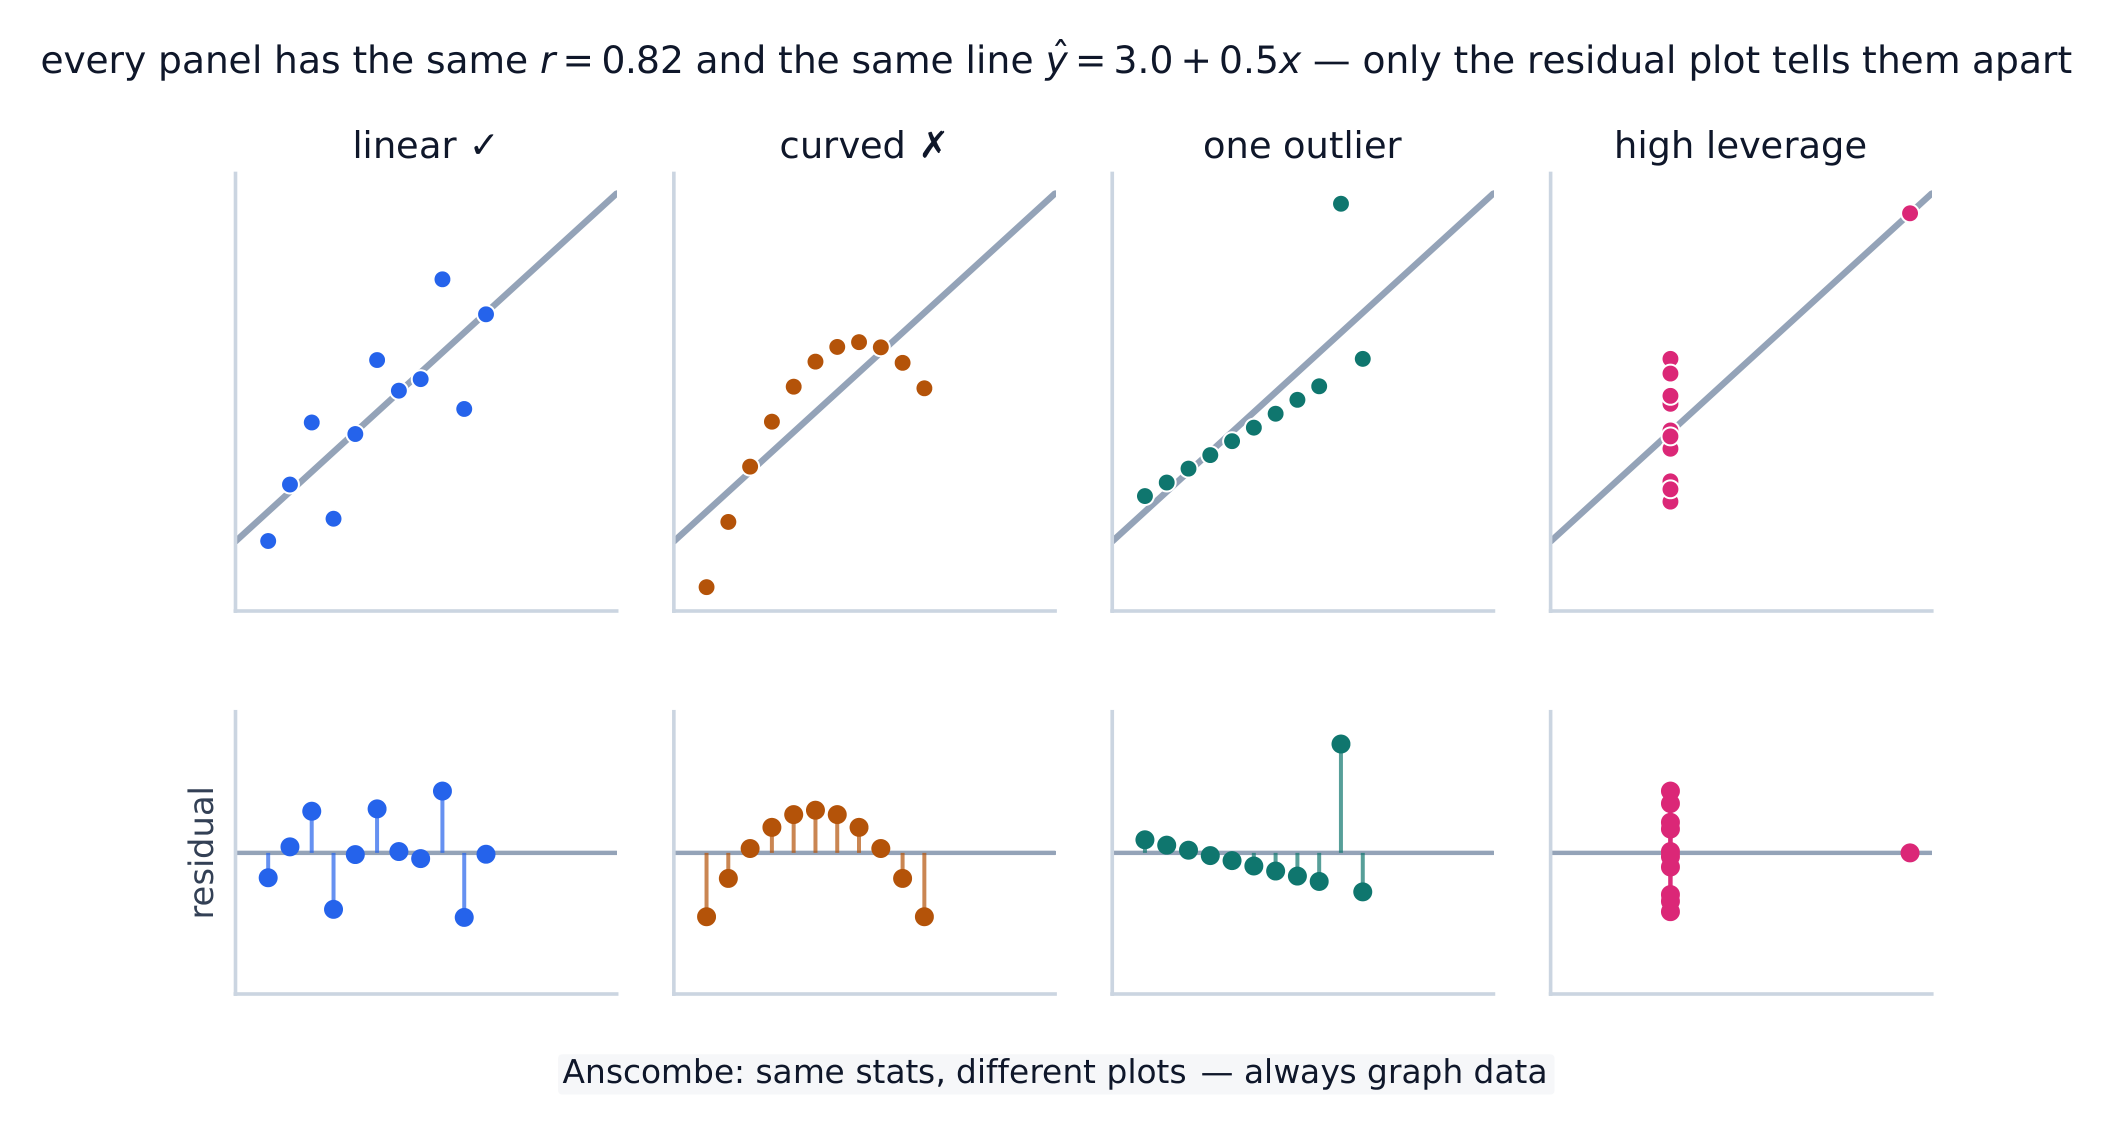
A residual 残差 is actual minus predicted, $y-\hat{y}$: how far a point sits above (+) or below (−) the line. A residual plot 残差图 graphs residuals against $x$. If it shows no pattern (random scatter), a linear model is appropriate; a curved or fanning pattern means the linear model is a poor fit.

Worked example. Continuing the study above, a student who studied $5$ hours actually scored $40$. The residual is $y-\hat{y}=40-35=+5$: the line under-predicted by $5$ points, so this point sits above the line.

العربية
انحدار المربعات الصغرى

الباقي هو الفعلي مطروحاً منه المتوقع، $y-\hat{y}$: المسافة التي تبعد بها النقطة فوق (+) أو تحت (−) الخط. يرسم مخطط البواقي البواقي مقابل $x$. إذا أظهر لا نمطاً (تشتت عشوائي)، فإن النموذج الخطي مناسب؛ أما النمط المنحني أو المتسع فيعني أن النموذج الخطي غير ملائم جيداً.

مثال محلول. استكمالاً للدراسة أعلاه، طالب درس $5$ ساعات حققت فعلياً نتيجة $40$. الباقي هو $y-\hat{y}=40-35=+5$: مما يعني أن الخط تنبأ بشكل أقل بمقدار $5$ نقاط، لذا تقع هذه النقطة فوق الخط.

أربع مجموعات بيانات بنفس r وخط الانحدار ولكن بأشكال مختلفة
تحذير بخصوص $r$ والخط: جميع مجموعات البيانات الأربع لها نفس $r=0.82$ ونفس $\hat{y}=3.0+0.5x$، لكن الأولى فقط هي خطية حقاً. مخططات التشتت متشابهة تقريباً — إلا أن مخطط البواقي أسفل كل منها يكشف عن المنحنى والنقطة الشاذة والنقطة ذات التأثير العالي.
2.8

Least-Squares Regression and Its Fit · ⁨الانحدار بأقل مربعات وملاءمته⁩

Syllabus · ⁨المنهج⁩
English

Enduring Understanding (DAT-1): Regression models may allow us to predict responses to changes in an explanatory variable.

Learning Objective DAT-1.G: Estimate parameters for the least-squares regression line model. [Skill 2.C]

  • DAT-1.G.1 The least-squares regression model minimizes the sum of the squares of the residuals and contains the point $(\bar{x}, \bar{y})$.
  • DAT-1.G.2 The slope, $b$, of the regression line can be calculated as $b = r \left( \dfrac{s_y}{s_x} \right)$ where $r$ is the correlation between $x$ and $y$, $s_y$ is the sample standard deviation of the response variable, $y$, and $s_x$ is the sample standard deviation of the explanatory variable, $x$.
  • DAT-1.G.3 Sometimes, the $y$-intercept of the line does not have a logical interpretation in context.
  • DAT-1.G.4 In simple linear regression, $r^2$ is the square of the correlation, $r$. It is also called the coefficient of determination. $r^2$ is the proportion of variation in the response variable that is explained by the explanatory variable in the model.

Learning Objective DAT-1.H: Interpret coefficients for the least-squares regression line model. [Skill 4.B]

  • DAT-1.H.1 The coefficients of the least-squares regression model are the estimated slope and $y$-intercept.
  • DAT-1.H.2 The slope is the amount that the predicted $y$-value changes for every unit increase in $x$.
  • DAT-1.H.3 The $y$-intercept value is the predicted value of the response variable when the explanatory variable is equal to $0$. The formula for the $y$-intercept, $a$, is $a = \bar{y} - b\bar{x}$.
العربية

فهم دائم (DAT-1): قد تسمح لنا نماذج الانحدار بالتنبؤ بالاستجابات للتغيرات في متغير مفسر.

هدف التعلم DAT-1.G: تقدير معاملات نموذج خط الانحدار المربعات الصغرى. [مهارة 2.C]

  • DAT-1.G.1 يقلل نموذج الانحدار المربعات الصغرى مجموع مربعات البواقي ويحتوي على النقطة $(\bar{x}, \bar{y})$.
  • DAT-1.G.2 يمكن حساب ميل خط الانحدار، $b$، باستخدام $b = r \left( \dfrac{s_y}{s_x} \right)$ حيث $r$ هو معامل الارتباط بين $x$ و$y$، $s_y$ هو الانحراف المعياري للعينة للمتغير المستجيب، $y$، و$s_x$ هو الانحراف المعياري للعينة للمتغير التوضيحي، $x$.
  • DAT-1.G.3 أحيانًا، لا يكون للقاطع المحوري $y$ تفسير منطقي في السياق.
  • DAT-1.G.4 في الانحدار الخطي البسيط، $r^2$ هو مربع معامل الارتباط، $r$. يُسمى أيضًا معامل التحديد. $r^2$ يمثل نسبة التباين في المتغير المستجيب التي يفسرها المتغير التوضيحي في النموذج.

هدف التعلم DAT-1.H: تفسير المعاملات لنموذج خط الانحدار المربعات الصغرى. [مهارة 4.B]

  • DAT-1.H.1 معاملات نموذج الانحدار المربعات الصغرى هي الميل المقدر والقاطع المحوري $y$.
  • DAT-1.H.2 الميل هو مقدار التغير في القيمة المتوقعة لـ $y$ لكل زيادة بمقدار وحدة واحدة في $x$.
  • DAT-1.H.3 قيمة القاطع المحوري $y$ هي القيمة المتوقعة للمتغير المستجيب عندما يكون المتغير التوضيحي مساويًا لـ $0$. صيغة القاطع المحوري $y$، $a$، هي $a = \bar{y} - b\bar{x}$.

Source: College Board AP Course and Exam Description · ⁨المصدر: وصف دورة وامتحان College Board AP⁩

English

The line minimizes the sum of squared residuals. Its fit is measured by:

  • $s$, the standard deviation of the residuals – the typical prediction error, in the response's units.
  • $r^2$, the coefficient of determination 决定系数 – the proportion of the variation in $y$ that the linear model explains (a value between $0$ and $1$; multiply by $100$ to state it as a percent). Report it in context: "$r^2 = 0.81$ means 81% of the variation in $y$ is explained by the linear relationship with $x$."
العربية
خط أقل المربعات يقلل مجموع المربعات للبقايا

يقلل الخط مجموع المربعات للبقايا. تُقاس ملاءمته بما يلي:

  • $s$، انحراف معياري للبقايا – خطأ التنبؤ النموذجي، بوحدات المتغير المستجيب.
  • $r^2$، معامل التحديد – نسبة التباين في $y$ التي يفسرها النموذج الخطي (قيمة بين $0$ و$1$؛ اضرب في $100$ للتعبير عنها كنسبة مئوية). أدرجها في السياق: "يعني $r^2 = 0.81$ أن 81% من التباين في $y$ يُفسر بالعلاقة الخطية مع $x$."
Vocabulary · ⁨مفردات⁩ Train · ⁨تدريب⁩
English العربية
associated/əˈsəʊsɪeɪtɪd/ مرتبطة
explanatory variable/ekˈsplænətəri ˈveərɪəbl/ المتغير التفسيري
response variable/rɪˈspɒns ˈveərɪəbl/ متغير الاستجابة
two-way table/tuː weɪ ˈteɪbl/ جدول ثنائي الأبعاد
marginal distributions/ˈmɑːdʒɪnl ˌdɪstrɪˈbjuːʃnz/ التوزيعات الهامشية
conditional distribution/kənˈdɪʃənl ˌdɪstrɪˈbjuːʃn/ التوزيع الشرطي
Segmented bar charts/seɡˈmentɪd bɑː tʃɑːts/ مخططات الأشرطة المجزأة
scatterplot/ˈskætəplɒt/ المخطط المبعثر
correlation coefficient/ˌkɒrɪˈleɪʃn ˌkəʊɪˈfɪʃənt/ معامل الارتباط
least-squares regression line/liːst skweəz rɪˈɡreʃn laɪn/ خط انحدار المربعات الصغرى
slope/sləʊp/ الميل
y-intercept/waɪ ˌɪntəˈsept/ القاطع الصادي
extrapolation/ekˈstræpəleɪʃn/ الاستقراء الخارجي
residual/rɪˈsɪdʒuːəl/ حاصل الباقي
residual plot/rɪˈsɪdʒuːəl plɒt/ مخطط البواقي
coefficient of determination/ˌkəʊɪˈfɪʃənt ɒv dɪˌtɜːmɪˈneɪʃn/ معامل التحديد
high-leverage/haɪ ˈliːvərɪdʒ/ ذو التأثير العالي (High-leverage)
influential/ˌɪnfluːˈenʃl/ مؤثر
2.9

Departures from Linearity · ⁨الانحرافات عن الخطية⁩

Syllabus · ⁨المنهج⁩
English

Enduring Understanding (DAT-1): Regression models may allow us to predict responses to changes in an explanatory variable.

Learning Objective DAT-1.I: Identify influential points in regression. [Skill 2.A]

  • DAT-1.I.1 An outlier in regression is a point that does not follow the general trend shown in the rest of the data and has a large residual when the Least Squares Regression Line (LSRL) is calculated.
  • DAT-1.I.2 A high-leverage point in regression has a substantially larger or smaller $x$-value than the other observations have.
  • DAT-1.I.3 An influential point in regression is any point that, if removed, changes the relationship substantially. Examples include much different slope, $y$-intercept, and/or correlation. Outliers and high leverage points are often influential.

Learning Objective DAT-1.J: Calculate a predicted response using a least-squares regression line for a transformed data set. [Skill 2.C]

  • DAT-1.J.1 Transformations of variables, such as evaluating the natural logarithm of each value of the response variable or squaring each value of the explanatory variable, can be used to create transformed data sets, which may be more linear in form than the untransformed data.
  • DAT-1.J.2 Increased randomness in residual plots after transformation of data and/or movement of $r^2$ to a value closer to 1 offers evidence that the least-squares regression line for the transformed data is a more appropriate model to use to predict responses to the explanatory variable than the regression line for the untransformed data.
العربية

فهم دائم (DAT-1): قد تسمح لنا نماذج الانحدار بالتنبؤ بالاستجابات للتغيرات في متغير مفسر.

هدف التعلم DAT-1.I: تحديد النقاط المؤثرة في الانحدار. [مهارة 2.A]

  • DAT-1.I.1 القيمة الشاذة في الانحدار هي نقطة لا تتبع الاتجاه العام الموضح في بقية البيانات ولها باقٍ كبير عند حساب خط الانحدار المربعات الصغرى (LSRL).
  • DAT-1.I.2 النقطة ذات التأثير العالي في الانحدار لها قيمة $x$ أكبر أو أصغر بشكل ملحوظ مقارنة بالقيم التي تمتلكها المشاهدات الأخرى.
  • DAT-1.I.3 النقطة المؤثرة في الانحدار هي أي نقطة إذا تم إزالتها تتغير العلاقة بشكل كبير. تشمل الأمثلة اختلافًا كبيرًا في الميل، والقاطع المحوري $y$، و/أو معامل الارتباط. غالبًا ما تكون القيم الشاذة والنقاط ذات التأثير العالي مؤثرة.

هدف التعلم DAT-1.J: حساب استجابة متوقعة باستخدام خط انحدار المربعات الصغرى لمجموعة بيانات محولة. [مهارة 2.C]

  • DAT-1.J.1 يمكن استخدام تحويلات المتغيرات، مثل حساب اللوغاريتم الطبيعي لكل قيمة للمتغير المستجيب أو تربيع كل قيمة للمتغير التوضيحي، لإنشاء مجموعات بيانات محولة قد تكون أكثر خطيًا من البيانات الأصلية.
  • DAT-1.J.2 زيادة العشوائية في مخططات البقايا بعد تحويل البيانات و/أو تحرك $r^2$ إلى قيمة أقرب إلى 1 يقدم دليلاً على أن خط الانحدار المربعات الصغرى للبيانات المحولة هو نموذج أكثر ملاءمة للاستخدام للتنبؤ بالاستجابات للمتغير التوضيحي مقارنة بخط الانحدار للبيانات الأصلية.

Source: College Board AP Course and Exam Description · ⁨المصدر: وصف دورة وامتحان College Board AP⁩

English

Some points strongly affect the line. A high-leverage 高杠杆 point has an extreme $x$-value; an influential 有影响的 point noticeably changes the slope or $r$ when removed; an outlier here is a point with a large residual. When the pattern is curved, transform a variable (e.g. take a log) to straighten it, then fit a line to the transformed data.

العربية

بعض النقاط تؤثر بشدة على الخط. النقطة ذات التأثير العالي لها قيمة extreme على $x$-axis؛ النقطة المؤثرة تغير الميل أو $r$ بشكل ملحوظ عند إزالتها؛ أما النقطة الشاذة هنا فهي نقطة ذات باقي كبير. عندما يكون النمط منحنيًا، قم بـ تحويل متغير (مثل أخذ اللوغاريتم) لتقويمه، ثم-fit خط على البيانات المحولة.

2.9

Exam tips · ⁨نصائح للامتحان⁩

English
  • On a scatterplot describe direction, form, strength, and outliers; $r$ ranges $-1$ to $1$.
  • Correlation is not causation — a lurking variable can drive both.
  • Interpret the slope of the least-squares line in context ("per one unit of $x$, predicted $y$ changes by $b$").
  • Check a residual plot: no pattern means a line fits; a curve means it does not. Avoid extrapolation.
  • $r^2$ is the fraction of variation in $y$ explained by the model.
العربية
  • على مخطط التشتت صف الاتجاه والشكل والقوة والنقاط الشاذة؛ تتراوح $r$ بين $-1$ و$1$.
  • الارتباط ليس سببية – قد يكون هناك متغير خفي يقود كلاهما.
  • فسر ميل خط أقل المربعات في السياق ("لكل وحدة واحدة من $x$، يتغير $y$ المتوقع بمقدار $b$").
  • تحقق من مخطط البواقي: عدم وجود نمط يعني أن الخط مناسب؛ المنحنى يعني أنه غير مناسب. تجنب التشعب.
  • $r^2$ هو كسر التباين في $y$ الذي يفسره النموذج.

Interactive lessons on this topic · ⁨دروس تفاعلية حول هذا الموضوع⁩

Work through it step by step, with instant-check exercises. · ⁨ا-working عليه خطوة بخطوة، مع تمارين تحقق فوري.⁩

Past Papers · ⁨أوراق الامتحانات السابقة⁩

More topics in AP Statistics · ⁨AP الإحصاء⁩ · ⁨المزيد من المواضيع في AP Statistics · ⁨AP الإحصاء⁩⁩

Log in or create account · ⁨تسجيل الدخول أو إنشاء حساب⁩

IGCSE, A-Level & AP