Skip to content · ⁨コンテンツへスキップ⁩
Subjects · ⁨科目⁩

AP Microeconomics · ⁨AP 経済学⁩

Tips · ⁨ヒント⁩

AP Microeconomics covers scarcity and opportunity cost, supply and demand, elasticity, production and costs, the four market structures, factor markets, and market failure with government intervention. It is a small syllabus studied deeply.

The graph is the answer. Most free-response marks are awarded for a correctly labelled diagram — axes named, curves labelled, the new equilibrium marked and the direction of the shift shown. A written explanation of a shift you did not draw earns very little.

Practise drawing them quickly and correctly by hand, especially the cost curves and perfect competition versus monopoly, which appear constantly.

Notes cover all six units with the cost curves and market diagrams drawn rather than described. Past FRQs with scoring guidelines are in the library. Micro's marks frequently go to showing the shift and its consequence, so the worked answers keep the graph at the centre.

  • 1

    Basic Economic Concepts · ⁨経済学の基本概念⁩

    Watch lesson · ⁨レッスンを視聴⁩
    1.1

    Scarcity

    Syllabus · ⁨シラバス⁩
    English

    Enduring Understanding (MKT-1): Most resources are scarce, and in most cases the use of resources involves constraints and trade-offs.

    Learning Objective MKT-1.A: Define resources and the cause(s) of their scarcity.

    • MKT-1.A.1 Economic trade-offs arise from the lack of sufficient resources (scarcity) to meet society's wants and needs.
    • MKT-1.A.2 Most factors of production (such as land, labor, and capital) are scarce, but some factors of production (such as established knowledge) may not be scarce due to their non-rival nature.
    日本語

    持続的認識(MKT-1): ほとんどの資源は希少であり、多くの場合、資源の使用には制約とトレードオフが伴う。

    学習目標 MKT-1.A: 資源およびその希少性の原因を定義する。

    • MKT-1.A.1 経済的トレードオフは、社会の欲求や必要を満たすのに十分な資源(希少性)がないことに起因する。
    • MKT-1.A.2 土地、労働、資本などの生産要因の多くは希少であるが、非競合性を持つため、確立された知識などの一部の生産要因は希少ではない可能性がある。
    Source: College Board AP Course and Exam Description · ⁨出典: College Board AP コースおよび試験説明書⁩

    English

    Economics 经济学 begins with one stubborn fact: people's wants are effectively unlimited, but the resources 资源 to satisfy them are limited. This gap is scarcity 稀缺性, and it is why economics exists – if everything were free and endless, there would be nothing to decide.

    The resources (the factors of production 生产要素) are land (natural resources), labor 劳动 (human effort), capital 资本 (tools, machines, buildings), and entrepreneurship 企业家才能 (organizing the other three and taking risks). Because these are scarce, every economy must answer three questions: what to produce, how to produce it, and for whom to produce.

    Scarcity forces choice, and every choice has an opportunity cost 机会成本 – the value of the next-best alternative you give up. This single idea runs through the whole course: the true cost of anything is what you sacrifice to get it, not just the money you pay.

    日本語
    An outdoor market: markets allocate scarce resources among competing uses
    An outdoor market: markets allocate scarce resources among competing uses

    Economics 经济学 begins with one stubborn fact: people's wants are effectively unlimited, but the resources 资源 to satisfy them are limited. This gap is scarcity 稀缺性, and it is why economics exists – if everything were free and endless, there would be nothing to decide.

    The resources (the factors of production 生产要素) are land (natural resources), labor 劳动 (human effort), capital 资本 (tools, machines, buildings), and entrepreneurship 企业家才能 (organizing the other three and taking risks). Because these are scarce, every economy must answer three questions: what to produce, how to produce it, and for whom to produce.

    Scarcity forces choice, and every choice has an opportunity cost 机会成本 – the value of the next-best alternative you give up. This single idea runs through the whole course: the true cost of anything is what you sacrifice to get it, not just the money you pay.

    Vocabulary · ⁨語彙⁩ Train · ⁨練習する⁩
    English 日本語
    Economics/ˌiːkəˈnɒmɪks/ 経済
    resources/rɪˈzɔːsɪz/ 資源
    scarcity/ˈskeəsɪti/ 希少性
    factors of production/ˈfæktəz ɒv prəˈdʌkʃn/ 生産要因
    labor/ˈleɪbə/ 労働
    capital/ˈkæpɪtl/ 資本
    entrepreneurship/ˌɒntrɪprəˈnjʊəʃɪp/ 起業家精神
    opportunity cost/ɒpəˈtjuːnɪti kɒst/ 機会原価がある場合
    1.2

    Resource Allocation and Economic Systems

    Syllabus · ⁨シラバス⁩
    English

    Enduring Understanding (MKT-1): Most resources are scarce, and in most cases the use of resources involves constraints and trade-offs.

    Learning Objective MKT-1.B: Define how resource allocation is influenced by the economic system adopted by society.

    • MKT-1.B.1 Resource allocation involves answering three basic questions: What goods and services to produce? How to produce those goods and services? And who consumes those goods and services?
    • MKT-1.B.2 Resource allocation is significantly influenced by the economic system adopted by society, such as command economy, market economy, or mixed economy. Each system involves a particular set of institutional arrangements and a coordinating mechanism for allocating scarce resources and distributing output.
    日本語

    持続的認識(MKT-1): ほとんどの資源は希少であり、多くの場合、資源の使用には制約とトレードオフが伴う。

    学習目標 MKT-1.B: 資源配分が採用された経済システムによってどのように影響されるかを定義する。

    • MKT-1.B.1 資源配分とは、次の3つの基本的な問いに答えることである。「何を・どのような商品を・サービスの何を作るか?」「どのようにしてその商品・サービスを生産するか?」そして「その商品・サービスを誰が消費するか?」
    • MKT-1.B.2 資源配分は、社会が採用する経済体制(指令経済、市場経済、混合経済など)に大きく影響される。各経済体制には、希少資源の配分と産出物の分配を担う特定の制度安排および調整メカニズムが含まれる。

    Source: College Board AP Course and Exam Description · ⁨出典: College Board AP コースおよび試験説明書⁩

    English

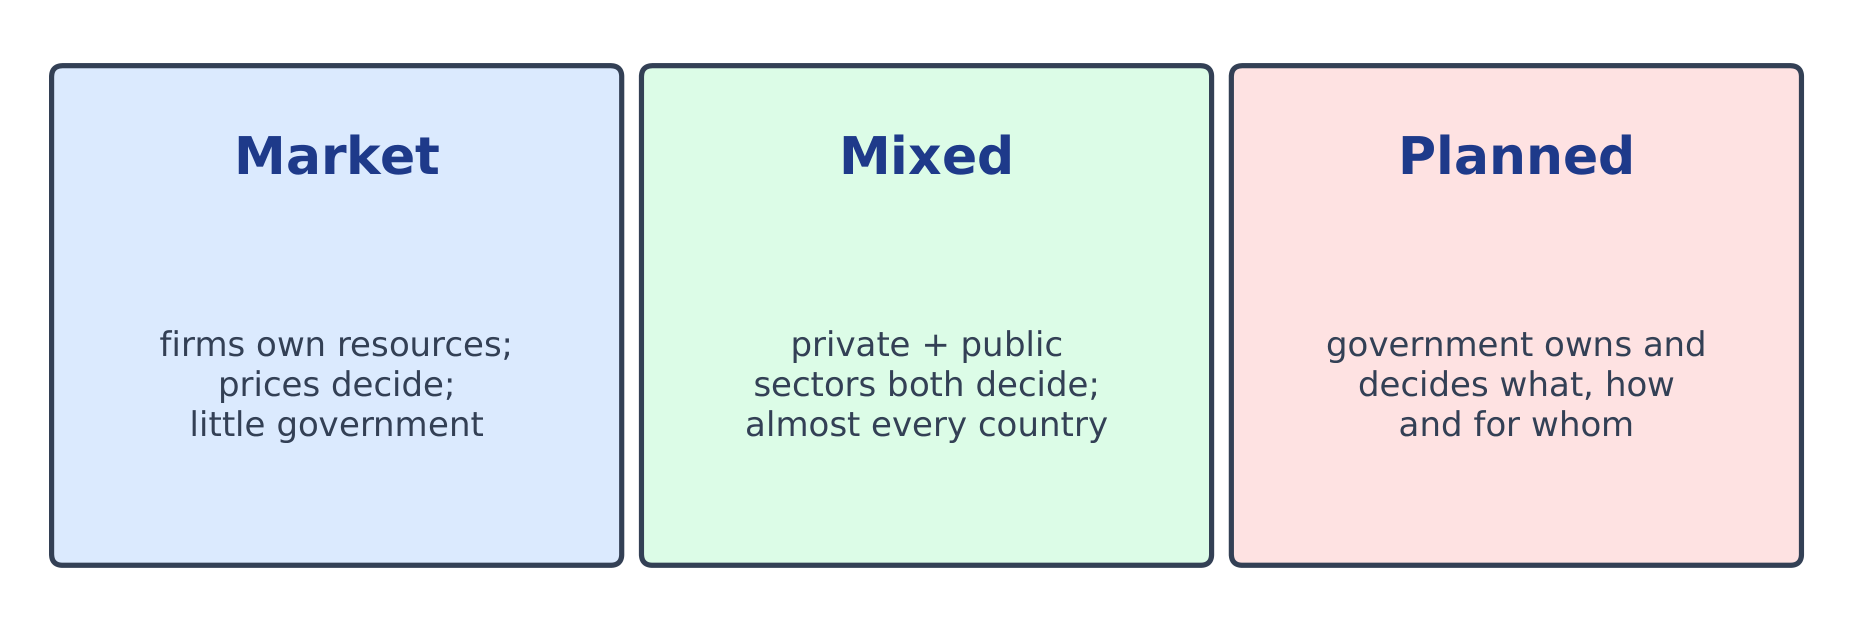
    An economic system 经济体制 is a society's way of answering the three questions.

    • In a market economy 市场经济, private buyers and sellers decide through prices; self-interest and competition coordinate them (the "invisible hand").
    • In a command economy 计划经济, the government owns resources and plans production.
    • Real economies are mixed 混合经济 – mostly markets, with government providing some goods and correcting problems.

    The key advantage of markets is that prices carry information and incentives 激励 automatically, with no central planner needed.

    日本語

    An economic system 经济体制 is a society's way of answering the three questions.

    Economic systems form a spectrum from a free market to full government planning
    Economic systems form a spectrum from a free market to full government planning
    • In a market economy 市场经济, private buyers and sellers decide through prices; self-interest and competition coordinate them (the "invisible hand").
    • In a command economy 计划经济, the government owns resources and plans production.
    • Real economies are mixed 混合经济 – mostly markets, with government providing some goods and correcting problems.

    The key advantage of markets is that prices carry information and incentives 激励 automatically, with no central planner needed.

    Explore · ⁨探索⁩

    Explore how prices coordinate a market · ⁨価格が市場を調整する仕組みを調べる⁩

    In a market economy no one is in charge, yet the price finds the level where quantity supplied meets quantity demanded. Drag the demand and supply lines and watch the equilibrium price act as a signal and an incentive. · ⁨市場経済では誰も指揮官ではないが、価格は供給量と需要量が一致するレベルを見つける。需要曲線と供給曲線をドラッグして、均衡価格がシグナルおよびインセンティブとして機能することを観察せよ。⁩

    Vocabulary · ⁨語彙⁩ Train · ⁨練習する⁩
    English 日本語
    economic system/ˌiːkəˈnɒmɪk ˈsɪstəm/ 経済体制
    market economy/ˈmɑːkɪt ɪˈkɒnəmi/ 市場経済
    command economy/kəˈmænd ɪˈkɒnəmi/ 指令経済
    mixed/mɪkst/ 混在している
    incentives/ɪnˈsentɪvz/ インセンティブ
    1.3

    The Production Possibilities Curve

    Syllabus · ⁨シラバス⁩
    English

    Enduring Understanding (MKT-1): Most resources are scarce, and in most cases the use of resources involves constraints and trade-offs.

    Learning Objective MKT-1.C: a. Define (using graphs as appropriate) the production possibilities curve (PPC) and related terms. b. Explain (using graphs as appropriate) how the production possibilities curve (PPC) illustrates opportunity costs, trade-offs, inefficiency, efficiency, and economic growth or contraction under various conditions. c. Calculate (using data from PPCs or tables as appropriate) opportunity cost.

    • MKT-1.C.1 The PPC is a model used to show the trade-offs associated with allocating resources.
    • MKT-1.C.2 The PPC can be used to illustrate the concepts of scarcity, opportunity cost, efficiency, underutilized resources, and economic growth or contraction.
    • MKT-1.C.3 The shape of the PPC depends on whether opportunity costs are constant, increasing, or decreasing.
    • MKT-1.C.4 The PPC can shift due to changes in factors of production as well as changes in productivity/technology.
    • MKT-1.C.5 Economic growth results in an outward shift of the PPC.
    日本語

    持続的認識(MKT-1): ほとんどの資源は希少であり、多くの場合、資源の使用には制約とトレードオフが伴う。

    学習目標 MKT-1.C: a. 生産可能性 Frontier(PPC)および関連用語を定義せよ(必要に応じてグラフを使用)。 b. 生産可能性 Frontier(PPC)が、様々な条件下での機会費用、トレードオフ、非効率性、効率性、および経済成長または縮退をどのように示しているかを説明せよ(必要に応じてグラフを使用)。 c. 機会費用を計算する(PPC または表のデータを使用する場合)。

    • MKT-1.C.1 PPC は、資源の配分に伴うトレードオフを示すためのモデルである。
    • MKT-1.C.2 PPC は、希少性、機会費用、効率性、未利用資源、および経済成長または縮退の概念を説明するために使用できる。
    • MKT-1.C.3 PPC の形状は、機会費用が一定か、増加するか、減少するかによって決まる。
    • MKT-1.C.4 PPC は、生産要素の変化や生産性・技術の変化によりシフトすることがある。

    • MKT-1.C.5 経済成長は、PPC が外側へシフトすることを意味する。

    Source: College Board AP Course and Exam Description · ⁨出典: College Board AP コースおよび試験説明書⁩

    English
    The production possibility frontier

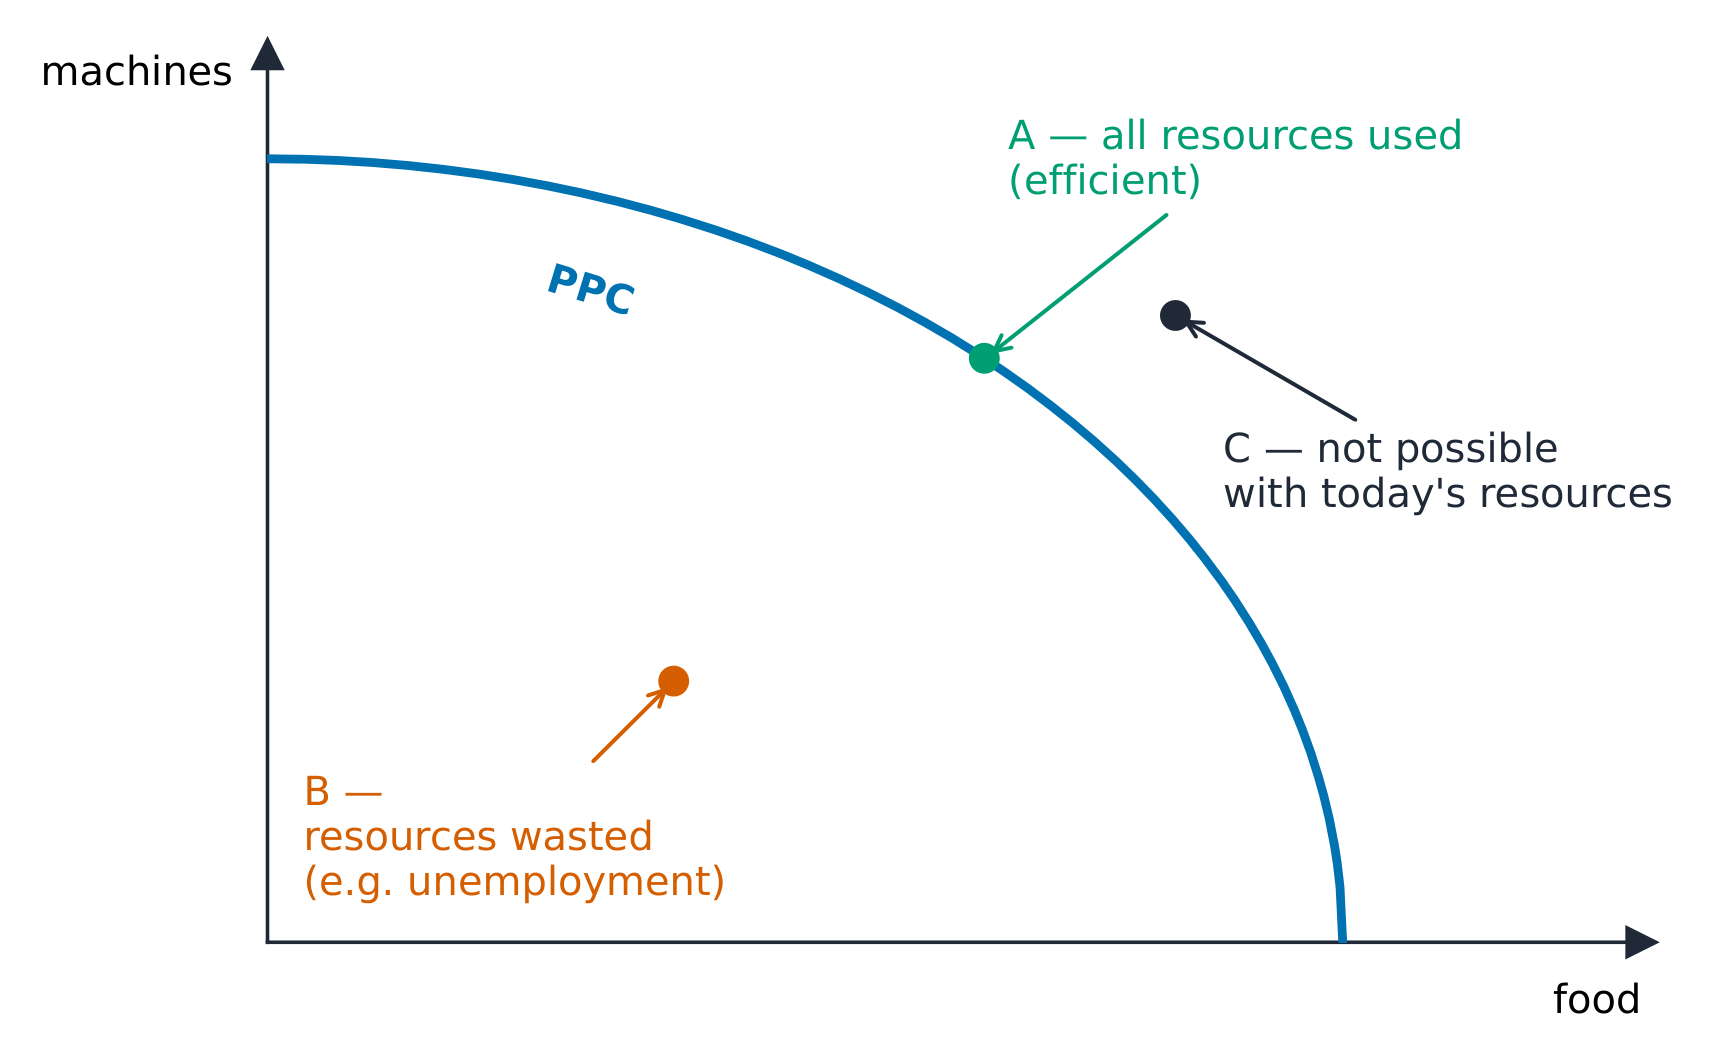
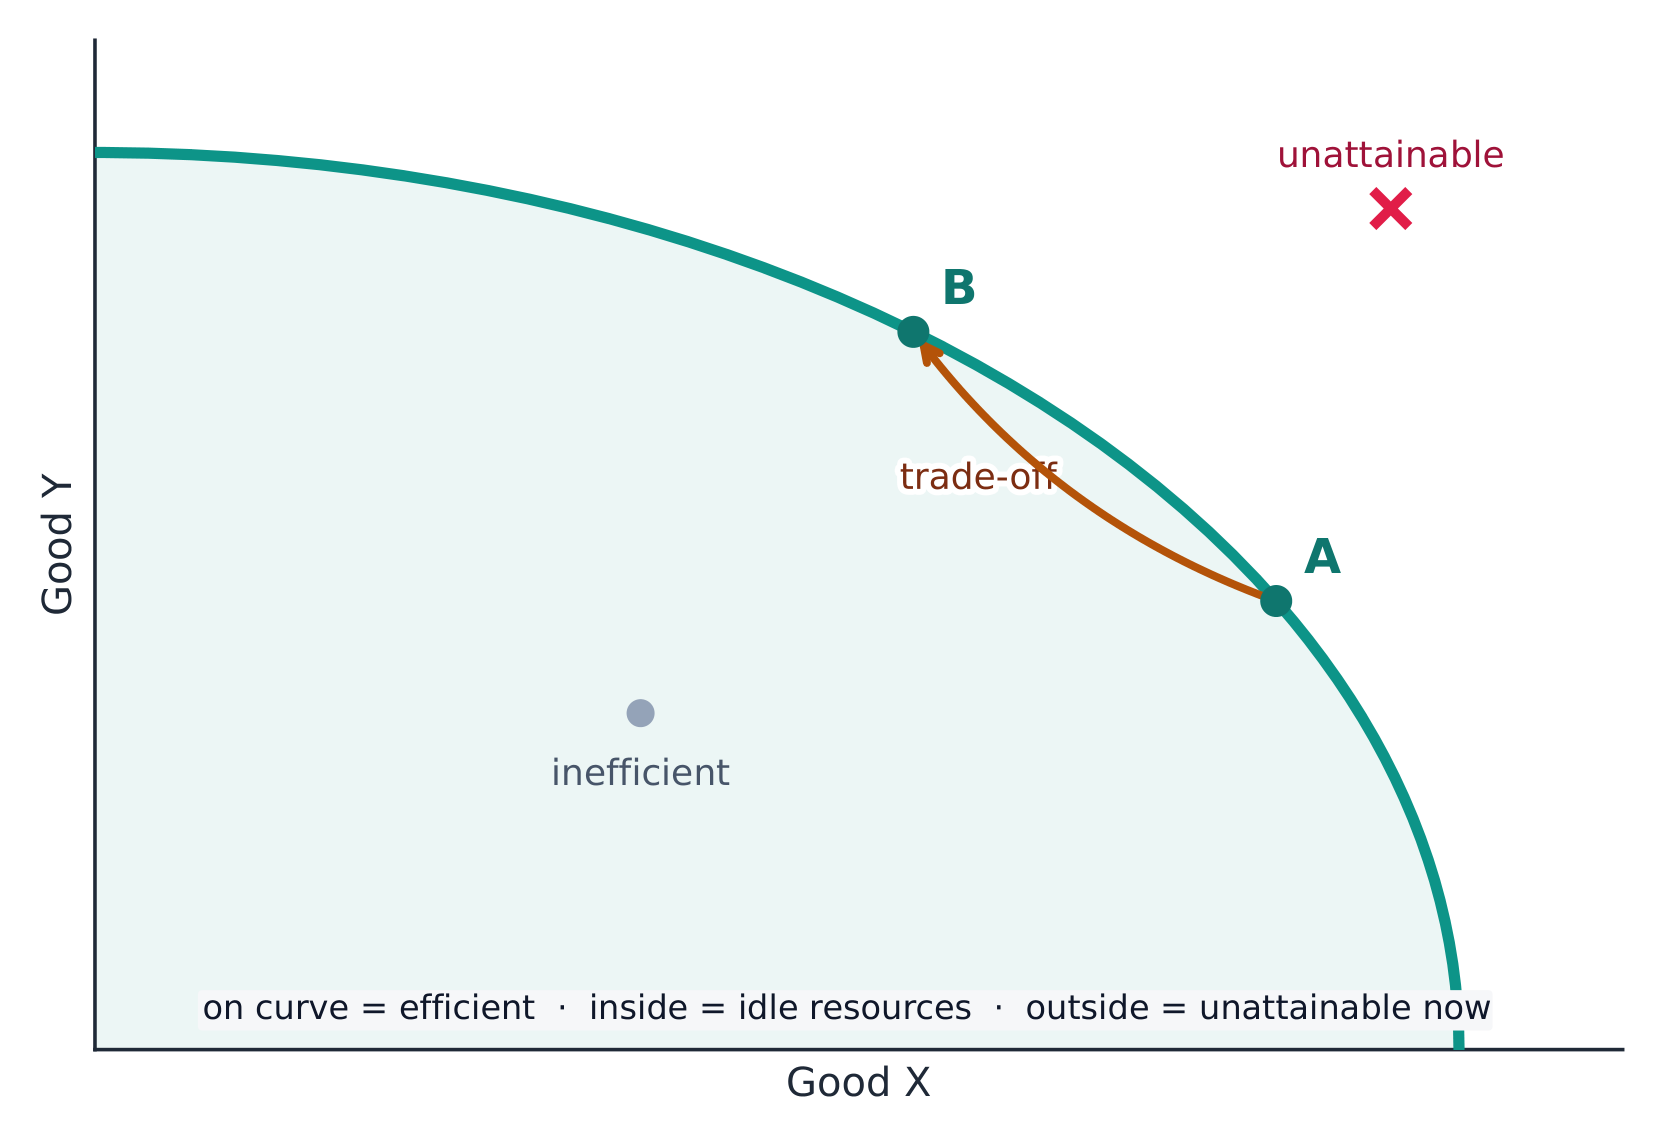
    The production possibilities curve (PPC) 生产可能性曲线 shows the maximum combinations of two goods an economy can produce with its resources and technology fully and efficiently used.

    • Points on the curve are efficient 有效率; points inside are inefficient (wasted or unemployed resources); points outside are currently unattainable 无法实现.
    • The PPC's downward slope shows opportunity cost: making more of one good means making less of the other. The slope at a point is the opportunity cost of the good on the horizontal axis.
    • A bowed-out (concave) PPC shows increasing opportunity cost – resources are not equally suited to both goods, so making more of one costs ever more of the other. A straight-line PPC means constant opportunity cost.
    • Economic growth 经济增长 (more resources, better technology) shifts the whole curve outward.

    Exam skill: be ready to read opportunity cost off a PPC, decide if a point is efficient/inefficient/unattainable, and explain what shifts the curve.

    日本語
    The production possibility frontier

    The production possibilities curve (PPC) 生产可能性曲线 shows the maximum combinations of two goods an economy can produce with its resources and technology fully and efficiently used.

    Points on, inside, and outside the production possibilities curve
    Points on, inside, and outside the production possibilities curve
    • Points on the curve are efficient 有效率; points inside are inefficient (wasted or unemployed resources); points outside are currently unattainable 无法实现.
    • The PPC's downward slope shows opportunity cost: making more of one good means making less of the other. The slope at a point is the opportunity cost of the good on the horizontal axis.
    • A bowed-out (concave) PPC shows increasing opportunity cost – resources are not equally suited to both goods, so making more of one costs ever more of the other. A straight-line PPC means constant opportunity cost.
    • Economic growth 经济增长 (more resources, better technology) shifts the whole curve outward.

    Exam skill: be ready to read opportunity cost off a PPC, decide if a point is efficient/inefficient/unattainable, and explain what shifts the curve.

    A production possibilities curve: efficient, inefficient, and unattainable points
    A production possibilities curve: efficient, inefficient, and unattainable points
    Explore · ⁨探索⁩

    Explore the production possibilities curve · ⁨生産可能性曲線を探索する⁩

    Making more of one good means giving up some of the other — that trade-off is the opportunity cost, and the bowed shape shows the law of increasing opportunity cost. Drag along the curve, then grow the economy to push the whole frontier out. · ⁨ある財の生産を増やすことは、他の財の生産を諦めることを意味する。このトレードオフが機会費用であり、凸型の形状は機会費用逓増の法則を示している。曲線をドラッグして操作し、経済全体を成長させてフロンティア全体を外側へ押し広げよ。⁩

    Vocabulary · ⁨語彙⁩ Train · ⁨練習する⁩
    English 日本語
    production possibilities curve (PPC)/prəˈdʌkʃn ˌpɒsəˈbɪlɪtiz kɜːv/ 生産可能性 Frontier(PPF)
    efficient/ɪˈfɪʃənt/ 効率的である
    unattainable/ʌnəˈteɪnəbl/ 到達不可能である
    Economic growth/ˌiːkəˈnɒmɪk ɡrəʊθ/ 経済成長
    1.4

    Comparative Advantage and Gains from Trade

    Syllabus · ⁨シラバス⁩
    English

    Enduring Understanding (MKT-2): The consequences of scarcity can be mitigated through specialization in production and by exchange.

    Learning Objective MKT-2.A: a. Define absolute advantage and comparative advantage. b. Determine (using data from PPCs or tables as appropriate) absolute and comparative advantage.

    • MKT-2.A.1 Absolute advantage describes a situation in which an individual, business, or country can produce more of a good or service than any other producer with the same quantity of resources.
    • MKT-2.A.2 Comparative advantage describes a situation in which an individual, business, or country can produce a good or service at a lower opportunity cost than another producer.

    Learning Objective MKT-2.B: a. Explain (using data from PPCs or tables as appropriate) how specialization according to comparative advantage with appropriate terms of trade can lead to gains from trade. b. Calculate (using data from PPCs or tables as appropriate) mutually beneficial terms of trade.

    • MKT-2.B.1 Production specialization according to comparative advantage, not absolute advantage, results in exchange opportunities that lead to consumption possibilities beyond the PPC.
    • MKT-2.B.2 Comparative advantage and opportunity costs determine the terms of trade for exchange under which mutually beneficial trade can occur.
    日本語

    長期的理解 (MKT-2): 希少性の結果は、生産における専門化および交換を通じて軽減できる。

    学習目標 MKT-2.A: a. 絶対優位と比較優位を定義する。 b. 絶対優位と比較優位を決定する(PPC または表のデータを使用する場合)。

    • MKT-2.A.1 絶対的優位とは、同じ量の資源を用いて、他のどの生産者よりも多くの財やサービスを生産できる状態を指す。
    • MKT-2.A.2 比較優位とは、他の生産者よりも低い機会費用で財やサービスを生産できる状態を指す。

    学習目標 MKT-2.B: a. 比較優位に基づいた専門化と適切な交換条件が、どのように貿易による利益をもたらすかを説明する(PPC または表のデータを使用する場合)。 b. 相互に有益な交換条件を計算する(PPC または表のデータを使用する場合)。

    • MKT-2.B.1 絶対的優位ではなく比較優位に基づく生産の専門化は、PPC を超える消費可能性をもたらす交換の機会を生み出す。
    • MKT-2.B.2 相互利益のある貿易が行われるための交換条件(贸易条件)は、比較優位と機会費用によって決定される。

    Source: College Board AP Course and Exam Description · ⁨出典: College Board AP コースおよび試験説明書⁩

    English

    Two producers can both gain from trade by specializing 专业化.

    • A producer has an absolute advantage 绝对优势 in a good if it can make more of it with the same resources.
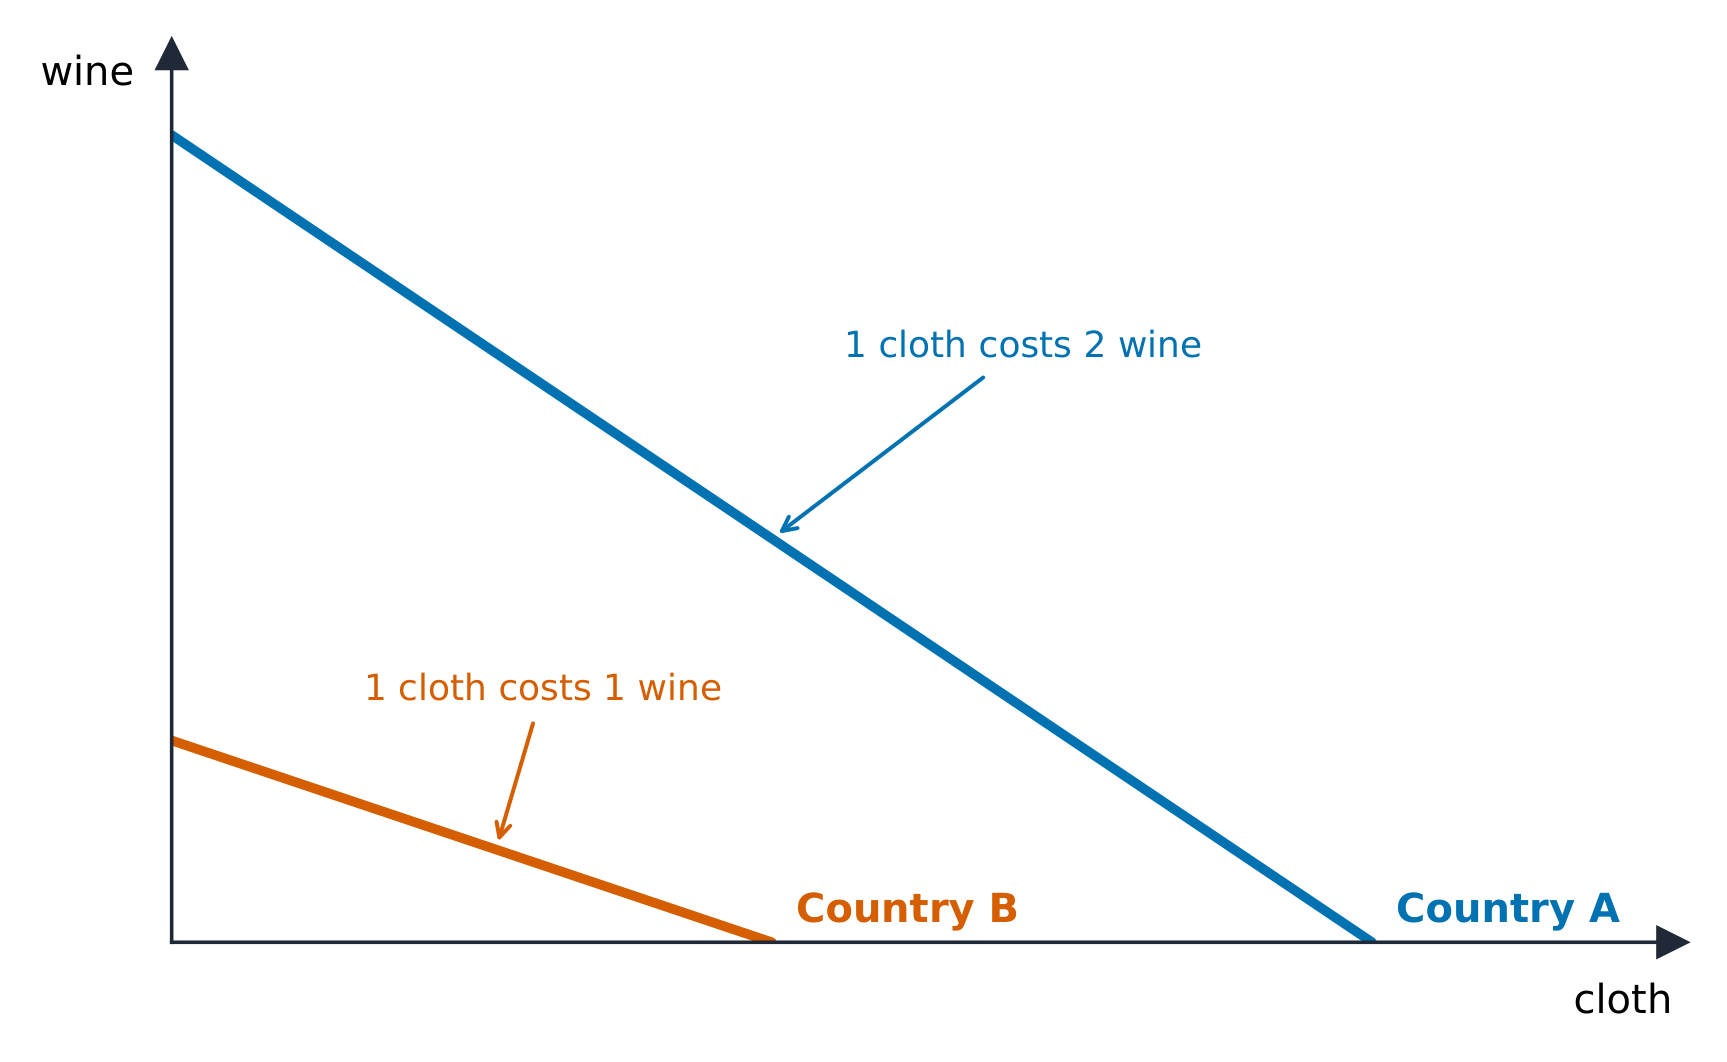
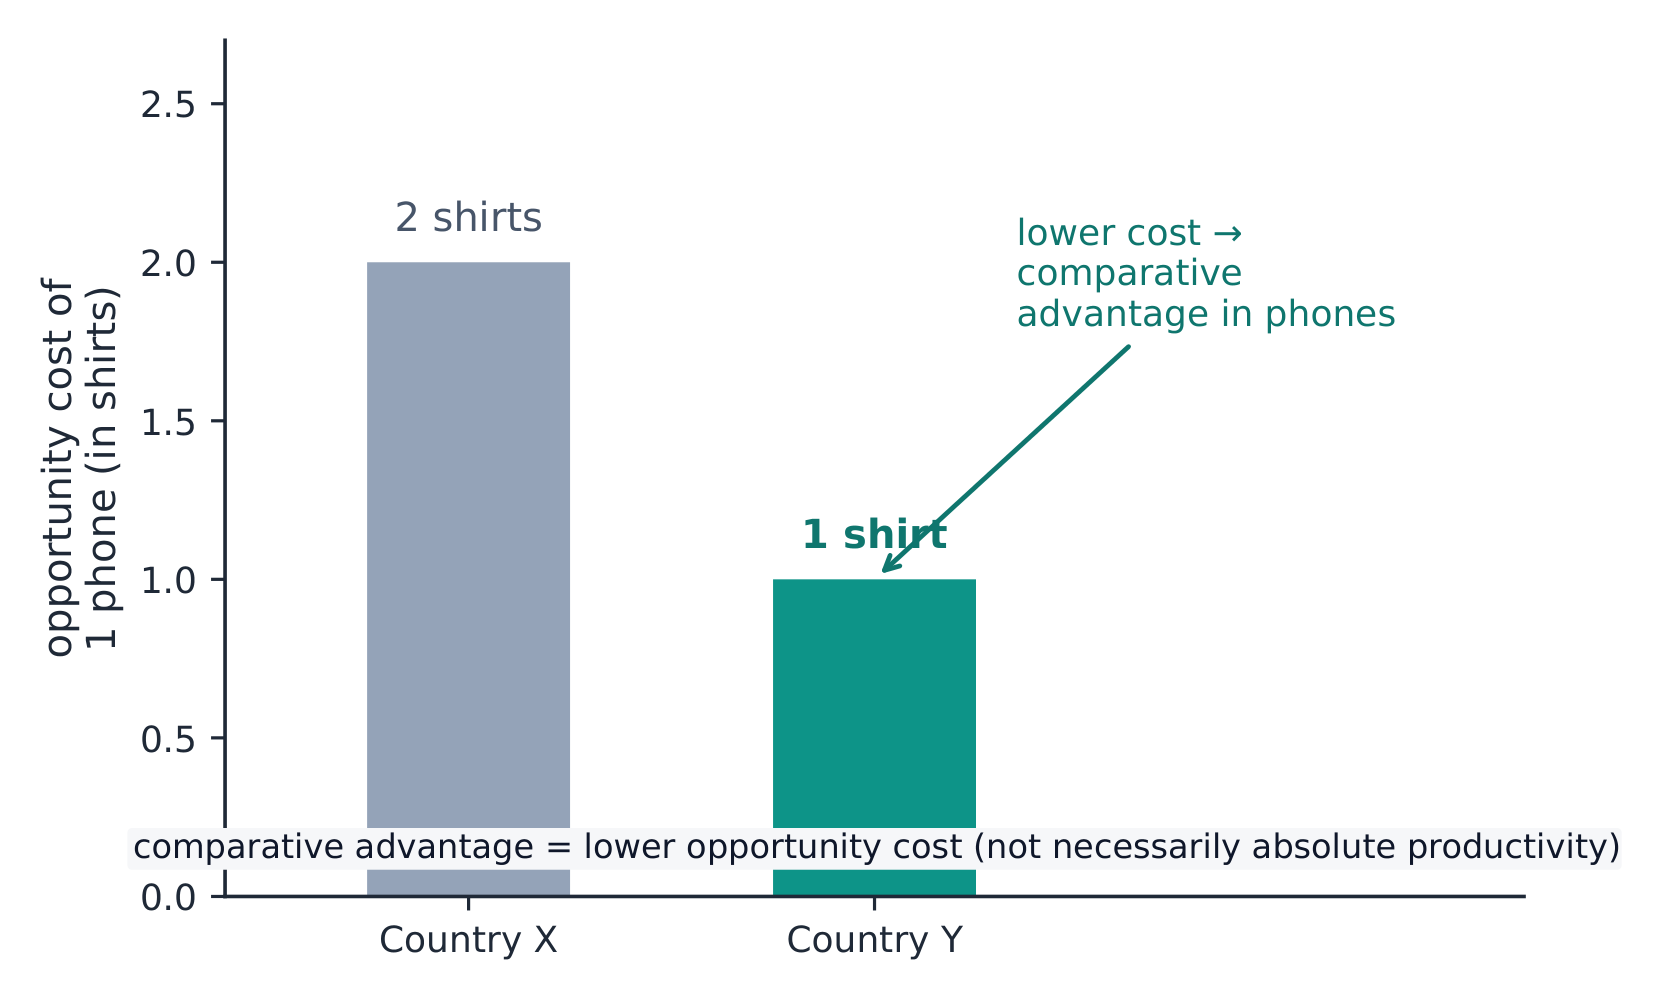
    • A producer has a comparative advantage 比较优势 if it has the lower opportunity cost for that good. Comparative advantage – not absolute – determines who should specialize.
    • Compute opportunity cost from output data: for each producer, one unit of good X costs (units of Y) $\div$ (units of X). The producer who gives up less Y should make X.
    • Both sides gain if they trade at a rate between their two opportunity costs – the terms of trade 贸易条件. Specializing by comparative advantage lets total output exceed what either could make alone, so consumption can lie outside each producer's own PPC.

    Worked example. Anna can make $20$ shirts or $10$ tables a day; Ben can make $12$ shirts or $12$ tables. For Anna one table costs $\tfrac{20}{10}=2$ shirts; for Ben it costs $\tfrac{12}{12}=1$ shirt. Ben gives up fewer shirts, so Ben specializes in tables and Anna in shirts. Any terms of trade between $1$ and $2$ shirts per table – say $1.5$ – leaves both better off than producing alone.

    Exam skill: these calculations appear almost every year – practice finding comparative advantage from both output tables and input tables, and stating a valid terms-of-trade range.

    日本語

    Two producers can both gain from trade by specializing 专业化.

    Comparative advantage comes from differently-sloped production possibilities curves
    Comparative advantage comes from differently-sloped production possibilities curves
    • A producer has an absolute advantage 绝对优势 in a good if it can make more of it with the same resources.
    • A producer has a comparative advantage 比较优势 if it has the lower opportunity cost for that good. Comparative advantage – not absolute – determines who should specialize.
    • Compute opportunity cost from output data: for each producer, one unit of good X costs (units of Y) $\div$ (units of X). The producer who gives up less Y should make X.
    • Both sides gain if they trade at a rate between their two opportunity costs – the terms of trade 贸易条件. Specializing by comparative advantage lets total output exceed what either could make alone, so consumption can lie outside each producer's own PPC.

    Worked example. Anna can make $20$ shirts or $10$ tables a day; Ben can make $12$ shirts or $12$ tables. For Anna one table costs $\tfrac{20}{10}=2$ shirts; for Ben it costs $\tfrac{12}{12}=1$ shirt. Ben gives up fewer shirts, so Ben specializes in tables and Anna in shirts. Any terms of trade between $1$ and $2$ shirts per table – say $1.5$ – leaves both better off than producing alone.

    Exam skill: these calculations appear almost every year – practice finding comparative advantage from both output tables and input tables, and stating a valid terms-of-trade range.

    Comparative advantage goes to the producer with the lower opportunity cost
    Comparative advantage goes to the producer with the lower opportunity cost
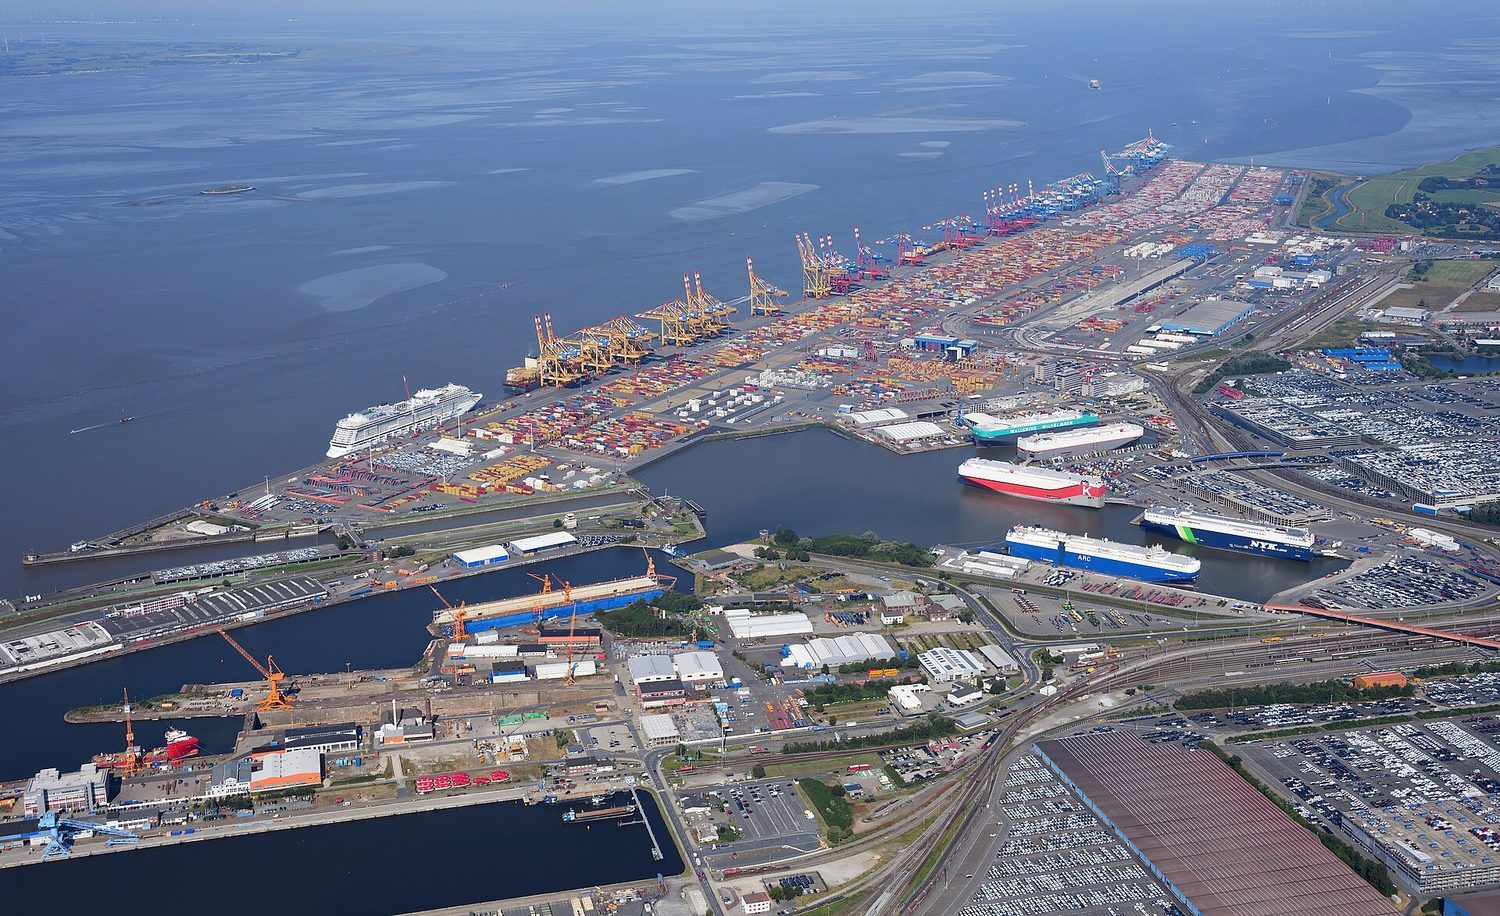
    Container shipping: comparative advantage and trade let countries specialise and gain
    Container shipping: comparative advantage and trade let countries specialise and gain
    Explore · ⁨探索⁩

    See why trade lets you consume beyond the frontier · ⁨貿易がフロンティア外での消費を可能にする理由を見る⁩

    A producer should specialize where its opportunity cost is lowest, then trade for the rest. Because the terms of trade lie between the two producers' costs, trade lets a country consume outside its own production frontier. · ⁨生産者は機会費用が最も低い分野に特化し、残りの品目は貿易によって調達すべきである。両生産者のコストの間にある交換条件により、一国は自身の生産フロンティアの外側で消費することが可能となる。⁩

    Vocabulary · ⁨語彙⁩ Train · ⁨練習する⁩
    English 日本語
    specializing/ˈspeʃəlaɪzɪŋ/ 専門化
    absolute advantage/ˈæbsəluːt ədˈvæntɪdʒ/ 絶対優位性によって生まれる
    comparative advantage/kəmˈpærətɪv ədˈvæntɪdʒ/ 比較利得
    terms of trade/tɜːmz ɒv treɪd/ 取引条件
    1.5

    Cost-Benefit Analysis

    Syllabus · ⁨シラバス⁩
    English

    Enduring Understanding (CBA-1): Rational economic decisions require the evaluation of costs and benefits.

    Learning Objective CBA-1.A: a. Define opportunity cost. b. Explain the opportunity costs associated with choices. c. Calculate the opportunity costs associated with choices.

    • CBA-1.A.1 Rational agents consider opportunity costs, whether implicit or explicit, when calculating the total economic costs of any decision.
    • CBA-1.A.2 Total benefits form the metric "utility" for consumers and total revenue for firms.

    Learning Objective CBA-1.B: a. Explain a decision by comparing total benefits and total costs (using a table or a graph when appropriate). b. Calculate total benefits and total costs (using a table or graph where appropriate).

    • CBA-1.B.1 Total net benefits, the difference between total benefits and total costs, are maximized at the optimal choice.
    • CBA-1.B.2 Some decisions permit rational agents to look at only marginal benefit and marginal cost. Other decisions cannot be broken down into increments in this way and must be evaluated by looking at total benefits and total costs.
    日本語

    長期的理解 (CBA-1): 合理的な経済的意思決定には、費用と便益の評価が必要である。
    学習目標 CBA-1.A: a. 機会費用を定義せよ。 b. 選択に伴う機会費用について説明せよ。 c. 選択に伴う機会費用を計算せよ。

    • CBA-1.A.1 合理的な行動主体は、いかなる意思決定の総経済費用を計算する際、明示的かつ隠然的な機会費用を考慮する。
    • CBA-1.A.2 総便益は、消費者にとっては「効用」という指標となり、企業にとっては総収益となる。

    学習目標 CBA-1.B: a. 総便益と総コストを比較して意思決定を説明せよ(必要に応じて表やグラフを使用)。 b. 総便益と総コストを計算せよ(必要に応じて表やグラフを使用)。

    • CBA-1.B.1 総純便益(総便益から総コストを引いたもの)は、最適な選択において最大化される。
    • CBA-1.B.2 一部の意思決定では、合理的な行動主体は限界便益と限界コストのみを参照すればよい。他の意思決定はこのような増加分に分解できず、総便益と総コストを評価する必要がある。

    Source: College Board AP Course and Exam Description · ⁨出典: College Board AP コースおよび試験説明書⁩

    English

    Rational decision-makers weigh benefits against costs. An action is worthwhile only when its benefit is at least as large as its cost – including the opportunity cost. Money already spent and unrecoverable is a sunk cost 沉没成本 and should be ignored in decisions: only future costs and benefits matter.

    日本語

    Rational decision-makers weigh benefits against costs. An action is worthwhile only when its benefit is at least as large as its cost – including the opportunity cost. Money already spent and unrecoverable is a sunk cost 沉没成本 and should be ignored in decisions: only future costs and benefits matter.

    Explore · ⁨探索⁩

    Weigh total benefit against total cost · ⁨総便益と総コストを比較する⁩

    A choice is worth it only while the benefit of one more unit beats its cost. Where total revenue meets total cost is the break-even point; past it, extra activity adds more cost than value. · ⁨追加単位の便益がそのコストを上回る限り、その選択是有効である。総収益と総コストが一致するのが損益分岐点であり、そこを超えると追加活動は価値よりもコストを多く生むこととなる。⁩

    Vocabulary · ⁨語彙⁩ Train · ⁨練習する⁩
    English 日本語
    sunk cost/sʌŋk kɒst/ 沉没原価
    1.6

    Marginal Analysis and Consumer Choice

    Syllabus · ⁨シラバス⁩
    Enduring UnderstandingLearning ObjectiveEssential Knowledge

    CBA-2
    To determine the optimal level at which to pursue an activity whose total benefits exceed total cost, rational economic agents compare marginal benefits and marginal costs.

    CBA-2.A
    a. Define the key assumptions of consumer choice theory.
    b. Explain (using a table or graph as appropriate) how a rational consumer's decision making involves the use of marginal benefits and marginal costs.
    c. Calculate (using a table or a graph when appropriate) how a rational consumer's decision making involves the use of marginal benefits and marginal costs.

    • CBA-2.A.1 Consumers face constraints and have to make optimal decisions accounting for these constraints.
    • CBA-2.A.2 In a model of rational consumer choice, consumers are assumed to make choices so as to maximize their total utility.
    • CBA-2.A.3 Consumers experience diminishing marginal utility in the consumption of goods and services.
    • CBA-2.A.4 Consumers allocate their limited income to purchase the combination of goods that maximizes their utility by equating/comparing the marginal utility of the last dollar spent on each good.
      • Exclusion statement: Indifference curves are beyond the scope of the course and the AP Exam, but equating the ratios of marginal utility to price is within the scope.

    CBA-2.B
    a. Define marginal analysis and related terms.
    b. Explain a decision using marginal analysis (using a table or a graph when appropriate).

    • CBA-2.B.1 Marginal analysis involves comparing the additional benefit of increasing a given activity with the additional cost. Comparing marginal benefit (MB) with marginal cost (MC) helps individuals (firms) decide whether to increase, decrease, or maintain their consumption (production) levels.
    • CBA-2.B.2 The optimal quantity at any point in time does not depend on fixed costs (sunk costs) or fixed benefits that have already been determined by past choices.
    • CBA-2.B.3 The optimal quantity is achieved when marginal benefit is equal to marginal cost or where total benefit is maximized.

    Source: College Board AP Course and Exam Description · ⁨出典: College Board AP コースおよび試験説明書⁩

    English

    Most real decisions are not "all or nothing" but "a little more or a little less." Marginal analysis 边际分析 compares the marginal benefit 边际收益 (the benefit of one more unit) with the marginal cost 边际成本 (the cost of one more unit).

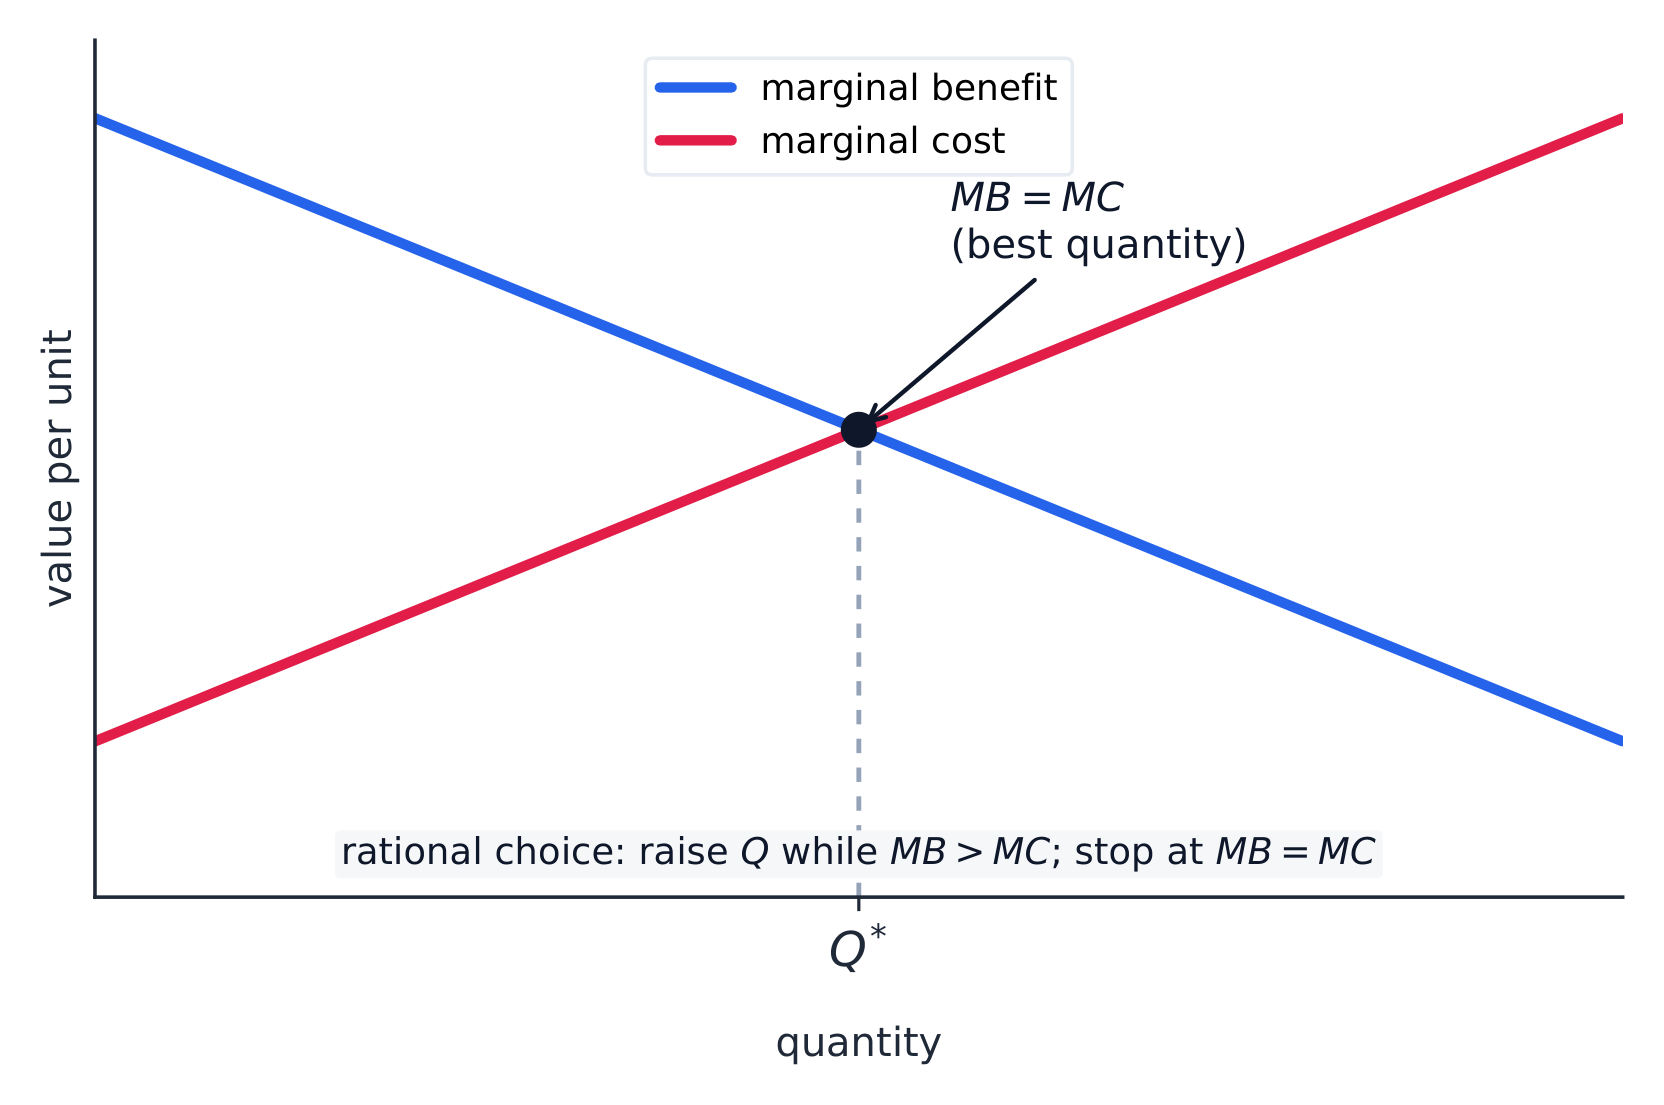
    • Decision rule: keep doing the activity while marginal benefit $>$ marginal cost; stop where MB $=$ MC. That point maximizes net benefit (total benefit minus total cost).
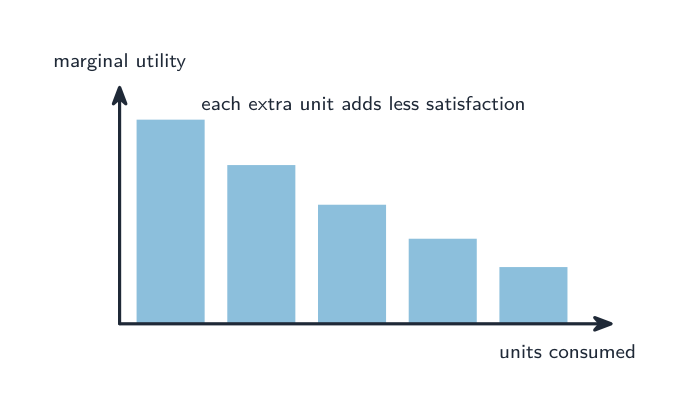
    • Consumers get utility 效用 (satisfaction) from goods, but each extra unit usually gives less added satisfaction – the law of diminishing marginal utility 边际效用递减法则.
    • A consumer maximizes total utility by the utility-maximizing rule: spend so that the marginal utility per dollar is equal across all goods, $\dfrac{MU_x}{P_x}=\dfrac{MU_y}{P_y}$, using up the whole budget. If one good gives more utility per dollar, buy more of it until the ratios equalize.

    Worked example. A consumer is choosing between good X ($MU_x=20$, $P_x=\$2$) and good Y ($MU_y=15$, $P_y=\$1$). The utility per dollar is $\tfrac{20}{2}=10$ for X but $\tfrac{15}{1}=15$ for Y. Y delivers more satisfaction per dollar, so the consumer should buy more Y and less X; as they do, $MU_y$ falls and $MU_x$ rises until $\tfrac{MU_x}{2}=\tfrac{MU_y}{1}$ and the budget is spent.

    Exam skill: the "MB = MC" logic and the "equal MU-per-dollar" rule are tested repeatedly – be able to find the optimal quantity from a table and explain why it is optimal.

    日本語

    Most real decisions are not "all or nothing" but "a little more or a little less." Marginal analysis 边际分析 compares the marginal benefit 边际收益 (the benefit of one more unit) with the marginal cost 边际成本 (the cost of one more unit).

    Each extra unit consumed gives less extra satisfaction (diminishing marginal utility)
    Each extra unit consumed gives less extra satisfaction (diminishing marginal utility)
    • Decision rule: keep doing the activity while marginal benefit $>$ marginal cost; stop where MB $=$ MC. That point maximizes net benefit (total benefit minus total cost).
    • Consumers get utility 效用 (satisfaction) from goods, but each extra unit usually gives less added satisfaction – the law of diminishing marginal utility 边际效用递减法则.
    • A consumer maximizes total utility by the utility-maximizing rule: spend so that the marginal utility per dollar is equal across all goods, $\dfrac{MU_x}{P_x}=\dfrac{MU_y}{P_y}$, using up the whole budget. If one good gives more utility per dollar, buy more of it until the ratios equalize.

    Worked example. A consumer is choosing between good X ($MU_x=20$, $P_x=\$2$) and good Y ($MU_y=15$, $P_y=\$1$). The utility per dollar is $\tfrac{20}{2}=10$ for X but $\tfrac{15}{1}=15$ for Y. Y delivers more satisfaction per dollar, so the consumer should buy more Y and less X; as they do, $MU_y$ falls and $MU_x$ rises until $\tfrac{MU_x}{2}=\tfrac{MU_y}{1}$ and the budget is spent.

    Exam skill: the "MB = MC" logic and the "equal MU-per-dollar" rule are tested repeatedly – be able to find the optimal quantity from a table and explain why it is optimal.

    Rational choice: keep going while marginal benefit exceeds marginal cost, stopping where they are equal
    Rational choice: keep going while marginal benefit exceeds marginal cost, stopping where they are equal
    Vocabulary · ⁨語彙⁩ Train · ⁨練習する⁩
    English 日本語
    Marginal analysis/ˈmɑːdʒɪnl əˈnæləsɪs/ 限界分析
    marginal benefit/ˈmɑːdʒɪnl ˈbenɪfɪt/ 限界便益
    marginal cost/ˈmɑːdʒɪnl kɒst/ 限界成本
    utility/juːˈtɪlɪti/ ユーティリティ
    law of diminishing marginal utility/lɔː ɒv dɪˈmɪnɪʃɪŋ ˈmɑːdʒɪnl juːˈtɪlɪti/ 限界効用逓減の法則
    1.6

    Exam tips

    • Opportunity cost is the next-best alternative given up; ignore sunk costs in any decision.
    • Comparative advantage (lower opportunity cost) determines specialisation and the gains from trade.
    • Apply marginal analysis: keep doing an activity while MB > MC, stopping where MB = MC.
    • Maximise utility by equalising the marginal utility per dollar across goods.
    • Read opportunity cost off the PPC slope; a bowed curve shows increasing cost.
  • 2

    Supply and Demand · ⁨需給⁩

    Watch lesson · ⁨レッスンを視聴⁩
    2.1

    Demand · ⁨需要⁩

    Syllabus · ⁨シラバス⁩
    English

    Enduring Understanding (MKT-3): Individuals and firms respond to incentives and face constraints.

    Learning Objective MKT-3.A: a. Define (using graphs as appropriate) key terms and factors related to consumer decision making and the law of demand. b. Explain (using graphs as appropriate) the relationship between price and quantity demanded and how buyers respond to incentives and constraints.

    • MKT-3.A.1 A well-defined system of property rights is necessary for the market system to function well.
    • MKT-3.A.2 Economic agents respond to incentives.
    • MKT-3.A.3 Individuals often respond to incentives, such as those presented by prices, but also face constraints, such as income, time, and legal and regulatory frameworks.
    • MKT-3.A.4 The law of demand suggests that a change in the own-price causes a change in quantity demanded in the opposite direction and a movement along a demand (marginal benefit) curve.
    • MKT-3.A.5 The conceptual relationship between price and quantity stated by the law of demand leads to downward-sloping demand curves explained by the income effect and substitution effect and/or by diminishing marginal utility.
    • MKT-3.A.6 The market demand curve (schedule) is derived from the summation of individual demand curves (schedules).

    Learning Objective MKT-3.B: Explain (using graphs as appropriate) buyers' responses to changes in incentives and constraints.

    • MKT-3.B.1 Changes in the determinants of consumer demand can cause the demand curve to shift.
    日本語

    永続的な理解(MKT-3): 個人および企業はインセンティブに反応し、制約に直面する。

    学習目標 MKT-3.A: a. 消费者の意思決定と需要の法則に関連する主要な用語および要因を定義する(必要に応じてグラフを使用)。 b. 価格と需求量の関係、および買い手がインセンティブや制約にどのように反応するかを説明する(必要に応じてグラフを使用)。

    • MKT-3.A.1 市場システムが良好に機能するためには、明確に定義された財産権の体系が必要である。
    • MKT-3.A.2 経済主体はインセンティブに反応する。
    • MKT-3.A.3 個人は価格などのインセンティブに反応することが多いが、所得、時間、法的・規制枠組みなどの制約にも直面する。
    • MKT-3.A.4 需要の法則は、自己価格の変化が需求量の変化を引き起こし、その方向は逆であり、需要曲線(限界便益曲線)上での移動をもたらすことを示唆している。
    • MKT-3.A.5 需要の法則によって述べられた価格と需求量との概念的关系は、所得効果および代替効果、または限界効用逓減の原理によって説明される右下がりの需要曲線につながる。
    • MKT-3.A.6 市場需要曲線(表)は、個々の需要曲線(表)の総和として導かれる。

    学習目標 MKT-3.B: 買い手がインセンティブや制約の変化にどのように反応するかを説明する(必要に応じてグラフを使用)。

    • MKT-3.B.1 消費者需要の決定要因の変化は、需要曲線のシフトを引き起こすことができる。

    Source: College Board AP Course and Exam Description · ⁨出典: College Board AP コースおよび試験説明書⁩

    English
    Supply & demand: a shift raises P and Q

    A market works only where property rights 产权 are well defined – owners can use, exclude others from, and trade their resources; without them, prices cannot coordinate exchange. Within that framework, the two forces are demand and supply.

    Demand 需求 is the relationship between the price of a good and the quantity buyers are willing and able to buy. The law of demand 需求定律 says price and quantity demanded move in opposite directions, so the demand curve slopes downward. Two reasons: the substitution effect 替代效应 (when a good gets pricier, buyers switch to alternatives) and the income effect 收入效应 (a higher price shrinks real purchasing power).

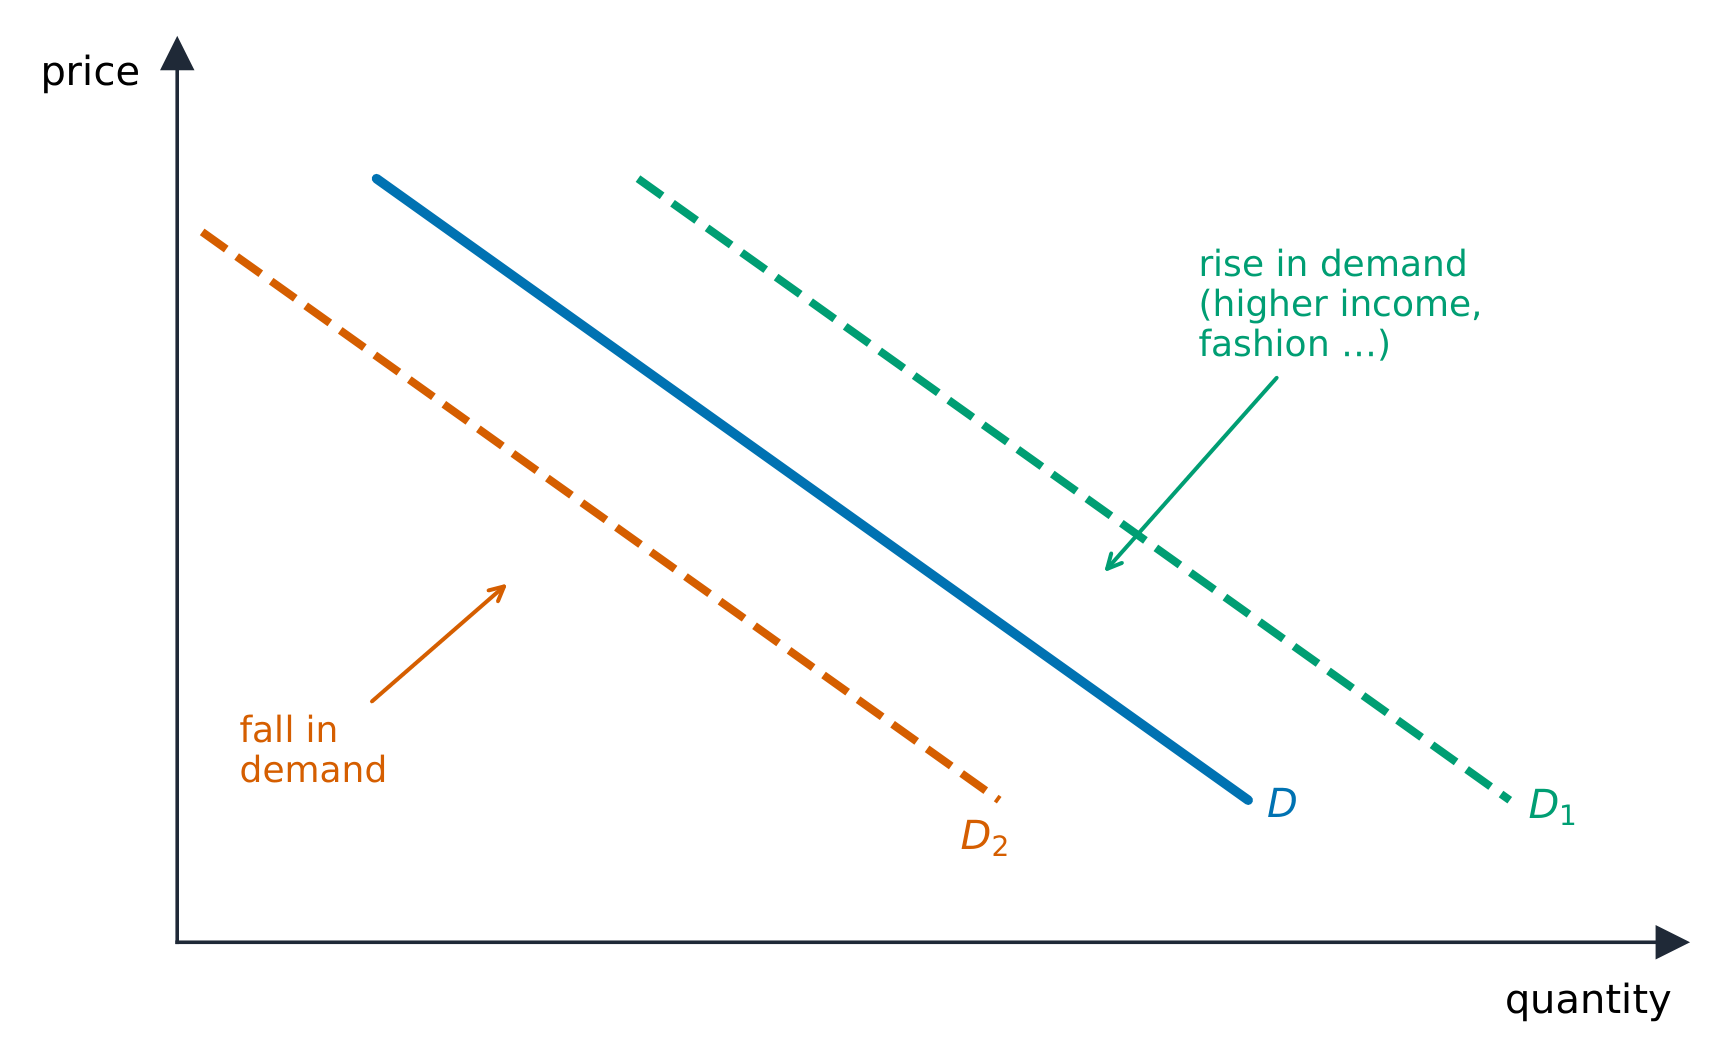
    Distinguish a change in quantity demanded (a move along the curve, caused only by the good's own price) from a change in demand (a shift of the whole curve). Demand shifts with the determinants 决定因素, remembered as TRIBE:

    • Tastes/preferences,
    • Related goods – a rise in the price of a substitute 替代品 raises demand; a rise in the price of a complement 互补品 lowers it,
    • Income – for a normal good 正常商品 more income raises demand; for an inferior good 低档商品 it lowers it,
    • Buyers (number of consumers),
    • Expectations of future price or income.

    The market demand curve is the horizontal summation 水平相加 of every individual buyer's demand curve – at each price, add up the quantities all buyers want. That is why more buyers (the B above) shifts the whole market curve to the right.

    日本語
    市場での買い物客:需要は、価格に対する需要量の反応を示す
    市場の消費者:需要とは価格に対する需求量の反応度を示す
    需給:シフトがPとQを上昇させる

    市場が機能するのは 所有権 が明確に定義されている場所のみである所有者は資源を使用し、他者を排除し、取引できる。所有権がない場合、価格は交換を調整できない。その枠組みの中で2つの力は需要と供給である。

    需要 は財の価格と買い手が買おうとして購入可能な数量との関係である。需要の法則 は価格と需求量が 逆方向 に動くことを示すため、需要曲線は 下向き になる。2つの理由がある:代替効果(財が高くなると買い手は代替品へ移行する)と 所得効果(高値は実質的な購買力を縮小させる)。

    需要曲線は右下がりに傾き、所得、嗜好、関連価格がそれをシフトさせる
    需要曲線は右下がりであり、所得、嗜好、関連価格がこれをシフトさせる

    需求量の変化(曲線 上 の移動で、財の 自己価格 によって引き起こされるもの)と 需要の変化(曲線全体が ずれる こと)を区別する。需要は ** determinants(決定要因)** でシフトし、TRIBE と覚える:

    • Tastes/preferences(嗜好・好み)、
    • Related goods(関連財): substitute(代替財) の価格上昇は需要を増やし、 complement(補完財) の価格上昇は需要を減らす。
    • Income(所得): normal good(正常財) では所得増は需要を増やす; inferior good(劣等財) では減少させる。
    • Buyers(買い手の数)、
    • Expectations of future price or income(将来の価格や所得への見通し)。

    市場需要曲線 は個々の買い手の需要曲線の 水平総和 である。各価格において、すべての買い手が求める数量を加算する。そのため、買い手が増えると(上記の B )市場全体の曲線が右へシフトする。

    Explore · ⁨探索⁩

    Shift demand and watch price and quantity · ⁨需要を変化させ、価格と量を観察する⁩

    The demand curve slopes down: lower price, more wanted. A change in income, tastes or related-good prices shifts the whole curve, moving the equilibrium. · ⁨需要曲線は右下がりである:価格が下がれば需要量が増える。所得、嗜好、関連財の価格の変化は曲線全体をシフトさせ、均衡点を変更する。⁩

    Vocabulary · ⁨語彙⁩ Train · ⁨練習する⁩
    English 日本語
    property rights/ˈprɒpəti raɪts/ 財産権
    Demand/dɪˈmænd/ 需要
    law of demand/lɔː ɒv dɪˈmænd/ 需要の法則
    substitution effect/ˌsʌbstɪˈtjuːʃn ɪˈfekt/ 代替効果
    income effect/ˈɪŋkʌm ɪˈfekt/ 所得効果によるため
    determinants/dɪˈtɜːmɪnənts/ 決定要因
    substitute/ˈsʌbstɪtjuːt/ 置換
    complement/ˈkɒmplɪmənt/ 補完
    normal good/ˈnɔːml ɡʊd/ 正常財への需要を増やす
    inferior good/ɪnˈfɪərɪə ɡʊd/ 劣等財への需要を増やす
    horizontal summation/ˌhɒrɪˈzɒntl sʌˈmeɪʃn/ 水平方向の合算
    Supply/səˈplaɪ/ 供給
    law of supply/lɔː ɒv səˈplaɪ/ 供給の法則
    subsidies/ˈsʌbsɪdiz/ 補助金
    Price elasticity of demand/praɪs ɪlæˈstɪsɪti ɒv dɪˈmænd/ 需要の価格弾性
    2.2

    Supply · ⁨供給⁩

    Syllabus · ⁨シラバス⁩
    English

    Enduring Understanding (MKT-3): Individuals and firms respond to incentives and face constraints.

    Learning Objective MKT-3.C: a. Define (using graphs as appropriate) the law of supply. b. Explain (using graphs as appropriate) the relationship between price and quantity supplied.

    • MKT-3.C.1 A change in own-price causes a change in quantity supplied in the same direction and a movement along a supply curve.
    • MKT-3.C.2 The market supply curve (schedule) is derived from the summation of individual supply curves (schedules). The market supply curve is upward-sloping.

    Learning Objective MKT-3.D: Explain (using graphs as appropriate) producers' (sellers') responses to changes in incentives and technology.

    • MKT-3.D.1 Changes in the determinants of supply can cause the supply curve to shift.
    日本語

    永続的な理解(MKT-3): 個人および企業はインセンティブに反応し、制約に直面する。

    学習目標 MKT-3.C: a. 供給の法則を定義する(グラフを使用する場合)。 b. 価格と供給量の関係を説明する(必要に応じてグラフを使用)。

    • MKT-3.C.1 自己価格の変化は、同じ方向への供給量の変化および供給曲線上での移動を引き起こす。
    • MKT-3.C.2 市場供給曲線(表)は、個々の供給曲線(表)の総和として導かれる。市場供給曲線は右上がりである。

    学習目標 MKT-3.D: 生産者(売り手)がインセンティブや技術の変化にどのように反応するかを説明する(必要に応じてグラフを使用)。

    • MKT-3.D.1 供給の決定要因の変化は、供給曲線のシフトを引き起こすことができる。

    Source: College Board AP Course and Exam Description · ⁨出典: College Board AP コースおよび試験説明書⁩

    English
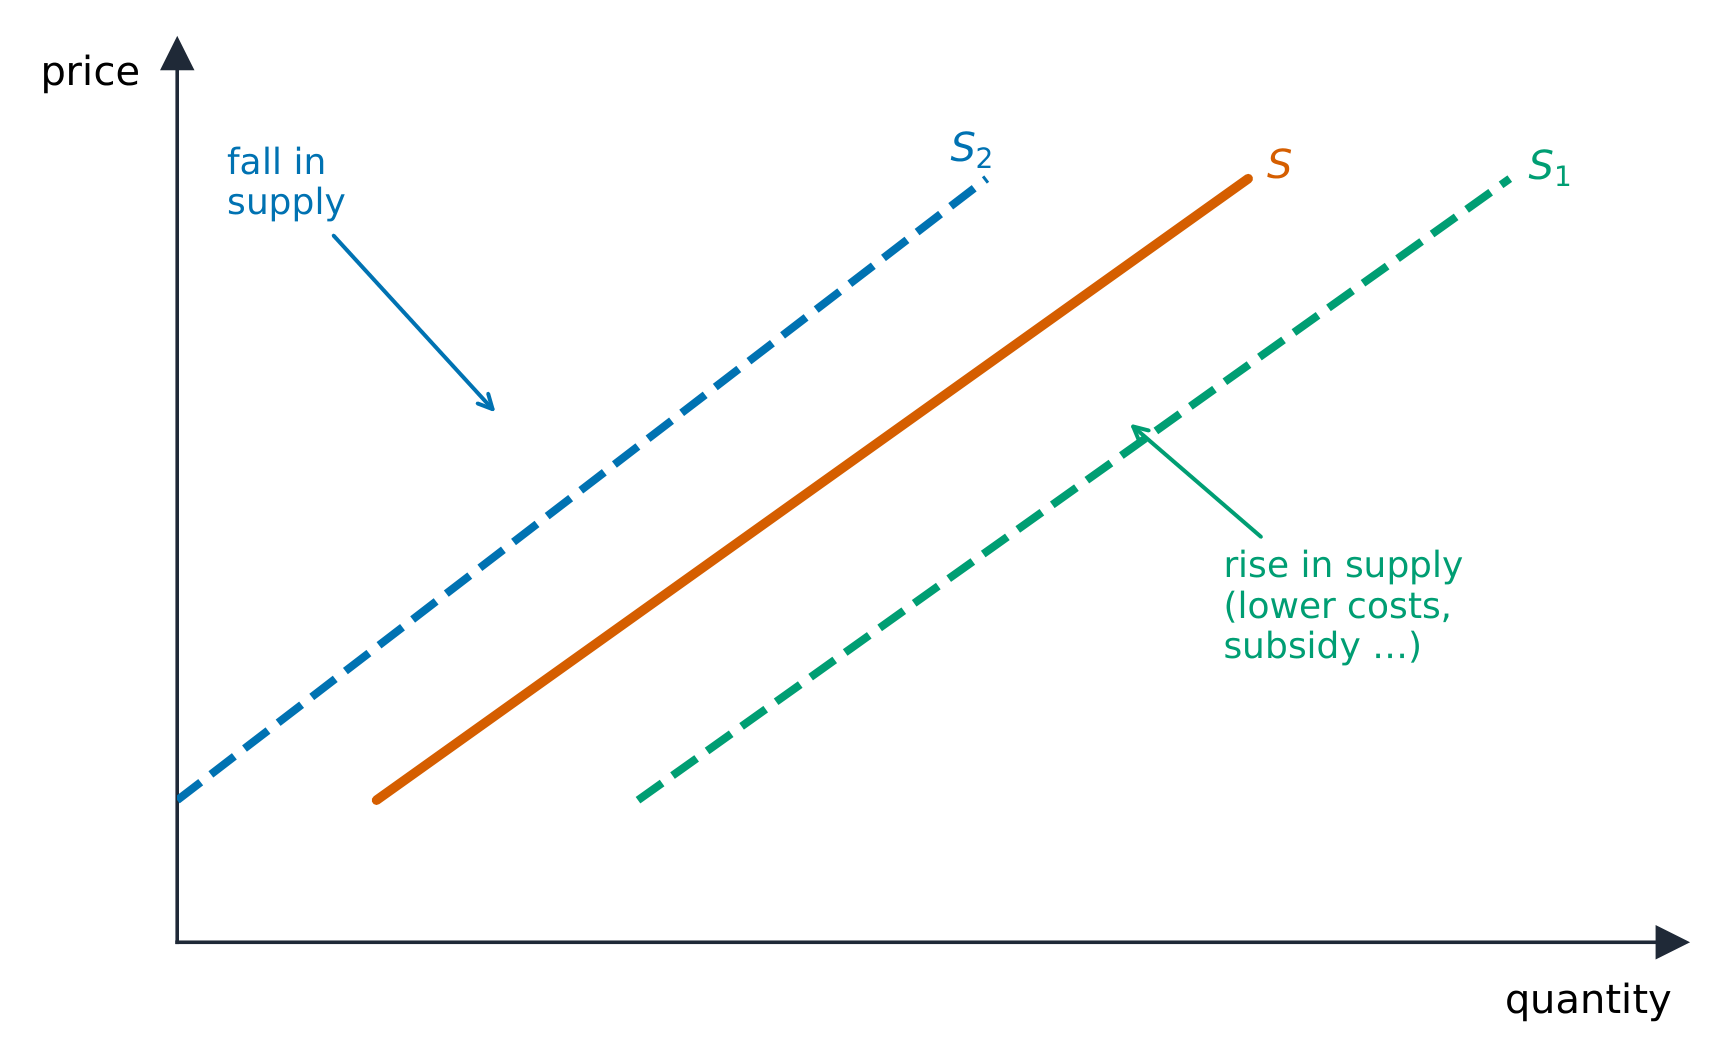
    A shift in supply

    Supply 供给 is the relationship between price and the quantity sellers will offer. The law of supply 供给定律: price and quantity supplied move in the same direction, so the supply curve slopes upward (higher prices cover higher marginal costs and reward more output).

    Again separate a change in quantity supplied (movement along the curve, from the good's own price) from a change in supply (a shift). Supply shifts with input prices, technology, taxes and subsidies 补贴, prices of other goods a firm could make, number of sellers, and expectations. Just like demand, the market supply curve is the horizontal sum of individual firms' supply curves – add the quantities all firms offer at each price – so more sellers shifts market supply to the right.

    Exam skill: on the free-response section you must draw correctly labeled supply-and-demand graphs and shift the right curve in the right direction – decide first whether the event changes an "own price" (move along) or a determinant (shift).

    日本語
    供給の変化

    供給 は価格と売り手が提供しようとする数量との関係である。供給の法則 :価格と供給量は 同じ方向 に動くため、供給曲線は 上向き である(高い価格は高い限界費用をカバーし、より多くの生産に対して報酬を与える)。

    供給曲線は右上がりに傾き、コスト、技術、税金、補助金がそれをシフトさせる
    供給曲線は右上がりであり、コスト、技術、税、補助金がこれをシフトさせる

    再び 供給量の変化 (曲線沿いの移動、財の自己価格によるもの)と 供給の変化 (シフト)を分ける。供給は 投入財の価格 、 技術 、税金と 補助金 、企業が製造可能な 他の財の価格 、 売り手の数 、そして 見通し でシフトする。需要と同じく、 市場供給曲線 は各企業の供給曲線の水平総和であり、各価格での全企業の供給量を合計するため、売り手が増えると市場供給曲線は右へシフトする。

    試験技能: フリー回答部分では、正しくラベル付けされた需給グラフを描き、正しい 曲線を 正しい 方向へシフトさせなければならない。まず、その出来事が「自己価格」の変化(曲線沿い)なのか、それとも「決定要因」の変化(シフト)なのかを判断せよ。

    2.3

    Price Elasticity of Demand · ⁨需要の価格弾性⁩

    Syllabus · ⁨シラバス⁩
    English

    Enduring Understanding (MKT-3): Individuals and firms respond to incentives and face constraints.

    Learning Objective MKT-3.E: a. Define measures of elasticity. b. Explain (using graphs where appropriate) measures of elasticity and the impact of a given price change on total revenue or total expenditure. c. Calculate (using data from a graph or a table as appropriate) measures of elasticity.

    • MKT-3.E.1 Economists use the concept of elasticity to measure the magnitude of percentage changes in quantity owing to any given changes in the own-price, income, and prices of related goods.
    • MKT-3.E.2 Price elasticity of demand is measured by the percentage change in quantity demanded divided by the percentage change in price or the responsiveness of the quantity demanded to changes in price. Elasticity varies along a linear demand curve, meaning slope is not elasticity.
    • MKT-3.E.3 Ranges of values of elasticity of demand are described as elastic or inelastic with the separating benchmark being a magnitude of 1, where the change in the price and the change in the quantity demanded are proportional.
      • a. When the magnitude of the value of elasticity is greater than 1, the demand is described as being elastic with respect to that price in the range of the given change.
      • b. When the magnitude of the value of elasticity is less than 1, the demand is described as being inelastic with respect to that price in the range of the given change.
      • c. When the magnitude of the value of elasticity is equal to 1, the demand is described as being unit elastic with respect to that price in the range of the given change.
    • MKT-3.E.4 The price elasticity of demand depends on certain factors such as the availability of substitutes.
    • MKT-3.E.5 The impact of a given price change on total revenue or total expenditure will depend on whether demand is elastic, inelastic, or unit elastic.
    日本語

    永続的な理解(MKT-3): 個人および企業はインセンティブに反応し、制約に直面する。

    学習目標 MKT-3.E: a. 弾力性の指標を定義する。 b. 弾力性の指標と、特定の価格変化が総収入または総支出に与える影響を説明する(適切な場合にグラフを使用して)。 c. 弾力性の指標を計算する(グラフまたは表のデータを使用して、適切な場合)。

    • MKT-3.E.1 経済学者は、弾力性の概念を用いて、自己価格、所得、関連商品の価格などのある特定の変化による需求量の百分率変化の大きさを測定する。
    • MKT-3.E.2 需要の価格弾力性は、需求量の百分率変化を価格の百分率変化で割った値、または価格の変化に対する需求量の応答度によって測定される。弾力性は直線的な需要曲線上で異なるため、傾きとは弾力性を意味しない。
    • MKT-3.E.3 需要の弾力性の値の範囲は、弾力的か非弾力的かに分類され、その境界となる基準値は1であり、このとき価格の変化と需求量の変化は比例する。
      • a. 弾力性の値の絶対値が1より大きい場合、その価格について、指定された変化の範囲では需要は弾力的であるとされる。
      • b. 弾力性の値の絶対値が1より小さい場合、その価格について、指定された変化の範囲では需要は非弾力的であるとされる。
      • c. 弾力性の値の絶対値が1に等しい場合、その価格について、指定された変化の範囲では需要は単一弾力的であるとされる。
    • MKT-3.E.4 需要の価格弾力性は、代替財の可用性などの特定の要因に依存する。
    • MKT-3.E.5 特定の価格変化が総収入または総支出に与える影響は、需要が弾力的か非弾力的か、あるいは単一弾力的かによって異なる。

    Source: College Board AP Course and Exam Description · ⁨出典: College Board AP コースおよび試験説明書⁩

    English
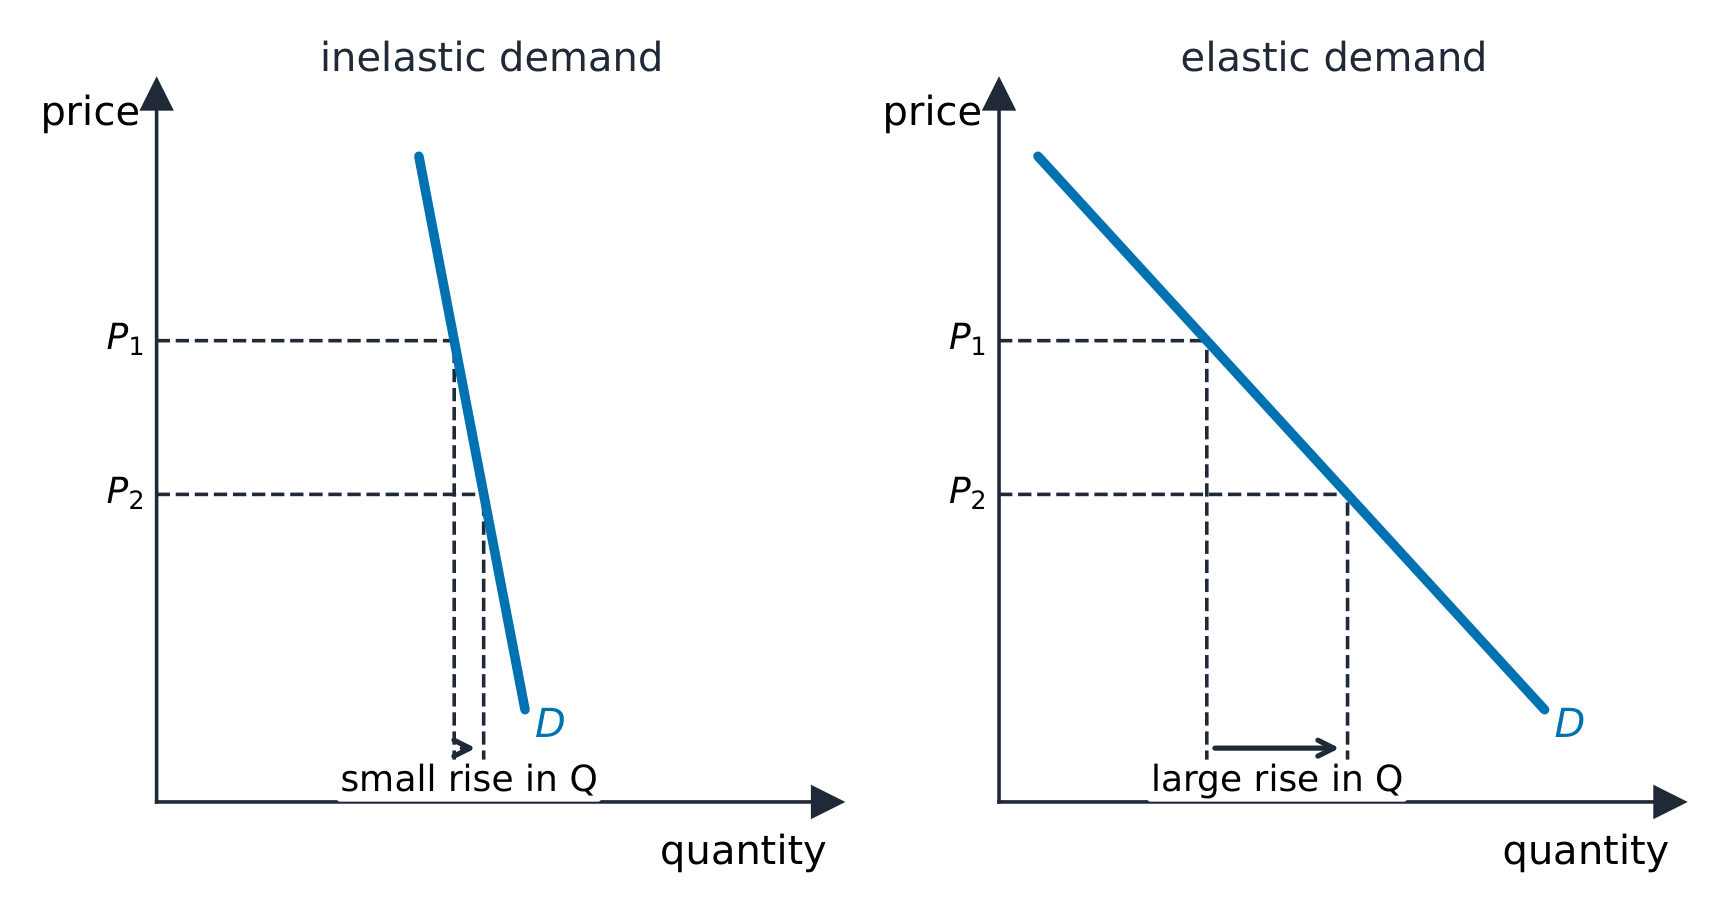
    Price elasticity of demand

    Price elasticity of demand 需求价格弹性 measures how responsive quantity demanded is to a price change:

    $$E_d=\left|\frac{\%\ \Delta\ \text{quantity demanded}}{\%\ \Delta\ \text{price}}\right|.$$

    • $E_d>1$: elastic 富有弹性 (quantity responds strongly);
    • $E_d<1$: inelastic 缺乏弹性 (quantity barely responds);
    • $E_d=1$: unit elastic.

    Demand is more elastic when there are more substitutes, the good is a luxury, it takes a large share of income, or buyers have more time to adjust. Elasticity links to total revenue 总收入 ($P\times Q$): if demand is elastic, a price cut raises revenue; if inelastic, a price cut lowers it. Along a straight-line demand curve, elasticity falls as you move down (elastic on top, inelastic at the bottom).

    Worked example. A price rise from $\$10$ to $\$12$ (a $+20\%$ change) cuts quantity demanded from $100$ to $85$ (a $-15\%$ change). Then $E_d=\left|\dfrac{-15\%}{20\%}\right|=0.75<1$, so demand is inelastic. Because it is inelastic, the price rise raises total revenue: from $\$10\times100=\$1000$ to $\$12\times85=\$1020$.

    日本語
    需要の価格弾性

    需要の価格弾性 は、価格変化に対する需求量の反応度を測る:

    $$E_d=\left|\frac{\%\ \Delta\ \text{quantity demanded}}{\%\ \Delta\ \text{price}}\right|.$$

    非弾力的 vs 弾力的な需要:価格変化に対する小さな反応と大きな反応
    非弾力的 vs 弾力的な需要:価格変化に対する小さな反応と大きな反応
    • $E_d>1$: 弾力大(elastic)(数量が強く反応する)。
    • $E_d<1$: 非弾力(inelastic)(数量がほとんど反応しない)。
    • $E_d=1$: 単一弾力(unit elastic) 。

    代替財が多くある場合、財が 高級財 である場合、所得に占める割合が大きい場合、または買い手が調整に より多くの時間 がある場合に需要はより弾力大となる。弾性は 総収益 ($P\times Q$)と関連する:需要が弾力大であれば、値下げは収益を 上げる ;非弾力であれば、値下げは収益を 下げる 。直線的な需要曲線では、下に移動するにつれて弾性は低下する(上部は弾力大、下部は非弾力)。

    演習例。 価格が $\$10$ to $\$12$ ($+20\%$ の変化)から上昇し、需要量が $100$ から $85$ ($-15\%$ の変化)へ減少しました。すると $E_d=\left|\dfrac{-15\%}{20\%}\right|=0.75<1$ となるため、需要は非弾力的です。非弾力的であるため、価格の上昇は総収益を引き上げます:$\$10\times100=\$1000$ から $\$12\times85=\$1020$ へ。

    Explore · ⁨探索⁩

    Stretch price and measure elasticity · ⁨価格を変化させて弾性度を測定する⁩

    Price elasticity of demand is how strongly quantity responds to price. A steep curve is inelastic (small response); a shallow one is elastic (large response). · ⁨需給価格弾性とは、価格変化に対する需要量の反応の度合いである。急な曲線は非弾力的(反応が小さい)、緩やかな曲線は弾力的(反応が大きい)。⁩

    Vocabulary · ⁨語彙⁩ Train · ⁨練習する⁩
    English 日本語
    elastic/ɪˈlæstɪk/ 弾性
    inelastic/ɪnɪˈlæstɪk/ 非弾力的
    total revenue/ˈtəʊtl ˈrevənjuː/ 総収益
    Price elasticity of supply/praɪs ɪlæˈstɪsɪti ɒv səˈplaɪ/ 供給の価格弾性
    Cross-price elasticity/krɒs praɪs ɪlæˈstɪsɪti/ 代替財価格弾力性
    Income elasticity/ˈɪŋkʌm ɪlæˈstɪsɪti/ 所得弾力性
    2.4

    Price Elasticity of Supply · ⁨供給の価格弾性⁩

    Syllabus · ⁨シラバス⁩
    English

    Enduring Understanding (MKT-3): Individuals and firms respond to incentives and face constraints.

    Learning Objective MKT-3.E: a. Define measures of elasticity. b. Explain (using graphs where appropriate) measures of elasticity and the impact of a given price change on total revenue or total expenditure. c. Calculate (using data from a graph or a table as appropriate) measures of elasticity.

    • MKT-3.E.6 Price elasticity of supply is measured by the percentage change in quantity supplied divided by the percentage change in price, or the responsiveness of the quantity supplied to changes in price.
    • MKT-3.E.7 Ranges of values of elasticity of supply are described as elastic or inelastic with the separating benchmark being a magnitude of 1, where the change in the price and the change in the quantity supplied are proportional.
      • a. When the magnitude of the value of elasticity is greater than 1, the supply is described as being elastic with respect to that price in the range of the given change.
      • b. When the magnitude of the value of elasticity is less than 1, the supply is described as being inelastic with respect to that price in the range of the given change.
      • c. When the magnitude of the value of elasticity is equal to 1, the supply is described as being unit elastic with respect to that price in the range of the given change.
    • MKT-3.E.8 The price elasticity of supply depends on certain factors such as the price of alternative inputs.
    日本語

    永続的な理解(MKT-3): 個人および企業はインセンティブに反応し、制約に直面する。

    学習目標 MKT-3.E: a. 弾力性の指標を定義する。 b. 弾力性の指標と、特定の価格変化が総収入または総支出に与える影響を説明する(適切な場合にグラフを使用して)。 c. 弾力性の指標を計算する(グラフまたは表のデータを使用して、適切な場合)。

    • MKT-3.E.6 供給の価格弾力性は、供給量の百分率変化を価格の百分率変化で割った値、または価格の変化に対する供給量の応答度によって測定される。
    • MKT-3.E.7 供給の弾力性の値の範囲は、弾力的か非弾力的かに分類され、その境界となる基準値は1であり、このとき価格の変化と供給量の変化は比例する。
      • a. 弾力性の値の絶対値が1より大きい場合、その価格について、指定された変化の範囲では供給は弾力的であるとされる。
      • b. 弾力性の値の絶対値が1より小さい場合、その価格について、指定された変化の範囲では供給は非弾力的であるとされる。
      • c. 弾力性の値の絶対値が1に等しい場合、その価格について、指定された変化の範囲では供給は単一弾力的であるとされる。
    • MKT-3.E.8 供給の価格弾力性は、代替投入財の価格などの特定の要因に依存する。

    Source: College Board AP Course and Exam Description · ⁨出典: College Board AP コースおよび試験説明書⁩

    English

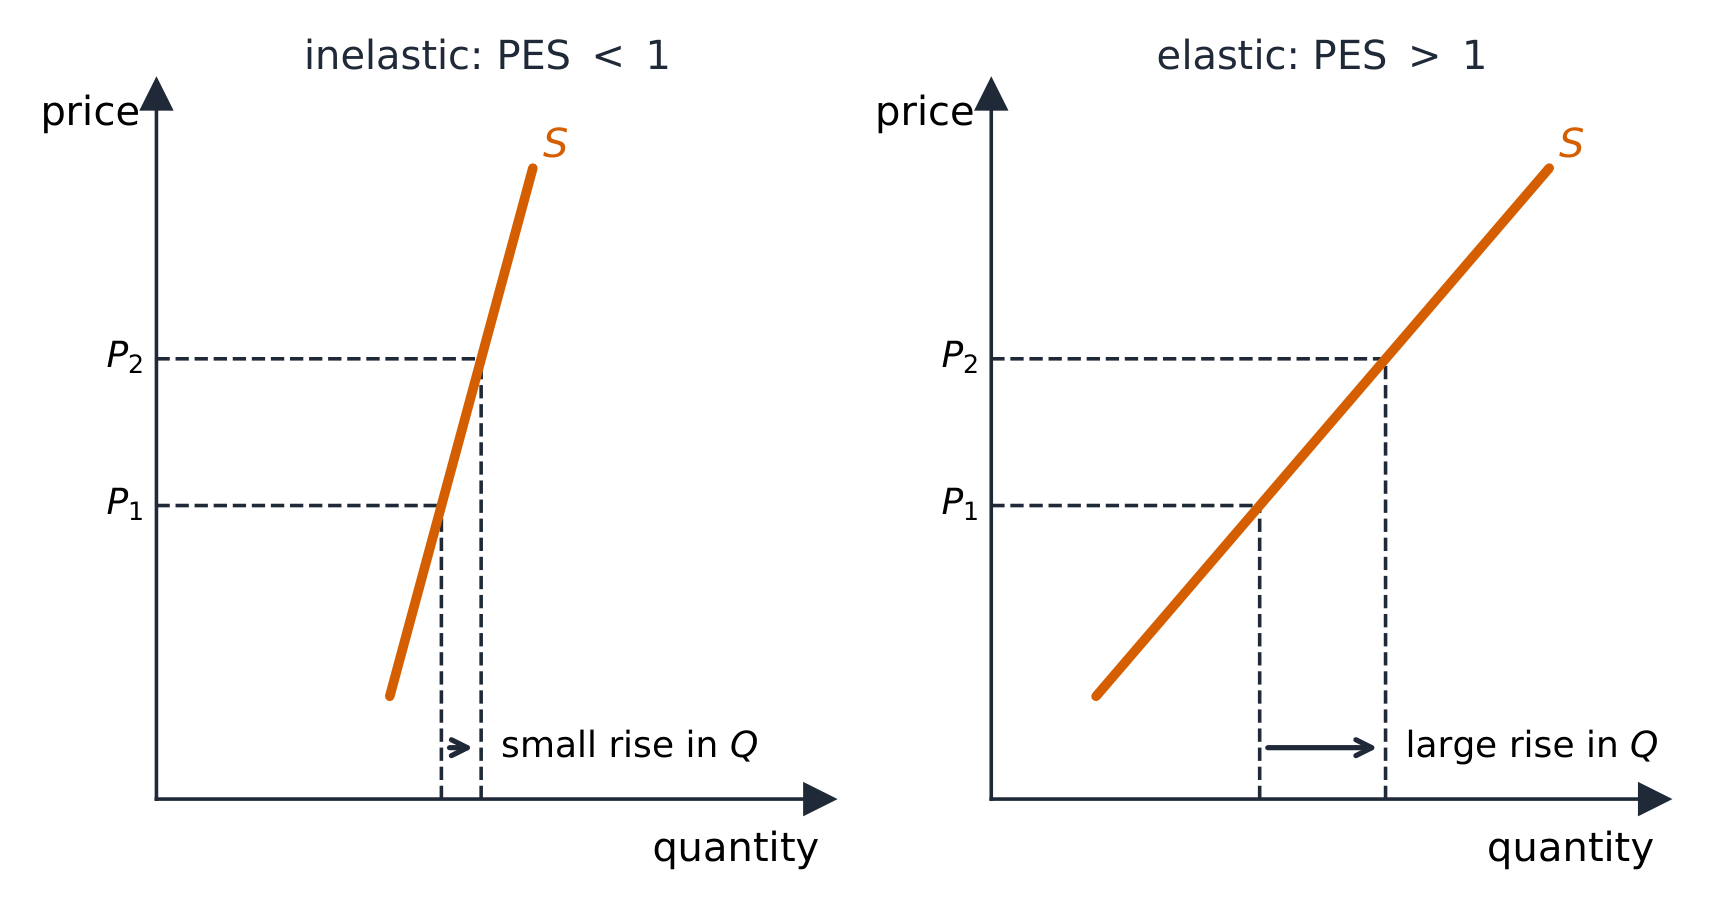
    Price elasticity of supply 供给价格弹性, $E_s=\dfrac{\%\ \Delta\ Q_s}{\%\ \Delta\ P}$, measures how responsive sellers are. Supply is more elastic when firms can adjust output easily – spare capacity, storable goods, and above all more time (supply is more elastic in the long run than the short run).

    日本語

    供給の価格弾性 、$E_s=\dfrac{\%\ \Delta\ Q_s}{\%\ \Delta\ P}$、は売り手の反応度を測る。企業が生産量調整が容易な場合、供給はより弾力大となる:余剰生産能力、保管可能な商品、そして何より より多くの時間 (長期的には短期的よりも供給は弾力大である)。

    同じ価格上昇でも、PES が 1 未満の場合は供給への反応は小さく、1 を超える場合は大きい
    PESが1未満の場合は同じ価格上昇でも供給反応は小さく、1超えなら大きい
    2.5

    Other Elasticities · ⁨その他の弾性⁩

    Syllabus · ⁨シラバス⁩
    English

    Enduring Understanding (MKT-3): Individuals and firms respond to incentives and face constraints.

    Learning Objective MKT-3.E: a. Define measures of elasticity. b. Explain (using graphs where appropriate) measures of elasticity and the impact of a given price change on total revenue or total expenditure. c. Calculate (using data from a graph or a table as appropriate) measures of elasticity.

    • MKT-3.E.9 Elasticity can be measured for any determinant of demand or supply, not just the price.
    • MKT-3.E.10 Income elasticity of demand is measured by the percentage change in the quantity demanded divided by the percentage change in consumers' income. Economists use the income elasticity of demand to determine whether a good is normal or inferior.
    • MKT-3.E.11 Cross-price elasticity of demand is measured by the percentage change in the quantity demanded of one good divided by the percentage change in the price of another good. Economists use the cross-price elasticity of demand to determine whether goods are substitutes, complements, or not related.
    日本語

    永続的な理解(MKT-3): 個人および企業はインセンティブに反応し、制約に直面する。

    学習目標 MKT-3.E: a. 弾力性の指標を定義する。 b. 弾力性の指標と、特定の価格変化が総収入または総支出に与える影響を説明する(適切な場合にグラフを使用して)。 c. 弾力性の指標を計算する(グラフまたは表のデータを使用して、適切な場合)。

    • MKT-3.E.9 弾力性は、価格だけでなく、需要または供給のあらゆる決定要因に対して測定できる。
    • MKT-3.E.10 需要の所得弾力性は、需求量の百分率変化を消費者の所得の百分率変化で割ることで測定される。経済学者は、需要の所得弾力性を用いて、ある財が正常財か劣等財かを判定する。
    • MKT-3.E.11 代替財・補完財の需要の相互価格弾力性は、ある財の需要量の百分率変化を、別の財の価格の百分率変化で割ることで測定される。経済学者は、財が代替財、補完財、あるいは無関係かを確認するために、需要の相互価格弾力性を使用する。

    Source: College Board AP Course and Exam Description · ⁨出典: College Board AP コースおよび試験説明書⁩

    English
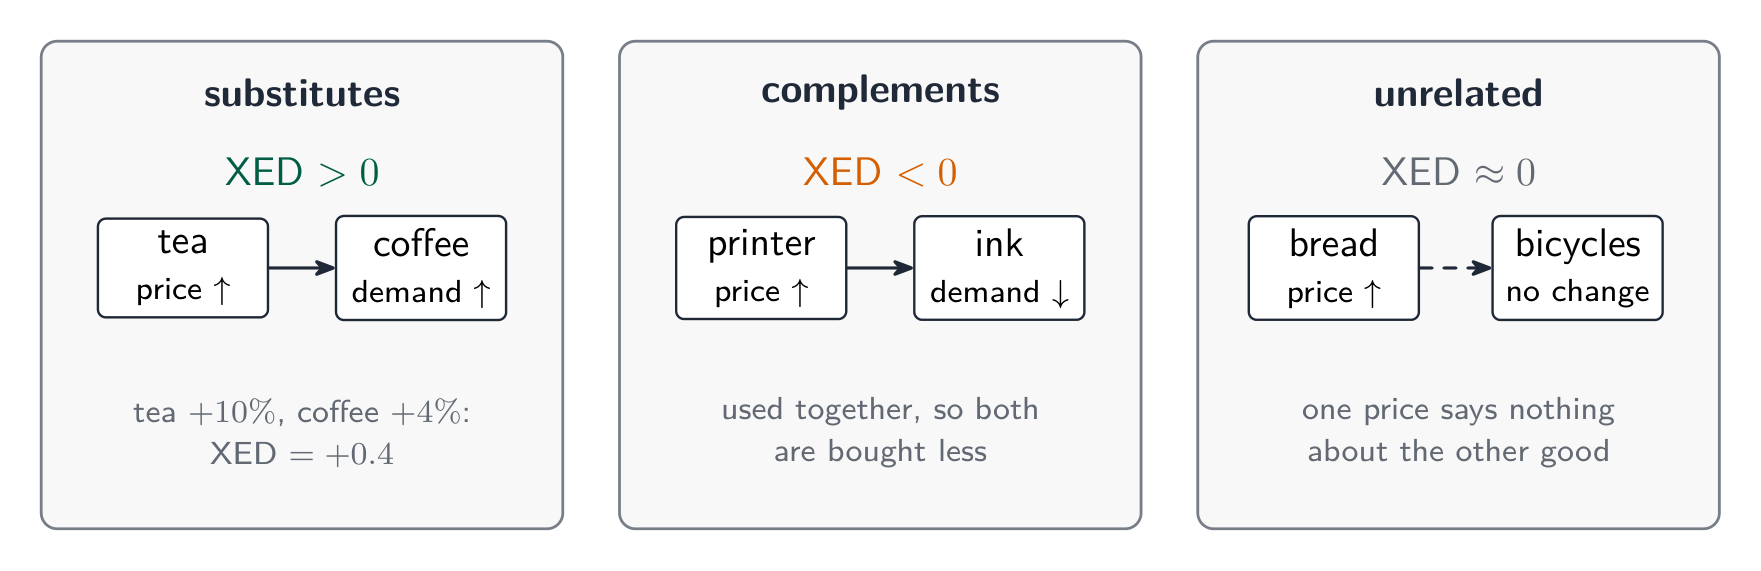
    • Cross-price elasticity 交叉价格弹性 $=\dfrac{\%\ \Delta\ Q_x}{\%\ \Delta\ P_y}$: positive for substitutes, negative for complements – the sign tells you the relationship.
    • Income elasticity 收入弹性 $=\dfrac{\%\ \Delta\ Q}{\%\ \Delta\ \text{income}}$: positive for normal goods (and $>1$ for luxuries), negative for inferior goods.

    Worked example. When the price of coffee rises $10\%$, the quantity of tea demanded rises $6\%$: cross-price elasticity $=\dfrac{+6\%}{+10\%}=+0.6$. The positive sign confirms coffee and tea are substitutes. If instead a $5\%$ rise in incomes raised restaurant-meal demand $10\%$, income elasticity $=\dfrac{10\%}{5\%}=+2$ – a normal good, and a luxury since it exceeds $1$.

    Exam skill: you are expected to compute an elasticity, classify it, and read a sign as evidence of substitute/complement or normal/inferior.

    日本語
    • 相互価格弾性 $=\dfrac{\%\ \Delta\ Q_x}{\%\ \Delta\ P_y}$: positive(正) は代替財、 negative(負) は補完財 – 符号が関係性を示す。
    • 所得弾性 $=\dfrac{\%\ \Delta\ Q}{\%\ \Delta\ \text{income}}$: positive(正) は正常財(および luxuries(高級財) では $>1$ 以上)、 negative(負) は劣等財。

    ** worked example.** コーヒーの価格が $10\%$上昇すると、お茶の需要量は $6\%$増加する:代替財の交叉価格弾力性 $=\dfrac{+6\%}{+10\%}=+0.6$。 正の符号は、コーヒーとお茶が 代替財であることを裏付けている。逆に、所得が $5\%$上昇してレストランでの食事需要が $10\%$増加する場合、所得弾力性 $=\dfrac{10\%}{5\%}=+2$ は — 正常財であり、かつ $1$ を超えるため、高級財である。

    代替財では正、補完財では負の交叉弾力性
    代替財では正、補完財では負の交叉弾力性

    試験技能: 弾力性を計算し、分類し、符号を代替・補完財または正常・劣等財の証拠として読み取る能力が求められる。

    2.6

    Market Equilibrium, Consumer Surplus, and Producer Surplus · ⁨市場均衡、消費者余剰、生産者余剰⁩

    Syllabus · ⁨シラバス⁩
    English

    Enduring Understanding (MKT-4): Although equilibria are stable, an economy can move from one equilibrium to another if market conditions change.

    Learning Objective MKT-4.A: a. Define (using graphs as appropriate) market equilibrium, consumer surplus, and producer surplus. b. Explain (using graphs as appropriate) how equilibrium price, quantity, consumer surplus, and producer surplus for a good or service are determined. c. Calculate (using data from a graph or table as appropriate) areas of consumer surplus and producer surplus at equilibrium.

    • MKT-4.A.1 The supply-demand model is a tool for understanding what factors influence prices and quantities and why prices and quantities might differ across markets or change over time.
    • MKT-4.A.2 In a perfectly competitive market, equilibrium is achieved (and markets clear with no shortages or surpluses) when the price of a good or service brings the quantity supplied and quantity demanded into balance, in the sense that buyers wish to purchase the same quantity that sellers wish to provide.
    • MKT-4.A.3 Equilibrium price provides information to economic decision-makers to guide resource allocation.
    • MKT-4.A.4 Economists use consumer surplus and producer surplus to measure the benefits markets create to buyers and sellers and understand market efficiency.
    • MKT-4.A.5 Market equilibrium maximizes total economic surplus in the absence of market failures, meaning that perfectly competitive markets are efficient.
    日本語

    持続的理解(MKT-4): 均衡は安定しているものの、市場条件が変われば経済は一つの均衡から別の均衡へ移行することがある。

    学習目標 MKT-4.A: a. 市場均衡、消費者余剰、生産者余剰を定義せよ(必要に応じて図表を用いること)。 b. 財やサービスの均衡価格、均衡数量、消費者余剰、生産者余剰がどのように決定されるかを説明せよ(必要に応じて図表を用いること)。 c. 均衡における消費者余剰および生産者余剰の面積を計算せよ(必要に応じて図表または数値表のデータを用いること)。

    • MKT-4.A.1 需給モデルは、どのような要因が価格と数量に影響を与えるか、そしてなぜ価格と数量が市場間や時間の経過とともに異なるのかを理解するための道具である。
    • MKT-4.A.2 完全競争市場において、ある財やサービスの価格が供給量と需要量を整合させ、買い手が購入したい数量が売り手が提供したい数量と同じになる場合、均衡が達成され(不足も過剰もなく)、市場は清算される。
    • MKT-4.A.3 均衡価格は、経済意思決定者が資源配分を指導するための情報となる。
    • MKT-4.A.4 経済学者は、市場が生み出す買い手および売手の便益を測定し、市場の効率性を理解するために、消費者余剰および生産者余剰を使用する。
    • MKT-4.A.5 市場の失敗がない限り、市場均衡は総経済余剰を最大化するため、完全競争市場は効率的である。

    Source: College Board AP Course and Exam Description · ⁨出典: College Board AP コースおよび試験説明書⁩

    English
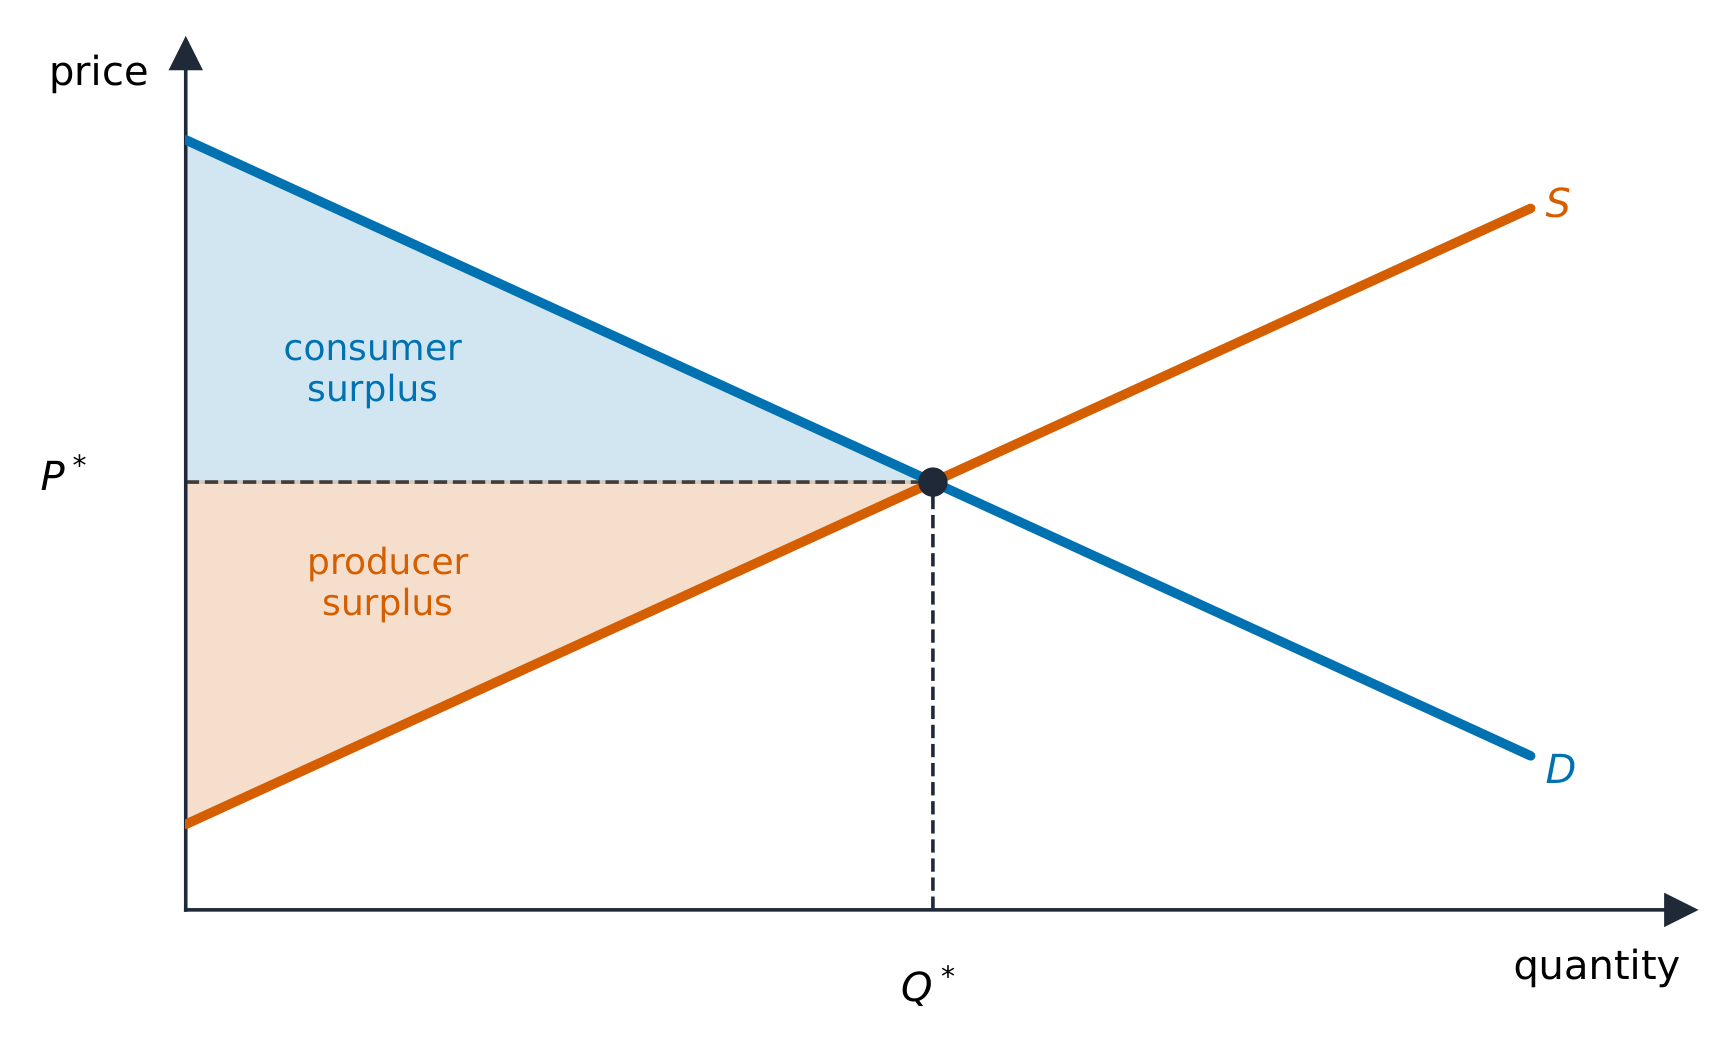
    Consumer & producer surplus

    Equilibrium 均衡 is where supply meets demand: the equilibrium price clears the market, so quantity demanded equals quantity supplied and there is no shortage or surplus.

    • Consumer surplus 消费者剩余 is the area below the demand curve and above the price – the gap between what buyers would pay and what they do pay.
    • Producer surplus 生产者剩余 is the area above the supply curve and below the price – the gap between the price and sellers' minimum acceptable price.
    • Their sum is total surplus 总剩余, and the competitive equilibrium maximizes it – this is why free markets are called allocatively efficient 配置有效率.
    日本語
    消費者余剰と生産者余剰

    均衡とは供給と需要が一致する点である:均衡価格は市場を適正化させるため、需要量と供給量が等しくなり、不足や過剰は生じない。

    市場均衡における消費者余剰と生産者余剰
    市場均衡における消費者余剰と生産者余剰
    • 消費者余剰は、需要曲線より下で価格より上にある領域 — 買い手が支払う意思のある金額と実際支払う金額の差額。
    • 生産者余剰は、供給曲線より上で価格より下にある領域 — 価格と売り手の最低許容価格との差額。
    • これらの合計は 総余剰 であり、競争的均衡はこれを 最大化 する — これが自由市場が 「配置効率性」 が高いと言われる理由である。
    果物と野菜を販売する市場の屋台
    実際の市場:多くの買い手と売り手が集まり、希望数量と提供数量が一致する価格で収束する
    Explore · ⁨探索⁩

    See consumer and producer surplus · ⁨消費者余剰と生産者余剰を見る⁩

    At equilibrium the market clears. The gap between what buyers would pay and the price is consumer surplus; the gap above sellers' costs is producer surplus. · ⁨均衡において市場は清算される。買い手が出資できる価格と実際の価格との差が消費者余剰であり、売り手のコストより高い部分が生産者余剰である。⁩

    Vocabulary · ⁨語彙⁩ Train · ⁨練習する⁩
    English 日本語
    Producer surplus/prəˈdjuːsə ˈsɜːpləs/ 生産者余剰
    total surplus/ˈtəʊtl ˈsɜːpləs/ 総余剰
    allocatively efficient/ˈæləkətɪvli ɪˈfɪʃənt/ 配置効率性が達成される。
    surplus/ˈsɜːpləs/ 余剰を生む
    shortage/ˈʃɔːtɪdʒ/ 不足を生む
    2.7

    Market Disequilibrium and Changes in Equilibrium · ⁨市場不均衡と均衡の変化⁩

    Syllabus · ⁨シラバス⁩
    English

    Enduring Understanding (MKT-4): Although equilibria are stable, an economy can move from one equilibrium to another if market conditions change.

    Learning Objective MKT-4.B: a. Define a surplus and shortage. b. Explain (using graphs where appropriate) how changes in underlying conditions and shocks to a competitive market can alter price, quantity, consumer surplus, and producer surplus. c. Calculate (using data from a graph or table as appropriate) changes in price, quantity, consumer surplus, and producer surplus in response to changes in market conditions or market disequilibrium.

    • MKT-4.B.1 Whenever markets experience imbalances—creating disequilibrium prices and quantities, surpluses, and shortages—market forces drive price and quantity toward equilibrium.
    • MKT-4.B.2 Factors that shift the market demand and market supply curves cause price, quantity, consumer surplus, producer surplus, and total economic surplus (within that market) to change. The impact of the change depends on the price elasticities of demand and supply.
    日本語

    持続的理解(MKT-4): 均衡は安定しているものの、市場条件が変われば経済は一つの均衡から別の均衡へ移行することがある。

    学習目標 MKT-4.B: a. 過剰と不足を定義する。 b. 基礎となる条件の変化や完全競争市場へのショックが、価格、数量、消費者余剰、生産者余剰にどのように影響するかを説明せよ(必要に応じて図表を用いること)。 c. 市場条件の変化や市場の不均衡に対する対応として、価格、数量、消費者余剰、生産者余剰の変化を計算せよ(必要に応じて図表または数値表のデータを用いること)。

    • MKT-4.B.1 市場に不均衡が発生し、不均衡な価格や数量、過剰、不足が生じた場合、市場の力が価格と数量を均衡に向かわせる。
    • MKT-4.B.2 市場需要曲線および市場供給曲線をシフトさせる要因により、価格、数量、消費者余剰、生産者余剰、およびその市場内の総経済余剰が変化する。この変化の影響は、需要および供給の価格弾力性に依存する。

    Source: College Board AP Course and Exam Description · ⁨出典: College Board AP コースおよび試験説明書⁩

    English

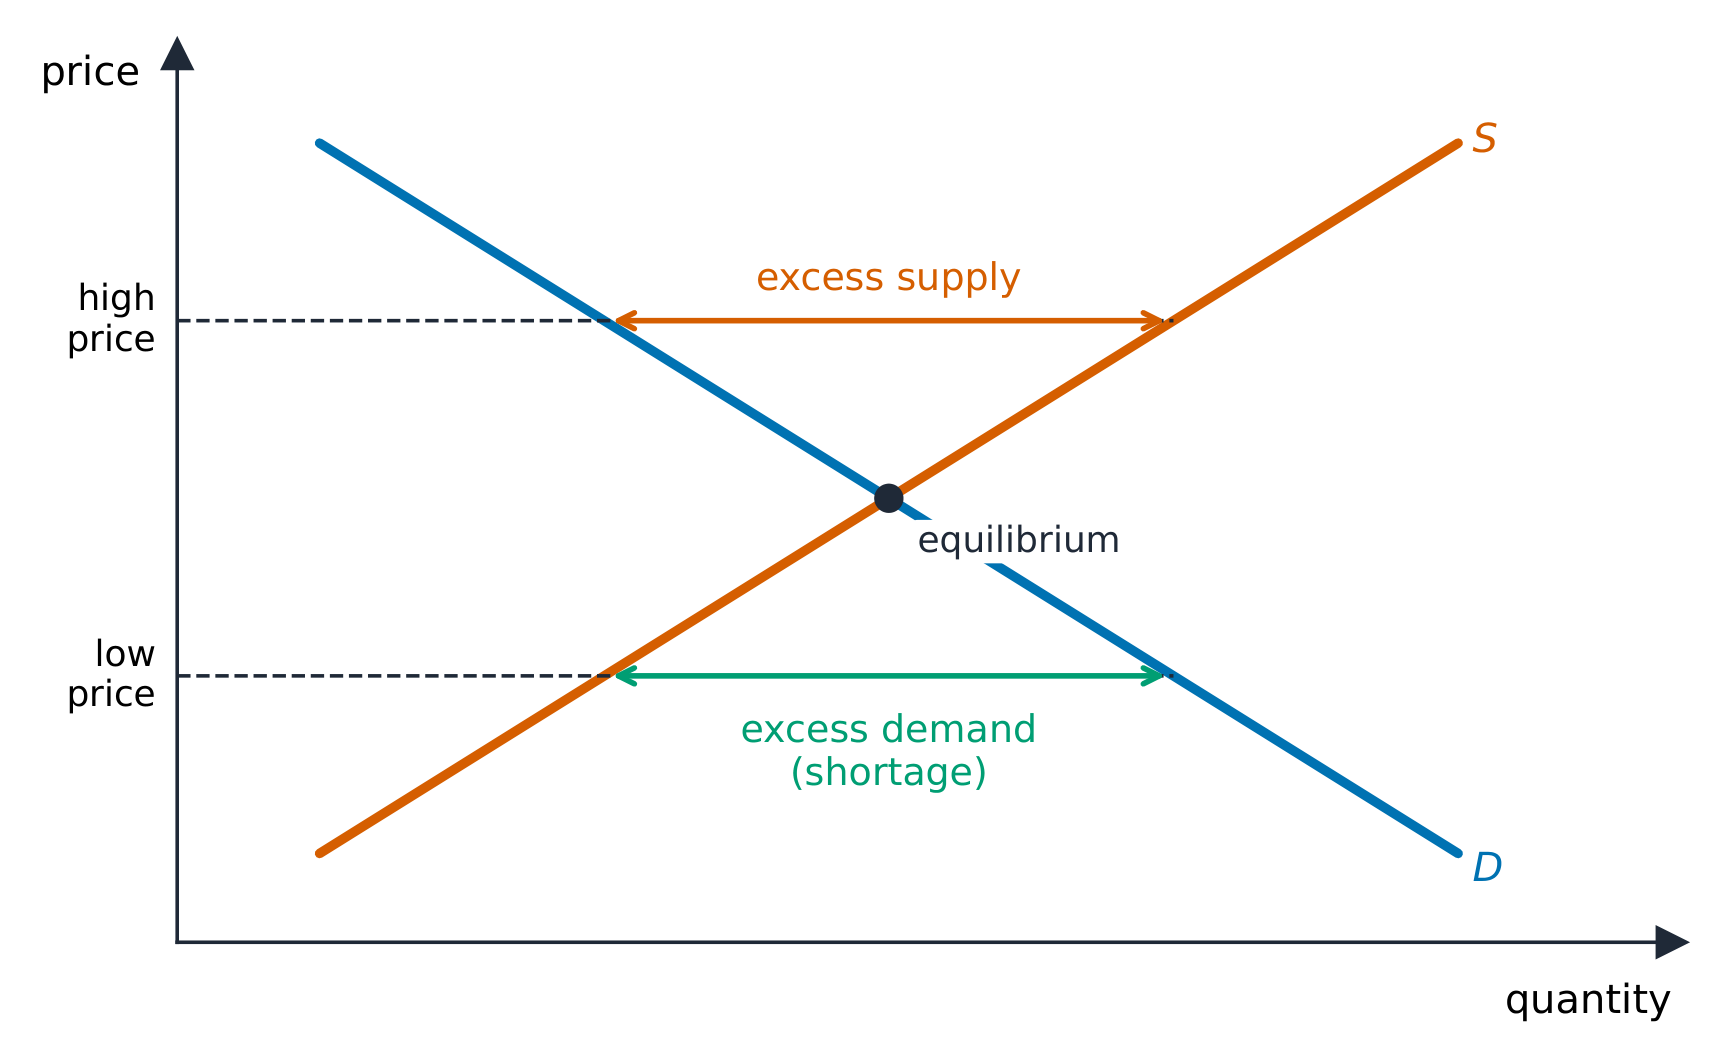
    Away from equilibrium the market self-corrects: above the equilibrium price there is a surplus 过剩 (excess supply) that pushes price down; below it a shortage 短缺 (excess demand) that pushes price up.

    When a determinant shifts a curve, the equilibrium moves predictably. A single shift gives a definite result for both price and quantity. When both curves shift, one of price or quantity is indeterminate (depends on the relative sizes of the shifts) – a favorite exam trap. Work these out by drawing the shifts.

    日本語

    均衡から外れた場合、市場は自己修正する:均衡価格より上では 過剰(供給超過) が生じ、価格を下押しする;下では 不足(需要超過) が生じ、価格を上押しする。

    均衡より上は供給超過、下は需要超過
    均衡より上は供給超過、下は需要超過

    決定要因が曲線をシフトさせると、均衡は予測可能に動く。単一のシフトでは価格と数量の両方に明確な結果が出る。両方の曲線がシフトする場合、価格か数量のいずれかが 不明瞭(シフトの相対的な大きさによる)— これはよく出る試験の罠である。これらの問題は図にシフトを描くことで解ける。

    Vocabulary · ⁨語彙⁩ Train · ⁨練習する⁩
    English 日本語
    Equilibrium/ˌiːkwɪˈlɪbrɪəm/ 平衡
    Consumer surplus/kənˈsuːmə ˈsɜːpləs/ 消費者余剰
    2.8

    The Effects of Government Intervention in Markets · ⁨市場への政府介入の効果⁩

    Syllabus · ⁨シラバス⁩
    English

    Enduring Understanding (POL-1): Government policies influence consumer and producer behavior and therefore affect market outcomes.

    Learning Objective POL-1.A: a. Define forms of government price and quantity intervention. b. Explain (using graphs where appropriate) how government policies alter consumer and producer behaviors that influence incentives and therefore affect outcomes. c. Calculate (using data from a graph or table where appropriate) changes in market outcomes resulting from government policies.

    • POL-1.A.1 Some government policies, such as price floors, price ceilings, and other forms of price and quantity regulation, affect incentives and outcomes in all market structures.
    • POL-1.A.2 Governments use taxes and subsidies to change incentives in ways that influence consumer and producer behavior, shifting the supply and demand curves accordingly.
    • POL-1.A.3 Taxes and subsidies affect government revenues or costs.
    • POL-1.A.4 Government intervention in a market producing the efficient quantity through taxes, subsidies, price controls, or quantity controls can only decrease allocative efficiency.
    • POL-1.A.5 Deadweight loss represents the losses to buyers and sellers as a result of government intervention in an efficient market.
    • POL-1.A.6 The incidence of taxes and subsidies imposed on goods traded in perfectly competitive markets depends on the elasticity of supply and demand.
    日本語

    持続的理解(POL-1): 政府政策は消費者および生産者の行動に影響を与え、したがって市場の結果に影響を及ぼす。

    学習目標 POL-1.A: a. 政府による価格および数量の介入の形態を定義せよ。 b. 政府政策がインセンティブに影響を与えて結果に変化をもたらすように、消費者および生産者の行動をどのように変更するかを説明せよ(必要に応じて図表を用いること)。 c. 政府政策によって生じる市場結果の変化を計算せよ(必要に応じて図表または数値表のデータを用いること)。

    • POL-1.A.1 最低価格、最高価格、その他の価格および数量の規制などの一部の政府政策は、すべての市場構造におけるインセンティブと結果に影響を与える。
    • POL-1.A.2 政府は、消費者および生産者の行動に影響を与え、それに応じて需給曲線をシフトさせるために、税制および補助金を使用してインセンティブを変化させる。
    • POL-1.A.3 税制および補助金は、政府の収入またはコストに影響を与える。
    • POL-1.A.4 税制、補助金、価格統制、または数量統制を通じて効率的な数量を生出する市場への政府介入は、必ず配分効率を低下させるのみである。
    • POL-1.A.5 死荷重は、効率的な市場における政府介入による、買い手および売手の損失を表す。
    • POL-1.A.6 完全競争市場で取引される財に課された税制および補助金の負担(実質負担)は、需要および供給の価格弾力性に依存する。

    Source: College Board AP Course and Exam Description · ⁨出典: College Board AP コースおよび試験説明書⁩

    English
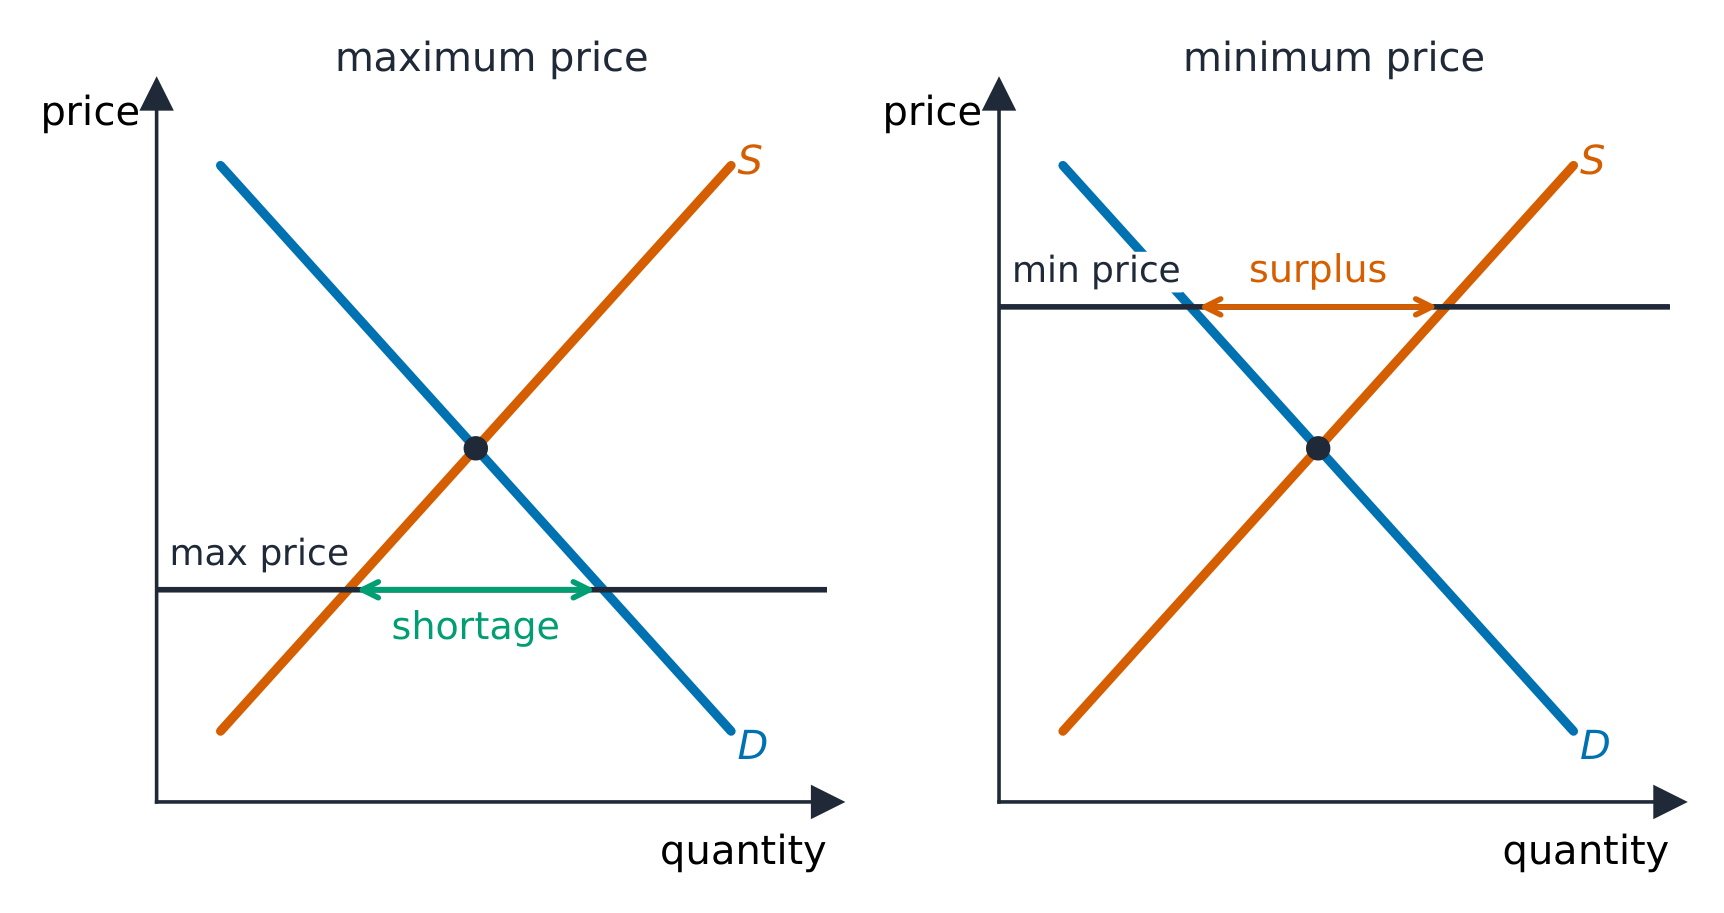
    A price ceiling causes a shortage
    A tax and the deadweight loss

    Governments intervene, usually reducing total surplus:

    • A price ceiling 价格上限 (a legal maximum, like rent control) below equilibrium causes a persistent shortage.
    • A price floor 价格下限 (a legal minimum, like a minimum wage) above equilibrium causes a persistent surplus.
    • An excise tax 消费税 shifts supply up by the tax; the burden (tax incidence 税收归宿) falls more heavily on whichever side is more inelastic.
    • A subsidy shifts supply down, raising quantity.

    Each of these creates deadweight loss 无谓损失 – mutually beneficial trades that no longer happen, shown as a triangle between the curves at the new quantity.

    Exam skill: on a graph, be able to shade consumer surplus, producer surplus, government revenue from a tax, and deadweight loss, and say who bears the tax and why.

    日本語
    価格上限が不足を生む
    税と無効損失

    政府は介入し、通常は総余剰を減少させる:

    アニメーション:価格上限が不足を生み、価格下限が過剰を生む
    価格上限が不足を生み、価格下限が過剰を生む
    • 価格上限(法律上の最高価格、家賃規制など)が均衡より低い場合、永続的な 不足 が生じる。
    • 価格下限(法律上の最低価格、最低賃金など)が均衡より高い場合、永続的な 過剰 が生じる。
    • 消費税は供給曲線を税額分上方へシフトさせ、負担(税負担の帰着)はより 非弾力的 な側により重くのしかかる。
    • 補助金は供給曲線を下方へシフトさせ、数量を増加させる。

    これらすべては 無効損失 を生む — 互いに有益な取引が行われなくなり、新しい数量における曲線間の三角形として示される。

    試験技能: グラフ上で消費者余剰、生産者余剰、税からの政府収入、および無効損失に陰影をつけ、誰が税を負担しているか、その理由を説明できること。

    Explore · ⁨探索⁩

    Add a tax or price control · ⁨税金または価格規制を追加する⁩

    A price ceiling below equilibrium causes shortages; a tax drives a wedge between what buyers pay and sellers get, shrinking the quantity traded. · ⁨価格上限が均衡より低いと不足が生じる。税金は買い手が支払う金額と売り手が受け取る金額の間にギャップを生じさせ、取引量を縮小させる。⁩

    Vocabulary · ⁨語彙⁩ Train · ⁨練習する⁩
    English 日本語
    price ceiling/praɪs ˈsiːlɪŋ/ 価格上限設定
    price floor/praɪs flɔː/ 価格下限
    excise tax/ekˈsaɪz tæks/ 消費税
    tax incidence/tæks ˈɪnsɪdəns/ 課税帰属
    deadweight loss/ˈdedweɪt lɒs/ 死荷重を生ずる
    world price/wɜːld praɪs/ 世界価格
    imports/ɪmˈpɔːts/ 輸入
    exports/ˈekspɔːts/ 輸出
    2.9

    International Trade and Public Policy · ⁨国際貿易と公的政策⁩

    Syllabus · ⁨シラバス⁩
    English

    Enduring Understanding (POL-1): Government policies influence consumer and producer behavior and therefore affect market outcomes.

    Learning Objective POL-1.B: a. Define tariffs and quotas. b. Explain (using graphs where appropriate) how markets are affected by public policy related to international trade. c. Calculate (using data from a graph or table as appropriate) changes in market outcomes resulting from public policy related to international trade.

    • POL-1.B.1 Equilibria in competitive markets may be altered by the decision to open an economy to trade with other countries; equilibrium price can be higher or lower than under autarky, and the gap between domestic supply and demand is filled by trade. Opening an economy to trade with other countries affects consumer surplus, producer surplus, and total economic surplus.
    • POL-1.B.2 Tariffs, which governments sometimes use to influence international trade, affect domestic price, quantity, government revenue, and consumer surplus and total economic surplus.
    • POL-1.B.3 Quotas can be used to alter quantities produced and therefore affect price, consumer surplus, and total economic surplus.
      • Exclusion statement: The graphing of quotas is beyond the scope of the course and the AP Exam, but understanding how quotas affect quantities produced is within the scope.
    日本語

    持続的理解(POL-1): 政府政策は消費者および生産者の行動に影響を与え、したがって市場の結果に影響を及ぼす。

    学習目標 POL-1.B: a. 関税および輸出入制限を定義せよ。 b. 国際貿易に関する公共政策が市場にどのように影響するかを説明せよ(必要に応じて図表を用いること)。 c. 国際貿易に関する公共政策によって生じる市場結果の変化を計算せよ(必要に応じて図表または数値表のデータを用いること)。

    • POL-1.B.1 完全競争市場の均衡は、他の国との貿易のために経済を開くという意思決定によって変動する可能性がある;均衡価格は自閉下よりも高くなる也可能低くなる可能性があり、国内の供給と需要のギャップは貿易によって埋められる。他の国との貿易のために経済を開くことは、消費者余剰、生産者余剰、および総経済余剰に影響を与える。
    • POL-1.B.2 政府がsometimes国际贸易に影響を与えるために使用する関税は、国内の価格、数量、政府の収入、消費者余剰、および総経済余剰に影響を与える。
    • POL-1.B.3 輸出入制限は生産数量を変更するために使用でき、したがって価格、消費者余剰、および総経済余剰に影響を与える。
      • 除外声明: 輸出入制限の図示は課程およびAP試験の範囲外であるが、輸出入制限が生産数量に与える影響を理解することは範囲内である。

    Source: College Board AP Course and Exam Description · ⁨出典: College Board AP コースおよび試験説明書⁩

    English

    When a country opens to trade at a world price 世界价格:

    • If the world price is below the domestic price, the country imports 进口 – consumers gain more than producers lose, so total surplus rises.
    • If the world price is above the domestic price, the country exports 出口 – producers gain more than consumers lose.

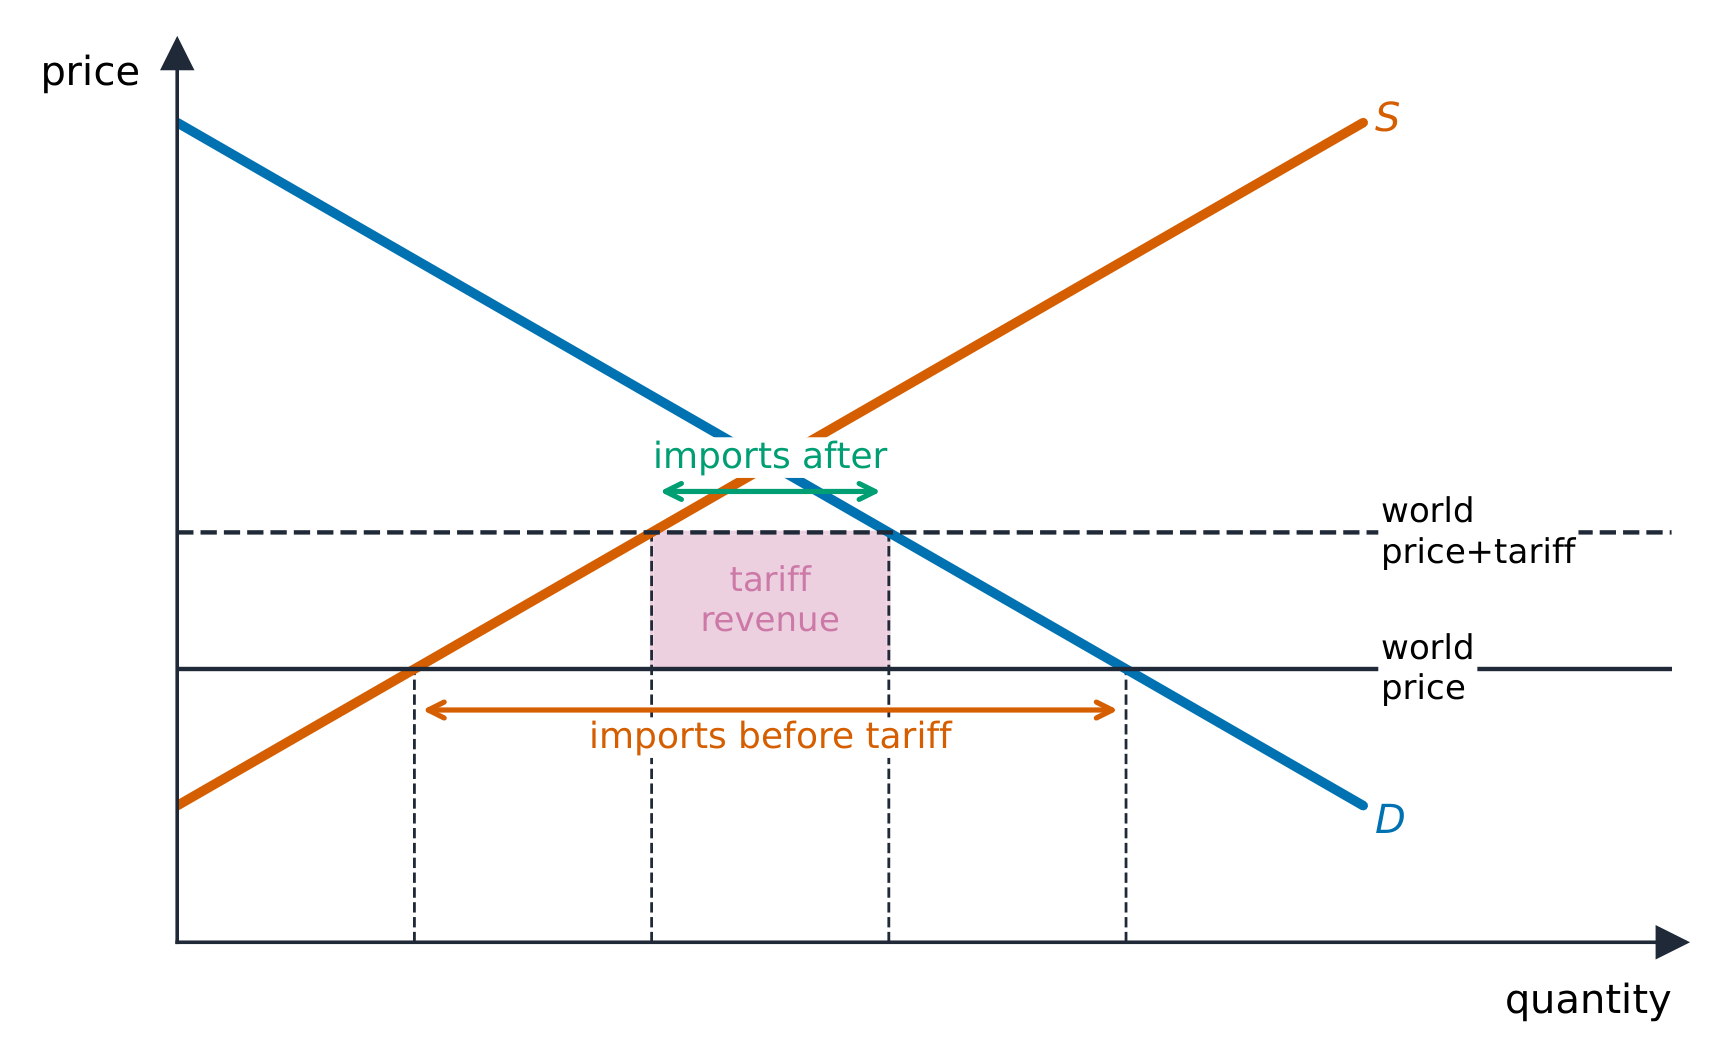
    A tariff 关税 (a tax on imports) or a quota 配额 (a limit on imports) raises the domestic price, helps domestic producers, hurts consumers more, and creates deadweight loss. Free trade maximizes total surplus, which is the core efficiency argument for it.

    日本語

    一国が 世界価格 で貿易を開放した場合:

    関税は国内供給を増やし、需要を減らし、輸入を縮小させる
    関税は国内供給を増やし、需要を減らし、輸入を縮小させる
    • 世界価格が国内価格より 低い 場合、国は 輸入 する — 消費者の受益が生産者の損失を上回り、総余剰が増加する。
    • 世界価格が国内価格より 高い 場合、国は 輸出 する — 生産者の受益が消費者の損失を上回る。

    関税(輸入に対する税)や 輸入割当(輸入制限)は国内価格を引き上げ、国内生産者を助け、消費者に更大的な被害を与え、無効損失を生む。自由貿易は総余剰を最大化するため、これがその核心的な効率性の根拠である。

    Vocabulary · ⁨語彙⁩ Train · ⁨練習する⁩
    English 日本語
    tariff/ˈtærɪf/ 関税
    quota/ˈkwəʊtə/ 勘定科目
    2.9

    Exam tips · ⁨試験対策⁩

    English
    • Separate a movement along a curve (own price) from a shift (a determinant); a single shift gives a definite result, a double shift leaves one variable indeterminate.
    • Compute elasticity $E_d=|\%\Delta Q \div \%\Delta P|$; elastic ($>1$) means a price cut raises total revenue, inelastic ($<1$) lowers it.
    • Read the sign of cross-price elasticity (substitutes $+$, complements $-$) and income elasticity (normal $+$, inferior $-$).
    • Shade consumer/producer surplus and the deadweight loss from a tax or price control; incidence falls on the more inelastic side.
    • A price ceiling below equilibrium causes a shortage; a price floor above causes a surplus.
    日本語
    • 曲線上の 移動(自身の価格)と シフト(決定要因)を区別すること;単一のシフトは明確な結果をもたらすが、二つのシフトでは変数の一つが不明瞭となる。
    • 弾力性を $E_d=|\%\Delta Q \div \%\Delta P|$ 計算する;弾力的($>1$)であれば価格引き下げは総収益を増やし、非弾力的($<1$)であれば減少させる。
    • 代替財・補完財の交叉価格弾性(代替財 $+$、補完財 $-$)および所得弾性(正常財 $+$、劣等財 $-$)の符号を読む。
    • 税や価格管理による 消費者/生産者余剰 と 無効損失 に陰影をつけ、帰着はより 非弾力的 な側に落ちることを理解する。
    • 均衡より下の価格上限は不足を生み、均衡より上の価格下限は過剰を生む。
  • 3

    Production, Cost, and the Perfect Competition Model · ⁨生産、コスト、および完全競争モデル⁩

    Watch lesson · ⁨レッスンを視聴⁩
    3.1

    The Production Function · ⁨生産関数⁩

    Syllabus · ⁨シラバス⁩
    English

    Enduring Understanding (PRD-1): Firms' production and cost constraints over different input and output levels shape optimal decisions in the short run and long run.

    Learning Objective PRD-1.A: a. Define (using graphs where appropriate) key terms and concepts relating to production and cost. b. Explain (using graphs where appropriate) how production and cost are related in the short run and long run. c. Calculate (using data from a graph or table as appropriate) the various measures of productivity and short-run and long-run costs.

    • PRD-1.A.1 The production function explains the relationship between inputs and outputs both in the short run and the long run.
    • PRD-1.A.2 Marginal product and average product change as input usage changes, and hence, total product changes.
    • PRD-1.A.3 Diminishing marginal returns occur as the firm employs more of one input, holding other inputs constant, to produce a product (output) in the short run.
    日本語

    持続的理解(PRD-1): 企業の生産とコスト制約は、投入量および産出量の変化に応じて短期間および長期間における最適意思決定を形成する。

    学習目標 PRD-1.A: a. 生産およびコストに関連する主要な用語や概念を定義せよ(必要に応じグラフを用いること)。 b. 生産とコストが短期間および長期間においてどのように関連しているかを説明せよ(必要に応じグラフを用いること)。 c. 生産性のさまざまな指標や、短期間および長期間のコストを計算せよ(必要に応じグラフまたは表のデータを用いること)。

    • PRD-1.A.1 生産関数は、短期間および長期間における投入量と産出量の関係を説明する。
    • PRD-1.A.2 投入量の変更に伴い、限界生産量および平均生産量は変化し、したがって総生産量も変化する。
    • PRD-1.A.3 短期間において、他の投入量を一定に保ったままある一つの投入量を増加させて製品(産出物)を生産する場合、限界逓減の法則が発生する。

    Source: College Board AP Course and Exam Description · ⁨出典: College Board AP コースおよび試験説明書⁩

    English

    The production function 生产函数 links inputs to output. In the short run 短期 at least one input (usually capital) is fixed 固定; in the long run 长期 all inputs vary.

    • Total product 总产量 is the total output.
    • Marginal product 边际产量 (MP) is the extra output from one more unit of a variable input (usually labor): $MP=\dfrac{\Delta\ \text{output}}{\Delta\ \text{labor}}$.
    • Average product 平均产量 is output per worker.

    As you add workers to fixed capital, MP eventually falls – the law of diminishing marginal returns 边际收益递减法则. This shape of MP is what drives the shape of the cost curves below.

    日本語
    製鉄所:生産関数と費用が企業の供給を形作る
    製鉄所:生産関数と費用が企業の供給を形作る

    生産関数 は投入量と生産量を結ぶ。短期間 では少なくとも一つの投入要素(通常は 資本)が 固定 されている;長期間 では全ての投入要素が変動する。

    • 総生産量 は総生産量である。
    • 限界生産量 (MP) は可変投入要素(通常は労働)の追加1単位あたりの増加分 — $MP=\dfrac{\Delta\ \text{output}}{\Delta\ \text{labor}}$。
    • 平均生産量 は労働者一人あたりの生産量。

    固定された資本に労働者を追加していくと、最終的に MP は減少する — 限界生産逓減の法則。この MP の形状が、後に示す費用曲線の形状を決定する。

    工場生産ラインで動作するロボットアーム
    生産関数は、労働力やこのロボットのような資本といった投入要素を産出物へ変換します
    3.2

    Short-Run Production Costs · ⁨短期生産コスト⁩

    Syllabus · ⁨シラバス⁩
    English

    Enduring Understanding (PRD-1): Firms' production and cost constraints over different input and output levels shape optimal decisions in the short run and long run.

    Learning Objective PRD-1.A: a. Define (using graphs where appropriate) key terms and concepts relating to production and cost. b. Explain (using graphs where appropriate) how production and cost are related in the short run and long run. c. Calculate (using data from a graph or table as appropriate) the various measures of productivity and short-run and long-run costs.

    • PRD-1.A.4 Fixed costs and variable costs determine the total cost.
    • PRD-1.A.5 Marginal cost, average (fixed, variable, and total) cost, total cost, and total variable cost change as total output changes, but total fixed cost remains constant at all output levels, including zero output.
    • PRD-1.A.6 Production functions with diminishing marginal returns yield an upward-sloping marginal cost curve.
    • PRD-1.A.7 Specialization and the division of labor reduce marginal costs for firms.
    • PRD-1.A.8 Cost curves can shift in response to changes in input costs and productivity.
    日本語

    持続的理解(PRD-1): 企業の生産とコスト制約は、投入量および産出量の変化に応じて短期間および長期間における最適意思決定を形成する。

    学習目標 PRD-1.A: a. 生産およびコストに関連する主要な用語や概念を定義せよ(必要に応じグラフを用いること)。 b. 生産とコストが短期間および長期間においてどのように関連しているかを説明せよ(必要に応じグラフを用いること)。 c. 生産性のさまざまな指標や、短期間および長期間のコストを計算せよ(必要に応じグラフまたは表のデータを用いること)。

    • PRD-1.A.4 固定費と変動費が総コストを決定する。
    • PRD-1.A.5 限界コスト、平均コスト(固定、変動、総)、総コスト、および総変動費は総産出量の変化に伴い変動するが、固定費はゼロの産出を含むあらゆる産出レベルにおいて一定である。
    • PRD-1.A.6 限界逓減の法則を持つ生産関数は、右上がりの限界コスト曲線をもたらす。
    • PRD-1.A.7 専門化および労働の分業は、企業にとって限界コストを低下させる。
    • PRD-1.A.8 コスト曲線は、投入コストおよび生産性の変化に応じてシフトすることがある。

    Source: College Board AP Course and Exam Description · ⁨出典: College Board AP コースおよび試験説明書⁩

    English
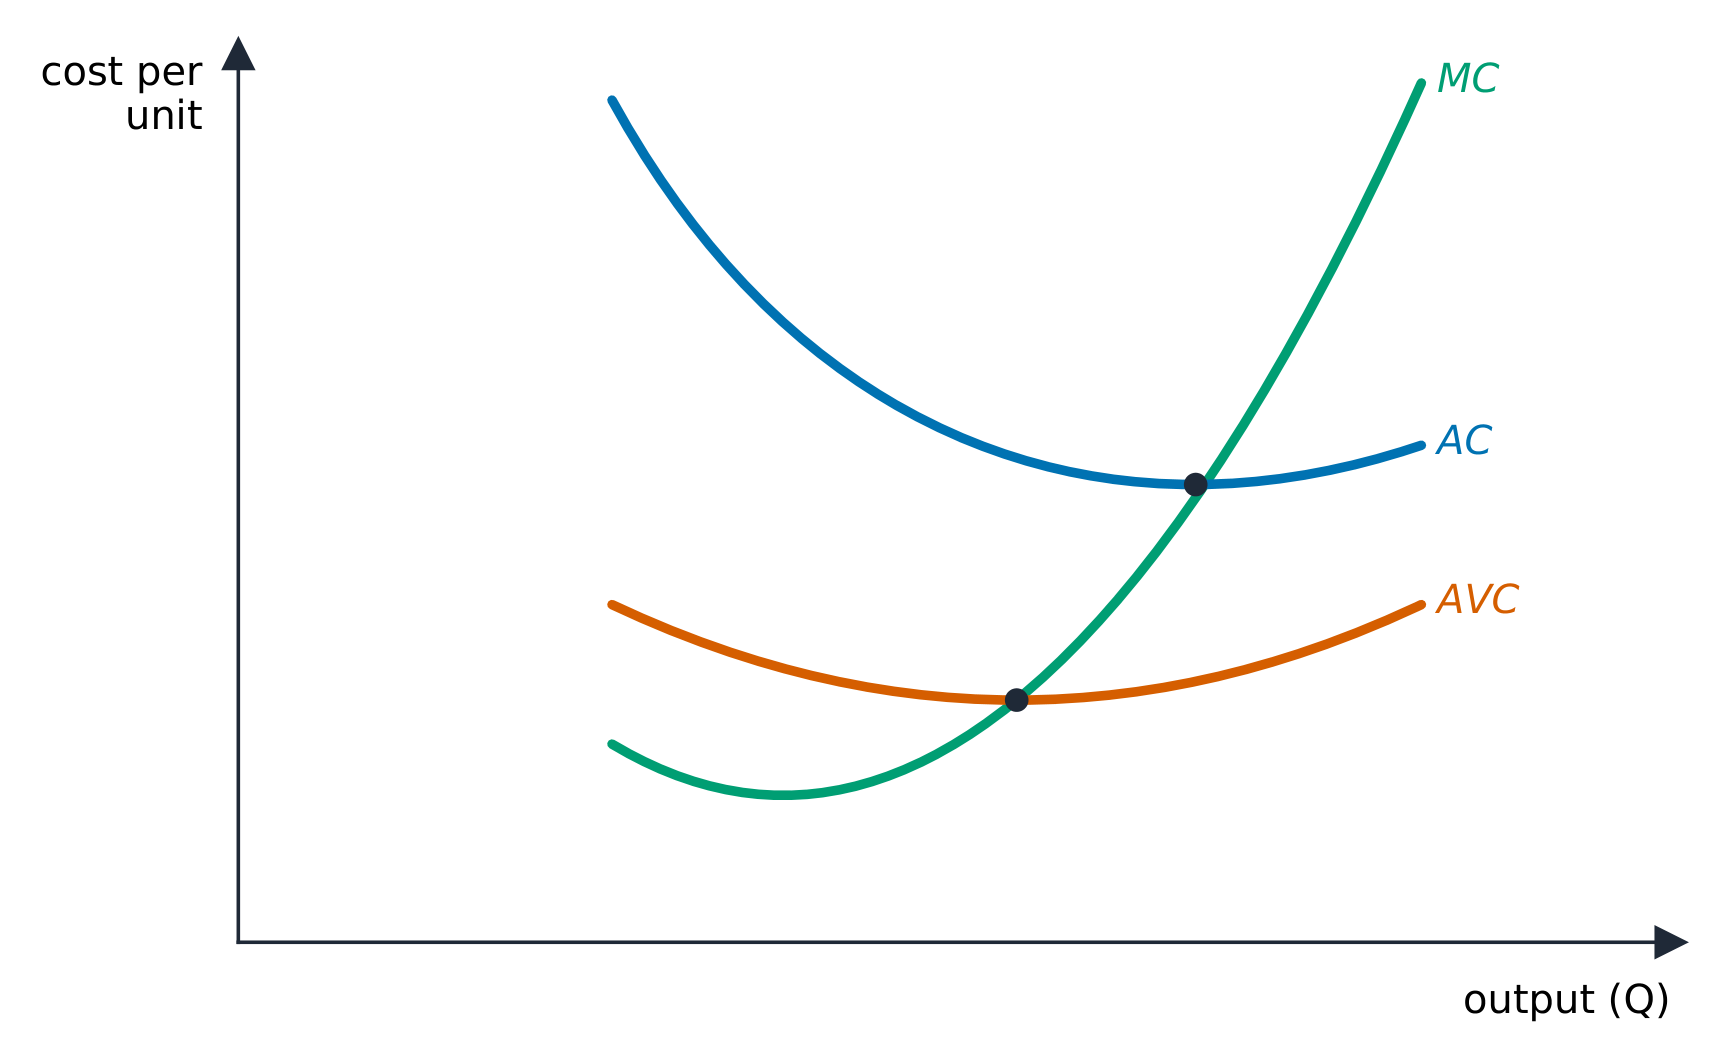
    Short-run cost curves (MC, ATC, AVC)

    Costs split into fixed and variable:

    • Fixed cost 固定成本 (FC) does not change with output (rent on the factory).
    • Variable cost 可变成本 (VC) rises with output (materials, labor).
    • Total cost 总成本 $TC=FC+VC$.

    The per-unit costs matter most:

    • Average fixed cost $AFC=FC/Q$ falls continuously (spreading fixed cost).
    • Average variable cost $AVC=VC/Q$ and average total cost $ATC=TC/Q$ are U-shaped.
    • Marginal cost 边际成本 $MC=\dfrac{\Delta TC}{\Delta Q}$ is the cost of one more unit.

    Two key facts: MC is the mirror image of MP (when MP rises, MC falls, and vice versa), and MC cuts both AVC and ATC at their minimum points (when marginal is below average, the average falls; when above, it rises).

    Worked example. A firm has fixed cost $FC=\$100$. At $Q=10$ its total cost is $\$300$, so variable cost is $\$200$: then $ATC=\tfrac{300}{10}=\$30$, $AVC=\tfrac{200}{10}=\$20$, and $AFC=\tfrac{100}{10}=\$10$ (note $AFC+AVC=ATC$). If raising output to $Q=11$ pushes total cost to $\$325$, the marginal cost of that $11$th unit is $\dfrac{\Delta TC}{\Delta Q}=\dfrac{325-300}{1}=\$25$.

    日本語
    短期間の費用曲線(MC, ATC, AVC)

    コストは固定費と変動費に分類されます:

    短期の限界・平均・平均変動費曲線
    短期の限界・平均・平均変動費曲線
    • 固定費(FC)は産出量の変化に伴わず一定です(工場の家賃など)。
    • 変動費(VC)は産出量の増加に伴って上昇します(原材料、人件費)。
    • 総コスト $TC=FC+VC$。

    単位あたりのコストが最も重要です:

    • 平均固定費 $AFC=FC/Q$ は減少し続けます(固定費を生産量で分散させるため)。
    • 平均変動費 $AVC=VC/Q$ と 平均総コスト $ATC=TC/Q$ は U字型 を呈します。
    • 限界コスト $MC=\dfrac{\Delta TC}{\Delta Q}$ は追加単位の生産にかかる費用です。

    重要な2つの事実:MCはMPの鏡像です(MPが上昇すればMCは下降し、その逆も然り)、かつ MCはAVCおよびATCの最小点を通過します(限界が平均を下回れば平均は下がり、上回れば平均は上昇します)。

    ** worked example.** ある企業の固定費が $FC=\$100$. At $Q=10$ its total cost is $\$300$ で、変動費が $\$200$: then $ATC=\tfrac{300}{10}=\$30$、$AVC=\tfrac{200}{10}=\$20$, and $AFC=\tfrac{100}{10}=\$10$ ($AFC+AVC=ATC$ に注意)。生産量を $Q=11$ に増やすと総コストが $\$325$, the marginal cost of that $11$th unit is $\dfrac{\Delta TC}{\Delta Q}=\dfrac{325-300}{1}=\$25$ になります。

    Explore · ⁨探索⁩

    Explore the U-shaped cost curves · ⁨U字型のコスト曲線を調べる⁩

    As output rises, marginal cost eventually climbs (diminishing returns) and cuts through the U-shaped average cost at its minimum — the most efficient scale. · ⁨生産量が増加すると、限界費用は最終的に上昇(逓増収益递减)し、U字型の平均費用曲線の最小点である最も効率的な規模で交差します。⁩

    Vocabulary · ⁨語彙⁩ Train · ⁨練習する⁩
    English 日本語
    production function/prəˈdʌkʃn ˈfʌŋkʃn/ 生産関数
    short run/ʃɔːt rʌn/ 短期
    fixed/fɪkst/ 固定されている
    long run/lɒŋ rʌn/ 長期
    Total product/ˈtəʊtl ˈprɒdʌkt/ 総生産量
    Marginal product/ˈmɑːdʒɪnl ˈprɒdʌkt/ 限界生産量
    Average product/ˈævrɪdʒ ˈprɒdʌkt/ 平均生産量
    law of diminishing marginal returns/lɔː ɒv dɪˈmɪnɪʃɪŋ ˈmɑːdʒɪnl rɪˈtɜːnz/ 限界生産逓減の法則
    Fixed cost/fɪkst kɒst/ 固定費
    Variable cost/ˈveərɪəbl kɒst/ 可変費
    Total cost/ˈtəʊtl kɒst/ 総コスト
    Marginal cost/ˈmɑːdʒɪnl kɒst/ 限界原価
    3.3

    Long-Run Production Costs · ⁨長期生産コスト⁩

    Syllabus · ⁨シラバス⁩
    English

    Enduring Understanding (PRD-1): Firms' production and cost constraints over different input and output levels shape optimal decisions in the short run and long run.

    Learning Objective PRD-1.A: a. Define (using graphs where appropriate) key terms and concepts relating to production and cost. b. Explain (using graphs where appropriate) how production and cost are related in the short run and long run. c. Calculate (using data from a graph or table as appropriate) the various measures of productivity and short-run and long-run costs.

    • PRD-1.A.9 In the long run, firms can adjust all their inputs, and as a result, all costs become variable.
    • PRD-1.A.10 The relationship between inputs and outputs in the long run is described by the scale of production—increasing, decreasing, or constant returns to scale.
    • PRD-1.A.11 The long-run average total cost is characterized by economies of scale, diseconomies of scale, or constant returns to scale (efficient scale).
    • PRD-1.A.12 The minimum efficient scale plays a role in determining the concentration of firms in a market and the market structure.
    日本語

    持続的理解(PRD-1): 企業の生産とコスト制約は、投入量および産出量の変化に応じて短期間および長期間における最適意思決定を形成する。

    学習目標 PRD-1.A: a. 生産およびコストに関連する主要な用語や概念を定義せよ(必要に応じグラフを用いること)。 b. 生産とコストが短期間および長期間においてどのように関連しているかを説明せよ(必要に応じグラフを用いること)。 c. 生産性のさまざまな指標や、短期間および長期間のコストを計算せよ(必要に応じグラフまたは表のデータを用いること)。

    • PRD-1.A.9 長期間において、企業はすべての投入量を変更できるため、結果としてすべてのコストは変動費となる。
    • PRD-1.A.10 長期間における投入量と産出量の関係は、規模の経済(増大、減少、または一定)によって記述される。
    • PRD-1.A.11 長期間の平均総コストは、規模の経済、規模の非経済、または一定の規模の経済(効率的スケール)の特徴を持つ。
    • PRD-1.A.12 最小効率スケールは、市場における企業の集中度および市場構造の決定に役割を果たす。

    Source: College Board AP Course and Exam Description · ⁨出典: College Board AP コースおよび試験説明書⁩

    English

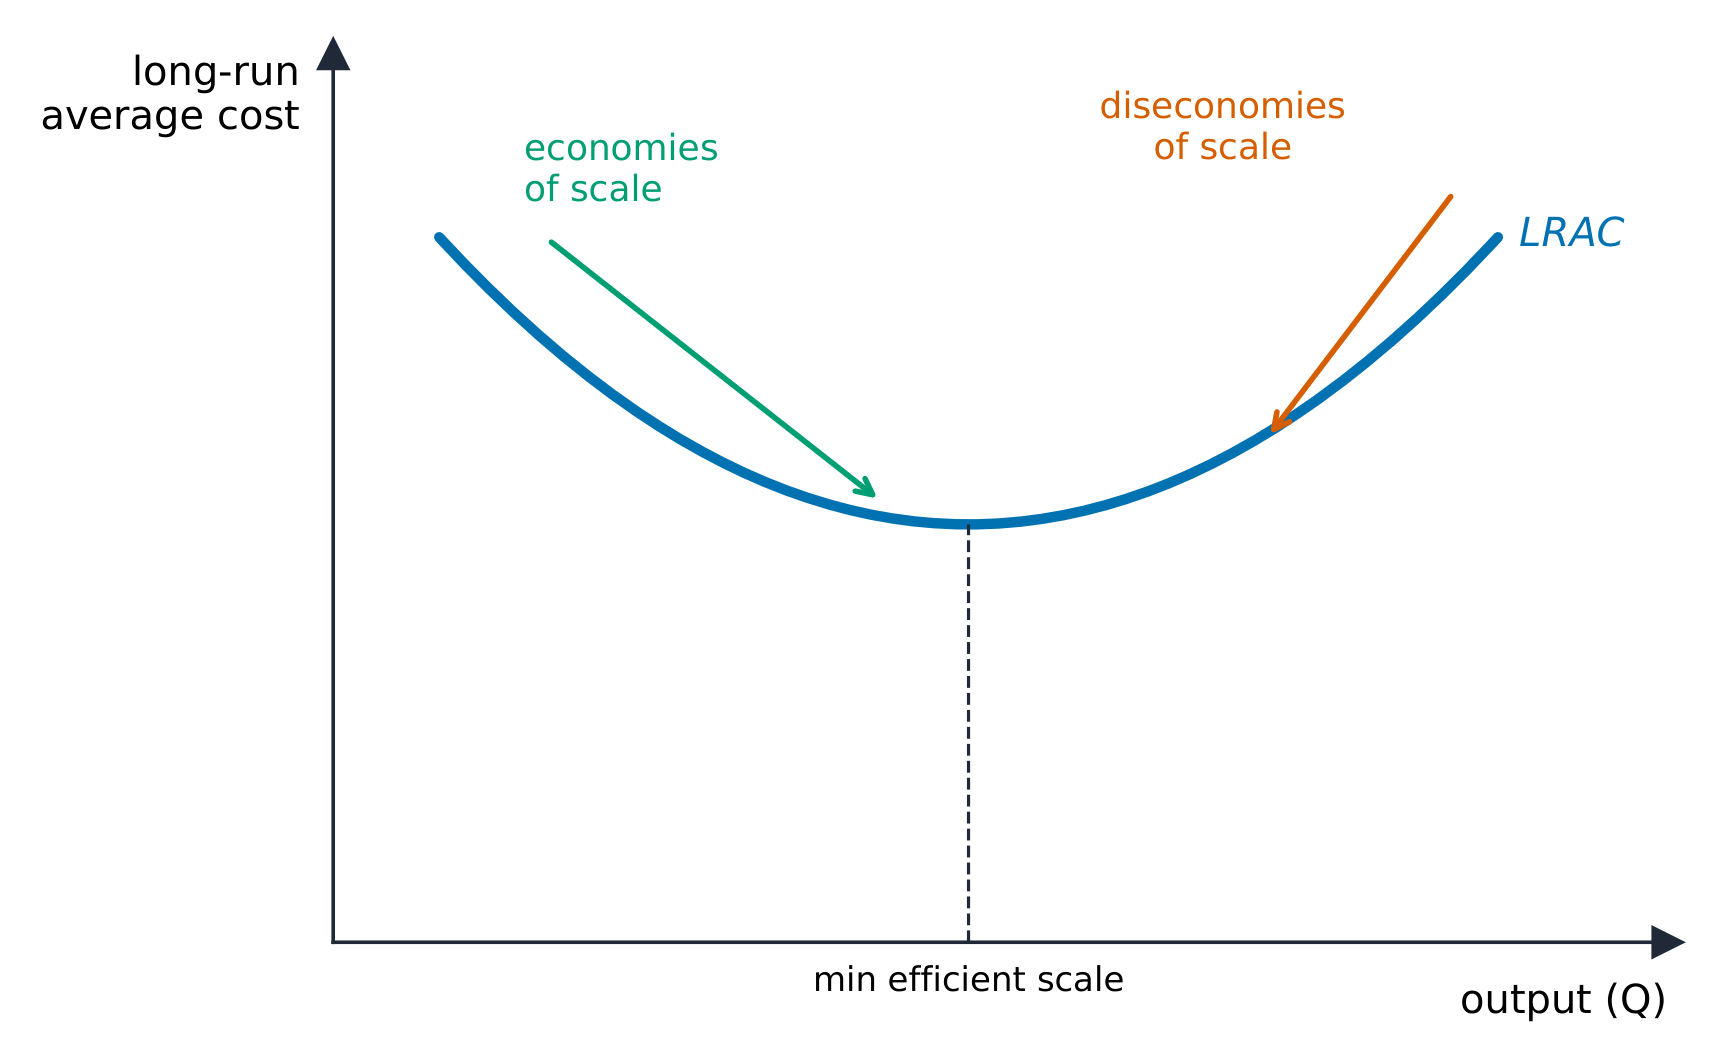
    In the long run all inputs – including plant size – can change, so only the long-run average total cost (LRATC) curve matters. Its shape shows returns to scale:

    • Economies of scale 规模经济: LRATC falls as output grows (bulk buying, specialization).
    • Constant returns to scale: LRATC flat.
    • Diseconomies of scale 规模不经济: LRATC rises (a firm too big to manage well).

    Exam skill: know that "diminishing returns" is a short-run idea (one fixed input) while "economies of scale" is a long-run idea (all inputs vary) – examiners test the distinction.

    日本語

    長期では設備規模を含むすべての投入要素に変化が可能であるため、長期平均総コスト(LRATC) の曲線のみが重要です。その形状は規模の利得を示します:

    長期平均コスト曲線における規模の経済と不経済
    長期平均コスト曲線における規模の利得と不利得
    • 規模の利得: LRATCは産出量の増加とともに低下します(大量購入、専門化など)。
    • 一定の規模の利得: LRATCは一定です。
    • 規模の不利得: LRATCは上昇します(企業が大きすぎて適切に管理できなくなる場合)。

    受験スキル: 「限界効用逓減」は短期の概念(固定投入要素が1つ)であり、「規模の利得」は長期の概念(すべての投入要素が可変)であることを理解しておくこと。試験官はこの区別を問うことがあります。

    Vocabulary · ⁨語彙⁩ Train · ⁨練習する⁩
    English 日本語
    Economies of scale/ɪˈkɒnəmiz ɒv skeɪl/ 規模の経済
    Diseconomies of scale/ˌdɪsɪˈkɒnəmiz ɒv skeɪl/ 規模の不経済
    Explicit costs/ekˈsplɪsɪt kɒsts/ 明示的成本
    implicit costs/ɪmˈplɪsɪt kɒsts/ 隠然コスト
    Accounting profit/əˈkaʊntɪŋ ˈprɒfɪt/ 会計利益
    Economic profit/ˌiːkəˈnɒmɪk ˈprɒfɪt/ 経済利益
    normal profit/ˈnɔːml ˈprɒfɪt/ 正常利益
    entry/ˈentri/ 参入
    exit/ˈeɡzɪt/ 撤退
    perfectly competitive/ˈpɜːfektlɪ kəmˈpetɪtɪv/ 完全競争
    price taker/praɪs ˈteɪkə/ 価格受容者
    allocatively efficient/ˈæləkətɪvli ɪˈfɪʃənt/ 配置効率性が達成される。
    productively efficient/prəˈdʌktɪvli ɪˈfɪʃənt/ 生産効率
    3.4

    Types of Profit · ⁨利益の種類⁩

    Syllabus · ⁨シラバス⁩
    English

    Enduring Understanding (CBA-2): To determine the optimal level at which to pursue an activity whose total benefits exceed total cost, rational economic agents compare marginal benefits and marginal costs.

    Learning Objective CBA-2.C: a. Define the different types of profit. b. Explain how firms respond to profit opportunities. c. Calculate a firm's profit or loss.

    • CBA-2.C.1 Firms respond to economic profit (loss) rather than accounting profit.
    • CBA-2.C.2 Accounting profit fails to account for implicit costs (such as cost of financial capital, compensation for risk, or an entrepreneur's time), which, if fully compensated, result in normal profit.
    日本語

    長期的理解 (CBA-2): 総便益が総コストを上回る活動の最適水準を決定するためには、合理的な経済行動主体は限界便益と限界コストを比較する。

    学習目標 CBA-2.C: a. 利益の異なる種類を定義せよ。 b. 企業が利益機会にどう反応するかを説明せよ。 c. 企業の利益または損失を計算せよ。

    • CBA-2.C.1 企業は会計利益ではなく、経済的利益(損失)に対して反応する。
    • CBA-2.C.2 会計利益は、暗黙コスト(金融資本のコスト、リスクへの対価、または起業家の時間など)を考慮していない。これらが完全に補償された場合、正常利益が生じる。

    Source: College Board AP Course and Exam Description · ⁨出典: College Board AP コースおよび試験説明書⁩

    English

    Economists count all opportunity costs, including the owner's:

    • Explicit costs 显性成本 are out-of-pocket payments; implicit costs 隐性成本 are the opportunity costs of owner-supplied resources (forgone salary, forgone interest).
    • Accounting profit 会计利润 $=$ revenue $-$ explicit costs.
    • Economic profit 经济利润 $=$ revenue $-$ explicit $-$ implicit costs.

    Because economic profit subtracts more, it is smaller. Zero economic profit (a normal profit 正常利润) still means the owner is earning exactly the opportunity cost of their resources – a perfectly acceptable outcome.

    Worked example. A shopkeeper takes in $\$200{,}000$ of revenue and pays $\$120{,}000$ in explicit costs, so accounting profit is $\$80{,}000$. But she gave up a $\$70{,}000$ salary elsewhere and $\$5{,}000$ of interest on the savings she invested – $\$75{,}000$ of implicit costs. Her economic profit is $80{,}000-75{,}000=\$5{,}000$: still positive, so staying in business genuinely beats her next-best alternative.

    日本語

    経済学者は所有者を含めたすべての機会原価を計上します:

    • 明示的原価は現金での支払い;隠秘的原価は所有者が提供する資源の機会原価(放棄した給与、放棄した利息)です。
    • 会計利益 $=$ 売上高 $-$ 明示的原価。
    • 経済利益 $=$ 売上高 $-$ 明示的 $-$ 隠秘的原価。

    経済利益はより多くの原価を差し引くため、値は小さくなります。ゼロ経済利益(適正利益)であっても、所有者は自身の資源の機会原価をちょうど回収していることを意味し、これは非常に適切な結果です。

    ** worked example.** 店主は売上高として $\$200{,}000$ of revenue and pays $\$120{,}000$ 、明示的原価として $\$80{,}000$. But she gave up a $\$70{,}000$ を受け取り、隠秘的原価として他方での給与 $\$5{,}000$ of interest on the savings she invested – $\$75{,}000$ があります。したがって経済利益は $80{,}000-75{,}000=\$5{,}000$: 依然として正值なので、経営を続けることは次善の代替策よりも実際に優れています。

    3.5

    Profit Maximization · ⁨利益最大化⁩

    Syllabus · ⁨シラバス⁩
    English

    Enduring Understanding (CBA-2): To determine the optimal level at which to pursue an activity whose total benefits exceed total cost, rational economic agents compare marginal benefits and marginal costs.

    Learning Objective CBA-2.D: a. Define (using graphs or data as appropriate) the profit-maximizing rule. b. Explain (using a graph or data as appropriate) the profit-maximizing level of production.

    • CBA-2.D.1 Firms are assumed to produce output to maximize their profits by comparing marginal revenue and marginal cost.
    日本語

    長期的理解 (CBA-2): 総便益が総コストを上回る活動の最適水準を決定するためには、合理的な経済行動主体は限界便益と限界コストを比較する。

    学習目標 CBA-2.D: a. 利益最大化の原則を定義せよ(必要に応じグラフまたはデータを用いること)。 b. 利益最大化の生産レベルを説明せよ(必要に応じグラフまたはデータを用いること)。

    • CBA-2.D.1 企業は、限界収益と限界コストを比較することにより、利益を最大化する生産量を選択すると仮定されている。

    Source: College Board AP Course and Exam Description · ⁨出典: College Board AP コースおよび試験説明書⁩

    English

    Every firm, in every market structure, maximizes profit at the quantity where marginal revenue equals marginal cost:

    $$MR=MC.$$
    Produce each unit whose MR exceeds its MC; stop when they are equal. Producing less leaves profitable units unmade; producing more adds units that cost more than they earn.

    日本語

    あらゆる市場構造において、企業は限界収益が限界コストと等しくなる数量で利益を最大化します:

    $$MR=MC.$$
    MRがMCを上回る各単位を生産し続け、両者が等しくなった時点で停止します。生産不足なら利益となる単位を生み逃しますし、過度な生産なら収益以上のコストがかかる単位が生産されてしまいます。

    3.6

    Deciding to Produce, Enter, or Exit · ⁨生産・参入・退出の決定⁩

    Syllabus · ⁨シラバス⁩
    English

    Enduring Understanding (PRD-2): Firms' short-run decisions to produce output, and long-run decisions to enter or exit a market, are based on profitability.

    Learning Objective PRD-2.A: Explain (using graphs or data where appropriate) firms' short-run decisions to produce positive output levels, or long-run decisions to enter or exit a market in response to profit-making opportunities.

    • PRD-2.A.1 In the short run, firms decide to operate (i.e., produce positive output) or shut down (i.e., produce zero output) by comparing total revenue to total variable cost or price to average variable cost (AVC).
    • PRD-2.A.2 In the absence of barriers to entry or exit, in the long run (i.e., once factors that are fixed in the short run become variable), firms enter a market in which there are profit-making opportunities and exit a market when they anticipate economic losses.
    日本語

    持続的理解(PRD-2): 企業の短期間の生産決定および長期間の市場参入・退出決定は、収益性に基づいている。

    学習目標 PRD-2.A: 企業が利益機会に応じて、短期間で正の生産量を生産する決定を行う、あるいは長期間で市場に参入・退出する決定を行う理由を説明せよ(必要に応じグラフまたはデータを用いること)。

    • PRD-2.A.1 短期間において、企業は総収益と総変動費、または価格と平均変動費(AVC)を比較することで、営業(正の生産量を生産すること)か閉鎖(ゼロの生産量を生産すること)かの決定をする。
    • PRD-2.A.2 参入・退出の障壁がない場合、長期間において(すなわち、短期間で固定であった要素が変動可能になった後)、企業は利益機会がある市場に参入し、経済的損失が予想される市場から退出する。

    Source: College Board AP Course and Exam Description · ⁨出典: College Board AP コースおよび試験説明書⁩

    English

    Even at $MR=MC$, a firm must check whether to operate:

    • Short run – the shutdown rule: keep producing only if price covers average variable cost ($P\geq AVC$). If $P, shut down and lose only fixed cost. So the firm's short-run supply curve is its MC curve above minimum AVC.
    • Profit check: compare $P$ to $ATC$ at the profit-maximizing quantity – $P>ATC$ means economic profit, $P means a loss, $P=ATC$ means break-even.
    • Long run – entry and exit: economic profits attract entry 进入; losses cause exit 退出. This continues until economic profit is zero.
    日本語

    $MR=MC$ であっても、企業は営業を続けるか否かを検討する必要があります:

    • 短期 – 休業ルール: 価格が平均変動費($P\geq AVC$)をカバーする場合のみ生産を継続します。$P 場合は休業し、固定費のみを損失として負担します。つまり、企業の短期供給曲線は最小AVC以上のMC曲線となります。
    • 利益確認: 利益最大化点における $P$ と $ATC$ を比較します。$P>ATC$ は経済利益、$P は損失、$P=ATC$ は損益分岐点を示します。
    • 長期 – 参入と退出: 経済利益は参入を誘引し、損失は退出を引き起こします。経済利益がゼロになるまでこれが続きます。
    3.7

    Perfect Competition · ⁨完全競争⁩

    Syllabus · ⁨シラバス⁩
    English

    Enduring Understanding (PRD-3): Even with a common goal of profit-maximization, market structure constrains and influences prices, output, and efficiency.

    Learning Objective PRD-3.A: a. Define (using graphs as appropriate) the characteristics of perfectly competitive markets and efficiency. b. Explain (using graphs where appropriate) equilibrium and firm decision making in perfectly competitive markets and how prices in perfectly competitive markets lead to efficient outcomes. c. Calculate (using data from a graph or table as appropriate) economic profit (loss) in perfectly competitive markets.

    • PRD-3.A.1 A perfectly competitive market is efficient. Firms in perfectly competitive markets face no barriers to entry and have no market power.
    • PRD-3.A.2 In perfectly competitive markets, prices communicate to consumers and producers the magnitude of others' marginal costs of production and marginal benefits of consumption and provide incentives to act on that information (i.e., price equals marginal cost in an efficient market).
    • PRD-3.A.3 In perfectly competitive markets, firms can sell all their outputs at a constant price determined by the market.
    • PRD-3.A.4 At a competitive market equilibrium, firms are price takers and select output to maximize profit by producing the level of output where the marginal cost equals marginal revenue (at the price).
    • PRD-3.A.5 At a competitive market equilibrium, the price of a product equals both the private marginal benefit received by the last unit consumed and the private marginal cost incurred to produce the last unit, thus achieving allocative efficiency.
    • PRD-3.A.6 In a short-run competitive equilibrium, price can either be above or below its long-run competitive level resulting in profits or losses, motivating entry or exit of firms and moving prices and quantities toward long-run equilibrium.
    • PRD-3.A.7 In a long-run perfectly competitive equilibrium, productive efficiency implies all operating firms produce at efficient scale, price equals marginal cost and minimum average total cost, and firms earn zero economic profit.
    • PRD-3.A.8 Firms may be in a constant cost, increasing cost, or decreasing cost industry. Long-run prices depend on the portion of the long-run cost curves on which firms operate.
    • PRD-3.A.9 A perfectly competitive market in long-run equilibrium is allocatively and productively efficient.
    日本語

    持続的理解(PRD-3): 利益最大化という共通の目標を持っていても、市場構造は価格、生産量、ならびに効率性を制限し、影響を与える。

    学習目標 PRD-3.A: a. 完全競争市場および効率性の特性を定義せよ(必要に応じグラフを用いること)。 b. 完全競争市場における均衡および企業の意思決定、ならびに完全競争市場の価格がなぜ効率的な結果をもたらすかを説明せよ(必要に応じグラフを用いること)。 c. 完全競争市場における経済的利益(損失)を計算せよ(必要に応じグラフまたは表のデータを用いること)。

    • PRD-3.A.1 完全競争市場は効率的である。完全競争市場の企業は参入障壁に直面せず、市場権限を持たない。
    • PRD-3.A.2 完全競争市場において、価格は消費者および生産者に対し、他者の限界生産コストおよび限界消費便益の大きさを伝達し、その情報に基づく行動に対するインセンティブを提供する(すなわち、効率的な市場では価格が限界コストに等しい)。
    • PRD-3.A.3 完全競争市場において、企業は市場によって決定された一定の価格で全ての生産物を販売できる。
    • PRD-3.A.4 競争均衡において、企業は価格受容者であり、限界コストが限界収益(価格)に等しい生産量を選択することで利益を最大化する。
    • PRD-3.A.5 競争市場の均衡点において、製品の価格は、最終的に消費された単位の個人による限界便益と、最終的に生産された単位の個人による限界コストの両方と等しくなり、配分効率を達成します。
    • PRD-3.A.6 短期競争均衡において、価格は長期競争水準より高い場合も低い場合もあり、利益または損失を生じさせる。これは企業の参入や撤退を促し、価格と数量を長期均衡へと導く。
    • PRD-3.A.7 長期完全競争均衡において、生産効率はすべての操業企業が生産適正規模で生産することを意味する。価格は限界コストおよび最小平均総成本に等しくなり、企業はゼロ経済利潤を得る。
    • PRD-3.A.8 企業は一定コスト産業、増加コスト産業、減少コスト産業のいずれかに属する可能性がある。長期価格は企業が長期的なコスト曲線のどの部分で操業するかによって決まる。
    • PRD-3.A.9 長期均衡にある完全競争市場は、配分効率かつ生産効率である。

    Source: College Board AP Course and Exam Description · ⁨出典: College Board AP コースおよび試験説明書⁩

    English

    A perfectly competitive 完全竞争 market has many small firms, an identical (homogeneous) product, free entry and exit, and perfect information. Each firm is a price taker 价格接受者 – too small to affect the price – so it faces a horizontal demand curve at the market price, and price = marginal revenue = average revenue ($P=MR=AR$).

    This is why economists prize perfect competition. In long-run equilibrium it is both allocatively efficient 配置效率 and productively efficient 生产效率. Allocative efficiency holds because the firm produces where $P = MC$: the price (society's marginal benefit from the last unit) equals its marginal cost, so exactly the right amount is made. Productive efficiency holds because free entry drives price down to the minimum of average total cost, so goods are made as cheaply as possible. The market price is itself a signal that communicates everyone's marginal costs and benefits.

    The side-by-side panel is the graph the exam wants: the market (left) fixes the price $P^{*}$; the firm (right) takes it as a horizontal line and produces where $MC=P$. When $P>ATC$ there is a short-run profit (the shaded box); that profit attracts entry, which shifts market supply right and pushes the price down.

    • Short run: the firm can earn profit, break even, or take a loss, producing where $P=MC$.
    • Long run: entry and exit drive the firm to zero economic profit, producing where $P=MC=ATC$ at minimum ATC. This double efficiency – productive efficiency (lowest-cost output) and allocative efficiency ($P=MC$, so the last unit's value equals its cost) – is the benchmark against which every other market structure is judged.

    Exam skill: be able to draw the side-by-side market and single-firm graphs, show a short-run profit or loss, then show how entry/exit restores long-run equilibrium at minimum ATC.

    日本語

    完全競争市場には多数の中小企業が存在し、同一(均質)の商品、自由な参入と退出、完全な情報があります。各企業は価格受取人であり、市場価格に影響を与えるほど大きくないため、市場価格において水平な需要曲線を facing します。そして価格=限界収益=平均収益($P=MR=AR$)となります。

    これが経済学者が完全競争を重視する理由です。長期均衡においては、配分効率と生産効率の両方が達成されています。配分効率は、企業が $P = MC$ で生産するため成立します。価格(社会が最終単位から得る限界便益)が限界コストと等しいため、まさに必要な量が生産されているからです。生産効率は、自由な参入によって価格が平均総コストの最小点まで押し下げられ、商品が可能な限り安価に生産されるため成立します。市場価格自体がシグナルとなり、皆の限界コストと便益を伝達しています。

    市場が価格を設定し、価格受容企業は MC = P で生産する(ここでは短期利潤あり)
    市場が価格を設定し、価格受取人は MC = P で生産する(ここでは短期の利益あり)

    並べたパネルは試験で求めるグラフです:市場(左側)が価格 $P^{*}$ を固定しており、企業(右側)がそれを水平線として受け入れ、$MC=P$ で生産します。$P>ATC$ のとき短期利益(影付きの長方形)が生じ、この利益が新規参入を招き、市場供給曲線を右へ移動させて価格を下げる原因となります。

    完全競争企業の長期では純利潤のみを得る
    完全競争企業は長期的に通常利潤のみを達成する
    • 短期間: 企業は利益を得たり、損益分岐したり、損失を出したりできる。$P=MC$で生産される。
    • 長期間: 参入と撤退が企業を経済的ゼロ利潤へと駆動させ、最小平均総成本(ATC)において$P=MC=ATC$で生産される。この二重の効率性——生産効率(最低コストでの生産量)と配置効率($P=MC$、すなわち最終単位の価値がそのコストと等しい)——は、他のすべての市場構造が比較される基準となる。

    試験技能: 並置された市場図と単一企業の図を描き、短期間の利益または損失を示し、参入・撤退が最小ATCにおける長期均衡を取り戻す様子を示せるようにすること。

    Explore · ⁨探索⁩

    A price-taking firm in a competitive market · ⁨競争市場における価格受容企業⁩

    In perfect competition the market sets the price and each firm is a price-taker. It produces where price equals marginal cost, earning zero economic profit in the long run. · ⁨完全競争では、市場が価格を決定し、各企業は価格受容者となります。企業は価格が限界費用と等しくなる地点で生産を行い、長期的には経済的利益ゼロを達成します。⁩

    3.7

    Exam tips · ⁨試験対策⁩

    English
    • Know the cost curves: AFC falls, ATC/AVC are U-shaped, and MC cuts ATC and AVC at their minimums.
    • Every firm maximises profit at MR = MC; check the shutdown rule ($P \ge AVC$ in the short run).
    • Distinguish accounting profit (revenue − explicit costs) from economic profit (also minus implicit/opportunity costs); zero economic profit is normal.
    • "Diminishing returns" is short-run (one fixed input); "economies of scale" is long-run (all inputs vary).
    • In perfect competition $P=MR=AR$; entry/exit drive long-run economic profit to zero at minimum ATC.
    日本語
    • 費用曲線を知る:AFCは減少し、ATC/AVCはU字型であり、MCがATCおよびAVCの最小値で交差する。
    • 全ての企業はMR = MCで利潤を最大化する。shutdown ruleを確認する(短期間では$P \ge AVC$)。
    • 会計利潤(収益 − 明示的コスト)と経済利潤(さらに隠匿的・機会コストを引いたもの)を区別する;経済的ゼロ利潤は通常利潤である。
    • 「限界報酬逓減」は短期間(固定投入要素が1つ)、「規模の経済」は長期間(全投入要素が変化する)。
    • 完全競争において$P=MR=AR$;参入・撤退が最小ATCで長期の経済利潤をゼロにする。
  • 4

    Imperfect Competition · ⁨不完全競争⁩

    Watch lesson · ⁨レッスンを視聴⁩
    4.1

    Imperfect Competition and Market Power

    Syllabus · ⁨シラバス⁩
    English

    Enduring Understanding (PRD-3): Even with a common goal of profit-maximization, market structure constrains and influences prices, output, and efficiency.

    Learning Objective PRD-3.B: a. Define (using graphs where appropriate) the characteristics of imperfectly competitive markets and inefficiency.

    • PRD-3.B.1 Imperfectly competitive markets include monopoly, oligopoly, and monopolistic competition in product markets and monopsony in factor markets.
    • PRD-3.B.2 In imperfectly competitive output markets and assuming all else is constant, a firm must lower price to sell additional units.
    • PRD-3.B.3 In imperfectly competitive markets, consumers and producers respond to prices that are above the marginal costs of production and/or marginal benefits of consumption (i.e., price is greater than marginal cost in an inefficient market).
    • PRD-3.B.4 Incentives to enter an industry may be mitigated by barriers to entry. Barriers to entry—such as high fixed/start-up costs, legal barriers to entry, and exclusive ownership of key resources—can sustain imperfectly competitive market structures.
    日本語

    持続的理解(PRD-3): 利益最大化という共通の目標を持っていても、市場構造は価格、生産量、ならびに効率性を制限し、影響を与える。

    学習目標 PRD-3.B: a. 不完全競争市場の特性および非効率性を定義せよ(必要な場合は図を用いること)。

    • PRD-3.B.1 不完全競争市場には、製品市場における独占、寡占、独占的競争、要素市場における買手独占が含まれる。
    • PRD-3.B.2 不完全競争の輸出市場において、他的一切都変量と仮定すれば、企業は追加単位を販売するために価格を下げなければならない。
    • PRD-3.B.3 不完全競争市場において、消費者と生産者は、生産の限界コストおよび/または消費の限界便益よりも高い価格に対応する(つまり、非効率な市場では価格が限界コストより大きい)。
    • PRD-3.B.4 参入障壁により、業界への参入動機が抑制されることがある。高固定費/立ち上げ費用、法的参入障壁、重要資源の独占所有などの参入障壁は、不完全競争市場構造を維持する要因となる。

    Source: College Board AP Course and Exam Description · ⁨出典: College Board AP コースおよび試験説明書⁩

    English

    Most real markets are imperfectly competitive 不完全竞争: firms have some market power 市场势力 – the ability to set price rather than take it. The source of that power is a downward-sloping demand curve facing the firm, which means that to sell one more unit the firm must lower the price on all units.

    Because of this, marginal revenue is below price ($MR) for every firm with market power. On a straight-line demand curve the MR curve has the same intercept but twice the slope, lying below demand. This one fact – $MR – separates every imperfect market from perfect competition and explains why they produce less and charge more.

    Worked example. A firm with market power faces demand $P=100-Q$. Selling $1$ unit gives $P=\$99$ and total revenue $\$99$; selling a $2$nd forces the price down to $\$98$ on both units, so revenue rises to $2\times98=\$196$. The marginal revenue of that $2$nd unit is $196-99=\$97$ – below its $\$98$ price. In general $MR=100-2Q$, falling twice as fast as demand.

    日本語
    A car assembly line: market power and firm scale differ under imperfect competition
    A car assembly line: market power and firm scale differ under imperfect competition

    Most real markets are imperfectly competitive 不完全竞争: firms have some market power 市场势力 – the ability to set price rather than take it. The source of that power is a downward-sloping demand curve facing the firm, which means that to sell one more unit the firm must lower the price on all units.

    Market structures range from perfect competition to monopoly
    Market structures range from perfect competition to monopoly

    Because of this, marginal revenue is below price ($MR) for every firm with market power. On a straight-line demand curve the MR curve has the same intercept but twice the slope, lying below demand. This one fact – $MR – separates every imperfect market from perfect competition and explains why they produce less and charge more.

    Worked example. A firm with market power faces demand $P=100-Q$. Selling $1$ unit gives $P=\$99$ and total revenue $\$99$; selling a $2$nd forces the price down to $\$98$ on both units, so revenue rises to $2\times98=\$196$. The marginal revenue of that $2$nd unit is $196-99=\$97$ – below its $\$98$ price. In general $MR=100-2Q$, falling twice as fast as demand.

    Vocabulary · ⁨語彙⁩ Train · ⁨練習する⁩
    English 日本語
    imperfectly competitive/ɪmˈpɜːfektlɪ kəmˈpetɪtɪv/ 不完全競争
    market power/ˈmɑːkɪt ˈpaʊə/ 市場力
    4.2

    Monopoly

    Syllabus · ⁨シラバス⁩
    English

    Enduring Understanding (PRD-3): Even with a common goal of profit-maximization, market structure constrains and influences prices, output, and efficiency.

    Learning Objective PRD-3.B: b. Explain (using graphs where appropriate) equilibrium, firm decision making, consumer surplus, producer surplus, profit (loss), and deadweight loss in imperfectly competitive markets and why prices in imperfectly competitive markets cannot be relied on to coordinate the actions of all possible market participants and can lead to inefficient outputs. c. Calculate (using data from a graph or table as appropriate) areas of consumer surplus, producer surplus, profit (loss), and deadweight loss in imperfectly competitive markets.

    • PRD-3.B.5 A monopoly exists because of barriers to entry.
    • PRD-3.B.6 In a monopoly, equilibrium (profit-maximizing) quantity is determined by equating marginal revenue (MR) to marginal cost (MC). The price charged is greater than the marginal cost.
      • Equation: $MR = MC$
    • PRD-3.B.7 In a natural monopoly, long-run economies of scale for a single firm exist throughout the entire effective demand of its product.
    日本語

    持続的理解(PRD-3): 利益最大化という共通の目標を持っていても、市場構造は価格、生産量、ならびに効率性を制限し、影響を与える。

    学習目標 PRD-3.B: b. 不完全競争市場における均衡、企業の意思決定、消費者余剰、生産者余剰、利潤(損失)、死荷重について説明せよ(必要な場合は図を用いること)。さらに、不完全競争市場における価格が、ありうるすべての市場参加者の行動を調整するための指標として信頼できず、非効率な生産量を招くことがある理由を説明せよ。c. 不完全競争市場における消費者余剰、生産者余剰、利潤(損失)、死荷重の面積を計算せよ(必要な場合はグラフまたは表のデータを用いること)。

    • PRD-3.B.5 独占は、参入障壁が存在することによって成立する。
    • PRD-3.B.6 独占において、均衡(利潤最大化)量は、限界収益(MR)と限界コスト(MC)が等しい点で決定される。課される価格は限界コストより高い。
      • 式: $MR = MC$
    • PRD-3.B.7 自然独占において、単一企業による長期スケール経済は、その製品の有効需要全体にわたって存在する。

    Source: College Board AP Course and Exam Description · ⁨出典: College Board AP コースおよび試験説明書⁩

    English
    Monopoly: MR = MC pricing

    A monopoly 垄断 is a single seller of a product with no close substitutes, protected by barriers to entry 进入壁垒 (economies of scale – a natural monopoly 自然垄断 – control of a key resource, patents, or government license).

    • The monopolist maximizes profit at $MR=MC$, then charges the highest price the demand curve allows at that quantity (read price up to the demand curve, not the MR curve).
    • Compared with perfect competition it produces less and charges more, earning long-run economic profit because entry is blocked.
    • This under-production creates deadweight loss 无谓损失 – the monopoly is allocatively inefficient because $P>MC$: the last unit is worth more than it costs, yet is not made.

    Governments may respond with antitrust 反垄断 law, or regulate a natural monopoly's price toward $P=MC$ (socially optimal, but may cause a loss) or $P=ATC$ (fair-return, break-even).

    Exam skill: the monopoly graph is a staple – show quantity at $MR=MC$, price up on the demand curve, and shade profit (between $P$ and $ATC$) and deadweight loss (the triangle to the competitive quantity).

    日本語
    Monopoly: MR = MC pricing

    A monopoly 垄断 is a single seller of a product with no close substitutes, protected by barriers to entry 进入壁垒 (economies of scale – a natural monopoly 自然垄断 – control of a key resource, patents, or government license).

    A monopoly maximises profit where MC = MR and can earn supernormal profit
    A monopoly maximises profit where MC = MR and can earn supernormal profit
    • The monopolist maximizes profit at $MR=MC$, then charges the highest price the demand curve allows at that quantity (read price up to the demand curve, not the MR curve).
    • Compared with perfect competition it produces less and charges more, earning long-run economic profit because entry is blocked.
    • This under-production creates deadweight loss 无谓损失 – the monopoly is allocatively inefficient because $P>MC$: the last unit is worth more than it costs, yet is not made.

    Governments may respond with antitrust 反垄断 law, or regulate a natural monopoly's price toward $P=MC$ (socially optimal, but may cause a loss) or $P=ATC$ (fair-return, break-even).

    Exam skill: the monopoly graph is a staple – show quantity at $MR=MC$, price up on the demand curve, and shade profit (between $P$ and $ATC$) and deadweight loss (the triangle to the competitive quantity).

    A large utility plant: monopoly and market power mean a single firm can set price above marginal cost
    A large utility plant: monopoly and market power mean a single firm can set price above marginal cost
    Explore · ⁨探索⁩

    A monopoly's cost curves · ⁨独占企業の費用曲線⁩

    A monopoly is the sole seller, so it faces the whole downward demand curve and its marginal revenue lies below price. It produces where MR = MC — less output, higher price than competition. · ⁨独占は唯一の販売者であるため、全体の下向き需要曲線に直面し、その限界収益は価格より低くなります。MR = MCとなる地点で生産を行うため、競争市場と比較して生産量は少なく、価格は高くなります。⁩

    Vocabulary · ⁨語彙⁩ Train · ⁨練習する⁩
    English 日本語
    monopoly/məˈnɒpəli/ 独占
    barriers to entry/ˈbærɪəz tʊ ˈentri/ 参入障壁
    natural monopoly/ˈnætʃərəl məˈnɒpəli/ 自然独占
    deadweight loss/ˈdedweɪt lɒs/ 死荷重を生ずる
    antitrust/ˌæntɪˈtrʌst/ 反トラスト政策
    4.3

    Price Discrimination

    Syllabus · ⁨シラバス⁩
    English

    Enduring Understanding (PRD-3): Even with a common goal of profit-maximization, market structure constrains and influences prices, output, and efficiency.

    Learning Objective PRD-3.B: b. Explain (using graphs where appropriate) equilibrium, firm decision making, consumer surplus, producer surplus, profit (loss), and deadweight loss in imperfectly competitive markets and why prices in imperfectly competitive markets cannot be relied on to coordinate the actions of all possible market participants and can lead to inefficient outputs. c. Calculate (using data from a graph or table as appropriate) areas of consumer surplus, producer surplus, profit (loss), and deadweight loss in imperfectly competitive markets.

    • PRD-3.B.8 A firm with market power can engage in price discrimination to increase its profits or capture additional consumer surplus under certain conditions.
    • PRD-3.B.9 With perfect price discrimination, a monopolist produces the quantity where price equals marginal cost (just as a competitive market would) but extracts all economic surplus associated with its product and eliminates all deadweight loss.
      • Equation: $P = MC$
    日本語

    持続的理解(PRD-3): 利益最大化という共通の目標を持っていても、市場構造は価格、生産量、ならびに効率性を制限し、影響を与える。

    学習目標 PRD-3.B: b. 不完全競争市場における均衡、企業の意思決定、消費者余剰、生産者余剰、利潤(損失)、死荷重について説明せよ(必要な場合は図を用いること)。さらに、不完全競争市場における価格が、ありうるすべての市場参加者の行動を調整するための指標として信頼できず、非効率な生産量を招くことがある理由を説明せよ。c. 不完全競争市場における消費者余剰、生産者余剰、利潤(損失)、死荷重の面積を計算せよ(必要な場合はグラフまたは表のデータを用いること)。

    • PRD-3.B.8 市場権力を持つ企業は、特定の条件下で利潤を増やすか、追加の消費者余剰を奪取するために価格差別を行うことができる。
    • PRD-3.B.9 完全価格差別において、独占者は価格が限界コストに等しくなる量を生産する(完全競争市場と同じ)。しかし、その製品に関連する全経済余剰を奪取し、死荷重を完全に排除する。
      • 式: $P = MC$

    Source: College Board AP Course and Exam Description · ⁨出典: College Board AP コースおよび試験説明書⁩

    English

    Price discrimination 价格歧视 is charging different buyers different prices for the same good. It requires market power, the ability to separate buyers by willingness to pay, and the ability to prevent resale.

    Under perfect (first-degree) price discrimination, the firm charges each buyer their maximum price. The result: the firm produces the efficient quantity (where $P=MC$, no deadweight loss), but converts all consumer surplus into producer surplus (profit). Real examples – student discounts, airline fares, coupons – are partial versions.

    日本語

    Price discrimination 价格歧视 is charging different buyers different prices for the same good. It requires market power, the ability to separate buyers by willingness to pay, and the ability to prevent resale.

    Under perfect (first-degree) price discrimination, the firm charges each buyer their maximum price. The result: the firm produces the efficient quantity (where $P=MC$, no deadweight loss), but converts all consumer surplus into producer surplus (profit). Real examples – student discounts, airline fares, coupons – are partial versions.

    Explore · ⁨探索⁩

    Elasticity and price discrimination · ⁨価格弾力性と価格差別⁩

    Price discrimination charges each group a different price by their elasticity: inelastic buyers (who won't switch) pay more, elastic buyers pay less. Stretch the curve to see why. · ⁨価格差別は、グループ別の価格弾力性に基づいて異なる価格を設定します:需要が不変(切り替わらない)の消費者は高い価格を、需要が可変(切り替わりやすい)の消費者は低い価格を負担します。曲線を伸縮させてその理由を確認してください。⁩

    Vocabulary · ⁨語彙⁩ Train · ⁨練習する⁩
    English 日本語
    Price discrimination/praɪs dɪˌskrɪmɪˈneɪʃn/ 価格差別
    4.4

    Monopolistic Competition

    Syllabus · ⁨シラバス⁩
    English

    Enduring Understanding (PRD-3): Even with a common goal of profit-maximization, market structure constrains and influences prices, output, and efficiency.

    Learning Objective PRD-3.B: b. Explain (using graphs where appropriate) equilibrium, firm decision making, consumer surplus, producer surplus, profit (loss), and deadweight loss in imperfectly competitive markets and why prices in imperfectly competitive markets cannot be relied on to coordinate the actions of all possible market participants and can lead to inefficient outputs. c. Calculate (using data from a graph or table as appropriate) areas of consumer surplus, producer surplus, profit (loss), and deadweight loss in imperfectly competitive markets.

    • PRD-3.B.10 In a market with monopolistic competition, firms producing differentiated products may earn positive, negative, or zero economic profit in the short run. Firms typically use advertising as a means of differentiating their product. Free entry and exit drive profits to zero in the long run. The output level, however, is smaller than the output level needed to minimize average total costs, creating excess capacity. The price is greater than marginal cost, creating allocative inefficiency.
    日本語

    持続的理解(PRD-3): 利益最大化という共通の目標を持っていても、市場構造は価格、生産量、ならびに効率性を制限し、影響を与える。

    学習目標 PRD-3.B: b. 不完全競争市場における均衡、企業の意思決定、消費者余剰、生産者余剰、利潤(損失)、死荷重について説明せよ(必要な場合は図を用いること)。さらに、不完全競争市場における価格が、ありうるすべての市場参加者の行動を調整するための指標として信頼できず、非効率な生産量を招くことがある理由を説明せよ。c. 不完全競争市場における消費者余剰、生産者余剰、利潤(損失)、死荷重の面積を計算せよ(必要な場合はグラフまたは表のデータを用いること)。

    • PRD-3.B.10 独占的競争市場において、差別化製品を生産する企業は、短期間で正の利潤、負の利潤、またはゼロ経済利潤を得ることができる。企業は通常、自社の製品を差別化するための手段として広告を使用する。自由参入と撤退により、長期で利潤はゼロになる。しかし、生産量は平均総コストを最小化するのに必要な生産量より小さいため、過剰容量が生じる。価格は限界コストより高いため、配分非効率が生じる。

    Source: College Board AP Course and Exam Description · ⁨出典: College Board AP コースおよび試験説明書⁩

    English

    Monopolistic competition 垄断竞争 has many firms selling differentiated 差异化 products with easy entry and exit (restaurants, salons, clothing brands). Product differentiation gives each firm a downward-sloping demand curve and thus some price-setting power.

    • Short run: like a monopoly – produce at $MR=MC$, and profit or loss is possible.
    • Long run: easy entry competes away profit, so each firm earns zero economic profit, producing where demand is tangent to ATC.
    • Because it still charges $P>MC$ and does not produce at minimum ATC, it has excess capacity 过剩产能 and is neither allocatively nor productively efficient. The trade-off society accepts is product variety and choice.
    日本語

    Monopolistic competition 垄断竞争 has many firms selling differentiated 差异化 products with easy entry and exit (restaurants, salons, clothing brands). Product differentiation gives each firm a downward-sloping demand curve and thus some price-setting power.

    • Short run: like a monopoly – produce at $MR=MC$, and profit or loss is possible.
    • Long run: easy entry competes away profit, so each firm earns zero economic profit, producing where demand is tangent to ATC.
    • Because it still charges $P>MC$ and does not produce at minimum ATC, it has excess capacity 过剩产能 and is neither allocatively nor productively efficient. The trade-off society accepts is product variety and choice.
    Vocabulary · ⁨語彙⁩ Train · ⁨練習する⁩
    English 日本語
    Monopolistic competition/məˈnɒpəlɪstɪk ˌkɒmpəˈtɪʃn/ 差別化競争
    differentiated/ˌdɪfəˈrenʃɪeɪtɪd/ 差別化されている
    excess capacity/ekˈses kəˈpæsɪti/ 過剰生産能力
    4.5

    Oligopoly and Game Theory

    Syllabus · ⁨シラバス⁩
    English

    Enduring Understanding (PRD-3): Even with a common goal of profit-maximization, market structure constrains and influences prices, output, and efficiency.

    Learning Objective PRD-3.C: a. Define (using tables as appropriate) key terms, strategies, and concepts relating to oligopolies and simple games. b. Explain (using tables as appropriate) strategies and equilibria in simple games and the connections to theoretical behaviors in various oligopoly market and non-market settings. c. Calculate (using tables as appropriate) the incentive sufficient to alter a player's dominant strategy.

    • PRD-3.C.1 An oligopoly is an inefficient market structure with high barriers to entry, where there are few firms acting interdependently.
    • PRD-3.C.2 Firms in an oligopoly have an incentive to collude and form cartels.
    • PRD-3.C.3 A game is a situation in which a number of individuals take actions, and the payoff for each individual depends directly on both the individual's own choice and the choices of others.
    • PRD-3.C.4 A strategy is a complete plan of actions for playing a game; the normal form model of a game shows the payoffs that result from each collection of strategies (one for each player).
    • PRD-3.C.5 A player has a dominant strategy when the payoff to a particular action is always higher independent of the action taken by the other player.
    • PRD-3.C.6 A Nash equilibrium is a condition describing the set of actions in which no player can increase his or her payoff by unilaterally taking another action, given the other players' actions.
      • Exclusion statement: Dominant strategies and Nash equilibrium with more than two players or more than two actions per player, mixed-strategy equilibria, extensive form games, and normal form games with more than two players or more than two actions per player are beyond the scope of the course and the AP Exam.
    • PRD-3.C.7 Oligopolists have difficulty achieving the monopoly outcome for reasons similar to those that prevent players from achieving a cooperative outcome in the Prisoner's Dilemma; nevertheless, prices are generally higher and quantities lower with oligopoly (or duopoly) than with perfect competition.
    日本語

    持続的理解(PRD-3): 利益最大化という共通の目標を持っていても、市場構造は価格、生産量、ならびに効率性を制限し、影響を与える。

    学習目標 PRD-3.C: a. 寡占および単純なゲームに関連する主要な用語、戦略、概念を定義せよ(必要な場合は表を用いること)。b. 単純なゲームにおける戦略と均衡、および様々な寡占市場および非市場設定における理論的な行動との関連について説明せよ(必要な場合は表を用いること)。c. プレイヤーの優位戦略を変更するのに十分なインセンティブを計算せよ(必要な場合は表を用いること)。

    • PRD-3.C.1 寡占は、参入障壁が高く、少数の企業が相互依存して行動する非効率な市場構造である。
    • PRD-3.C.2 寡占の企業は、カルテルを結成して共謀する動機がある。
    • PRD-3.C.3 ゲームとは、複数の個人が行動を取り、各個人の報酬が、その個人の選択だけでなく他の人の選択にも直接依存する状況を指す。
    • PRD-3.C.4 戦略とは、ゲームをプレイするための完全な行動計画である。ゲームの正規形モデルは、各戦略の組み合わせ(各プレイヤーごとに1つ)から生じる報酬を示す。
    • PRD-3.C.5 優位戦略とは、他のプレイヤーの選択に関わらず、特定の行動に対する報酬が常に高い場合に、プレイヤーが持つ戦略である。
    • PRD-3.C.6 ナッシュ均衡とは、他のプレイヤーの行動が与えられたとき、いかなるプレイヤーも単独で別の行動を取ることで自身の報酬を増加させられない状態を記述する条件である。
      • 除外事項: 参加者が2人以上または各参加者の選択肢が2つ以上のナッシュ均衡と優位戦略、混合戦略均衡、完全情報逐次決定ゲーム、および参加者が2人以上または各参加者の選択肢が2つ以上の正規形ゲームは、本課程およびAP試験の対象外です。
    • PRD-3.C.7 オリゴポリストは、囚人のジレンマにおけるプレイヤーが協力的な結果に到達できない理由と同様の理由で独占的な結果を達成することが困難ですが、ServerError、オリゴポリー(または二重寡占)では、完全競争と比較して一般的に価格が高く、生産量が少なくなります。

    Source: College Board AP Course and Exam Description · ⁨出典: College Board AP コースおよび試験説明書⁩

    English

    An oligopoly 寡头垄断 is a market with a few large, interdependent 相互依存 firms (cars, airlines, phones). Because each firm's best move depends on rivals' moves, we analyze them with game theory 博弈论.

    • A payoff matrix 收益矩阵 shows each firm's profit for every combination of choices.
    • A dominant strategy 优势策略 is a firm's best choice regardless of what the rival does.
    • A Nash equilibrium 纳什均衡 is an outcome where no firm can do better by unilaterally changing its choice.
    • The classic prisoners' dilemma 囚徒困境 shows why firms often fail to cooperate: both would gain by colluding 勾结 (acting like a monopoly), but each has an incentive to cheat, so they end up at the competitive-ish, lower-profit outcome. Collusion and cartels 卡特尔 are unstable for the same reason (and usually illegal).

    Worked example. Two firms each choose a High or Low price. Profits (A, B): both High $\to(10,10)$; A Low, B High $\to(14,4)$; A High, B Low $\to(4,14)$; both Low $\to(6,6)$. For A: if B plays High, Low ($14$) beats High ($10$); if B plays Low, Low ($6$) beats High ($4$) – so Low is A's dominant strategy, and by symmetry B's too. The Nash equilibrium is both Low $(6,6)$, worse for both than the cooperative $(10,10)$ – the prisoners' dilemma in action.

    Exam skill: be able to find each firm's dominant strategy and the Nash equilibrium from a 2×2 payoff matrix, and explain why the cooperative outcome is hard to sustain.

    日本語

    An oligopoly 寡头垄断 is a market with a few large, interdependent 相互依存 firms (cars, airlines, phones). Because each firm's best move depends on rivals' moves, we analyze them with game theory 博弈论.

    • A payoff matrix 收益矩阵 shows each firm's profit for every combination of choices.
    • A dominant strategy 优势策略 is a firm's best choice regardless of what the rival does.
    • A Nash equilibrium 纳什均衡 is an outcome where no firm can do better by unilaterally changing its choice.
    • The classic prisoners' dilemma 囚徒困境 shows why firms often fail to cooperate: both would gain by colluding 勾结 (acting like a monopoly), but each has an incentive to cheat, so they end up at the competitive-ish, lower-profit outcome. Collusion and cartels 卡特尔 are unstable for the same reason (and usually illegal).

    Worked example. Two firms each choose a High or Low price. Profits (A, B): both High $\to(10,10)$; A Low, B High $\to(14,4)$; A High, B Low $\to(4,14)$; both Low $\to(6,6)$. For A: if B plays High, Low ($14$) beats High ($10$); if B plays Low, Low ($6$) beats High ($4$) – so Low is A's dominant strategy, and by symmetry B's too. The Nash equilibrium is both Low $(6,6)$, worse for both than the cooperative $(10,10)$ – the prisoners' dilemma in action.

    A prisoners' dilemma: each firm's dominant strategy is Low, giving the Nash equilibrium
    A prisoners' dilemma: each firm's dominant strategy is Low, giving the Nash equilibrium

    Exam skill: be able to find each firm's dominant strategy and the Nash equilibrium from a 2×2 payoff matrix, and explain why the cooperative outcome is hard to sustain.

    Vocabulary · ⁨語彙⁩ Train · ⁨練習する⁩
    English 日本語
    oligopoly/ˌɒlɪˈɡɒpəli/ 寡占
    interdependent/ˌɪntədɪˈpendənt/ 相互依存
    game theory/ɡeɪm ˈθɪəri/ ゲーム理論
    payoff matrix/ˈpeɪɒf ˈmeɪtrɪks/ ペイオフ行列
    dominant strategy/ˈdɒmɪnənt ˈstrætədʒi/ 支配戦略
    Nash equilibrium/næʃ ˌiːkwɪˈlɪbrɪəm/ ナッシュ均衡
    prisoners' dilemma/ˈprɪzənəz daɪˈlemə/ 囚人のジレンマ
    colluding/kəˈluːdɪŋ/ 共謀
    cartels/kɑːˈtelz/ カルテル
    4.5

    Exam tips

    • A firm with market power faces a downward-sloping demand, so MR < P (MR has twice the slope).
    • A monopoly produces where MR = MC, then charges the price up on the demand curve; it makes deadweight loss because $P > MC$.
    • Under perfect price discrimination the firm produces the efficient quantity but captures all consumer surplus.
    • Monopolistic competition earns zero long-run profit with excess capacity (product variety is the trade-off).
    • In an oligopoly find the dominant strategy and Nash equilibrium from the payoff matrix; the cooperative outcome is hard to sustain.
  • 5

    Factor Markets · ⁨要素市場⁩

    Watch lesson · ⁨レッスンを視聴⁩
    5.1

    Introduction to Factor Markets · ⁨Factor Markets(要素市場)への導入⁩

    Syllabus · ⁨シラバス⁩
    English

    Enduring Understanding (PRD-4): Factor prices provide incentives and convey information to firms and factors of production.

    Learning Objective PRD-4.A: a. Define (using graphs where appropriate) key terms and concepts relating to factor markets. b. Explain (using graphs where appropriate) the relationship between factors of production, firms, and factor prices. c. Calculate (using data from a graph or table where appropriate) the marginal revenue product and marginal resource cost.

    • PRD-4.A.1 Factors of production (labor, capital, and land) respond to factor prices (wages, interest, and rent), and employers' (firms') decision to hire is based on the productivity of the factors, output price, and cost of the factor.
    • PRD-4.A.2 The quantity of labor demanded is negatively related to the wage rate, while the quantity of labor supplied is positively related to the wage rate in a given labor market, other things constant.
    日本語

    持続的認識(PRD-4): 要素価格は企業および生産要素に対してインセンティブを提供し、情報を伝達します。

    学習目標 PRD-4.A: a. 要素市場に関連する主要な用語および概念を定義する(適切な場合、グラフを使用して)。 b. 生産要素、企業、要素価格の関係性を説明する(適切な場合、グラフを使用して)。 c. 限界収益産出量および限界資源コストを計算する(適切な場合、グラフまたは表のデータを使用して)。

    • PRD-4.A.1 生産要素(労働、資本、土地)は要素価格(賃金、利子、地代)に応じて反応し、雇用主(企業)の雇い入れ決定は、生産要素の生産性、輸出価格、要素コストに基づきます。
    • PRD-4.A.2 特定の労働市場において、他の条件は一定であるとして、労働需求量は賃金率と負の相関関係にあり、労働供給量は賃金率と正の相関関係にあります。

    Source: College Board AP Course and Exam Description · ⁨出典: College Board AP コースおよび試験説明書⁩

    English

    A factor market 要素市场 is where firms buy the factors of production – labor, land, capital. The roles reverse: firms demand and households supply. The most-tested factor is labor.

    Factor demand is a derived demand 派生需求 – firms want labor not for itself but for the output (and revenue) it produces. So the demand for workers depends on the demand for the product they make.

    日本語
    A garment factory: factor markets determine wages for labour and other inputs
    A garment factory: factor markets determine wages for labour and other inputs

    Factor market(要素市場)とは、企業がfactors of production(生産要素)——労働、土地、資本——を購入する場所である。役割は逆転しており、**firms(企業)が demand(需要)**し、**households(世帯)が supply(供給)する。最も頻出する要素はlabor(労働)**である。

    A competitive labour market sets the wage where labour demand meets labour supply
    A competitive labour market sets the wage where labour demand meets labour supply

    要素需要は**derived demand(派生需要)**であり、企業は労働そのものではなく、それが生み出す output(生産物)および revenue(収益)のために労働を欲する。したがって、労働者の需要は、その労働者が作る製品の需要に依存する。

    Explore · ⁨探索⁩

    A labour (factor) market · ⁨労働(要素)市場⁩

    In a factor market firms demand labour and households supply it; the wage settles where demand meets supply. Shift either curve and watch the wage and employment move. · ⁨要素市場において、企業は労働力を需要し、家計はそれを供給します。賃金は需給が一致する地点で決定されます。どちらかの曲線がシフトすれば、賃金と雇用数がどのように動くか观察できます。⁩

    Vocabulary · ⁨語彙⁩ Train · ⁨練習する⁩
    English 日本語
    factor market/ˈfæktə ˈmɑːkɪt/ 要素市場
    derived demand/dɪˈraɪvd dɪˈmænd/ 派生需要
    5.2

    Changes in Factor Demand and Factor Supply · ⁨Changes in Factor Demand and Factor Supply(要素需要と要素供給の変化)⁩

    Syllabus · ⁨シラバス⁩
    English

    Enduring Understanding (PRD-4): Factor prices provide incentives and convey information to firms and factors of production.

    Learning Objective PRD-4.B: Explain (using graphs where appropriate) firms' and factors' responses to changes in incentives and constraints.

    • PRD-4.B.1 Changes in the determinants of labor demand, such as the output price and the productivity of the worker, cause the labor demand curve to shift.
    • PRD-4.B.2 Changes in the determinants of labor supply (such as immigration, education, working conditions, age distribution, availability of alternative options, preferences for leisure, and cultural expectations) cause the labor supply curve to shift.
    日本語

    持続的認識(PRD-4): 要素価格は企業および生産要素に対してインセンティブを提供し、情報を伝達します。

    学習目標 PRD-4.B: 企業および生産要素がインセンティブおよび制約の変化に対してどのように反応するかを説明する(適切な場合、グラフを使用して)。

    • PRD-4.B.1 輸出価格や労働者の生産性といった労働需要の決定要因の変化は、労働需要曲線をシフトさせます。
    • PRD-4.B.2 移民、教育、労働環境、年齢構成、代替案の可用性、余暇に対する嗜好、文化的期待といった労働供給の決定要因の変化は、労働供給曲線をシフトさせます。

    Source: College Board AP Course and Exam Description · ⁨出典: College Board AP コースおよび試験説明書⁩

    English

    Labor demand shifts when:

    • the product price or product demand changes (more valuable output $\Rightarrow$ more labor demanded),
    • worker productivity changes (better training or capital),
    • the price of other inputs changes (a substitute input like machines, or a complement).

    Labor supply shifts with the number of qualified workers, immigration, workers' preferences (wages needed to attract them), and the wages available in other jobs. The market wage is set where labor demand meets labor supply.

    日本語

    **Labor demand(労働需要)**がシフトするのは以下の場合である:

    • **product price(製品価格)**や product demand(製品需要)が変わる場合(より価値の高い生産物 $\Rightarrow$ はより多くの労働者を demand(需要)する)、
    • **worker productivity(労働者の生産性)**が変わる場合(より良い training(研修)や capital(資本)による改善など)、
    • **price of other inputs(他の投入物の価格)**が変わる場合(substrate input(代替投入物)である機械など、または complement(補完投入物)など)。

    **Labor supply(労働供給)は、number of qualified workers(資格を持つ労働者の数)、immigration(移民)、workers' preferences(労働者の選好=彼らを惹きつけるために必要な賃金)、そしてother jobs(他の職業)**での利用可能な賃金によってシフトする。市場賃金は労働需要と労働供給が一致する地点で決定される。

    5.3

    Profit-Maximizing Behavior in Perfectly Competitive Factor Markets · ⁨Profit-Maximizing Behavior in Perfectly Competitive Factor Markets(完全競争要素市場における利益最大化行動)⁩

    Syllabus · ⁨シラバス⁩
    Enduring UnderstandingLearning ObjectiveEssential Knowledge

    PRD-4
    Factor prices provide incentives and convey information to firms and factors of production.

    PRD-4.C
    a. Define (using graphs as appropriate) the characteristics of perfectly competitive factor markets.
    b. Explain (using graphs where appropriate) the profit-maximizing behavior of firms buying labor (with other inputs fixed) in perfectly competitive markets.
    c. Calculate (using data from a graph or table where appropriate) measures representing the profit-maximizing behavior of firms buying labor (with other inputs fixed) in perfectly competitive markets.

    • PRD-4.C.1 In a perfectly competitive labor market, the wage is set by the market and each firm hires the quantity of workers, where the marginal factor (resource) cost (wage) equals the marginal revenue product of labor. A typical firm may be a perfect competitor in the labor market even if it is an imperfect competitor in its output markets.
    • PRD-4.C.2 A typical firm hires labor in a perfectly competitive labor market as long as the marginal revenue product of labor is greater than the market wage.
    • PRD-4.C.3 To minimize costs or maximize profits, firms allocate inputs such that the last dollar spent on each input yields the same amount of marginal product.

    Source: College Board AP Course and Exam Description · ⁨出典: College Board AP コースおよび試験説明書⁩

    English

    A firm decides how many workers to hire with the same marginal logic as everything else – compare the marginal benefit and marginal cost of one more worker.

    • The marginal benefit of a worker is the marginal revenue product 边际收益产品 (MRP): the extra revenue from one more worker, $MRP = MP \times$ product price (in a competitive product market, where $P=MR$). MRP falls as more workers are hired, because of diminishing marginal product.
    • The marginal cost of a worker is the wage (in a competitive labor market the firm is a wage taker, so marginal factor cost $=$ the wage).
    • Hiring rule: hire workers up to where $MRP = \text{wage}$ (more generally, $MRP = MFC$). The MRP curve is the firm's labor demand curve.

    Worked example. A worker's marginal product is $8$ units and the firm sells each in a competitive market for $\$5$, so $MRP=8\times\$5=\$40$. If the wage is $\$30$, the firm hires this worker because $MRP>\text{wage}$. As more workers join, diminishing marginal product pulls MRP down; the firm keeps hiring until a worker whose $MP=6$ gives $MRP=6\times\$5=\$30$, exactly the wage – the profit-maximizing stopping point.

    To choose the least-cost combination of two inputs, set the MP-per-dollar equal across inputs: $\dfrac{MP_L}{P_L}=\dfrac{MP_K}{P_K}$ – the same equal-bang-per-buck rule as consumer choice.

    Exam skill: compute MRP from a table (marginal product $\times$ price) and find how many workers to hire at a given wage – a common free-response task.

    日本語

    企業が雇う労働者数を決定する際にも、他のすべての決定と同様に**marginal logic(限界論理)**を用いる——追加の労働者の marginal benefit(限界便益)と marginal cost(限界費用)を比較する。

    • 労働者の marginal benefit(限界便益)は marginal revenue product(限界収益産品)(MRP)である:追加の労働者1人あたり extra revenue(追加収益)であり、$MRP = MP \times$ product price(製品価格)(完全競争製品市場において $P=MR$)。追加の労働者を雇用するにつれて、**diminishing marginal product(限界生産性の逓減)**により MRP は低下する。
    • 労働者の marginal cost(限界費用)は **wage(賃金)**である(完全競争労働市場において企業は wage **taker(賃金の受取手)**であるため、marginal factor cost(限界要素費用)$=$ 賃金となる)。
    • Hiring rule(雇用ルール): $MRP = \text{wage}$ となるまで労働者を hire(雇用)する(より一般的には $MRP = MFC$)。MRP 曲線は企業の labor **demand(労働需要)**曲線である。

    Worked example(演習例)。 労働者の marginal product(限界生産物)が $8$ 単位であり、企業がそれを完全競争市場で $\$5$, so $MRP=8\times\$5=\$40$. If the wage is $\$30$ で販売する場合、企業はこの労働者を hire(雇用)する。なぜなら $MRP>\text{wage}$ だからである。より多くの労働者が加わるにつれて、diminishing marginal product(限界生産性の逓減)が MRP を押し下げ、企業は继续 hiring(雇用を続ける)——undefined worker whose $MP=6$ が $MRP=6\times\$5=\$30$ となり、ちょうど wage(賃金)となる——profit-maximizing stopping point(利益最大化の停止点)まで。

    2つの投入物の**least-cost combination(最低コスト組合せ)**を選ぶ際、投入物間で **MP-per-dollar equal(ドルあたりの限界生産物が等しい)**ように set(設定)する:$\dfrac{MP_L}{P_L}=\dfrac{MP_K}{P_K}$ ——これは consumer choice(消費者の選択)と同じ equal-bang-per-buck(おつりのない価値)ルールである。

    Exam skill: table(表)から MRP を compute(計算)(marginal product(限界生産物)$\times$ price(価格))し、与えられた wage(賃金)で何人の労働者を hire(雇用)すべきかを見つける——よくある free-response task(自由記述問題)である。

    A car assembly line: firms hire labour until the marginal revenue product equals the wage
    A car assembly line: firms hire labour until the marginal revenue product equals the wage
    Vocabulary · ⁨語彙⁩ Train · ⁨練習する⁩
    English 日本語
    marginal revenue product/ˈmɑːdʒɪnl ˈrevənjuː ˈprɒdʌkt/ 限界収益産出量
    marginal factor cost/ˈmɑːdʒɪnl ˈfæktə kɒst/ 限界要素コスト
    5.4

    Monopsonistic Markets · ⁨Monopsonistic Markets( monopsony 市場)⁩

    Syllabus · ⁨シラバス⁩
    English

    Enduring Understanding (PRD-4): Factor prices provide incentives and convey information to firms and factors of production.

    Learning Objective PRD-4.D: a. Define (using graphs as appropriate) the characteristics of monopsonistic markets. b. Explain (using graphs where appropriate) the profit-maximizing behavior of firms buying labor (with other inputs fixed) in monopsonistic markets. c. Calculate (using data from a graph or table where appropriate) measures representing the profit-maximizing behavior of firms buying labor (with other inputs fixed) in monopsonistic markets.

    • PRD-4.D.1 In a monopsonistic labor market, a typical firm hires additional labor as long as the marginal revenue product is greater than the marginal factor (resource) cost (the wage of a new unit of labor plus the wage increase given to all existing labor).
    • PRD-4.D.2 When a typical firm hires additional workers in a monopsonistic labor market, the marginal factor (resource) cost is greater than the supply price of labor.
    日本語

    持続的認識(PRD-4): 要素価格は企業および生産要素に対してインセンティブを提供し、情報を伝達します。

    学習目標 PRD-4.D: a. 買手独占市場の特徴を定義する(適切な場合、グラフを使用して)。 b. 買手独占市場において、他の投入財が固定された状態で労働を購入する企業の利益最大化行動を説明する(適切な場合、グラフを使用して)。 c. 買手独占市場において、他の投入財が固定された状態で労働を購入する企業の利益最大化行動を表す指標を計算する(適切な場合、グラフまたは表のデータを使用して)。

    • PRD-4.D.1 買手独占労働市場において、典型的な企業は、限界収益産出量が限界要素(資源)コスト(新規単位の労働の賃金および既存全労働者への賃金増額を含む)よりも大きい限り、追加の労働力を雇い入れます。
    • PRD-4.D.2 典型的な企業が買手独占労働市場で追加の労働者を雇い入れるとき、限界要素(資源)コストは労働の供給価格よりも高くなります。

    Source: College Board AP Course and Exam Description · ⁨出典: College Board AP コースおよび試験説明書⁩

    English

    A monopsony 买方垄断 is a market with a single buyer of a factor – for example, the only large employer in a town.

    • Because it is the whole market, the monopsonist faces an upward-sloping labor supply curve: to hire more workers it must raise the wage for everyone.
    • So the marginal factor cost 边际要素成本 (MFC) is above the wage (like $MR for a monopoly, in reverse), and the MFC curve lies above the supply curve.
    • The monopsonist hires where $MRP = MFC$, then pays the lower wage the supply curve allows at that quantity.
    • Result: compared with a competitive labor market, a monopsony hires fewer workers at a lower wage – the mirror image of monopoly.

    Exam skill: draw the monopsony graph (supply, MFC above it, MRP as demand), mark quantity at $MRP=MFC$ and the wage down on the supply curve, and contrast it with the competitive wage and quantity.

    日本語

    **Monopsony(単一買手)**とは、factor(要素)に対して single buyer(単一の買い手)のみが存在する市場であり、例えば town(町)内での唯一の large employer(大規模雇用主)などが該当する。

    • 它就是整个市场(it is the whole market)であるため、monopsonist(単一買手)は upward-sloping labor supply(右上がりの労働供給) facing する:より多くの労働者を hire(雇用)するには、everyone(全員)の wage(賃金)を raise(引き上げる)必要がある。
    • つまり、限界要素コスト(MFC)は賃金より高い(独占の逆で$MRのような場合)、MFC曲線は供給曲線の上側に位置する。
    • モノポソニーは$MRP = MFC$で労働を雇用し、その数量に対応する供給曲線上の低い賃金を支払う。
    • 結果として、完全競争労働市場と比較して、モノポソニーは少ない労働者を低い賃金で雇用する – これは独占の鏡像である。
    モノポソニーはMFC = MRPとなる点で雇用し、完全競争市場よりも低い賃金を支払う
    モノポソニーはMFC = MRPとなる点で雇用し、完全競争市場よりも低い賃金を支払う

    試験スキル: モノポソニーのグラフを描く(供給曲線、その上にあるMFC、需要としてのMRP)。$MRP=MFC$で数量を标记し、供給曲線上に賃金を下げてプロットし、完全競争における賃金と数量との対比を行う。

    Vocabulary · ⁨語彙⁩ Train · ⁨練習する⁩
    English 日本語
    monopsony/ˈmɒnəʊpsəni/ 単一買い手
    5.4

    Exam tips · ⁨試験対策⁩

    English
    • Factor demand is derived demand; hire labour up to where MRP = wage (MRP = marginal product × price).
    • MRP falls as more workers are hired (diminishing marginal product).
    • For least-cost input use, equalise the marginal product per dollar across inputs.
    • A monopsony faces an upward supply, so its marginal factor cost is above the wage; it hires fewer workers at a lower wage.
    • Draw the monopsony graph (supply, MFC above it, MRP as demand) and contrast with the competitive outcome.
    日本語
    • 要素需要は派生需要であり、MRP = 賃金(MRP = 限界生産量 × 価格)となるまで労働を雇う。
    • 労働者を増やすにつれてMRPは減少する(限界生産量の逓減)。
    • 最小費用投入財の選択には、投入財間でドルあたりの限界生産量を等しくする。
    • モノポソニーは上昇する供給に直面するため、その限界要素コストは賃金より高い。少ない労働者を低い賃金で雇用する。
    • モノポソニーのグラフを描く(供給曲線、その上にあるMFC、需要としてのMRP)と、完全競争の結果との対比を行う。
  • 6

    Market Failure and the Role of Government · ⁨市場の失敗と政府の役割⁩

    Watch lesson · ⁨レッスンを視聴⁩
    6.1

    Socially Efficient and Inefficient Market Outcomes · ⁨社会的に効率的かつ非効率な市場 outcomes⁩

    Syllabus · ⁨シラバス⁩
    English

    Enduring Understanding (POL-2): Perfectly competitive markets allocate resources efficiently, but imperfect competition often results in market inefficiencies.

    Learning Objective POL-2.A: a. Define social efficiency. b. Explain (using graphs where appropriate) why resource allocation in perfectly competitive markets is socially efficient.

    • POL-2.A.1 The optimal quantity of a good occurs where the marginal benefit of consuming the last unit equals the marginal cost of producing that last unit, thus maximizing total economic surplus.
    • POL-2.A.2 The market equilibrium quantity is equal to the socially optimal quantity only when all social benefits and costs are internalized by individuals in the market. Total economic surplus is maximized at that quantity. [See also PRD-3 and POL-3.]

    Learning Objective POL-2.B: Explain (using graphs where appropriate) how private incentives can lead to actions by rational agents that are socially undesirable (inefficient) market outcomes.

    • POL-2.B.1 Rational agents can pursue private actions to exploit or exercise market characteristics known as market power.
    • POL-2.B.2 Rational agents make optimal decisions by equating private marginal benefits and private marginal costs that can result in market inefficiencies.
    • POL-2.B.3 Policymakers use cost-benefit analysis to evaluate different actions to reduce or eliminate market inefficiencies.
    • POL-2.B.4 Market inefficiencies can be eliminated by designing policies that equate marginal social benefit with marginal social cost.

    Learning Objective POL-2.C: a. Explain equilibrium allocations in imperfect markets relative to efficient allocations (using graphs where appropriate) and why these markets are inefficient. b. Calculate (using graphs where appropriate) the deadweight loss resulting from the production of a non-efficient quantity.

    • POL-2.C.1 Equilibrium allocations can deviate from efficient allocations due to situations such as monopoly; oligopoly; monopolistic competition; negative and positive externalities in production or consumption; asymmetric information; and insufficient production of public goods.
    • POL-2.C.2 Producing any non-efficient quantity results in deadweight loss.
    日本語

    持続的認識(POL-2): 完全競争市場は資源を効率的に配分しますが、不完全競争はしばしば市場の非効率性を招きます。

    学習目標 POL-2.A: a. 社会的効率を定義する。 b. 完全競争市場における資源配分がなぜ社会的に効率的なのかを説明する(適切な場合、グラフを使用して)。

    • POL-2.A.1 最適数量とは、最終単位の消費による限界便益がその最終単位の生産による限界コストと等しくなる点であり、これにより総経済余剰が最大化されます。
    • POL-2.A.2 市場均衡数量が社会的に最適な数量と一致するのは、すべての社会的便益とコストが市場内の個人によって内部化される場合のみです。その数量において総経済余剰は最大化されます。[PRD-3 および POL-3 も参照]。

    学習目標 POL-2.B: private incentives が合理的なエージェントによる社会的に望ましくない(非効率的な)市場 outcomes を引き起こすことを説明する(適切な場合、グラフを使用して)。

    • POL-2.B.1 合理的なエージェントは、市場力と呼ばれる市場特徴を利用したり行使したりするためにprivate actionsを追求することがあります。
    • POL-2.B.2 合理的エージェントは、私的限界便益と私的限界費用が等しくなることで最適意思決定を行いますが、これにより市場の非効率性が生じることがあります。
    • POL-2.B.3 政策立案者は、市場の非効率性を低減または排除するための異なる行動を評価するために、コストベネフィット分析を用います。
    • POL-2.B.4 社会限界便益と社会限界費用が等しくなるように政策を設計することで、市場の非効率性は排除されます。

    学習目標 POL-2.C: a. 不完全市場における均衡配分が効率的な配分に対してどのように異なるか(適切な場合、グラフを使用して)説明し、なぜこれらの市場が非効率であるかを説明する。 b. 非効率な数量の生産によって生じる無谓損失を計算する(適切な場合、グラフを使用して)。

    • POL-2.C.1 独占、寡占、差別化競争、生産または消費における負の外部性および正の外部性、非対称情報、公共財の不足生産などの状況により、均衡配分は効率的な配分から逸脱することがある。
    • POL-2.C.2 非効率な数量のいずれかの生産は、無谓損失を生じる。

    Source: College Board AP Course and Exam Description · ⁨出典: College Board AP コースおよび試験説明書⁩

    English

    A market outcome is socially efficient 社会有效率 when it maximizes total surplus – when the marginal social benefit equals the marginal social cost of the last unit. Perfect competition reaches this on its own. But sometimes markets fail to, producing too much or too little. This is market failure 市场失灵, and it is the main economic justification for government action.

    日本語

    市場 outcome が社会的に効率的であるとは、総余剰を最大化しているときであり、最終単位の限界社会便益が限界社会コストに等しいときである。完全競争はこれに独自に到達する。しかし、時折市場はこの状態に到達できず、過剰または不足を生むことがある。これを市場の失敗といい、政府介入の主な経済的根拠となる。

    生産的効率性は最低コスト;配分的効率性は人々の望むものを作ること
    生産的効率性は最低コスト;配分的効率性は人々の望むものを作ること
    6.2

    Externalities · ⁨外部不利益・正の外部性⁩

    Syllabus · ⁨シラバス⁩
    English

    Enduring Understanding (POL-3): Private incentives can fail to account for all socially relevant considerations.

    Learning Objective POL-3.A: a. Define externalities. b. Explain (using graphs where appropriate) how in the presence of externalities, private markets do not take into consideration social costs or social benefits.

    • POL-3.A.1 The socially optimal quantity of a good occurs where the marginal social benefit of consuming the last unit equals the marginal social cost of producing that last unit, thus maximizing total economic surplus.
    • POL-3.A.2 Externalities are either positive or negative and arise from lack of well-defined property rights and/or high transaction costs.
    • POL-3.A.3 In the presence of externalities, rational agents respond to private costs and benefits and not to external costs and benefits.
    • POL-3.A.4 Rational agents have the incentive to free ride when a good is non-excludable.

    Learning Objective POL-3.B: Explain (using graphs where appropriate) how public policies address positive or negative externalities.

    • POL-3.B.1 Policies that address positive or negative externalities include taxes/subsidies, environmental regulation, public provision, the assignment of property rights, and the reassignment of property rights through private transactions.
    日本語

    持続的な理解 (POL-3): 私的なインセンティブは、社会的に重要なすべての考慮事項を十分に反映できないことがある。

    学習目標 POL-3.A: a. 外部性を定義する。 b. 外部性が存在する場合、私的市場が社会費用や社会便益を考慮しない理由を説明する(適切な場合、グラフを使用して)。

    • POL-3.A.1 財の社会的に最適な数量は、最終単位の消費における社会限界便益がその最終単位の生産における社会限界費用と等しい地点で達成され、これにより経済的正味利益が最大化される。
    • POL-3.A.2 外部性は、正の外部性と負の外部性の両方があり、明確に定義された財産権の欠如および/または高い取引コストによって生じる。
    • POL-3.A.3 外部性が存在する場合、合理的なエージェントは、外部費用や外部便益ではなく、私的費用と私的便益に応答する。
    • POL-3.A.4 財が排他的でない場合、合理的なエージェントにはフリーライダーを行うインセンティブがある。

    学習目標 POL-3.B: 公共政策が正の外部性または負の外部性をどう解決するかを説明する(適切な場合、グラフを使用して)。

    • POL-3.B.1 正の外部性または負の外部性を処理する政策には、税・補助金、環境規制、公的供給、財産権の割当て、および私的取引による財産権の再割当てが含まれる。

    Source: College Board AP Course and Exam Description · ⁨出典: College Board AP コースおよび試験説明書⁩

    English
    Negative externalities

    An externality 外部性 is a cost or benefit that falls on a third party not involved in the transaction – so the private decision-makers ignore it.

    • A negative externality 负外部性 (pollution) means marginal social cost > marginal private cost. The market over-produces; the deadweight loss is a triangle. Fixes: a Pigovian tax 庇古税 or regulation to make producers "internalize" the cost (shifting private cost up to social cost).
    • A positive externality 正外部性 (vaccination, education) means marginal social benefit > marginal private benefit. The market under-produces. Fixes: a subsidy to consumers or producers.
    • Coase theorem 科斯定理: if property rights are clear and bargaining is costless, private parties can solve an externality themselves – but that is rare with many people involved.

    Worked example. A factory's private marginal cost of a chemical is $\$8$ per unit, but each unit also dumps $\$3$ of pollution on neighbors, so the marginal social cost is $\$11$. Ignoring the $\$3$, the market over-produces. A Pigovian tax of exactly $\$3$ per unit raises the firm's private cost to $\$11$ – now equal to the social cost – so the firm cuts output to the efficient quantity and the externality is "internalized."

    Exam skill: identify whether an externality is positive or negative, show on a graph that private and social curves diverge, mark the deadweight loss, and name the correcting tax or subsidy.

    日本語
    たばこ:外部不利益により私的市場が社会的に効率的なoutcomeに到達しない可能性がある
    たばこ:外部不利益により私的市場が社会的に効率的なoutcomeに到達しない可能性がある
    負の外部性

    外部不利益(または外部性)とは、取引に関与していない第三者に負担や便益が及ぶことであり、したがって私的な意思決定者はそれを無視する。

    負の外部性:市場は過剰生産を行い、福祉損失をもたらす
    負の外部性:市場は過剰生産を行い、福祉損失をもたらす
    • 負の外部性(汚染)とは限界社会コスト > 限界私的コストを意味する。市場は過剰生産を行うため、無谓損失は三角形となる。解決策:ピゴヴィア税や規制によって生産者にコストを「内部化」させ(私的コストを社会的コストまで上方へシフトさせる)。
    • 正の外部性(ワクチン、教育)とは限界社会便益 > 限界私的便益を意味する。市場は過少生産を行う。解決策:消費者または生産者に対する補助金。
    • コアーズ定理:財産権が明確で交渉にコストがかからない場合、私的当事者自身が外部性を解決できる – しかし、多くの人が関わるケースではこれは稀である。
    車の列が詰まり、立ち往生している街路
    混雑は負の外部性である:各ドライバーが他のすべてのドライバーに価格で回収されないコストを負担している

    ** worked example.** 工場の化学物質の私的限界コストは$\$8$ per unit, but each unit also dumps $\$3$の近隣への汚染を含み、したがって限界社会コストは$\$11$. Ignoring the $\$3$であり、市場は過剰生産を行う。ピゴヴィア税を正確に$\$3$ per unit raises the firm's private cost to $\$11$課す** – 今や社会的コストと等しくなる – ことで、企業は生産量を効率的な数量まで削減し、外部性は「内部化」される。

    試験スキル: 外部性が正か負かを特定し、グラフ上で私的曲線と社会的曲線が分かれることを示し、無谓損失を标记し、是正税または補助金の名称を挙げる。

    Industrial pollution: a negative externality where social cost exceeds private cost
    産業廃棄物による汚染:社会的コストが私的コストを上回る外部不経済
    Explore · ⁨探索⁩

    A market with an externality · ⁨外部不経済が存在する市場⁩

    An externality makes private cost differ from social cost, so the free-market quantity is inefficient. See the deadweight loss and how a tax or subsidy corrects it. · ⁨外部不経済により private cost が social cost と異なり、自由市場での生産量は非効率となる。死の損失と、税や補助金による修正方法を確認せよ。⁩

    Vocabulary · ⁨語彙⁩ Train · ⁨練習する⁩
    English 日本語
    socially efficient/ˈsəʊʃəli ɪˈfɪʃənt/ 社会的に効率的
    market failure/ˈmɑːkɪt ˈfeɪlɪə/ 市場の失敗
    externality/ekˈstɜːnælɪti/ 外部不経済
    negative externality/ˈneɡətɪv ekˈstɜːnælɪti/ 負の外部不経済
    Pigovian tax/pɪˈɡəʊvɪən tæks/ ピグヴィアン税
    positive externality/ˈpɒzɪtɪv ekˈstɜːnælɪti/ 正の外部不経済
    Coase theorem/kəʊs ˈθɪərəm/ コーズ定理
    rivalry/ˈraɪvəlri/ 競合
    excludability/eksˌkluːdəˈbɪlɪti/ 排他性
    private good/ˈpraɪvət ɡʊd/ 私的財
    public good/ˈpʌblɪk ɡʊd/ 公共財
    free-ride/friː raɪd/ フリーライダー
    Common resources/ˈkɒmən rɪˈzɔːsɪz/ 共有資源
    tragedy of the commons/ˈtrædʒədi ɒvðə ˈkɒmənz/ 共用地の悲劇
    Antitrust laws/ˌæntɪˈtrʌst lɔːz/ 独占禁止法
    per-unit tax/pɜː ˈjuːnɪt tæks/ 単位税
    lump-sum tax/lʌmp sʌm tæks/ 固定税
    lump-sum subsidy/lʌmp sʌm ˈsʌbsɪdi/ 固定補助金
    income distribution/ˈɪŋkʌm ˌdɪstrɪˈbjuːʃn/ 所得分配
    6.3

    Public and Private Goods · ⁨公共財と私的財⁩

    Syllabus · ⁨シラバス⁩
    English

    Enduring Understanding (POL-3): Private incentives can fail to account for all socially relevant considerations.

    Learning Objective POL-3.C: a. Define whether goods are rival and/or excludable. b. Explain how the nature of rival and/or excludable goods influences the behavior of individuals and groups.

    • POL-3.C.1 Private goods are rival and excludable, and public goods are non-rival and non-excludable.
    • POL-3.C.2 Due to the free rider problem, private individuals usually lack the incentive to produce public goods, leaving government as the only producer.
    • POL-3.C.3 Governments sometimes choose to produce private goods, such as educational services, and to allow free access to them.
    • POL-3.C.4 Some natural resources are, by their nature, non-excludable and rival and therefore open access. Private individuals inefficiently overconsume such resources.
    日本語

    持続的な理解 (POL-3): 私的なインセンティブは、社会的に重要なすべての考慮事項を十分に反映できないことがある。

    学習目標 POL-3.C: a. 財が競合的であり、かつ/または排他的かどうかを定義する。 b. 競合的および/または排他的な財の性質が個人や集団の行動にどのような影響を与えるかを説明する。

    • POL-3.C.1 私人財は競合的かつ排他的であり、公共財は非競合的かつ非排他的である。
    • POL-3.C.2 フリーライダー問題のため、私人は通常、公共財を生産するインセンティブを持たず、政府だけが唯一の生産者となる。
    • POL-3.C.3 政府は sometimes、教育サービスのような私人財を生産することを抉择し、それらへの無料アクセスを認める。
    • POL-3.C.4 一部の天然資源は、その性質上、非排他的で競合的であるため、自由アクセス型である。私人はこれらの資源を非効率に過剰に消費する。

    Source: College Board AP Course and Exam Description · ⁨出典: College Board AP コースおよび試験説明書⁩

    English

    Goods differ along two traits: rivalry 竞争性 (does one person's use reduce another's?) and excludability 排他性 (can non-payers be kept out?).

    • A private good 私人物品 is rival and excludable (a sandwich) – markets handle these well.
    • A public good 公共物品 is non-rival and non-excludable (national defense, a lighthouse). Because non-payers cannot be excluded, people free-ride 搭便车 – enjoy it without paying – so markets under-provide it, and government usually supplies it.
    • Common resources 公共资源 are rival but non-excludable (ocean fish); over-use ruins them – the tragedy of the commons 公地悲剧.
    日本語

    財は2つの特性に基づいて分類される:競合性(一人の使用が他者の使用を減少させるか?)と排除可能性(未納者を取り除けるか?)。

    競合性と排除可能性に基づく財の分類
    競合性と排除可能性に基づく財の分類
    • 私的財は競合的かつ排除可能である(サンドイッチなど)– これらは市場が適切に扱う。
    • 公共財は非競合的かつ非排除的である(国防、灯台)。未納者を排除できないため、人々はフリーライダーとなり(支払いせずに享受する)、市場はこれを過少供給するため、通常は政府が提供する。
    • 共有資源は競合的だが非排除的である(海洋魚類);過度な使用により破綻する – コモンズの悲劇。
    6.4

    The Effects of Government Intervention in Different Market Structures · ⁨異なる市場構造における政府介入の影響⁩

    Syllabus · ⁨シラバス⁩
    English

    Enduring Understanding (POL-4): In imperfect markets, well-designed government policy can reduce waste.

    Learning Objective POL-4.A: a. Define government policy interventions in imperfect markets. b. Explain (using graphs where appropriate) how government policies can alter market outcomes in perfectly and imperfectly competitive markets. c. Calculate (using data from a graph or table as appropriate) changes in market outcomes resulting from government policies in perfectly competitive and imperfectly competitive markets.

    • POL-4.A.1 Per-unit taxes and subsidies affect the total price consumers pay, net price firms receive, equilibrium quantity, consumer and producer surpluses, deadweight loss, and government revenue or cost. The impact of change depends on the price elasticity of demand and supply.
    • POL-4.A.2 Lump-sum taxes and lump-sum subsidies do not change either marginal cost or marginal benefit; only fixed costs will be affected.
    • POL-4.A.3 Binding price ceilings and floors affect prices and quantities differently depending on the market structures (perfect competition, monopoly, monopolistic competition, and monopsony) and the price elasticities of supply and demand.
    • POL-4.A.4 Government intervention in imperfect markets can increase efficiency if the policy correctly addresses the incentives that led to the market failure.
    • POL-4.A.5 Government can use price regulation to address inefficiency due to monopoly.
    • POL-4.A.6 A natural monopoly will require a lump-sum subsidy to produce at the allocatively efficient quantity.
    • POL-4.A.7 Governments use antitrust policy in an attempt to make markets more competitive.
      • Exclusion statement: A graph of inefficiency and policy due to collusion is beyond the scope of the course and the AP Exam.
    日本語

    持続的な理解 (POL-4): 不完全市場において、適切に設計された政府政策は浪費を削減できる。

    学習目標 POL-4.A: a. 不完全市場における政府政策の介入を定義する。 b. 政府政策が完全競争市場および不完全競争市場における市場成果をどう変化させるかを説明する(適切な場合、グラフを使用して)。 c. 完全競争市場および不完全競争市場における政府政策による市場成果の変化を計算する(適切な場合、グラフまたは表からのデータを使用して)。

    • POL-4.A.1 単位あたりの税および補助金は、消費者が支払う総価格、企業が受け取る純価格、均衡数量、消費者余剰および生産者余剰、無谓損失、および政府収入または支出に影響を与える。その影響の程度は需要および供給の価格弾力性によって決まる。
    • POL-4.A.2 定額税および定額補助金は、限界費用または限界便益を変化させず、固定コストのみが影響を受ける。
    • POL-4.A.3 実効的な価格上限および下限は、市場構造(完全競争、独占、差別化競争、 monopsony)および供給および需要の価格弾力性に応じて、価格および数量に異なる影響を与える。
    • POL-4.A.4 不完全市場における政府介入は、政策が市場の失敗を引き起こしたインセンティブを適切に解決した場合、効率性を向上させることができる。
    • POL-4.A.5 政府は、独占による非効率性を処理するために価格規制を使用できる。
    • POL-4.A.6 自然独占は、配置効率のある数量を生産するために定額補助金を必要とする。
    • POL-4.A.7 政府は、市場をより競争的にするために反トラスト政策を使用する。
      • 除外文: コールージョンによる非効率性と政策のグラフは、課程およびAP試験の範囲外である。

    Source: College Board AP Course and Exam Description · ⁨出典: College Board AP コースおよび試験説明書⁩

    English

    Government tools change outcomes differently by structure:

    • Regulating a monopoly's price toward $P=MC$ can increase efficiency (unlike a price control in a competitive market, which creates shortage/surplus).
    • Antitrust laws 反垄断法 break up or block anti-competitive mergers and collusion.
    • Taxes and subsidies shift output toward the socially efficient quantity when externalities are present.

    The key insight: the same policy can help or hurt efficiency depending on whether the market was already efficient (competitive) or already failing (monopoly, externality).

    Per-unit vs lump-sum. A per-unit tax 从量税 adds to marginal cost, so it shifts supply up, raises price, cuts quantity, and creates deadweight loss. A lump-sum tax 定额税 (a fixed charge like a licence fee) does not change marginal cost or marginal benefit, so in the short run the profit-maximising price and quantity are unchanged – only the firm's profit falls; in the long run it changes entry and exit. For a natural monopoly, regulating price down to $P=MC$ (allocatively efficient) forces a loss, so a lump-sum subsidy 定额补贴 is needed to keep it producing that efficient quantity.

    日本語

    政府の手段は構造によってoutcomeを変化させる:

    • 独占の価格を$P=MC$方向に規制することは効率性を高めることができる(完全競争市場における価格規制が不足や余剰を生むのと異なり)。
    • 反独占法は競争阻害的な合併や collusion を解体または阻止する。
    • 税金と補助金は外部性が存在する場合、生産量を社会的に効率的な数量へシフトさせる。

    重要な洞察:同じ政策でも、市場がすでに効率的(完全競争)であったか、すでに失敗している(独占、外部性)かによって、効率性に寄与するか損なうかが変わる。

    単価税と一括税。 単価税は限界原価を増加させるため、供給曲線を上方へシフトさせ、価格を上げ、生産量を減らし、死weight損失を生じさせる。一括税(許可料のような固定負担金)は限界原価や限界便益を変化させない。したがって短期間では利益最大化の価格と生産量は変更されない——企業の利益が減少するのみであり、長期においてこそ参入・退出に影響を与える。天然独占の場合、価格を$P=MC$(配分効率性)まで規制すると赤字となるため、その効率的な生産量を引き続き維持するためには一括補助金が必要である。

    6.5

    Inequality · ⁨不平等⁩

    Syllabus · ⁨シラバス⁩
    English

    Enduring Understanding (POL-5): Market outcomes can result in income inequality.

    Learning Objective POL-5.A: Define measures of economic inequality in income and wealth.

    • POL-5.A.1 Income levels and poverty rates vary greatly both across and within groups (e.g., age, gender, race) and countries.
    • POL-5.A.2 The Lorenz curve and Gini coefficient are used to represent the degree of inequality in distributions and to compare distributions across different countries, policies, or time periods.
      • Exclusion statement: Drawing the Lorenz curve and calculating Gini coefficients are beyond the scope of the course and the AP Exam.

    Learning Objective POL-5.B: Explain sources of income and wealth inequality.

    • POL-5.B.1 Each factor of production receives the value of its marginal product, which can contribute to income inequality.
    • POL-5.B.2 Sources of income and wealth inequality include differences in tax structures (progressive and regressive tax structures), human capital, social capital, inheritance, effects of discrimination, access to financial markets, mobility, and bargaining power within economic and social units (firms, labor unions, and families).
    日本語

    持続的な理解 (POL-5): 市場の成果は所得の不平等をもたらすことがある。

    学習目標 POL-5.A: 所得および資産における経済的不平等の尺度を定義する。

    • POL-5.A.1 所得レベルおよび貧困率は、グループ間およびグループ内(例:年齢、性別、人種)、国間でも大きく異なる。
    • POL-5.A.2 ロレンツ曲線とジニ係数は、分布における不平等の程度を表し、異なる国、政策、または時期の分布を比較するために用いられる。
      • 除外事項: ロレンツ曲線の描画およびジニ係数の計算は、本コースおよびAP試験の対象外である。

    学習目標 POL-5.B: 所得・資産格差の原因を説明する。

    • POL-5.B.1 各生産要因はその限界生産価値を得るが、これが所得格差の一因となることがある。
    • POL-5.B.2 所得・資産格差の原因には、税制の違い(累進的・逆進的税制)、人的資本、社会的資本、相続、差別の影響、金融市場へのアクセス、移動性、経済・社会単体内(企業、労働組合、家庭)での交渉権などがある。

    Source: College Board AP Course and Exam Description · ⁨出典: College Board AP コースおよび試験説明書⁩

    English

    Markets reward productivity, but the resulting income distribution 收入分配 can be very unequal. Economists measure it with the Lorenz curve 洛伦兹曲线 (share of income against share of population; the further it bows from the 45° line, the more unequal) and the Gini coefficient 基尼系数 (0 = perfect equality, 1 = perfect inequality).

    Worked example. Suppose the poorest $20\%$ of households earn just $5\%$ of income, while the richest $20\%$ earn $50\%$. Under perfect equality each $20\%$ would earn exactly $20\%$, so the Lorenz curve would be the $45°$ line. Because the bottom fifth is well below $20\%$ and the top fifth well above, the curve bows far beneath the diagonal – a large gap that means a high Gini coefficient and substantial inequality.

    Sources of inequality include differences in human capital 人力资本 (skills, education), inheritance, and discrimination. Governments redistribute through progressive taxes 累进税 (higher rates on higher incomes) and transfer payments 转移支付 (welfare, subsidies). There is a debated efficiency–equity trade-off 效率与公平权衡: redistribution can reduce work incentives, so societies balance fairness against the size of the total pie.

    日本語

    市場は生産性を報いるが、結果として生じる所得分配は非常に不均等になり得る。経済学者はローレンツ曲線(所得の割合対人口の割合;45°線からの湾曲が大きければ大きいほど不平等)、およびジニ係数(0=完全平等、1=完全不平等)を用いてこれを測定する。

    ローレンツ曲線とジニ係数は所得の不平等を測定する
    ローレンツ曲線とジニ係数は所得の不平等を測定する

    ** worked example.** 最下位 $20\%$ の世帯の収入が $5\%$ である一方、最上位 $20\%$ の世帯の収入が $50\%$ であると仮定します。完全平等であれば、各 $20\%$ は正確に $20\%$ を稼ぐため、ロレンツ曲線は $45°$ 線となります。下位五分の一が $20\%$ よりもはるかに低く、上位五分の一がはるかに高いため、曲線は対角線のはるかに下方へ大きく湾曲しています。この大きな乖離は、ジニ係数が高いことを意味し、著しい不平等を示しています。

    不平等の要因には、人間資本(スキル、教育)の違い、相続、差別が含まれる。政府は累進税制(所得が高いほど税率が高い)および給付金(福祉、補助金)を通じて所得を再配分する。効率性と公平性のトレードオフは議論の的となっており、再配分は労働意欲を低下させる可能性があるため、社会は公平さと総所得の規模とのバランスを取り合う必要がある。

    隣り合う資産と貧困:市場だけでは大きな所得格差の解消に至らない可能性
    隣り合う資産と貧困:市場だけでは大きな所得格差の解消に至らない可能性
    Explore · ⁨探索⁩

    Measure inequality with a Lorenz curve · ⁨ローレンツ曲線を用いて不平等度を測定する⁩

    A Lorenz curve plots cumulative income against cumulative population; the further it bows from the diagonal, the more unequal — summarised by the Gini coefficient. · ⁨ローレンツ曲線は cumulative income を cumulative population に対してプロットしたもので、対角線からの逸脱が大きくなるほど不平等度が高い——これをジニ係数で要約する。⁩

    Vocabulary · ⁨語彙⁩ Train · ⁨練習する⁩
    English 日本語
    Lorenz curve/ˈlɒrənts kɜːv/ ローレンツ曲線
    Gini coefficient/ˈdʒiːni ˌkəʊɪˈfɪʃənt/ ジニ係数
    human capital/ˈhjuːmən ˈkæpɪtl/ 人的資本
    progressive taxes/prəˈɡresɪv ˈtæksɪz/ 累進税制
    transfer payments/ˈtrænsfɜː ˈpeɪmənts/ 給付金
    efficiency–equity trade-off/ɪˈfɪʃənsi ˈekwɪti treɪd ɒf/ 効率と公平性のトレードオフ
    6.5

    Exam tips · ⁨試験対策⁩

    English
    • A negative externality makes the market over-produce; correct with a Pigovian tax equal to the external cost. A positive externality under-produces; correct with a subsidy.
    • A public good is non-rival and non-excludable, so free-riding leads markets to under-provide it.
    • Classify goods by rivalry and excludability; common resources (rival, non-excludable) suffer the tragedy of the commons.
    • The same policy can help or hurt efficiency depending on whether the market was already efficient or failing.
    • Measure inequality with the Lorenz curve and Gini coefficient (0 = equality, 1 = inequality).
    日本語
    • 負の外部性は市場の過剰生産をもたらすため、外部コストに等しいピグー税によって是正される。正の外部性は過少生産をもたらすため、補助金によって是正される。
    • 公共財は非競合的かつ非排除的であるため、フリーライダーにより市場による供給が不足する。
    • 財を競合性と排除性で分類する。共通資源(競合的・非排除的)は「共同の悲劇」に直面する。
    • 市場がすでに効率的であったか失敗していたかによって、同じ政策が効率性に寄与するか損なうか決まる。
    • ローレンツ曲線とジニ係数を用いて不平等を測定する(0=平等、1=不平等)。

Log in or create account · ⁨ログインまたはアカウント作成⁩

IGCSE, A-Level & AP