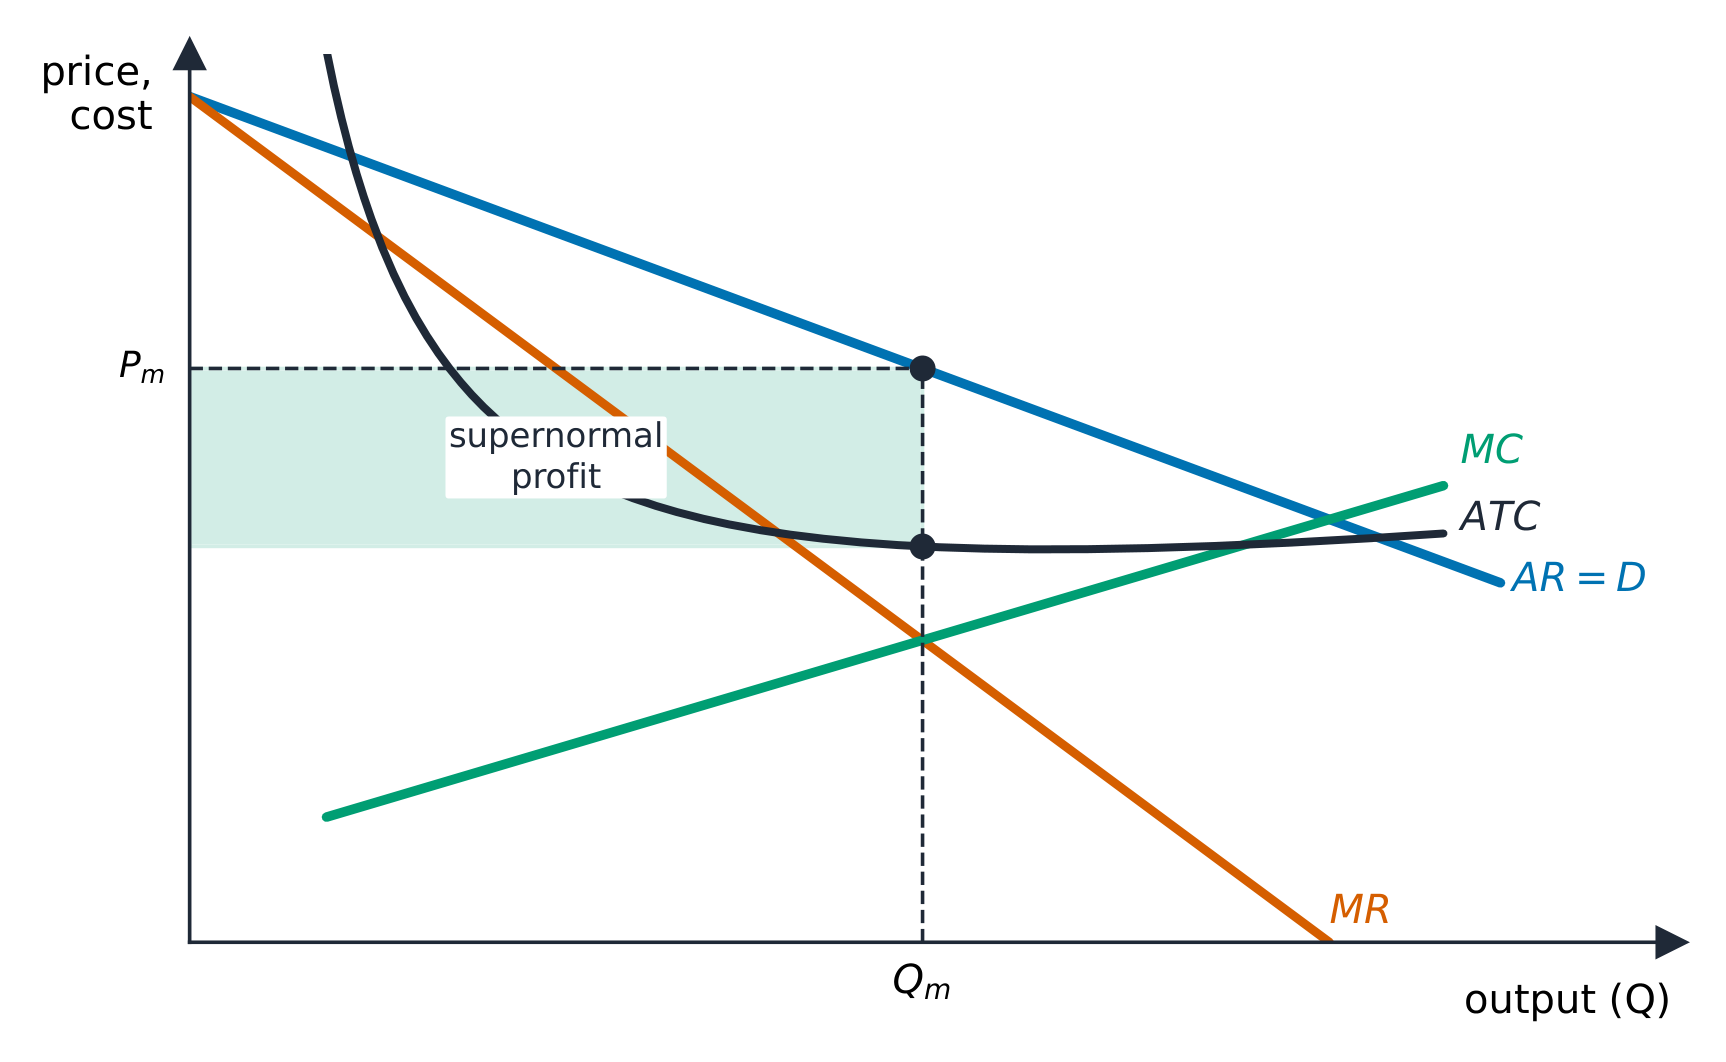
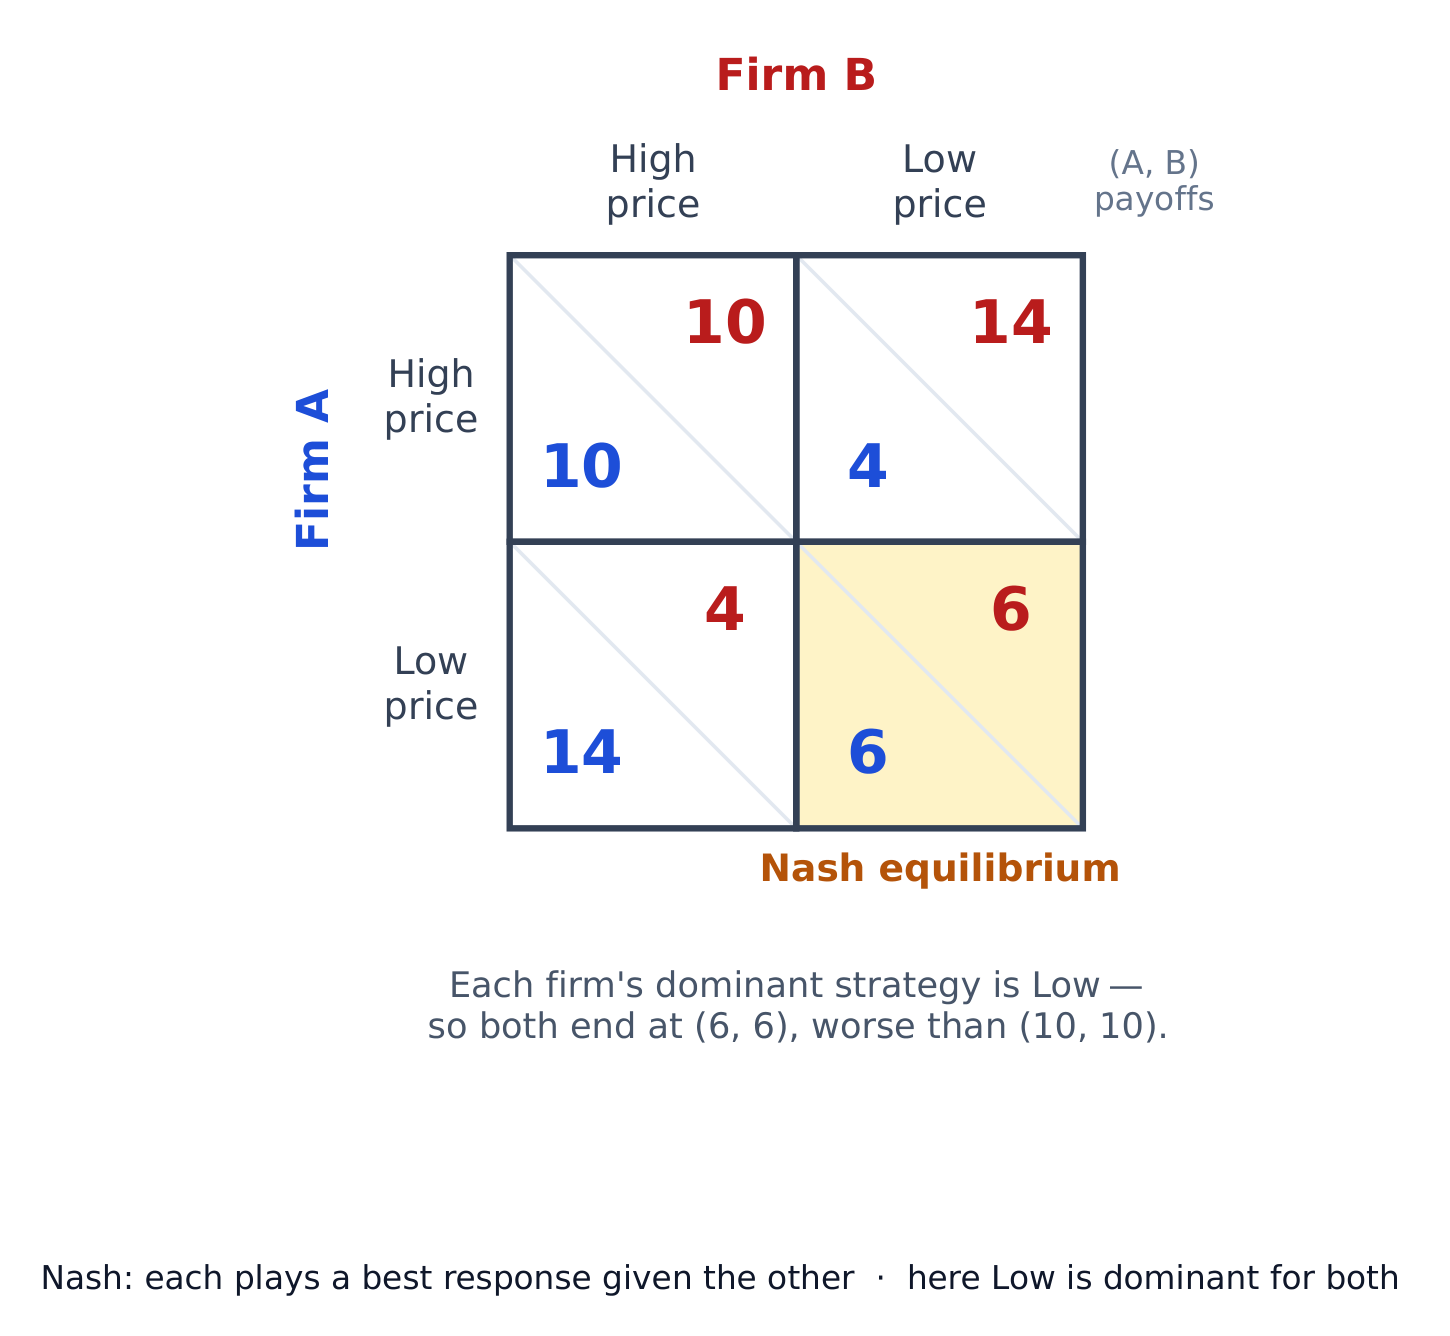
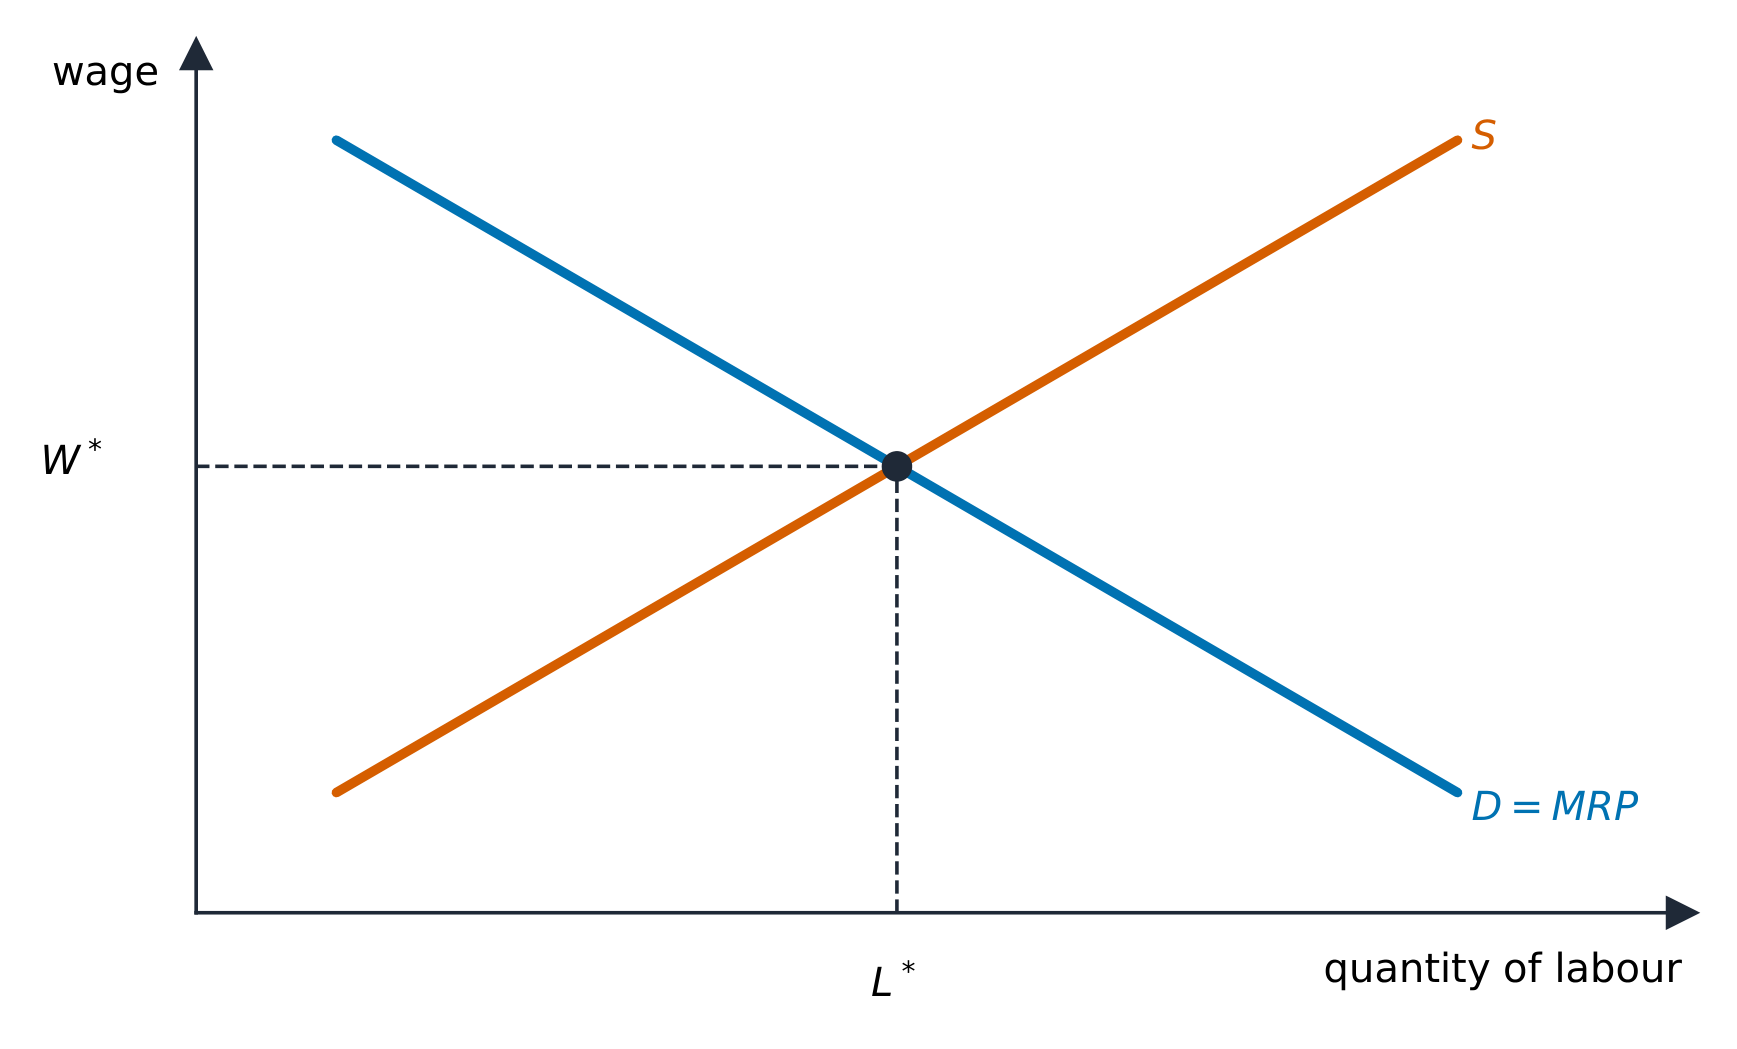
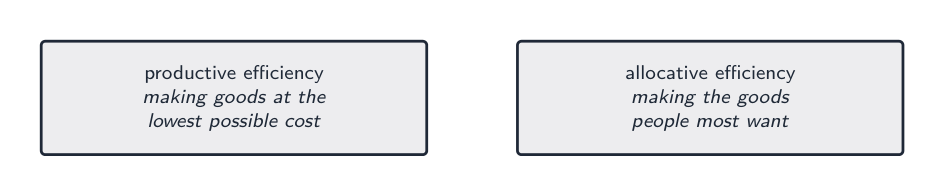
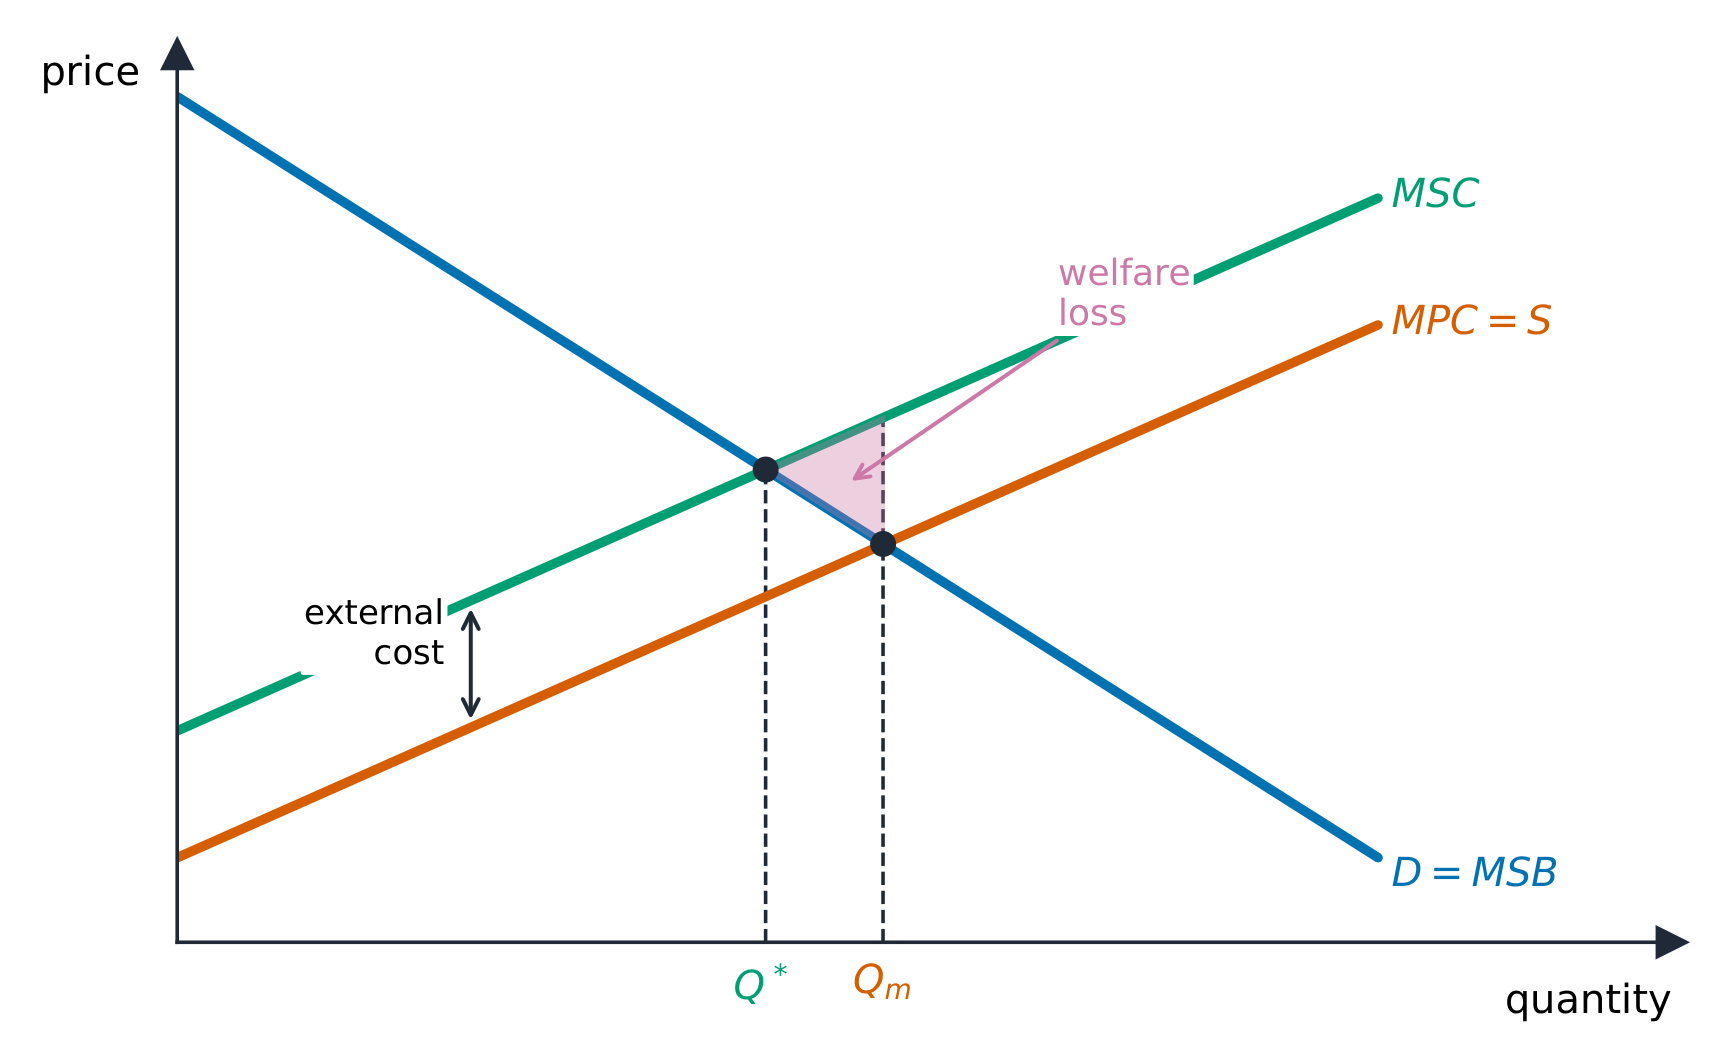
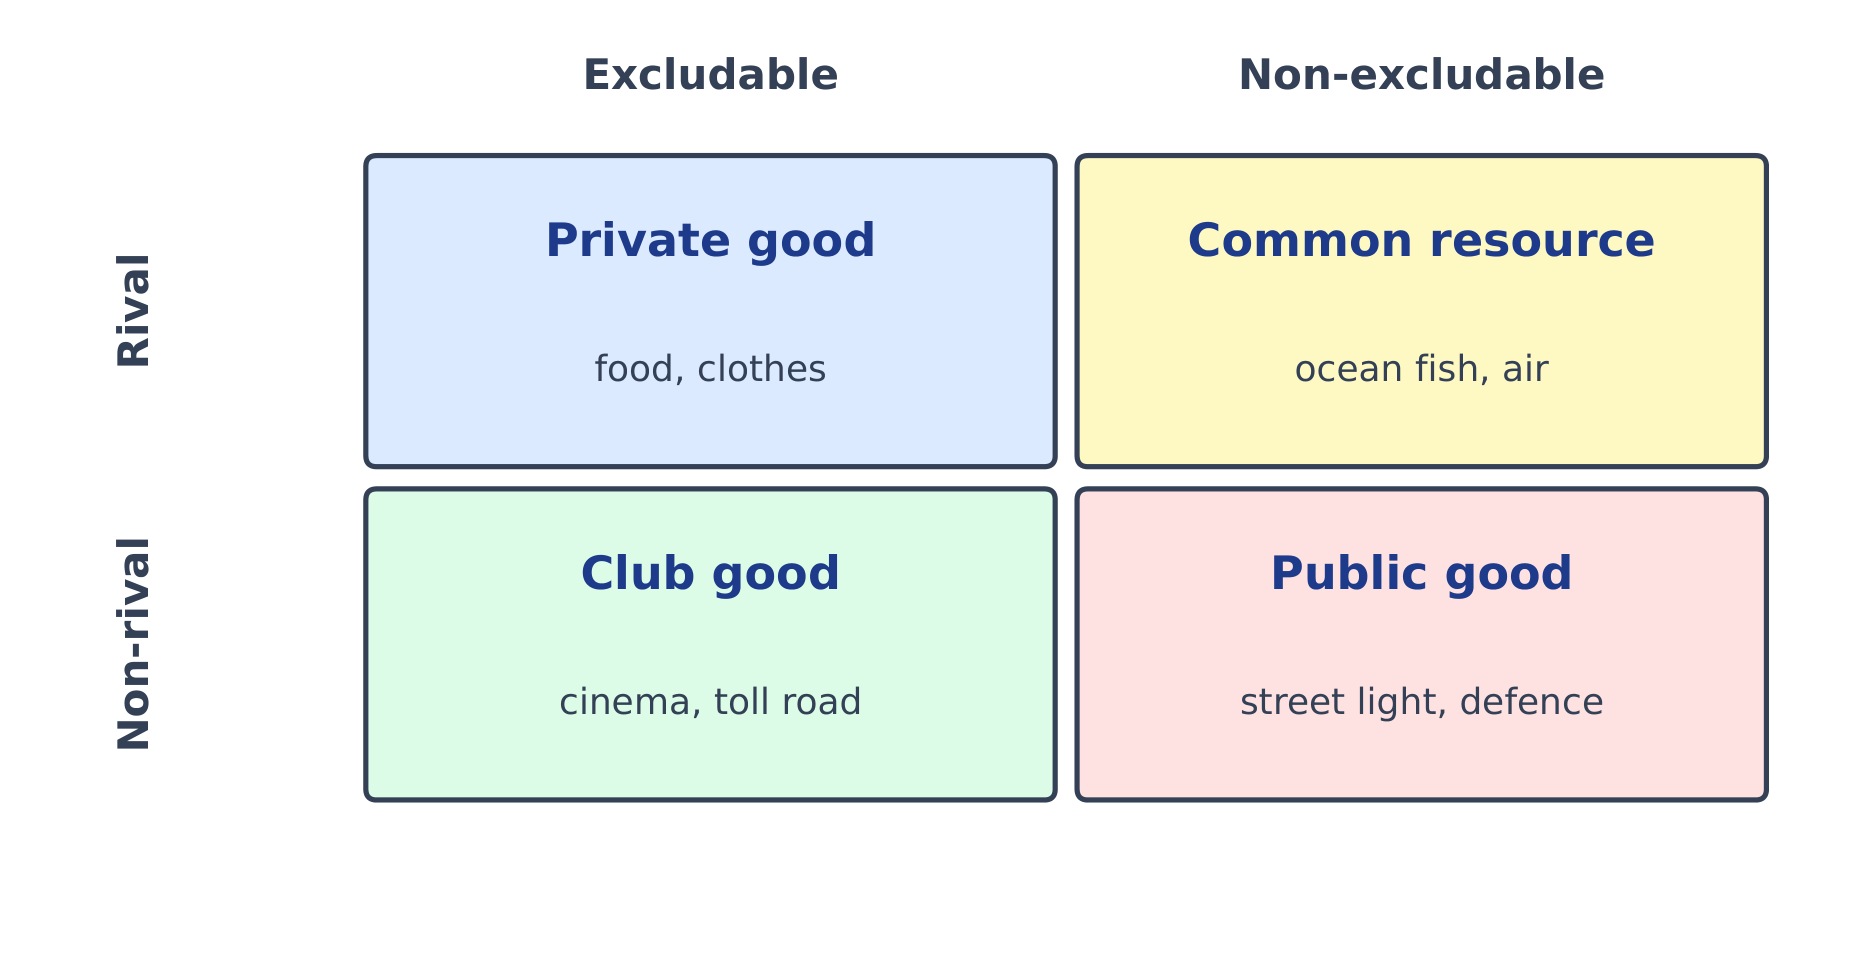
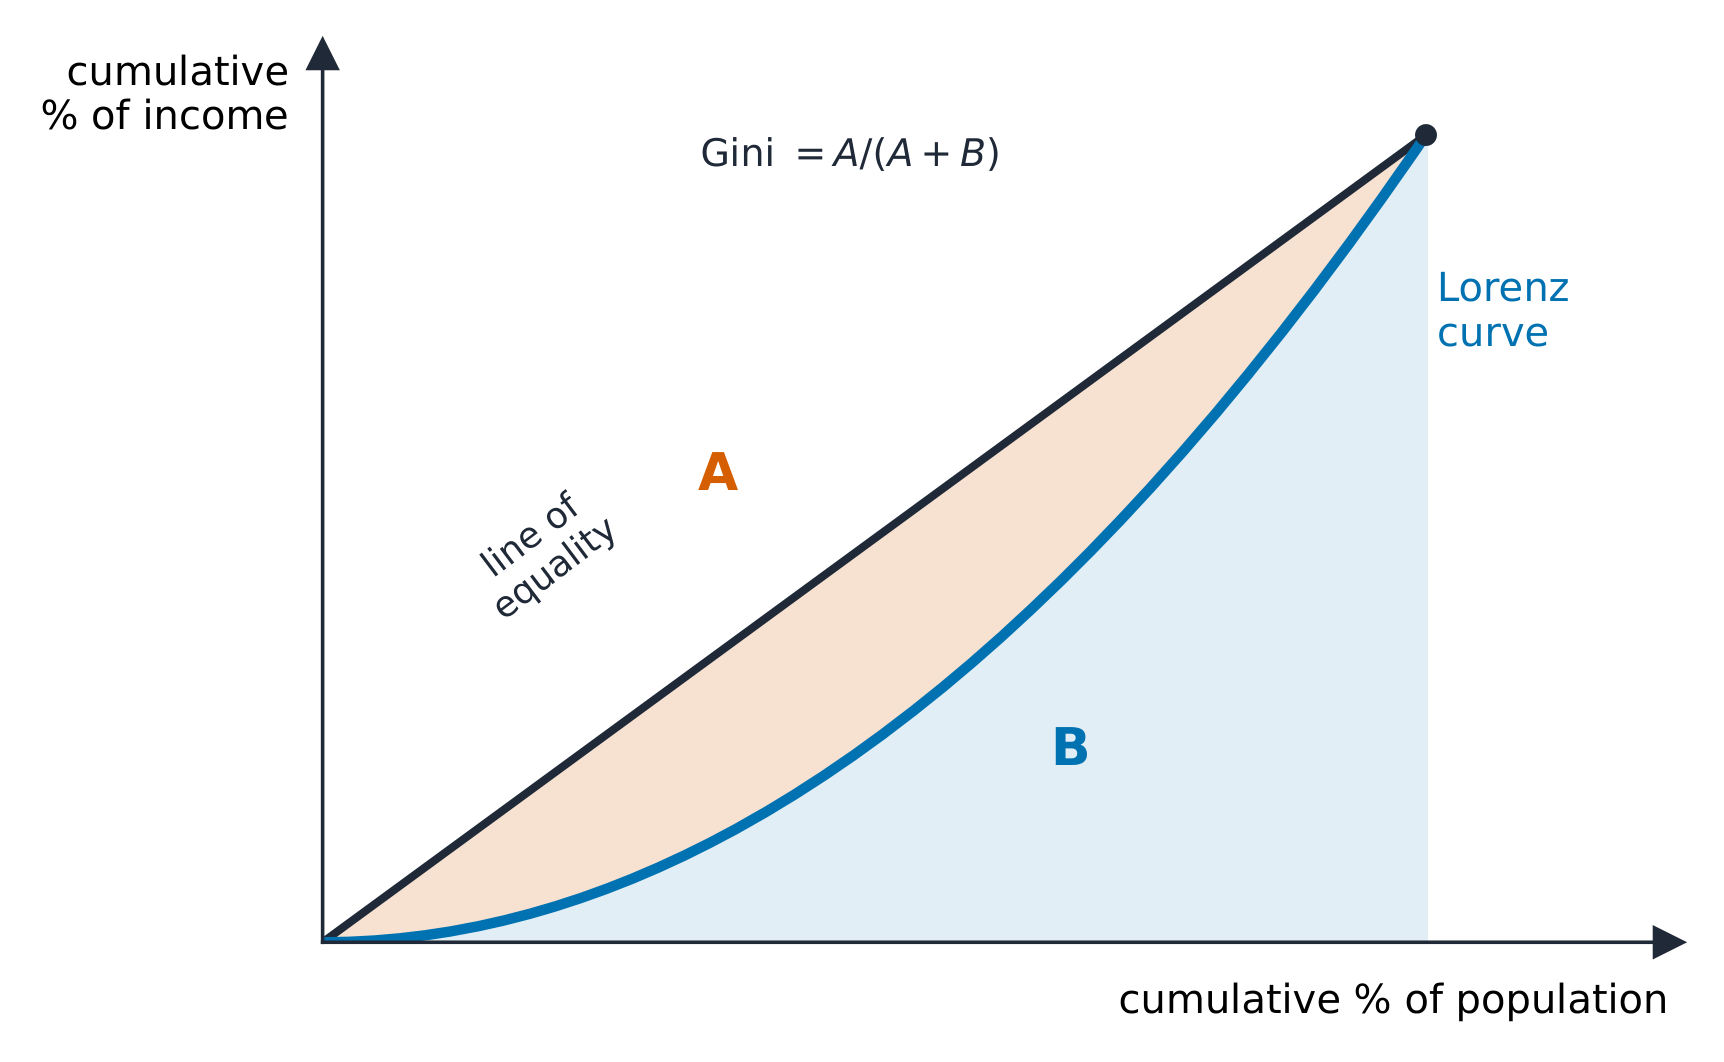
כלכלה מיקרו-אקונומית AP מכסה מדירות ועלות הזדמנות, היצע וביקוש, גמישות, ייצור ועלויות, ארבע מבני השוק, שווקי גורמים וכשל שוק עם התערבות ממשלתית. זהו חומר לימודים קטן שנלמד לעומק.
הגרף הוא התשובה. רוב הנקודות בשאלות פתוחות מוענקות עבור דיאגרמה מסומנת נכונה — צירים שמורים, עקומות מסומנות, האיזון החדש מסומן וכיוון ההזזה מוצג. הסבר כתוב של הזזה שלא ציירת מניקה מעט מאוד נקודות.
תרגל ציור אותם במהירות ובנכונות ביד, במיוחד עקומות העלות ותחרות מושלמת מול מונופול, שמופיעים באופן קבוע.
העמודים מכסים את כל שש היחידות עם עקומות העלות ודיאגרמות השוק מצוירות ולא מתוארות. FRQs ישנים עם מדריך הצללה נמצאים בספרייה. נקודות של מיקרו הולכות לעיתים קרובות להראיית ההזזה וה consequences שלה, לכן התשובות המופיעות משאירות את הגרף במרכז.
Enduring Understanding (MKT-1): Most resources are scarce, and in most cases the use of resources involves constraints and trade-offs.
Learning Objective MKT-1.A: Define resources and the cause(s) of their scarcity.
MKT-1.A.1 Economic trade-offs arise from the lack of sufficient resources (scarcity) to meet society's wants and needs.
MKT-1.A.2 Most factors of production (such as land, labor, and capital) are scarce, but some factors of production (such as established knowledge) may not be scarce due to their non-rival nature.
עברית
הבנה מתמשכת (MKT-1): רוב המשאבים הם מוגבלים, ובמרבית המקרים השימוש במשאבים מעורב מגבלות ותמורות.
מטרת למידה MKT-1.A: הגדר משאבים ו(או) את הסיבה/הסיבות לקצבתם.
MKT-1.A.1 תמורות כלכליות נובעות ממחסור במשאבים מספקים (קצבה) כדי לספק את רצונות וצרכי החברה.
MKT-1.A.2 רוב גורמי הייצור (כגון קרקע, עבודה והון) הם מוגבלים, אך חלק מגורמי הייצור (כגון ידע מוסד) עשויים לא להיות מוגבלים בשל אופייה הלא-מתחרה שלהם.
Source: College Board AP Course and Exam Description · מקור: תיאור הקורס והמבחן של College Board AP
An outdoor market: markets allocate scarce resources among competing uses
Economics 经济学 begins with one stubborn fact: people's wants are effectively unlimited, but the resources 资源 to satisfy them are limited. This gap is scarcity 稀缺性, and it is why economics exists – if everything were free and endless, there would be nothing to decide.
The resources (the factors of production 生产要素) are land (natural resources), labor 劳动 (human effort), capital 资本 (tools, machines, buildings), and entrepreneurship 企业家才能 (organizing the other three and taking risks). Because these are scarce, every economy must answer three questions: what to produce, how to produce it, and for whom to produce.
Scarcity forces choice, and every choice has an opportunity cost 机会成本 – the value of the next-best alternative you give up. This single idea runs through the whole course: the true cost of anything is what you sacrifice to get it, not just the money you pay.
Enduring Understanding (MKT-1): Most resources are scarce, and in most cases the use of resources involves constraints and trade-offs.
Learning Objective MKT-1.B: Define how resource allocation is influenced by the economic system adopted by society.
MKT-1.B.1 Resource allocation involves answering three basic questions: What goods and services to produce? How to produce those goods and services? And who consumes those goods and services?
MKT-1.B.2 Resource allocation is significantly influenced by the economic system adopted by society, such as command economy, market economy, or mixed economy. Each system involves a particular set of institutional arrangements and a coordinating mechanism for allocating scarce resources and distributing output.
עברית
הבנה מתמשכת (MKT-1): רוב המשאבים הם מוגבלים, ובמרבית המקרים השימוש במשאבים מעורב מגבלות ותמורות.
מטרת למידה MKT-1.B: הגדר כיצד הקצאת משאבים מושפעת מהמערכת הכלכלית שאומצה על ידי החברה.
MKT-1.B.1 הקצאת משאבים כוללת מענה לשלושה שאלות בסיסיות: אילו סחורות ושירותים לייצר? איך לייצר סחורות ושירותים אלו? ומי צורך סחורות ושירותים אלו?
MKT-1.B.2 הקצאת משאבים מושפעת באופן משמעותי מהמערכת הכלכלית שאומצה על ידי החברה, כמו כלכלת הוראות, כלכלת שוק או כלכלה מעורבת. כל מערכת כזו כוללת סט מסוים של תנוחות מוסדיות ומנגנון קואורדינציה להקצאת משאבים נדירים ולחלוקת התוצר.
Source: College Board AP Course and Exam Description · מקור: תיאור הקורס והמבחן של College Board AP
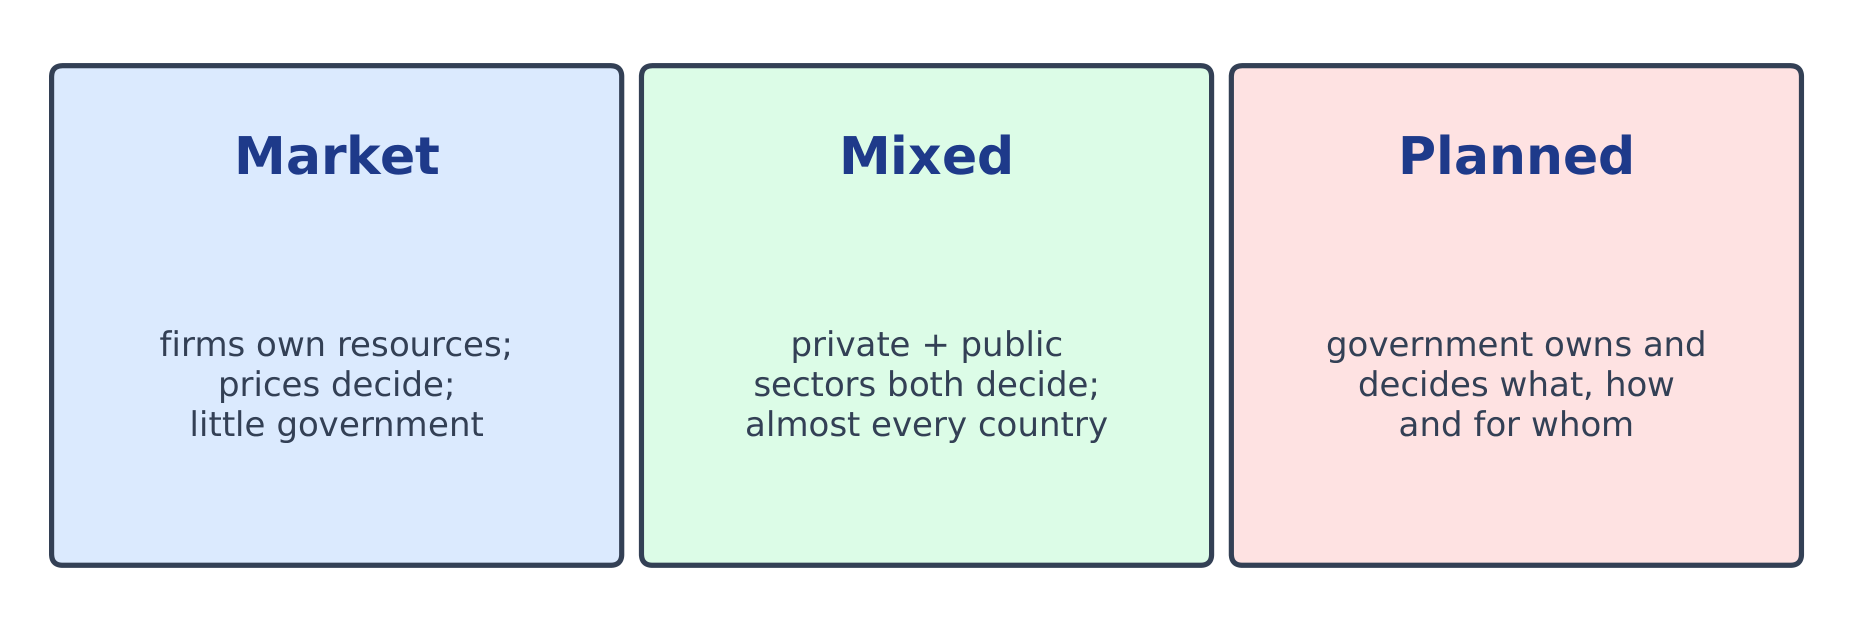
An economic system 经济体制 is a society's way of answering the three questions.
Economic systems form a spectrum from a free market to full government planning
In a market economy 市场经济, private buyers and sellers decide through prices; self-interest and competition coordinate them (the "invisible hand").
In a command economy 计划经济, the government owns resources and plans production.
Real economies are mixed 混合经济 – mostly markets, with government providing some goods and correcting problems.
The key advantage of markets is that prices carry information and incentives 激励 automatically, with no central planner needed.
Explore · חקור
Explore how prices coordinate a market · חקור כיצד מחירים מתאמים שוק
In a market economy no one is in charge, yet the price finds the level where quantity supplied meets quantity demanded. Drag the demand and supply lines and watch the equilibrium price act as a signal and an incentive. · בכלכלה שוקית אין מי שמנה, אך המחיר מוצא את הרמה שבה הכמות המוצעת תואמת את הכמות הנדרשת. גרור את קווי הביקוש וההיצע ותצפה כיצד המחיר באיזון משמש כאות וכמניע.
Enduring Understanding (MKT-1): Most resources are scarce, and in most cases the use of resources involves constraints and trade-offs.
Learning Objective MKT-1.C:
a. Define (using graphs as appropriate) the production possibilities curve (PPC) and related terms.
b. Explain (using graphs as appropriate) how the production possibilities curve (PPC) illustrates opportunity costs, trade-offs, inefficiency, efficiency, and economic growth or contraction under various conditions.
c. Calculate (using data from PPCs or tables as appropriate) opportunity cost.
MKT-1.C.1 The PPC is a model used to show the trade-offs associated with allocating resources.
MKT-1.C.2 The PPC can be used to illustrate the concepts of scarcity, opportunity cost, efficiency, underutilized resources, and economic growth or contraction.
MKT-1.C.3 The shape of the PPC depends on whether opportunity costs are constant, increasing, or decreasing.
MKT-1.C.4 The PPC can shift due to changes in factors of production as well as changes in productivity/technology.
MKT-1.C.5 Economic growth results in an outward shift of the PPC.
עברית
הבנה מתמשכת (MKT-1): רוב המשאבים הם מוגבלים, ובמרבית המקרים השימוש במשאבים מעורב מגבלות ותמורות.
מטרת למידה MKT-1.C:
א. הגדר (בשימוש בגרפים כפי שמתאים) את עקומת אפשרויות הייצור (PPC) ומונחים קשורים.
ב. הסבר (בשימוש בגרפים כפי שמתאים) כיצד עקומת אפשרויות הייצור (PPC) מדגימה עלויות חלופיות, פשרות, חוסר יעילות, יעילות וגידול או דחיית כלכליים בתנאים שונים.
ג. חשב (בשימוש נתונים מעקומות האפשרויות הייצור או טבלאות כמתאים) עלות זדמנות.
MKT-1.C.1 עקומת אפשרויות הייצור היא מודל המשמש להציג את הפשרות הקשורות בהקצאת משאבים.
MKT-1.C.2 ניתן להשתמש בעקומת אפשרויות הייצור כדי להמחיש את המושגים של נדירות, עלות חלופית, יעילות, שימוש לא מלא במשאבים וגידול או דחיית כלכליים.
MKT-1.C.3 צורת עקומת האפשרויות תלויה בכך שהעלויות החלופיות הן קבועות, עולות או יורדות.
MKT-1.C.4 עקומת האפשרויות יכולה להזיז בשל שינויים in גורמי הייצור ainsi que שינויים in פרודוקטיביות/טכנולוגיה.
MKT-1.C.5 גידול כלכלי גורם להזזה כלפי חוץ של עקומת האפשרויות.
Source: College Board AP Course and Exam Description · מקור: תיאור הקורס והמבחן של College Board AP
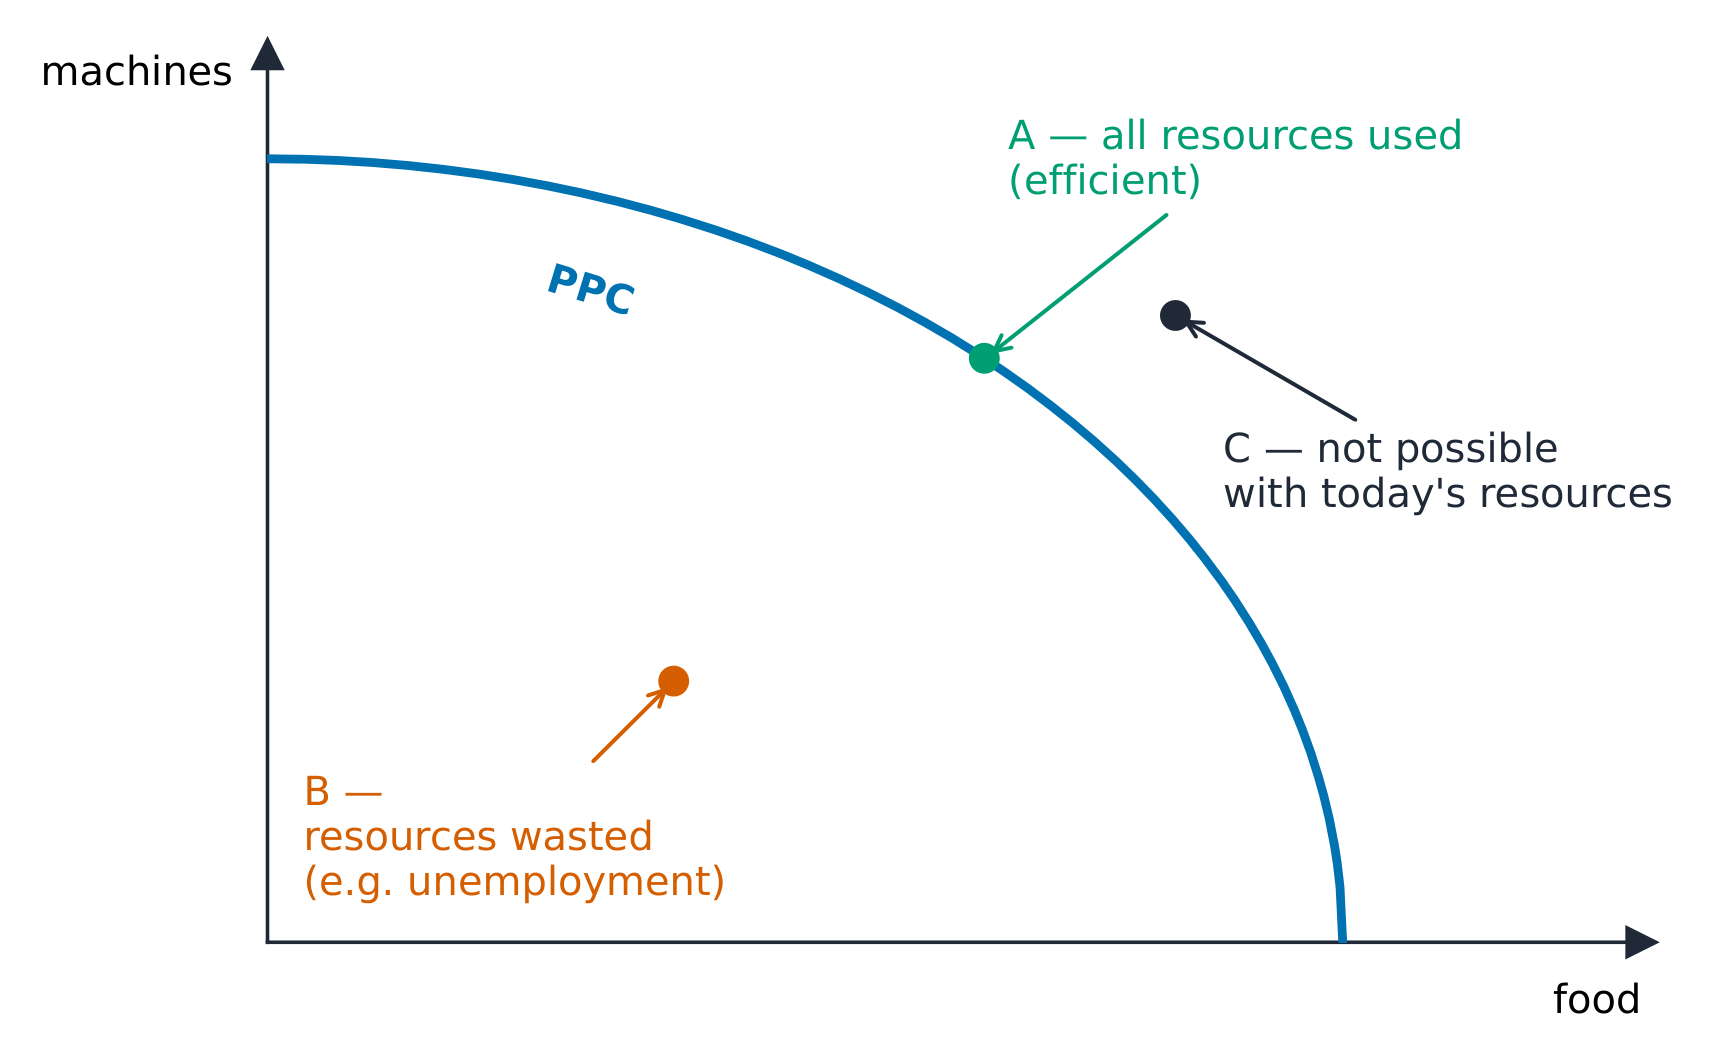
The production possibility frontier
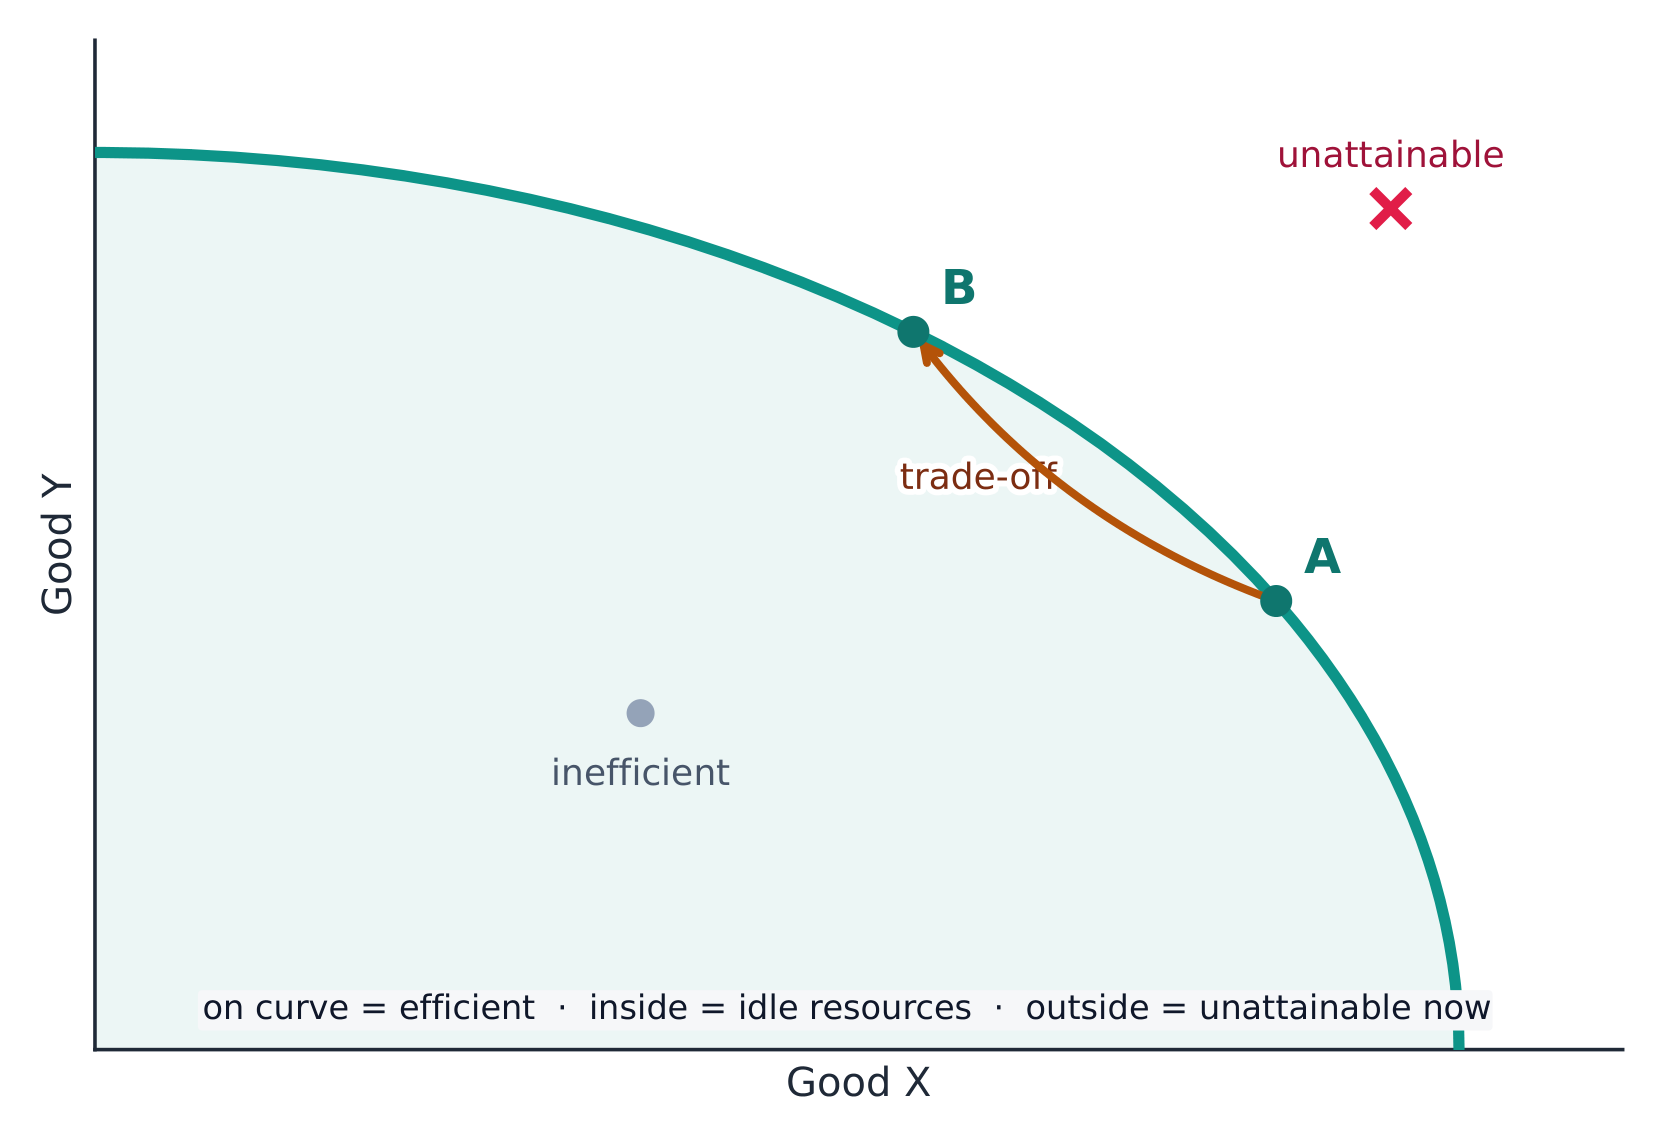
The production possibilities curve (PPC) 生产可能性曲线 shows the maximum combinations of two goods an economy can produce with its resources and technology fully and efficiently used.
Points on, inside, and outside the production possibilities curve
Points on the curve are efficient 有效率; points inside are inefficient (wasted or unemployed resources); points outside are currently unattainable 无法实现.
The PPC's downward slope shows opportunity cost: making more of one good means making less of the other. The slope at a point is the opportunity cost of the good on the horizontal axis.
A bowed-out (concave) PPC shows increasing opportunity cost – resources are not equally suited to both goods, so making more of one costs ever more of the other. A straight-line PPC means constant opportunity cost.
Exam skill: be ready to read opportunity cost off a PPC, decide if a point is efficient/inefficient/unattainable, and explain what shifts the curve.
A production possibilities curve: efficient, inefficient, and unattainable points
Explore · חקור
Explore the production possibilities curve · חקור את עקומת האפשרויות הייצוריות
Making more of one good means giving up some of the other — that trade-off is the opportunity cost, and the bowed shape shows the law of increasing opportunity cost. Drag along the curve, then grow the economy to push the whole frontier out. · ייצור יותר של סוג אחד של סחורה פירונו ויתור על חלק מסוג אחר — הויתור הזה הוא העלות ההזדמנות, והצורה הקעורה מדגימה את חוק העלות ההזדמנות העולה. גרור לאורך העקומה, ולאחר מכן הרחב את הכלכלה כדי להזיז את כל עקומת האפשרויות החיצוניות החוצה.
production possibilities curve (PPC)/prəˈdʌkʃn ˌpɒsəˈbɪlɪtiz kɜːv/
עקומת האפשרויות הייצור (PPC)
efficient/ɪˈfɪʃənt/
יעיל
unattainable/ʌnəˈteɪnəbl/
בלתי ניתן להשגה
Economic growth/ˌiːkəˈnɒmɪk ɡrəʊθ/
צמיחה כלכלית
1.4
Comparative Advantage and Gains from Trade
Syllabus · סיילבוס
English
Enduring Understanding (MKT-2): The consequences of scarcity can be mitigated through specialization in production and by exchange.
Learning Objective MKT-2.A:
a. Define absolute advantage and comparative advantage.
b. Determine (using data from PPCs or tables as appropriate) absolute and comparative advantage.
MKT-2.A.1 Absolute advantage describes a situation in which an individual, business, or country can produce more of a good or service than any other producer with the same quantity of resources.
MKT-2.A.2 Comparative advantage describes a situation in which an individual, business, or country can produce a good or service at a lower opportunity cost than another producer.
Learning Objective MKT-2.B:
a. Explain (using data from PPCs or tables as appropriate) how specialization according to comparative advantage with appropriate terms of trade can lead to gains from trade.
b. Calculate (using data from PPCs or tables as appropriate) mutually beneficial terms of trade.
MKT-2.B.1 Production specialization according to comparative advantage, not absolute advantage, results in exchange opportunities that lead to consumption possibilities beyond the PPC.
MKT-2.B.2 Comparative advantage and opportunity costs determine the terms of trade for exchange under which mutually beneficial trade can occur.
עברית
הבנה מתמשכת (MKT-2): ההשלכות של הנדירות ניתנות לקלול באמצעות התמחות בייצור ובמסחר.
מטרת הלמידה MKT-2.A:
א. הגדר יתרון מוחלט ויתרון יחסי.
ב. קבע (בשימוש נתונים מעקומות האפשרויות הייצור או טבלאות כמתאים) יתרון מוחלט ויתרון יחסי.
MKT-2.A.1 יתרון מוחלט מתאר מצב שבו פרט, עסק או מדינה יכולים לייצר יותר מסחורה או שירות מאשר כל יצרן אחר עם אותה כמות של משאבים.
MKT-2.A.2 יתרון יחסי מתאר מצב שבו פרט, עסק או מדינה יכולים לייצר סחורה או שירות בעלות חלופית נמוכה יותר מאשר יצרן אחר.
מטרת למידה MKT-2.B:
א. הסבר (בשימוש בנתונים מ-PPCs או טבלאות כמתאים) כיצד התמקדות לפי יתרון יחסי עם תנאי מסחר מתאימים יכולה להוביל לרווחים ממסחר.
ב. חשבון (בשימוש בנתונים מ-PPCs או טבלאות כמתאים) של תנאי מסחר הדדיים ומועילים.
MKT-2.B.1 התמחות בייצור לפי יתרון יחסי, ולא לפי יתרון מוחלט, מובילה לאפשרויות מסחר שמביאות לאפשרויות צריכה מעבר לעקומת האפשרויות.
MKT-2.B.2 יתרון יחסי ועלויות חלופיות קובעים את תנאי המסחר עבור החלפה שבה מסחר נוח הדדית יכול להתרחש.
Source: College Board AP Course and Exam Description · מקור: תיאור הקורס והמבחן של College Board AP
Two producers can both gain from trade by specializing 专业化.
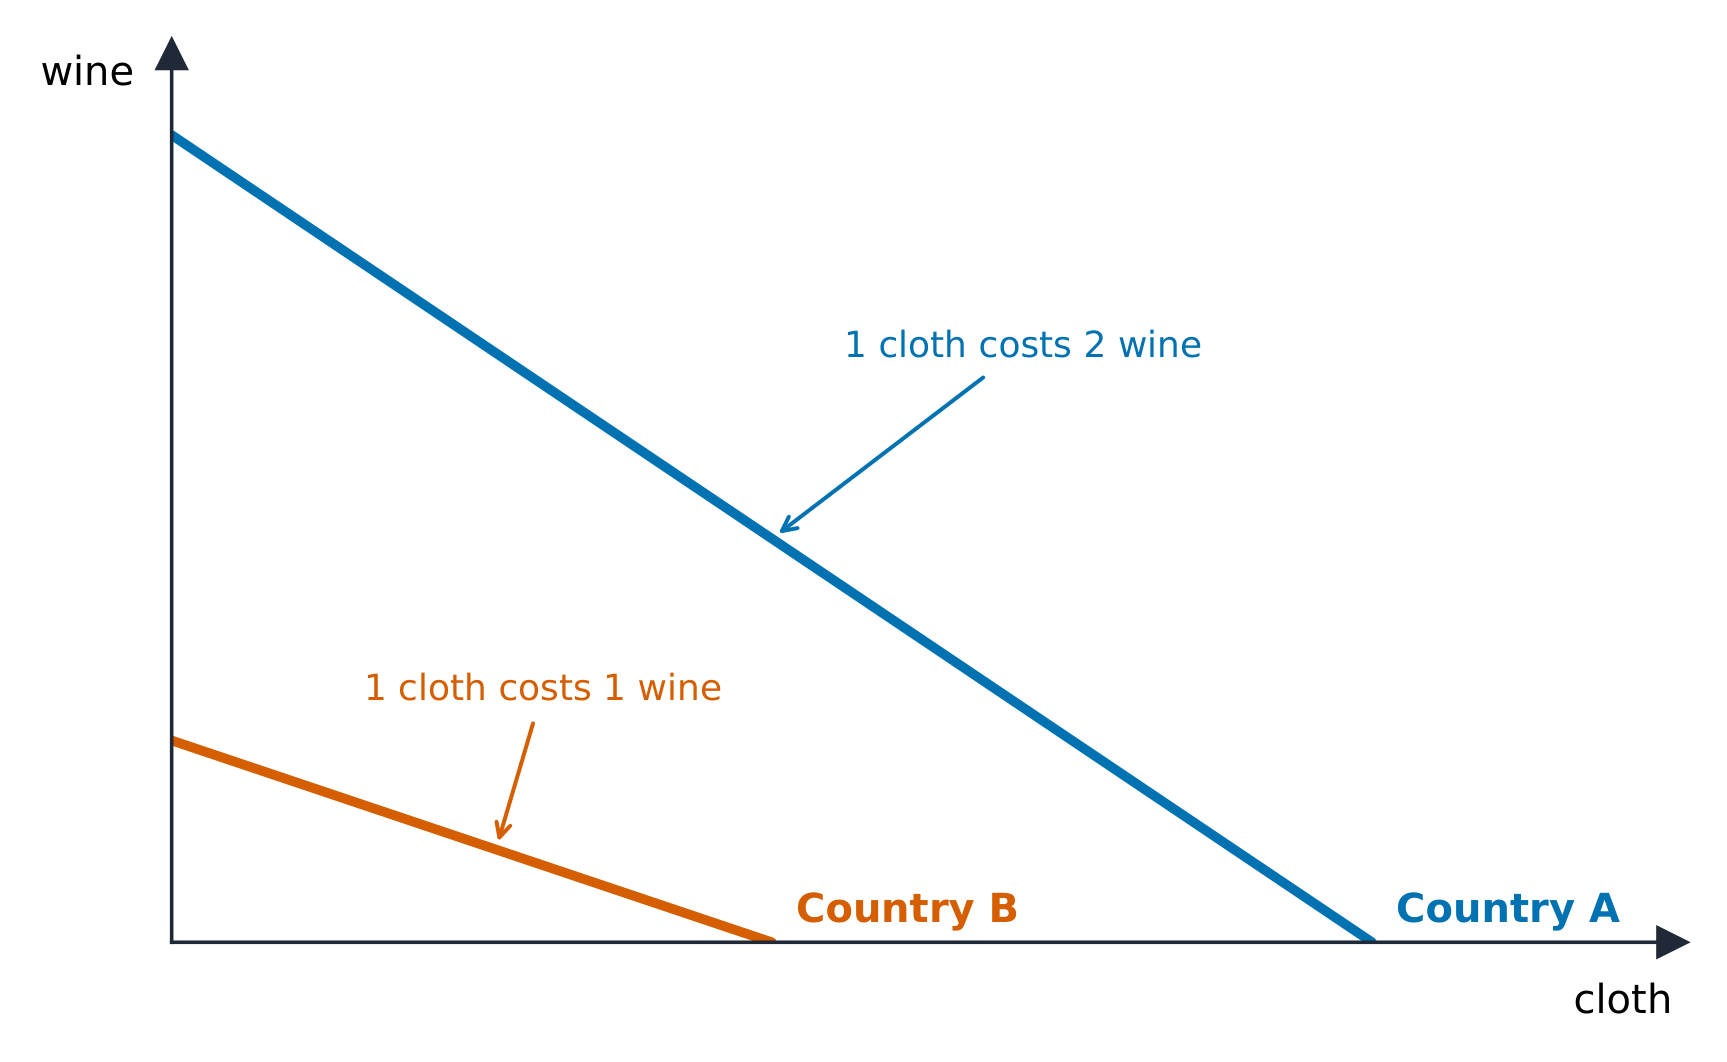
Comparative advantage comes from differently-sloped production possibilities curves
A producer has an absolute advantage 绝对优势 in a good if it can make more of it with the same resources.
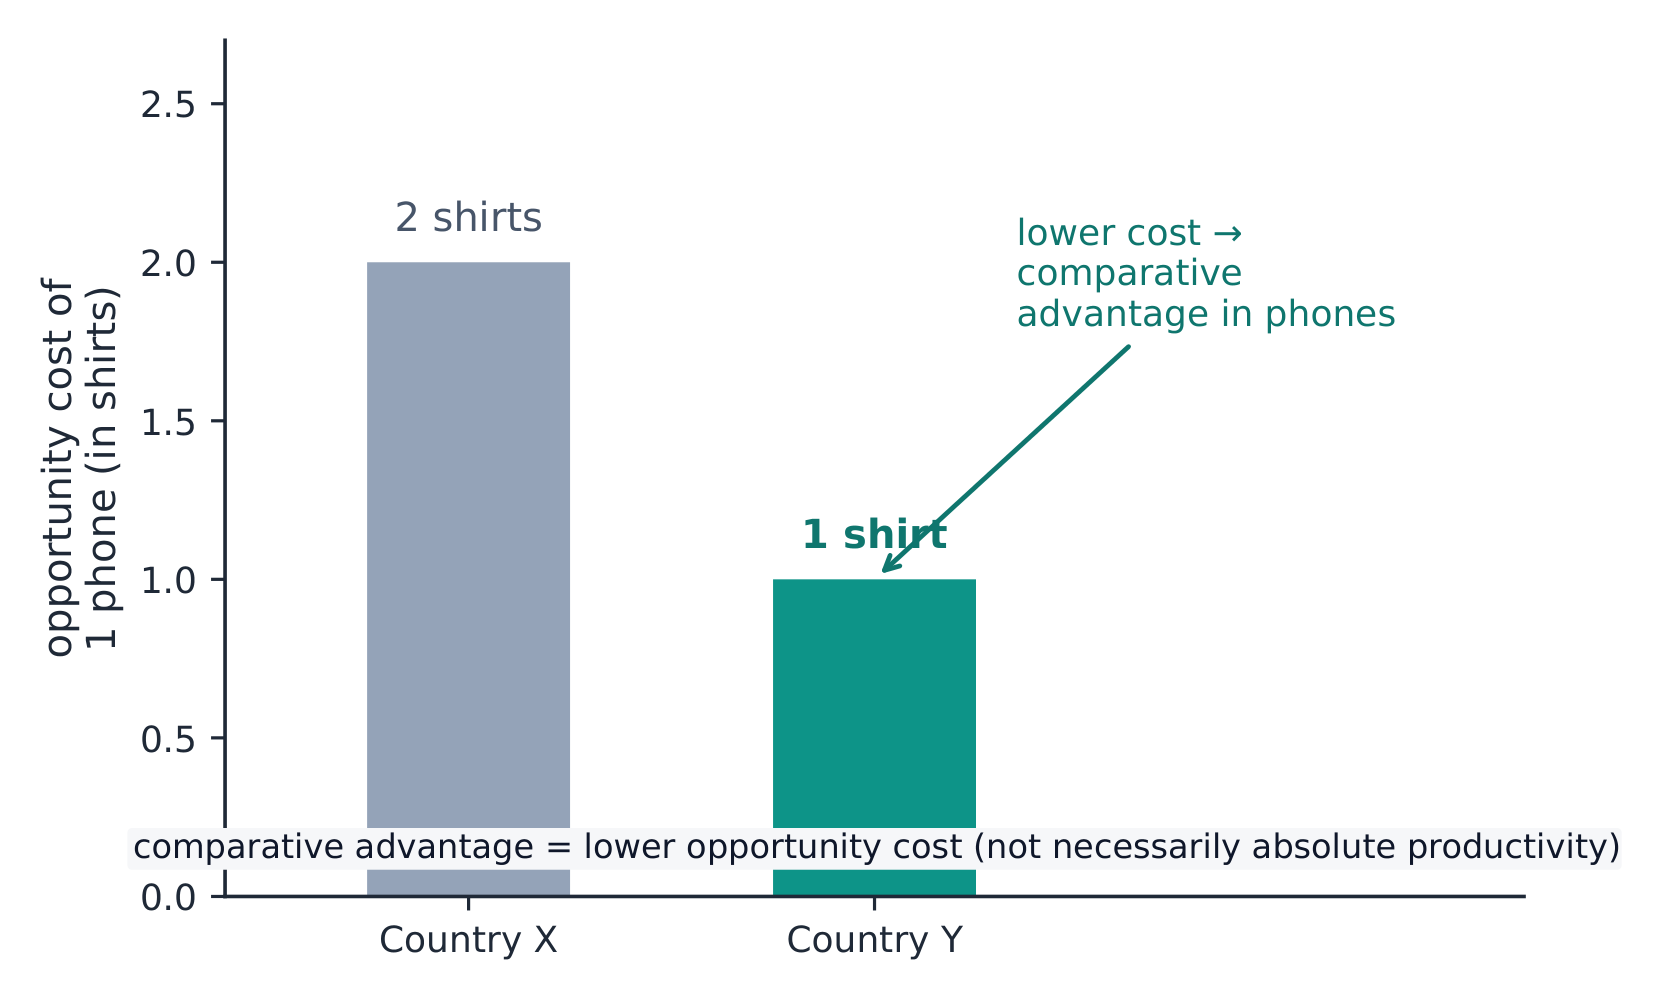
A producer has a comparative advantage 比较优势 if it has the lower opportunity cost for that good. Comparative advantage – not absolute – determines who should specialize.
Compute opportunity cost from output data: for each producer, one unit of good X costs (units of Y) $\div$ (units of X). The producer who gives up less Y should make X.
Both sides gain if they trade at a rate between their two opportunity costs – the terms of trade 贸易条件. Specializing by comparative advantage lets total output exceed what either could make alone, so consumption can lie outside each producer's own PPC.
Worked example. Anna can make $20$ shirts or$10$ tables a day; Ben can make $12$ shirts or$12$ tables. For Anna one table costs $\tfrac{20}{10}=2$ shirts; for Ben it costs $\tfrac{12}{12}=1$ shirt. Ben gives up fewer shirts, so Ben specializes in tables and Anna in shirts. Any terms of trade between $1$ and $2$ shirts per table – say $1.5$ – leaves both better off than producing alone.
Exam skill: these calculations appear almost every year – practice finding comparative advantage from both output tables and input tables, and stating a valid terms-of-trade range.
Comparative advantage goes to the producer with the lower opportunity costContainer shipping: comparative advantage and trade let countries specialise and gain
Explore · חקור
See why trade lets you consume beyond the frontier · ראו מדוע סחר מאפשר צריכה מעבר לעקומת האפשרויות
A producer should specialize where its opportunity cost is lowest, then trade for the rest. Because the terms of trade lie between the two producers' costs, trade lets a country consume outside its own production frontier. · מייצר צריך להתמקד בתחום שבו העלות ההזדמנות שלו נמוכה ביותר, ולאחר מכן לסחר עבור שאר הצרכים. מכיוון שהתנאים הסחריים נמצאים בין עלויות ההזדמנות של שני המייצרים, הסחר מאפשר למדינה לצרוך חוץ מעקומת הייצור שלה.
Enduring Understanding (CBA-1): Rational economic decisions require the evaluation of costs and benefits.
Learning Objective CBA-1.A:
a. Define opportunity cost.
b. Explain the opportunity costs associated with choices.
c. Calculate the opportunity costs associated with choices.
CBA-1.A.1 Rational agents consider opportunity costs, whether implicit or explicit, when calculating the total economic costs of any decision.
CBA-1.A.2 Total benefits form the metric "utility" for consumers and total revenue for firms.
Learning Objective CBA-1.B:
a. Explain a decision by comparing total benefits and total costs (using a table or a graph when appropriate).
b. Calculate total benefits and total costs (using a table or graph where appropriate).
CBA-1.B.1 Total net benefits, the difference between total benefits and total costs, are maximized at the optimal choice.
CBA-1.B.2 Some decisions permit rational agents to look at only marginal benefit and marginal cost. Other decisions cannot be broken down into increments in this way and must be evaluated by looking at total benefits and total costs.
עברית
הבנה מתמשכת (CBA-1): החלטות כלכליות רציונליות דורשות הערכת עלותות ותועלות.
מטרת למידה CBA-1.A:
א. הגדר עלות הזדמנות.
ב. הסבר על עלויות ההזדמנות הקשורות לבחירות.
ג. חשבון עלויות ההזדמנות הקשורות לבחירות.
CBA-1.A.1 סוכנים רציונליים לוקחים בחשבון עלויות הזדמנות, בין אם הן סתומות או גלויות, בעת חישוב העלויות הכלכליות הכוללות של כל החלטה.
CBA-1.A.2 תועלת כוללת מהווה את המדד "תועלת" עבור צרכנים והכנסה כוללת עבור חברות.
מטרת למידה CBA-1.B:
א. הסבר על החלטה באמצעות השוואת תועלות כוללות ועלויות כוללות (שימוש בטבלה או בגרף כאשר מתאים).
ב. חשבון תועלות כוללות ועלויות כוללות (שימוש בטבלה או בגרף כאשר מתאים).
CBA-1.B.1 התועלת הנטו הכוללת, שהיא ההפרש בין תועלות כוללות לעלויות כוללות, מקסימה בנקודת הבחירה האופטימלית.
CBA-1.B.2 חלק מההחלטות מאפשרות לסוכנים רציונליים להסתפק בתועלת שולית ובעלות שולית בלבד. לעומת זאת, חלק מההחלטות אינו ניתן לפירוק לגמישים בסגנון זה ויש להעריכן על ידי הצבת תועלות כוללות ועלויות כוללות.
Source: College Board AP Course and Exam Description · מקור: תיאור הקורס והמבחן של College Board AP
Rational decision-makers weigh benefits against costs. An action is worthwhile only when its benefit is at least as large as its cost – including the opportunity cost. Money already spent and unrecoverable is a sunk cost 沉没成本 and should be ignored in decisions: only future costs and benefits matter.
Explore · חקור
Weigh total benefit against total cost · שקלו את התועלת הכוללת מול העלות הכוללת
A choice is worth it only while the benefit of one more unit beats its cost. Where total revenue meets total cost is the break-even point; past it, extra activity adds more cost than value. · בחירה מוצדקת רק כל עוד התועלת של יחידה נוספת עולה על העלות שלה. הנקודה שבה הכנסה כוללת תואמת לעלות כוללה היא נקודת השוואת עלויות; מעבר לנקודה זו, פעילות נוספת מוסיפה עלות גדולה יותר מאשר ערך.
Enduring Understanding (CBA-2): To determine the optimal level at which to pursue an activity whose total benefits exceed total cost, rational economic agents compare marginal benefits and marginal costs.
Learning Objective CBA-2.A:
a. Define the key assumptions of consumer choice theory.
b. Explain (using a table or graph as appropriate) how a rational consumer's decision making involves the use of marginal benefits and marginal costs.
c. Calculate (using a table or a graph when appropriate) how a rational consumer's decision making involves the use of marginal benefits and marginal costs.
CBA-2.A.1 Consumers face constraints and have to make optimal decisions accounting for these constraints.
CBA-2.A.2 In a model of rational consumer choice, consumers are assumed to make choices so as to maximize their total utility.
CBA-2.A.3 Consumers experience diminishing marginal utility in the consumption of goods and services.
CBA-2.A.4 Consumers allocate their limited income to purchase the combination of goods that maximizes their utility by equating/comparing the marginal utility of the last dollar spent on each good.
Exclusion statement: Indifference curves are beyond the scope of the course and the AP Exam, but equating the ratios of marginal utility to price is within the scope.
Learning Objective CBA-2.B:
a. Define marginal analysis and related terms.
b. Explain a decision using marginal analysis (using a table or a graph when appropriate).
CBA-2.B.1 Marginal analysis involves comparing the additional benefit of increasing a given activity with the additional cost. Comparing marginal benefit (MB) with marginal cost (MC) helps individuals (firms) decide whether to increase, decrease, or maintain their consumption (production) levels.
CBA-2.B.2 The optimal quantity at any point in time does not depend on fixed costs (sunk costs) or fixed benefits that have already been determined by past choices.
CBA-2.B.3 The optimal quantity is achieved when marginal benefit is equal to marginal cost or where total benefit is maximized.
עברית
הבנה קיימת (CBA-2): כדי לקבוע את הרמה האופטימלית להמשך בפעילות שבה התועלת הכוללת עולה על העלות הכוללת, סוכנים כלכליים רציונליים משווים תועלות שוליות ועלויות שוליות.
מטרת למידה CBA-2.A:
א. הגדרת ההנחות המרכזיות של תורת בחירת הצרכן.
ב. הסבר (באמצעות טבלה או גרף בהתאם) כיצד קבלת החלטות של צרכן רציונלי מעורבת שימוש בתועלות שוליות ובעלויות שוליות.
ג. חשבון (באמצעות טבלה או גרף בהתאם) כיצד קבלת החלטות של צרכן רציונלי מעורבת שימוש בתועלות שוליות ובעלויות שוליות.
CBA-2.A.1 צרכנים נמצאים במגבלות וצריכים לקבל החלטות אופטימליות תוך התחשבות במגבלות אלו.
CBA-2.A.2 בדגם של בחירת צרכן רציונלי, מניחים כי צרכנים עושים בחירות כדי למקסם את התועלת הכוללת שלהם.
CBA-2.A.4 הצרכנים מקדישים את הכנסתם המוגבל לרכישת שילוב הסחורות שממקסם את הסיפוק שלהם על ידי השוואה/השוואת הסיפוק הגבולי של הדולר האחרון שנועד לכל סחורה.
הצהרת בלילה: עקומות אי-הבחירה אינן נכללות בתוכנית הלימודים ובמבחן AP, אך השוואת היחסים בין הסיפוק הגבולי למחיר היא בתוכנית.
מטרות לימוד CBA-2.B:
א. הגדר ניתוח גבולי ומונחים קשורים.
ב. הסבר החלטה באמצעות ניתוח גבולי (שימוש בטבלא או בגרף כאשר מתאים).
CBA-2.B.1 ניתוח גבולי כולל השוואה בין התועלת הנוספת מהגדלת פעילות נתונה לבין העלות הנוספת. השוואה בין תועלת גבולית (MB) לעלות גבולית (MC) מסייעת לאנשים (חברות) לקבוע האם להגדיל, להקטין או לשמר את רמות הצריכה (הייצור) שלהם.
CBA-2.B.2 הכמות האופטימלית בכל נקודת זמן אינה תלויה בעלויות קבועות (עלויות שקועות) או בתועלות קבועות שנקבעו כבר על ידי בחירות בעבר.
CBA-2.B.3 הכמות האופטימלית מושגת כאשר התועלת הגבולית שווה לעלות הגבולית או כאשר התועלת הכוללת מקסימלית.
Source: College Board AP Course and Exam Description · מקור: תיאור הקורס והמבחן של College Board AP
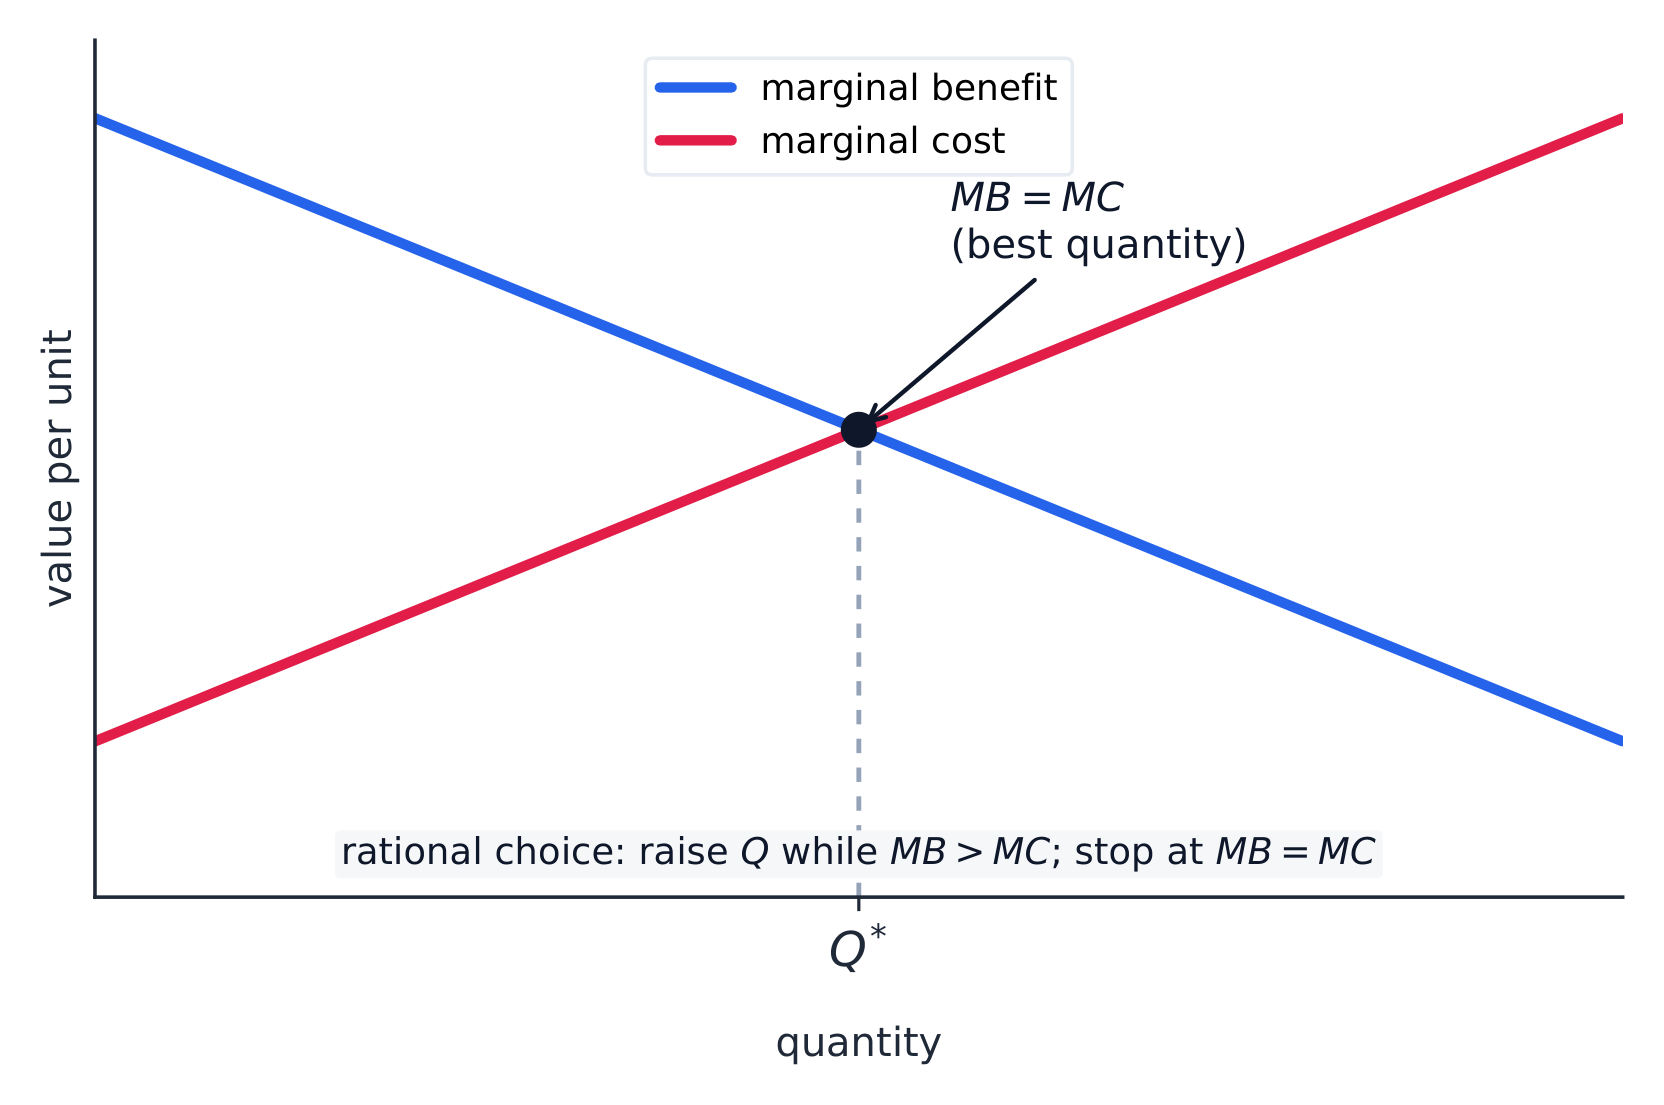
Most real decisions are not "all or nothing" but "a little more or a little less." Marginal analysis 边际分析 compares the marginal benefit 边际收益 (the benefit of one more unit) with the marginal cost 边际成本 (the cost of one more unit).
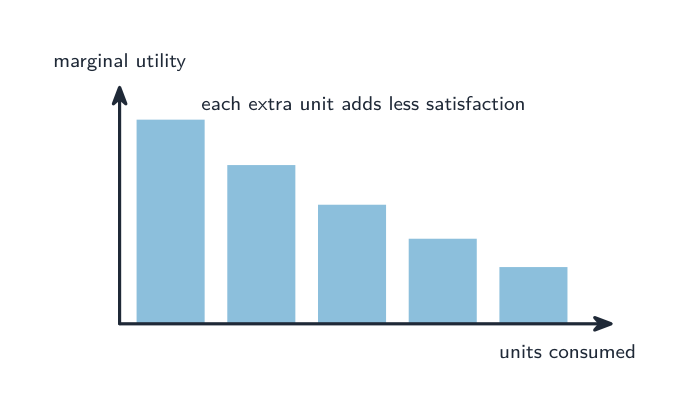
Each extra unit consumed gives less extra satisfaction (diminishing marginal utility)
Decision rule: keep doing the activity while marginal benefit $>$ marginal cost; stop where MB $=$ MC. That point maximizes net benefit (total benefit minus total cost).
Consumers get utility 效用 (satisfaction) from goods, but each extra unit usually gives less added satisfaction – the law of diminishing marginal utility 边际效用递减法则.
A consumer maximizes total utility by the utility-maximizing rule: spend so that the marginal utility per dollar is equal across all goods, $\dfrac{MU_x}{P_x}=\dfrac{MU_y}{P_y}$, using up the whole budget. If one good gives more utility per dollar, buy more of it until the ratios equalize.
Worked example. A consumer is choosing between good X ($MU_x=20$, $P_x=\$2$) and good Y ($MU_y=15$, $P_y=\$1$). The utility per dollar is $\tfrac{20}{2}=10$ for X but $\tfrac{15}{1}=15$ for Y. Y delivers more satisfaction per dollar, so the consumer should buy more Y and less X; as they do, $MU_y$ falls and $MU_x$ rises until $\tfrac{MU_x}{2}=\tfrac{MU_y}{1}$ and the budget is spent.
Exam skill: the "MB = MC" logic and the "equal MU-per-dollar" rule are tested repeatedly – be able to find the optimal quantity from a table and explain why it is optimal.
Rational choice: keep going while marginal benefit exceeds marginal cost, stopping where they are equal
Enduring Understanding (MKT-3): Individuals and firms respond to incentives and face constraints.
Learning Objective MKT-3.A:
a. Define (using graphs as appropriate) key terms and factors related to consumer decision making and the law of demand.
b. Explain (using graphs as appropriate) the relationship between price and quantity demanded and how buyers respond to incentives and constraints.
MKT-3.A.1 A well-defined system of property rights is necessary for the market system to function well.
MKT-3.A.2 Economic agents respond to incentives.
MKT-3.A.3 Individuals often respond to incentives, such as those presented by prices, but also face constraints, such as income, time, and legal and regulatory frameworks.
MKT-3.A.4 The law of demand suggests that a change in the own-price causes a change in quantity demanded in the opposite direction and a movement along a demand (marginal benefit) curve.
MKT-3.A.5 The conceptual relationship between price and quantity stated by the law of demand leads to downward-sloping demand curves explained by the income effect and substitution effect and/or by diminishing marginal utility.
MKT-3.A.6 The market demand curve (schedule) is derived from the summation of individual demand curves (schedules).
Learning Objective MKT-3.B: Explain (using graphs as appropriate) buyers' responses to changes in incentives and constraints.
MKT-3.B.1 Changes in the determinants of consumer demand can cause the demand curve to shift.
עברית
הבנה מתמשכת (MKT-3): אנשים וחברות מגיבים לתמרים וניצלים מגבלות.
מטרה לימודית MKT-3.A:
א. הגדר (באמצעות גרפים כאשר מתאים) מונחים וגורמים מרכזיים הקשורים לקבלת החלטות צרכניות ולחוק הביקוש.
ב. הסבר (באמצעות גרפים כאשר מתאים) את הקשר בין המחיר לכמות הביקוש וכיצם קונים מגיבים לתמרים ומגבלות.
MKT-3.A.1 מערכת זכויות רכוש מוגדרת היטב נדרשת כדי שהמערכת השוקית תפעל היטב.
MKT-3.A.2 סוכנים כלכליים מגיבים לתמרים.
MKT-3.A.3 לאנשים יש often מגיבים לתמרים, כגון אלו המוצעים על ידי מחירים, אך הם גם ניצלים מגבלות, כגון הכנסה, זמן והסגנונות החוקיים והווסתיים.
MKT-3.A.4 חוק הביקוש מציע כי שינוי במחיר עצמי גורם לשינוי בכמות הביקוש בכיוון הפוך ותנועה לאורך עקומת ביקוש (תועלת גבולית).
MKT-3.A.5 הקשר הקונספטואלי בין מחיר לכמות שנקבע על ידי חוק הביקוש מוביל לעקומות ביקוש יורדות המוסברות על ידי השפעת ההכנסה והשפעת ההחלפה ו/או על ידי סיפוק גבולי פוחת.
מטרת לימוד MKT-3.B: הסבר (באמצעות גרפים כאשר מתאים) את תגובות הקונים לשינויים בתמרים ובמגבלות.
MKT-3.B.1 שינויים בקובעי הביקוש הצרכניים יכולים לגרום להזזה של עקומת הביקוש.
Source: College Board AP Course and Exam Description · מקור: תיאור הקורס והמבחן של College Board AP
Shoppers in a market: demand shows how quantity demanded responds to priceSupply & demand: a shift raises P and Q
A market works only where property rights 产权 are well defined – owners can use, exclude others from, and trade their resources; without them, prices cannot coordinate exchange. Within that framework, the two forces are demand and supply.
Demand 需求 is the relationship between the price of a good and the quantity buyers are willing and able to buy. The law of demand 需求定律 says price and quantity demanded move in opposite directions, so the demand curve slopes downward. Two reasons: the substitution effect 替代效应 (when a good gets pricier, buyers switch to alternatives) and the income effect 收入效应 (a higher price shrinks real purchasing power).
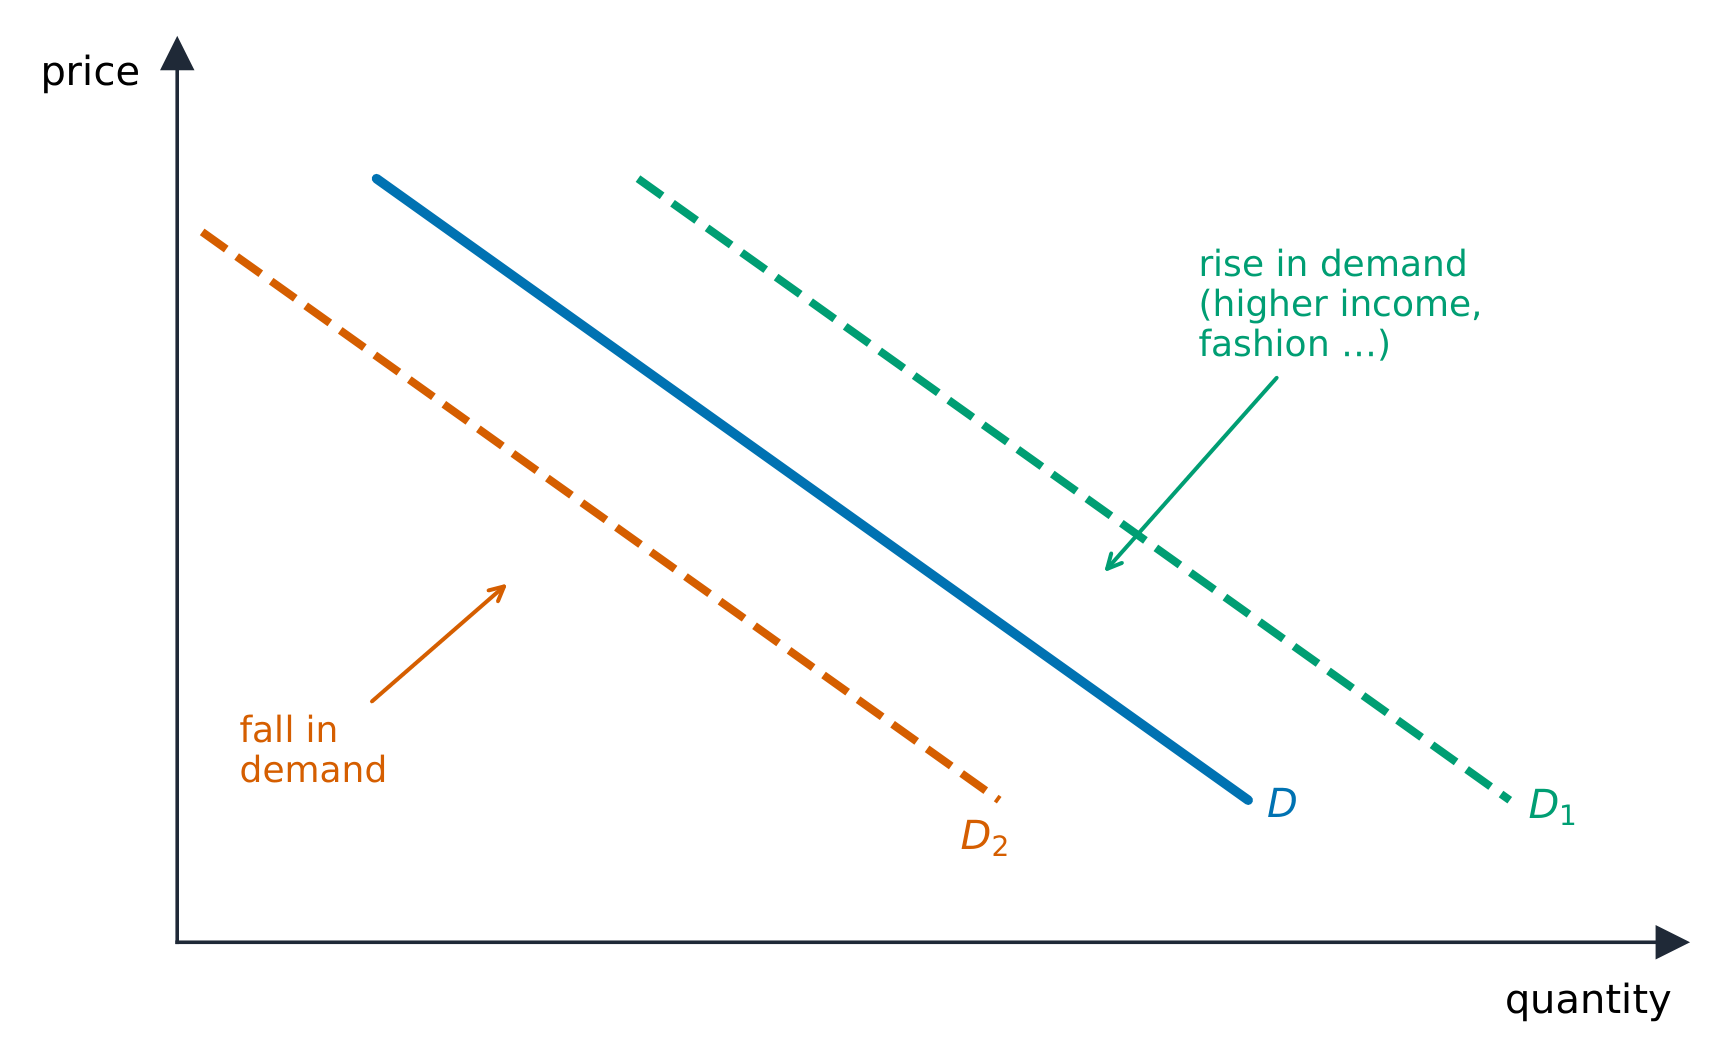
The demand curve slopes down; income, tastes, and related prices shift it
Distinguish a change in quantity demanded (a move along the curve, caused only by the good's own price) from a change in demand (a shift of the whole curve). Demand shifts with the determinants 决定因素, remembered as TRIBE:
Tastes/preferences,
Related goods – a rise in the price of a substitute 替代品 raises demand; a rise in the price of a complement 互补品 lowers it,
Income – for a normal good 正常商品 more income raises demand; for an inferior good 低档商品 it lowers it,
Buyers (number of consumers),
Expectations of future price or income.
The market demand curve is the horizontal summation 水平相加 of every individual buyer's demand curve – at each price, add up the quantities all buyers want. That is why more buyers (the B above) shifts the whole market curve to the right.
Explore · חקור
Shift demand and watch price and quantity · זזו בביקוש ותצפו במחיר ובכמות
The demand curve slopes down: lower price, more wanted. A change in income, tastes or related-good prices shifts the whole curve, moving the equilibrium. · עקומת הביקוש נוטה כלפי מטה: מחיר נמוך יותר, ביקוש גבוה יותר. שינוי בהכנסה, בטעמים או במחירי סחורות מקשרות מזיז את עקומת הביקוש כולה ומזיז את האיזון.
Enduring Understanding (MKT-3): Individuals and firms respond to incentives and face constraints.
Learning Objective MKT-3.C:
a. Define (using graphs as appropriate) the law of supply.
b. Explain (using graphs as appropriate) the relationship between price and quantity supplied.
MKT-3.C.1 A change in own-price causes a change in quantity supplied in the same direction and a movement along a supply curve.
MKT-3.C.2 The market supply curve (schedule) is derived from the summation of individual supply curves (schedules). The market supply curve is upward-sloping.
Learning Objective MKT-3.D: Explain (using graphs as appropriate) producers' (sellers') responses to changes in incentives and technology.
MKT-3.D.1 Changes in the determinants of supply can cause the supply curve to shift.
עברית
הבנה מתמשכת (MKT-3): אנשים וחברות מגיבים לתמרים וניצלים מגבלות.
מטרות למידה MKT-3.C:
א. הגדר (בעזרת גרפים כפי שמתאים) את חוק ההצעה.
ב. הסבר (בעזרת גרפים כפי שמתאים) על הקשר בין מחיר לכמות המוצעת.
MKT-3.C.1 שינוי במחיר עצמי גורם לשינוי בכמות המוצעת באותו כיוון ולתנועה לאורך עקומת האספקה.
MKT-3.C.2 עקומת האספקה בשוק (טבלת האספקה) נגזרת מהסיכום של עקומות האספקה הפרטיות (טבלאות האספקה). עקומת האספקה בשוק היא בעלת משיק חיובי.
מטרות למידה MKT-3.D: הסבר (בעזרת גרפים כפי שמתאים) על תגובת היצרנים (המוכרים) לשינויים בתמורות ובטכנולוגיה.
MKT-3.D.1 שינויים בקובעים את האספקה יכולים לגרום להזזה של עקומת האספקה.
Source: College Board AP Course and Exam Description · מקור: תיאור הקורס והמבחן של College Board AP
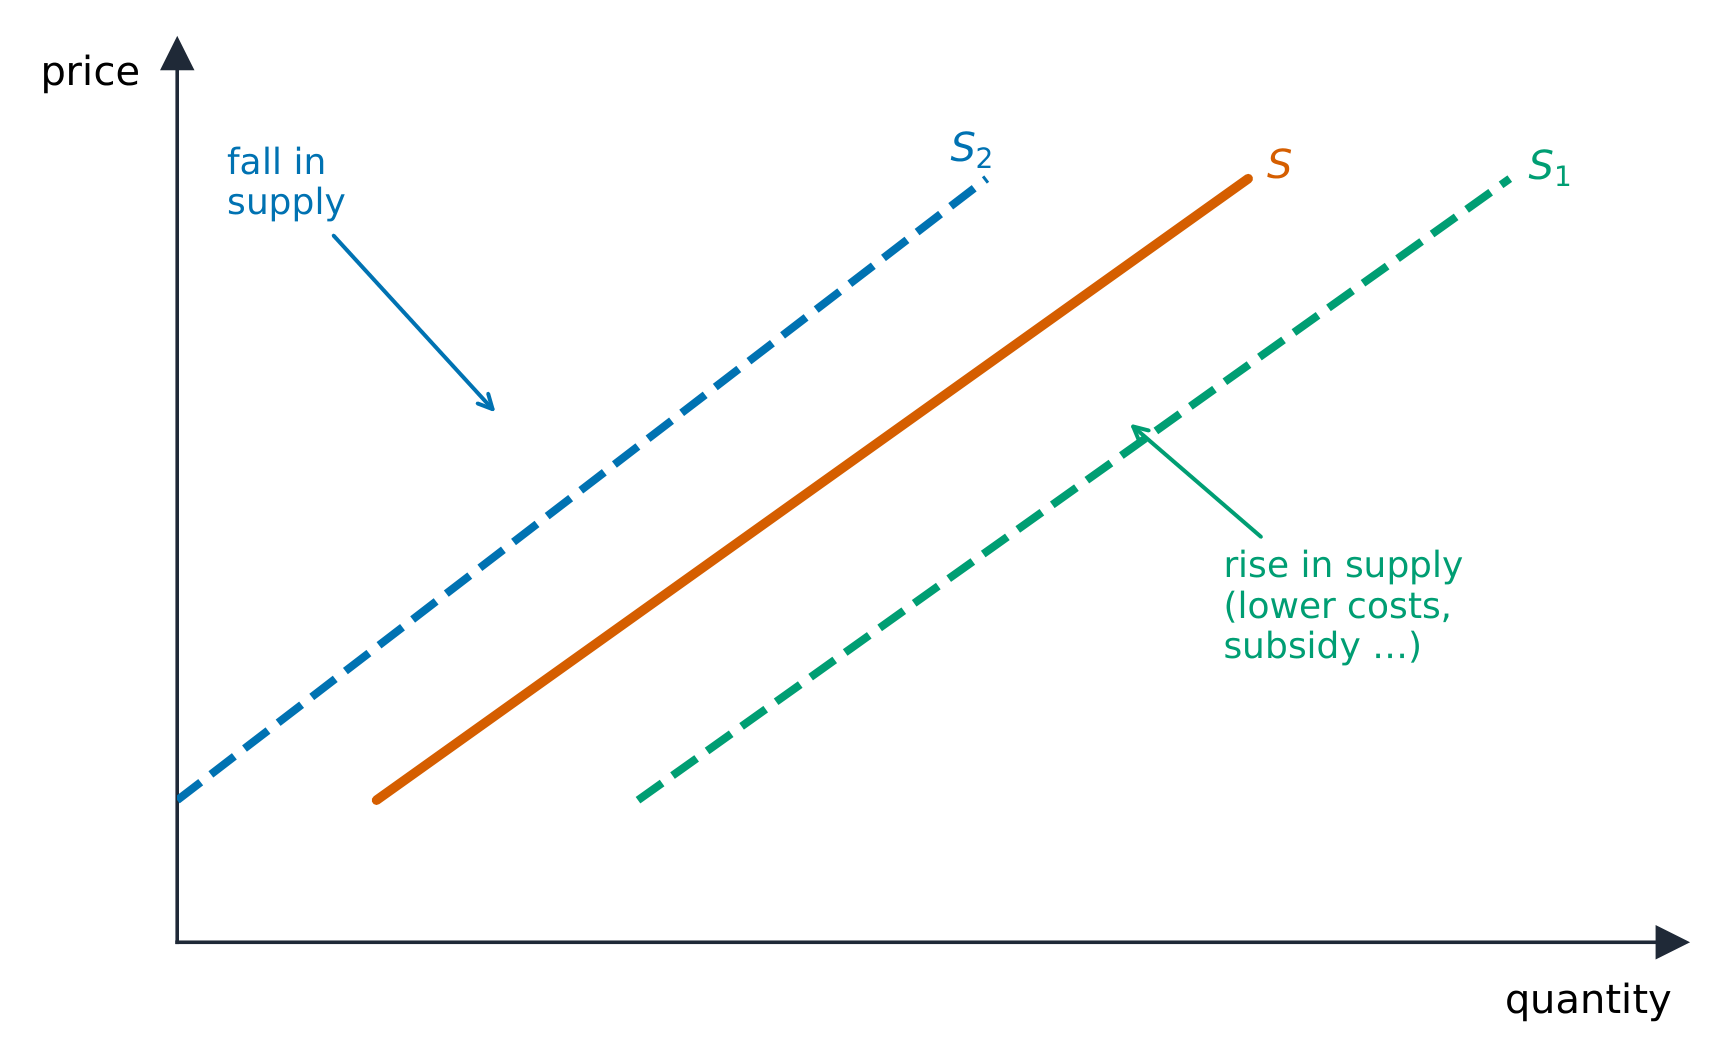
A shift in supply
Supply 供给 is the relationship between price and the quantity sellers will offer. The law of supply 供给定律: price and quantity supplied move in the same direction, so the supply curve slopes upward (higher prices cover higher marginal costs and reward more output).
The supply curve slopes up; costs, technology, tax, and subsidy shift it
Again separate a change in quantity supplied (movement along the curve, from the good's own price) from a change in supply (a shift). Supply shifts with input prices, technology, taxes and subsidies 补贴, prices of other goods a firm could make, number of sellers, and expectations. Just like demand, the market supply curve is the horizontal sum of individual firms' supply curves – add the quantities all firms offer at each price – so more sellers shifts market supply to the right.
Exam skill: on the free-response section you must draw correctly labeled supply-and-demand graphs and shift the right curve in the right direction – decide first whether the event changes an "own price" (move along) or a determinant (shift).
Enduring Understanding (MKT-3): Individuals and firms respond to incentives and face constraints.
Learning Objective MKT-3.E:
a. Define measures of elasticity.
b. Explain (using graphs where appropriate) measures of elasticity and the impact of a given price change on total revenue or total expenditure.
c. Calculate (using data from a graph or a table as appropriate) measures of elasticity.
MKT-3.E.1 Economists use the concept of elasticity to measure the magnitude of percentage changes in quantity owing to any given changes in the own-price, income, and prices of related goods.
MKT-3.E.2 Price elasticity of demand is measured by the percentage change in quantity demanded divided by the percentage change in price or the responsiveness of the quantity demanded to changes in price. Elasticity varies along a linear demand curve, meaning slope is not elasticity.
MKT-3.E.3 Ranges of values of elasticity of demand are described as elastic or inelastic with the separating benchmark being a magnitude of 1, where the change in the price and the change in the quantity demanded are proportional.
a. When the magnitude of the value of elasticity is greater than 1, the demand is described as being elastic with respect to that price in the range of the given change.
b. When the magnitude of the value of elasticity is less than 1, the demand is described as being inelastic with respect to that price in the range of the given change.
c. When the magnitude of the value of elasticity is equal to 1, the demand is described as being unit elastic with respect to that price in the range of the given change.
MKT-3.E.4 The price elasticity of demand depends on certain factors such as the availability of substitutes.
MKT-3.E.5 The impact of a given price change on total revenue or total expenditure will depend on whether demand is elastic, inelastic, or unit elastic.
עברית
הבנה מתמשכת (MKT-3): אנשים וחברות מגיבים לתמרים וניצלים מגבלות.
מטרות למידה MKT-3.E:
א. הגדרת מדדי אלסטיות.
ב. הסבר (בעזרת גרפים כפי שמתאים) על מדדי אלסטיות ועל השפעתו של שינוי מחיר נתון על הכנסה כוללת או הוצאה כוללת.
ג. חישוב (בעזרת נתונים מגרף או מטבלה כפי שמתאים) של מדדי אלסטיות.
MKT-3.E.1 כלכלנים משתמשים במונח האלסטיות כדי למדוד את גודל השינויים באחוזים בכמות כתוצאה משינויים כלשהם במחיר עצמי, בהכנסה ובמחירים של סחורות קשורות.
MKT-3.E.2 אלסטיות מחיר בביקוש נמדדת על ידי אחוז השינוי בכמות הביקוש חלקי אחוז השינוי במחיר, או על ידי רגישות הכמות הביקוש לשינויים במחיר. האלסטיות משתנה לאורך עקומת ביקוש ליניארית, כלומר המשיק אינו זהה לאלסטיות.
MKT-3.E.3 טווחי ערכים של אלסטיות ביקוש מתוארים כאלסטיים או אי-אלסטיים, כאשר סף ההפרדה הוא גודל של 1, במקרה בו השינוי במחיר והשינוי בכמות הביקוש הם פרופורציונליים.
א. כאשר הגודל הערכי של האלסטיות גדול מ-1, הביקוש מתואר כאלסטי ביחס למחיר זה בטווח השינוי הנתון.
ב. כאשר הגודל הערכי של האלסטיות קטן מ-1, הביקוש מתואר כאי-אלסטי ביחס למחיר זה בטווח השינוי הנתון.
ג. כאשר הגודל הערכי של האלסטיות שווה ל-1, הביקוש מתואר כאלסטיות יחידית ביחס למחיר זה בטווח השינוי הנתון.
MKT-3.E.4 אלסטיות המחיר בביקוש תלויה בגורמים מסוימים, כמו זמינות החלופות.
MKT-3.E.5 השפעתו של שינוי מחיר נתון על הכנסה כוללת או הוצאה כוללת תלויה בביקוש הוא אלסטי, אי-אלסטי או בעל אלסטיות יחידית.
Source: College Board AP Course and Exam Description · מקור: תיאור הקורס והמבחן של College Board AP
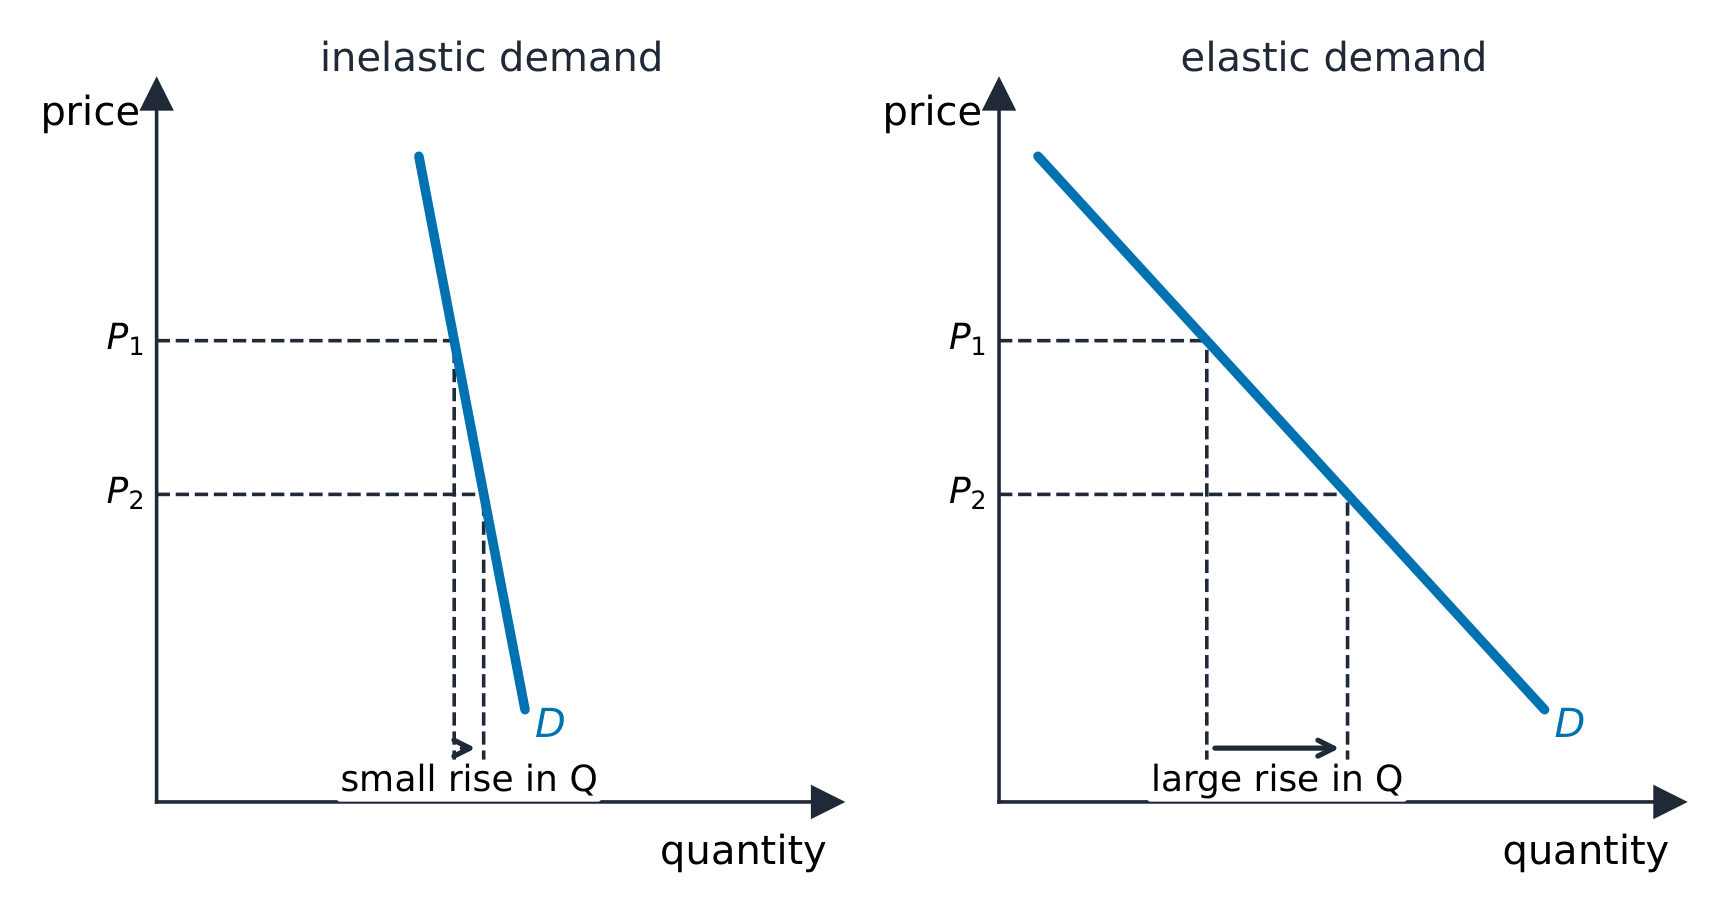
Price elasticity of demand
Price elasticity of demand 需求价格弹性 measures how responsive quantity demanded is to a price change:
Demand is more elastic when there are more substitutes, the good is a luxury, it takes a large share of income, or buyers have more time to adjust. Elasticity links to total revenue 总收入 ($P\times Q$): if demand is elastic, a price cut raises revenue; if inelastic, a price cut lowers it. Along a straight-line demand curve, elasticity falls as you move down (elastic on top, inelastic at the bottom).
Worked example. A price rise from $\$10$ to $\$12$ (a $+20\%$ change) cuts quantity demanded from $100$ to $85$ (a $-15\%$ change). Then $E_d=\left|\dfrac{-15\%}{20\%}\right|=0.75<1$, so demand is inelastic. Because it is inelastic, the price rise raises total revenue: from $\$10\times100=\$1000$ to $\$12\times85=\$1020$.
Explore · חקור
Stretch price and measure elasticity · מתיחו את המחיר ומדדו אלסטיות
Price elasticity of demand is how strongly quantity responds to price. A steep curve is inelastic (small response); a shallow one is elastic (large response). · אלסטיות מחיר בביקוש היא עד כמה הכמות מגיבה לשינוי במחיר. עקומה תלולה היא אלסטיה (תגובה קטנה); עקומה שטוחה היא אלסטית (תגובה גדולה).
Price elasticity of demand/praɪs ɪlæˈstɪsɪti ɒv dɪˈmænd/
אלסטיות מחיר של ביקוש
elastic/ɪˈlæstɪk/
גמיש
inelastic/ɪnɪˈlæstɪk/
בלתי גמיש
total revenue/ˈtəʊtl ˈrevənjuː/
הכנסה כוללת
2.4
Price Elasticity of Supply
Syllabus · סיילבוס
English
Enduring Understanding (MKT-3): Individuals and firms respond to incentives and face constraints.
Learning Objective MKT-3.E:
a. Define measures of elasticity.
b. Explain (using graphs where appropriate) measures of elasticity and the impact of a given price change on total revenue or total expenditure.
c. Calculate (using data from a graph or a table as appropriate) measures of elasticity.
MKT-3.E.6 Price elasticity of supply is measured by the percentage change in quantity supplied divided by the percentage change in price, or the responsiveness of the quantity supplied to changes in price.
MKT-3.E.7 Ranges of values of elasticity of supply are described as elastic or inelastic with the separating benchmark being a magnitude of 1, where the change in the price and the change in the quantity supplied are proportional.
a. When the magnitude of the value of elasticity is greater than 1, the supply is described as being elastic with respect to that price in the range of the given change.
b. When the magnitude of the value of elasticity is less than 1, the supply is described as being inelastic with respect to that price in the range of the given change.
c. When the magnitude of the value of elasticity is equal to 1, the supply is described as being unit elastic with respect to that price in the range of the given change.
MKT-3.E.8 The price elasticity of supply depends on certain factors such as the price of alternative inputs.
עברית
הבנה מתמשכת (MKT-3): אנשים וחברות מגיבים לתמרים וניצלים מגבלות.
מטרות למידה MKT-3.E:
א. הגדרת מדדי אלסטיות.
ב. הסבר (בעזרת גרפים כפי שמתאים) על מדדי אלסטיות ועל השפעתו של שינוי מחיר נתון על הכנסה כוללת או הוצאה כוללת.
ג. חישוב (בעזרת נתונים מגרף או מטבלה כפי שמתאים) של מדדי אלסטיות.
MKT-3.E.6 אלסטיות אספקה במחיר נמדדת על ידי השינוי באחוז בכמות המוצעת מחולק בשינוי באחוז במחיר, או את רגישות הכמות המוצעת לשינויים במחיר.
MKT-3.E.7 טווחי ערכים של אלסטיות אספקה מתוארים כאלסטיים או אינאלסטיים, כאשר סף ההפרדה הוא גודל של 1, שבו השינוי במחיר והשינוי בכמות המוצעת הם פרופורציונליים.
א. כאשר הגודל העמתי של ערך האלסטיות גדול מ-1, האספקה מתוארת כאלסטית ביחס למחיר זה בטווח השינוי הנתון.
ב. כאשר הגודל העמתי של ערך האלסטיות קטן מ-1, האספקה מתוארת כאינאלסטית ביחס למחיר זה בטווח השינוי הנתון.
ג. כאשר הגודל העמתי של ערך האלסטיות שווה ל-1, האספקה מתוארת כאלסטיות יחידתית ביחס למחיר זה בטווח השינוי הנתון.
MKT-3.E.8 אלסטיות האספקה במחיר תלויה בגורמים מסוימים, כגון מחיר התקנים חלופיים.
Source: College Board AP Course and Exam Description · מקור: תיאור הקורס והמבחן של College Board AP
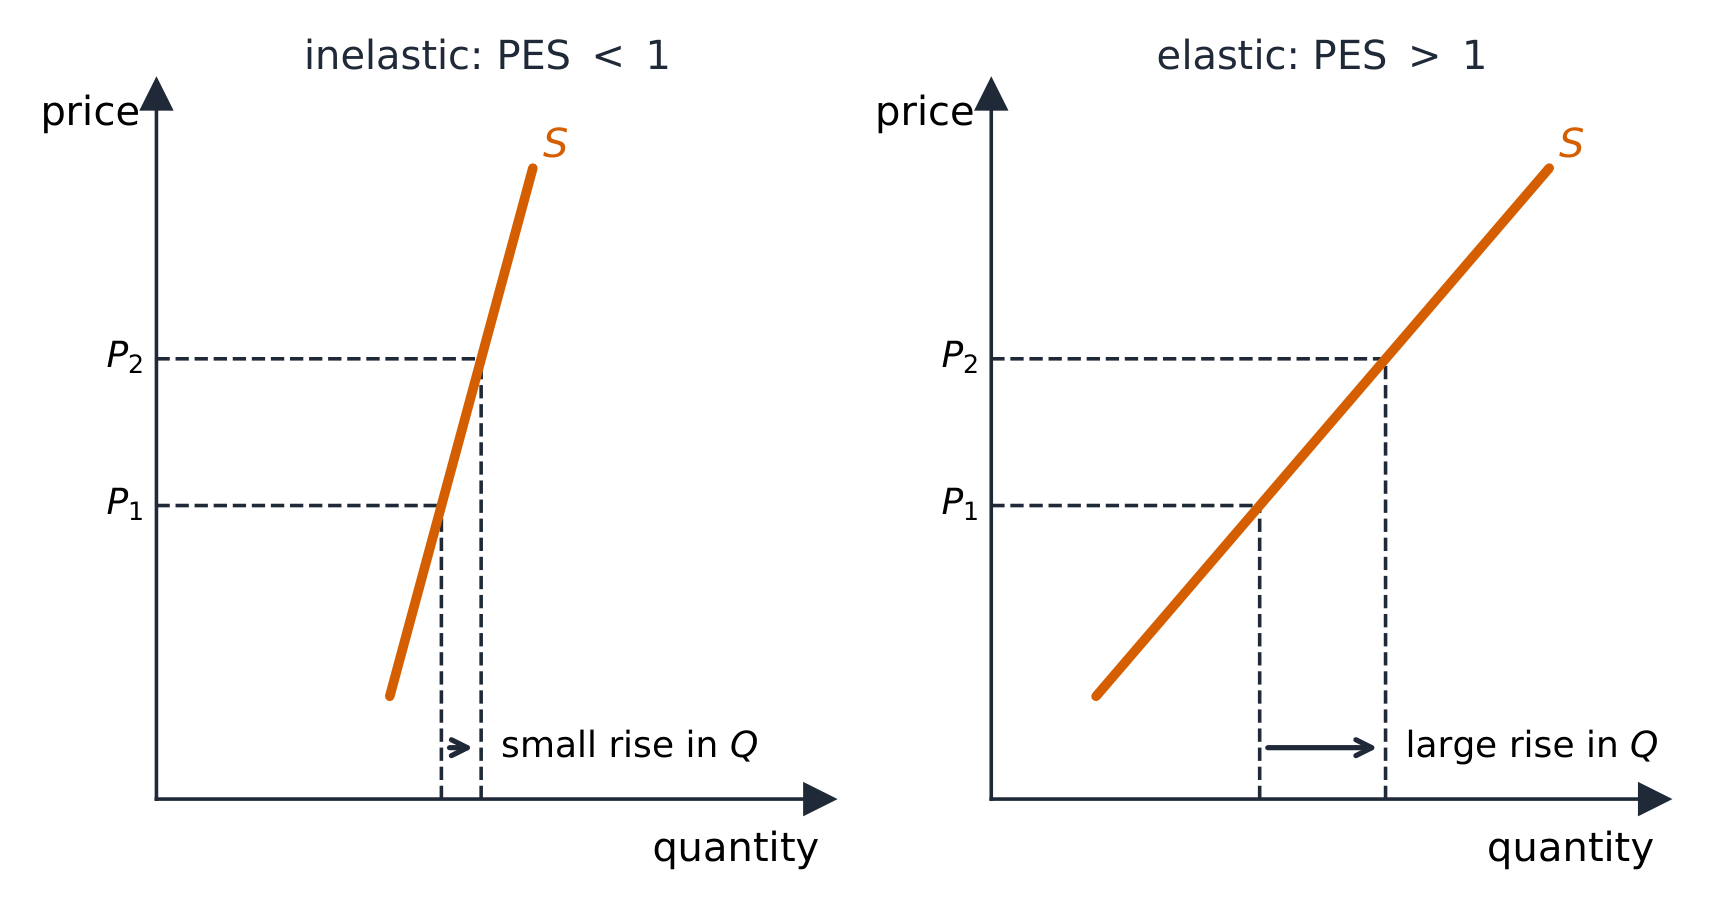
Price elasticity of supply 供给价格弹性, $E_s=\dfrac{\%\ \Delta\ Q_s}{\%\ \Delta\ P}$, measures how responsive sellers are. Supply is more elastic when firms can adjust output easily – spare capacity, storable goods, and above all more time (supply is more elastic in the long run than the short run).
The same price rise gives a small supply response when PES is below 1, a large one above 1
Price elasticity of supply/praɪs ɪlæˈstɪsɪti ɒv səˈplaɪ/
אלסטיות מחיר של הצעה
2.5
Other Elasticities
Syllabus · סיילבוס
English
Enduring Understanding (MKT-3): Individuals and firms respond to incentives and face constraints.
Learning Objective MKT-3.E:
a. Define measures of elasticity.
b. Explain (using graphs where appropriate) measures of elasticity and the impact of a given price change on total revenue or total expenditure.
c. Calculate (using data from a graph or a table as appropriate) measures of elasticity.
MKT-3.E.9 Elasticity can be measured for any determinant of demand or supply, not just the price.
MKT-3.E.10 Income elasticity of demand is measured by the percentage change in the quantity demanded divided by the percentage change in consumers' income. Economists use the income elasticity of demand to determine whether a good is normal or inferior.
MKT-3.E.11 Cross-price elasticity of demand is measured by the percentage change in the quantity demanded of one good divided by the percentage change in the price of another good. Economists use the cross-price elasticity of demand to determine whether goods are substitutes, complements, or not related.
עברית
הבנה מתמשכת (MKT-3): אנשים וחברות מגיבים לתמרים וניצלים מגבלות.
מטרות למידה MKT-3.E:
א. הגדרת מדדי אלסטיות.
ב. הסבר (בעזרת גרפים כפי שמתאים) על מדדי אלסטיות ועל השפעתו של שינוי מחיר נתון על הכנסה כוללת או הוצאה כוללת.
ג. חישוב (בעזרת נתונים מגרף או מטבלה כפי שמתאים) של מדדי אלסטיות.
MKT-3.E.9 ניתן למדוד אלסטיות לכל קובע בביקוש או באספקה, ולא רק למחיר.
MKT-3.E.10 אלסטיות ביקוש בהכנסה נמדדת על ידי השינוי באחוז בכמות הנדרשת מחולק בשינוי באחוז בהכנסת הצרכנים. כלכלנים משתמשים באלסטיות ביקוש בהכנסה כדי לקבוע האם מוצר הוא רגיל או נחות.
MKT-3.E.11 אלסטיות ביקוש צולבת נמדדת על ידי השינוי באחוז בכמות הנדרשת ממוצר אחד מחולק בשינוי באחוז במחיר של מוצר אחר. כלכלנים משתמשים באלסטיות ביקוש צולבת כדי לקבוע האם מוצרים הם תחליפים, משלים או שאינם קשורים זה לזה.
Source: College Board AP Course and Exam Description · מקור: תיאור הקורס והמבחן של College Board AP
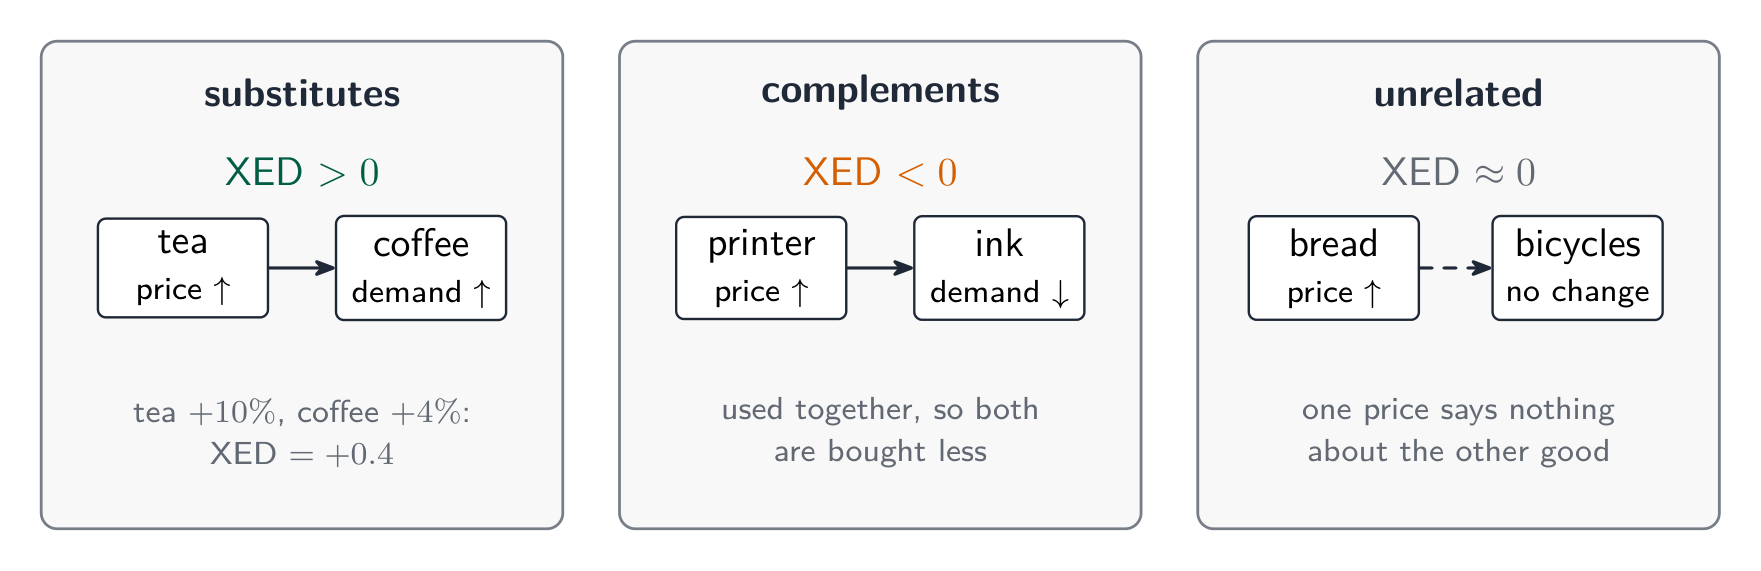
Cross-price elasticity 交叉价格弹性$=\dfrac{\%\ \Delta\ Q_x}{\%\ \Delta\ P_y}$: positive for substitutes, negative for complements – the sign tells you the relationship.
Income elasticity 收入弹性$=\dfrac{\%\ \Delta\ Q}{\%\ \Delta\ \text{income}}$: positive for normal goods (and $>1$ for luxuries), negative for inferior goods.
Worked example. When the price of coffee rises $10\%$, the quantity of tea demanded rises $6\%$: cross-price elasticity $=\dfrac{+6\%}{+10\%}=+0.6$. The positive sign confirms coffee and tea are substitutes. If instead a $5\%$ rise in incomes raised restaurant-meal demand $10\%$, income elasticity $=\dfrac{10\%}{5\%}=+2$ – a normal good, and a luxury since it exceeds $1$.
Cross elasticity: positive for substitutes, negative for complements
Exam skill: you are expected to compute an elasticity, classify it, and read a sign as evidence of substitute/complement or normal/inferior.
Market Equilibrium, Consumer Surplus, and Producer Surplus
Syllabus · סיילבוס
English
Enduring Understanding (MKT-4): Although equilibria are stable, an economy can move from one equilibrium to another if market conditions change.
Learning Objective MKT-4.A:
a. Define (using graphs as appropriate) market equilibrium, consumer surplus, and producer surplus.
b. Explain (using graphs as appropriate) how equilibrium price, quantity, consumer surplus, and producer surplus for a good or service are determined.
c. Calculate (using data from a graph or table as appropriate) areas of consumer surplus and producer surplus at equilibrium.
MKT-4.A.1 The supply-demand model is a tool for understanding what factors influence prices and quantities and why prices and quantities might differ across markets or change over time.
MKT-4.A.2 In a perfectly competitive market, equilibrium is achieved (and markets clear with no shortages or surpluses) when the price of a good or service brings the quantity supplied and quantity demanded into balance, in the sense that buyers wish to purchase the same quantity that sellers wish to provide.
MKT-4.A.3 Equilibrium price provides information to economic decision-makers to guide resource allocation.
MKT-4.A.4 Economists use consumer surplus and producer surplus to measure the benefits markets create to buyers and sellers and understand market efficiency.
MKT-4.A.5 Market equilibrium maximizes total economic surplus in the absence of market failures, meaning that perfectly competitive markets are efficient.
עברית
הבנה מתמשכת (MKT-4): למרות שהשיווי משקע יציב, הכלכלה יכולה לעבור משיווי משקע אחד לשני אם תנאי השוק משתנים.
מטרות למידה MKT-4.A:
א. הגדר (באמצעות גרפים כמתאים) שיווי משקע בשוק, עודף צרכנים ועודף יצרנים.
ב. הסבר (באמצעות גרפים כמתאים) כיצד נקבעו מחיר שיווי המשקע, כמות, עודף צרכנים ועודף יצרנים עבור מוצר או שירות.
ג. חשב (באמצעות נתונים מגרף או טבלה כמתאים) את שטחי עודף הצרכנים ועודף היצרנים בשיווי משקע.
MKT-4.A.1 דגם הביקוש והאספקה הוא כלי להבנת מהם הגורמים המשפיעים על המחירים והכמויות ולמה המחירים והכמויות עשויים להשתנות בין שווקים או לאורך זמן.
MKT-4.A.2 בשוק תחרות מושלם, שיווי משקע מושג ( ושוק מתנקה ללא חוסר או עודף) כאשר המחיר של מוצר או שירות מיישר את הכמות המוצעת עם הכמות הנדרשת, במובן שבו הקונים מעוניינים לקנות את אותה כמות שהמוכרים מעוניינים לספק.
MKT-4.A.3 מחיר שיווי המשקע מספק מידע לקובעי החלטות כלכליים כדי להנחות את ההקצאת המשאבים.
MKT-4.A.4 כלכלנים משתמשים בעודפי צרכנים ויצרנים כדי למדוד את היתרונות שהשווקים יוצרים לקונים ולמוכרים ולהבין את יעילות השוק.
MKT-4.A.5 שיווי משקל מקסימיזציה של הסכום הכלכלי הכולל בהיעדר כישלונות שוק, כלומר ששווקים תחרותיים מושלמים הם יעילים.
Source: College Board AP Course and Exam Description · מקור: תיאור הקורס והמבחן של College Board AP
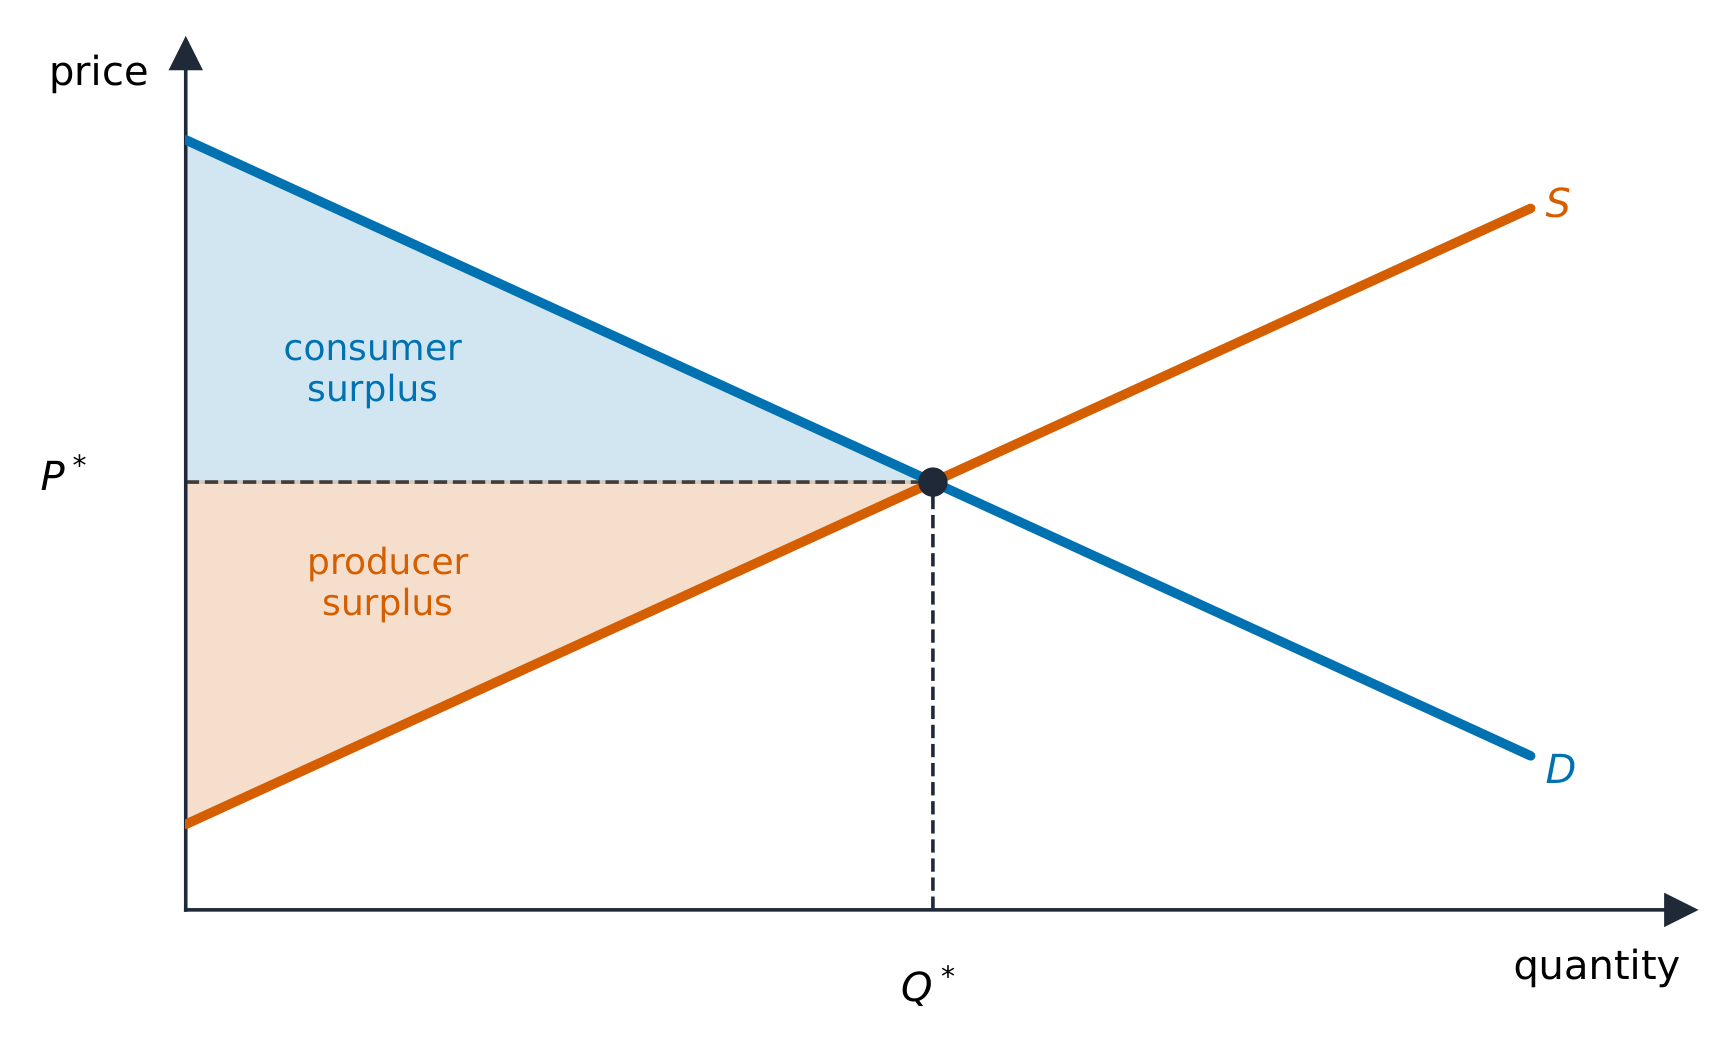
Consumer & producer surplus
Equilibrium 均衡 is where supply meets demand: the equilibrium price clears the market, so quantity demanded equals quantity supplied and there is no shortage or surplus.
Consumer surplus and producer surplus at the market equilibrium
Consumer surplus 消费者剩余 is the area below the demand curve and above the price – the gap between what buyers would pay and what they do pay.
Producer surplus 生产者剩余 is the area above the supply curve and below the price – the gap between the price and sellers' minimum acceptable price.
Their sum is total surplus 总剩余, and the competitive equilibrium maximizes it – this is why free markets are called allocatively efficient 配置有效率.
A real market: many buyers and sellers meet, and price settles where the quantity wanted equals the quantity offered
Explore · חקור
See consumer and producer surplus · ראו את העודף הצרכני ועודף המייצר
At equilibrium the market clears. The gap between what buyers would pay and the price is consumer surplus; the gap above sellers' costs is producer surplus. · באיזון השוק מתברר. הפער בין מה שקונים היו מוכנים לשלם לבין המחיר הוא העודף הצרכני; הפער מעל עלויות המוכרים הוא העודף המייצר.
Enduring Understanding (MKT-4): Although equilibria are stable, an economy can move from one equilibrium to another if market conditions change.
Learning Objective MKT-4.B:
a. Define a surplus and shortage.
b. Explain (using graphs where appropriate) how changes in underlying conditions and shocks to a competitive market can alter price, quantity, consumer surplus, and producer surplus.
c. Calculate (using data from a graph or table as appropriate) changes in price, quantity, consumer surplus, and producer surplus in response to changes in market conditions or market disequilibrium.
MKT-4.B.1 Whenever markets experience imbalances—creating disequilibrium prices and quantities, surpluses, and shortages—market forces drive price and quantity toward equilibrium.
MKT-4.B.2 Factors that shift the market demand and market supply curves cause price, quantity, consumer surplus, producer surplus, and total economic surplus (within that market) to change. The impact of the change depends on the price elasticities of demand and supply.
עברית
הבנה מתמשכת (MKT-4): למרות שהשיווי משקע יציב, הכלכלה יכולה לעבור משיווי משקע אחד לשני אם תנאי השוק משתנים.
מטרות למידה MKT-4.B:
א. הגדר עודף וחסר.
ב. הסבר (באמצעות גרפים כאשר מתאים) כיצד שינויים בתנאים הבסיסיים והמתחות בשוק תחרותי יכולים לשנות מחיר, כמות, עודף צרכנים ועודף יצרנים.
ג. חשבון (באמצעות נתונים מגרף או טבלה כאשר מתאים) של שינויים במחיר, בכמות, בעודף צרכנים ובעודף יצרנים כתוצאה משינויים בתנאי השוק או מאי-שיווי משקל.
MKT-4.B.1 בכל פעם שהשווקים חווים איזונים— היוצרים מחירים וכמויות לא-שיווי משקל, עודפי ומחסורים—כוחות השוק מניעים את המחיר והכמות לכיוון שיווי משקל.
MKT-4.B.2 גורמים המשנים את עקומי הביקוש וההיצע בשוק גורמים לשינוי במחיר, בכמות, בעודף צרכנים, בעודף יצרנים ובסכום הכלכלי הכולל (בתוך השוק). ההשפעה של השינוי תלושה בגמישות הביקוש וההיצע.
Source: College Board AP Course and Exam Description · מקור: תיאור הקורס והמבחן של College Board AP
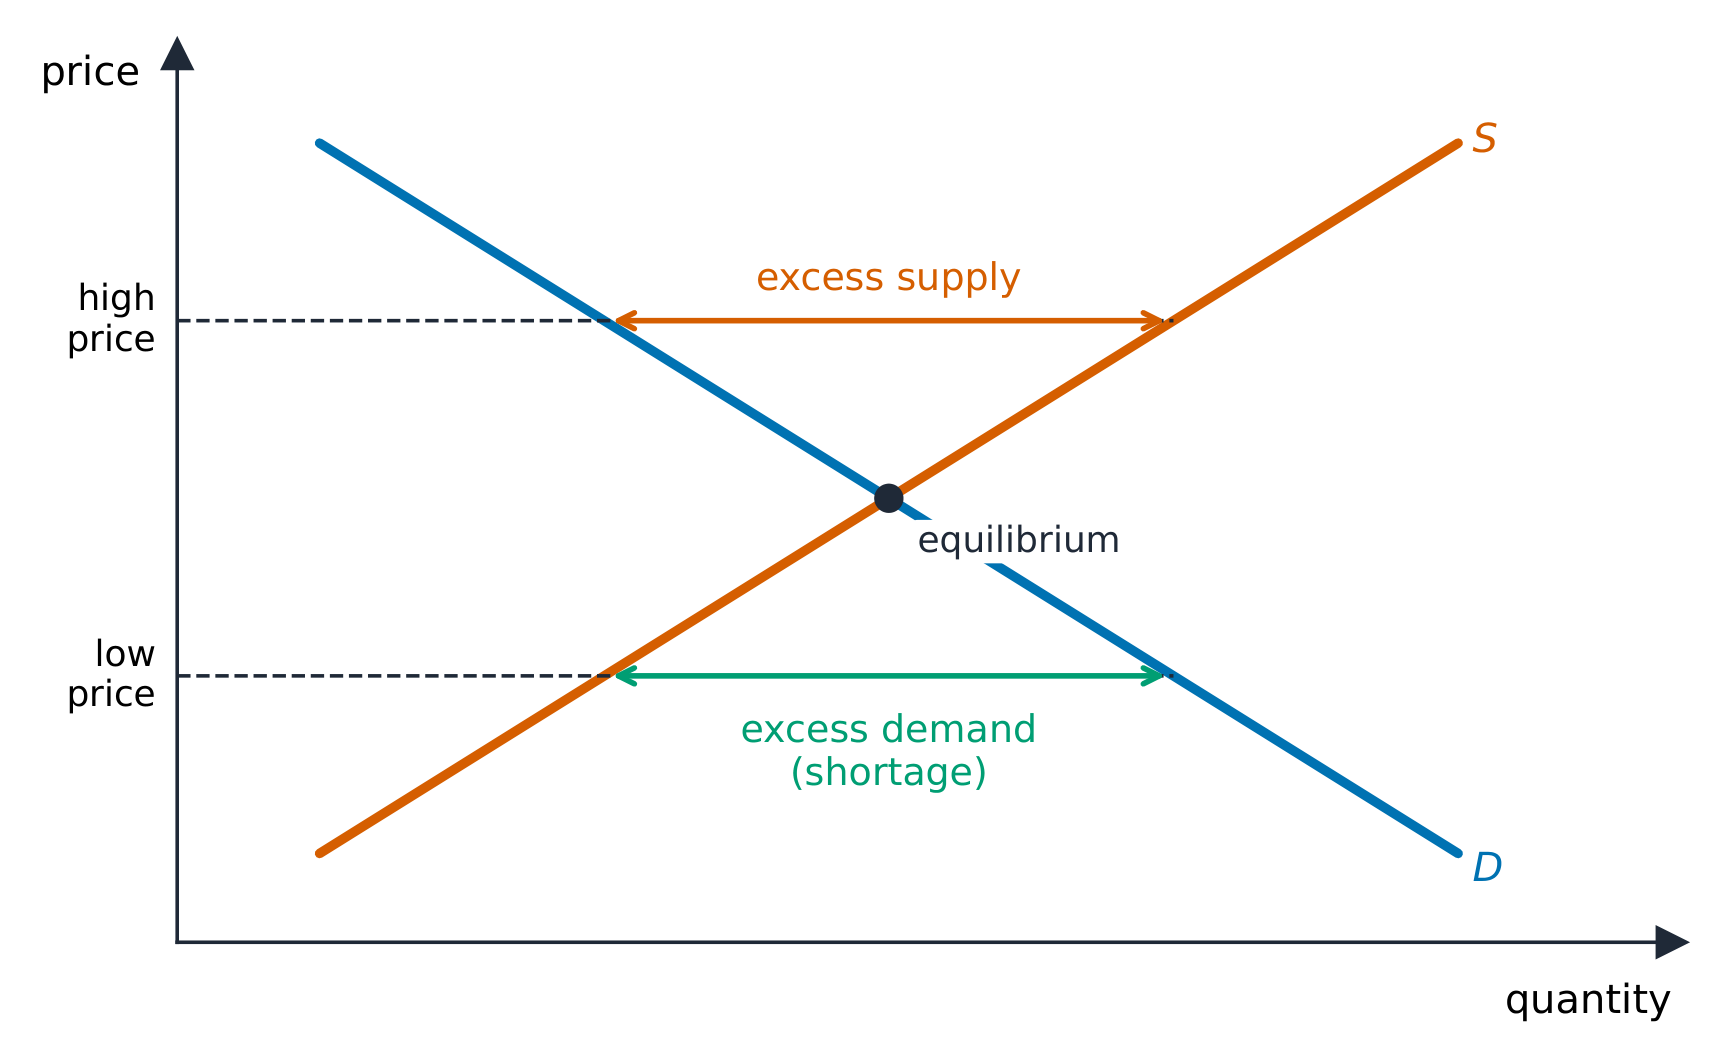
Away from equilibrium the market self-corrects: above the equilibrium price there is a surplus 过剩 (excess supply) that pushes price down; below it a shortage 短缺 (excess demand) that pushes price up.
Above equilibrium there is excess supply; below it, excess demand
When a determinant shifts a curve, the equilibrium moves predictably. A single shift gives a definite result for both price and quantity. When both curves shift, one of price or quantity is indeterminate (depends on the relative sizes of the shifts) – a favorite exam trap. Work these out by drawing the shifts.
Enduring Understanding (POL-1): Government policies influence consumer and producer behavior and therefore affect market outcomes.
Learning Objective POL-1.A:
a. Define forms of government price and quantity intervention.
b. Explain (using graphs where appropriate) how government policies alter consumer and producer behaviors that influence incentives and therefore affect outcomes.
c. Calculate (using data from a graph or table where appropriate) changes in market outcomes resulting from government policies.
POL-1.A.1 Some government policies, such as price floors, price ceilings, and other forms of price and quantity regulation, affect incentives and outcomes in all market structures.
POL-1.A.2 Governments use taxes and subsidies to change incentives in ways that influence consumer and producer behavior, shifting the supply and demand curves accordingly.
POL-1.A.3 Taxes and subsidies affect government revenues or costs.
POL-1.A.4 Government intervention in a market producing the efficient quantity through taxes, subsidies, price controls, or quantity controls can only decrease allocative efficiency.
POL-1.A.5 Deadweight loss represents the losses to buyers and sellers as a result of government intervention in an efficient market.
POL-1.A.6 The incidence of taxes and subsidies imposed on goods traded in perfectly competitive markets depends on the elasticity of supply and demand.
עברית
הבנה נשנית (POL-1): מדיניות ממשלתית משפיעה על התנהגות צרכנים ויצרנים ולכן משפיעה על תוצאות השוק.
מטרת למידה POL-1.A:
א. הגדרת צורות התערבות ממשלתית במחיר ובכמות.
ב. הסבר (באמצעות גרפים כאשר מתאים) כיצד מדיניות ממשלתית משנה התנהגות של צרכנים ויצרנים המשפיעה על זרימים ולכן משפיעה על תוצאות.
ג. חשבון (באמצעות נתונים מגרף או טבלה כאשר מתאים) של שינויים בתוצאות השוק הנובעים ממדיניות ממשלתית.
POL-1.A.1 חלק ממדיניות הממשלה, כמו רצפת מחיר, תקרת מחיר וצורות אחרות של ויסות מחיר וכמות, משפיעות על זרימים ותוצאות בכל מבני השוק.
POL-1.A.2 ממשלות משתמשות במסים ובסבסודים כדי לשנות זרימים באופן המשפיע על התנהגות צרכנים ויצרנים, ומשנה בהתאם את עקומי ההיצע והביקוש.
POL-1.A.3 מסים וסבסודים משפיעים על הכנסות או עלויות הממשלה.
POL-1.A.4 התערבות ממשלתית בשוק המייצר את הכמות היעילה באמצעות מסים, סבסודים, בקרת מחיר או בקרת כמות יכולה רק להפחית את היעילות הקצבית.
POL-1.A.5 אובדן משקול (deadweight loss) מייצג את ההפסדים לצרכנים וליצרנים כתוצאה מהתערבות ממשלתית בשוק יעיל.
Source: College Board AP Course and Exam Description · מקור: תיאור הקורס והמבחן של College Board AP
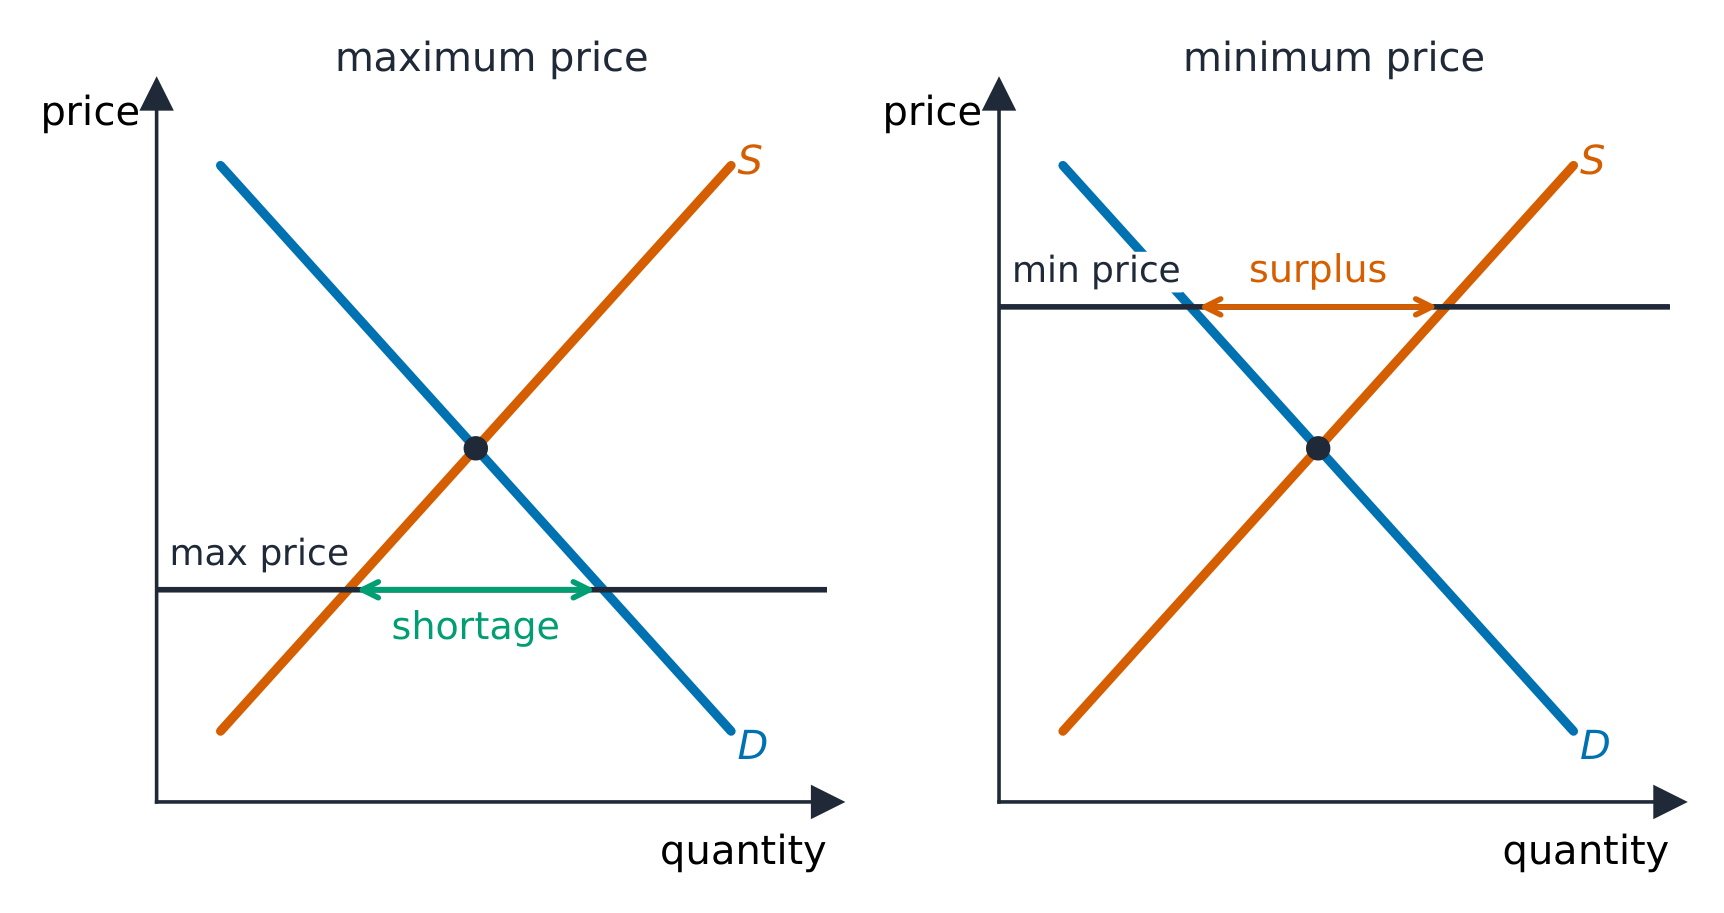
A price ceiling causes a shortageA tax and the deadweight loss
Governments intervene, usually reducing total surplus:
A price ceiling causes a shortage; a price floor causes a surplus
A price ceiling 价格上限 (a legal maximum, like rent control) below equilibrium causes a persistent shortage.
A price floor 价格下限 (a legal minimum, like a minimum wage) above equilibrium causes a persistent surplus.
An excise tax 消费税 shifts supply up by the tax; the burden (tax incidence 税收归宿) falls more heavily on whichever side is more inelastic.
A subsidy shifts supply down, raising quantity.
Each of these creates deadweight loss 无谓损失 – mutually beneficial trades that no longer happen, shown as a triangle between the curves at the new quantity.
Exam skill: on a graph, be able to shade consumer surplus, producer surplus, government revenue from a tax, and deadweight loss, and say who bears the tax and why.
Explore · חקור
Add a tax or price control · הוסיפו מס או בקרת מחירים
A price ceiling below equilibrium causes shortages; a tax drives a wedge between what buyers pay and sellers get, shrinking the quantity traded. · ** תקרת מחיר** מתחת לאיזון גורמת לחוסר; מס יוצר פער בין מה שקונים משלמים לבין מה שמוכרים מקבלים, ומצמצם את הכמות שנסחרת.
Enduring Understanding (POL-1): Government policies influence consumer and producer behavior and therefore affect market outcomes.
Learning Objective POL-1.B:
a. Define tariffs and quotas.
b. Explain (using graphs where appropriate) how markets are affected by public policy related to international trade.
c. Calculate (using data from a graph or table as appropriate) changes in market outcomes resulting from public policy related to international trade.
POL-1.B.1 Equilibria in competitive markets may be altered by the decision to open an economy to trade with other countries; equilibrium price can be higher or lower than under autarky, and the gap between domestic supply and demand is filled by trade. Opening an economy to trade with other countries affects consumer surplus, producer surplus, and total economic surplus.
POL-1.B.2 Tariffs, which governments sometimes use to influence international trade, affect domestic price, quantity, government revenue, and consumer surplus and total economic surplus.
POL-1.B.3 Quotas can be used to alter quantities produced and therefore affect price, consumer surplus, and total economic surplus.
Exclusion statement: The graphing of quotas is beyond the scope of the course and the AP Exam, but understanding how quotas affect quantities produced is within the scope.
עברית
הבנה נשנית (POL-1): מדיניות ממשלתית משפיעה על התנהגות צרכנים ויצרנים ולכן משפיעה על תוצאות השוק.
מטרה לימודית POL-1.B:
א. הגדר מכסים וקוטרות.
ב. הסבר (בעזרת גרפים כשמתאים) כיצד מדיניות ציבורית הקשורה לסחר בינלאומי משפיעה על שוקים.
ג. חישוב (בעזרת נתונים מגרף או טבלה כשמתאים) של שינויים בתוצאות השוק הנובעים ממדיניות ציבורית הקשורה לסחר בינלאומי.
POL-1.B.1 איזון בשווקים תחרותיים עשוי להשתנות בעקבות החלטת פתיחת כלכלה לסחר עם מדינות אחרות; מחיר האיזון עשוי להיות גבוה יותר או נמוך מאשר בתנאי אוטרכיה, והמרווח בין האספקה המקומית לבין הביקוש מתמלא באמצעות סחר. פתיחת כלכלה לסחר עם מדינות אחרות משפיעה על עודף הצרכן, עודף המייצר ועודף הכלכלי הכולל.
POL-1.B.2 מכסים, שהממשלות משתמשות בהם לעיתים כדי להשפיע על הסחר הבינלאומי, משפיעים על המחיר המקומי, הכמות, ההכנסות הממשלתיות, עודף הצרכן ועודף הכלכלי הכולל.
POL-1.B.3 קוטרות יכולות לשמש לשינוי בכמויות המיוצרות ולכן להשפיע על המחיר, עודף הצרכן ועודף הכלכלי הכולל.
הצהרת בלילה: ציור גרפים עבור קוטרות אינם בתחום העניין של הקורס ובחינת AP, אך הבנה כיצד קוטרות משפיעות על כמויות המיוצרות נמצאת בתחום העניין.
Source: College Board AP Course and Exam Description · מקור: תיאור הקורס והמבחן של College Board AP
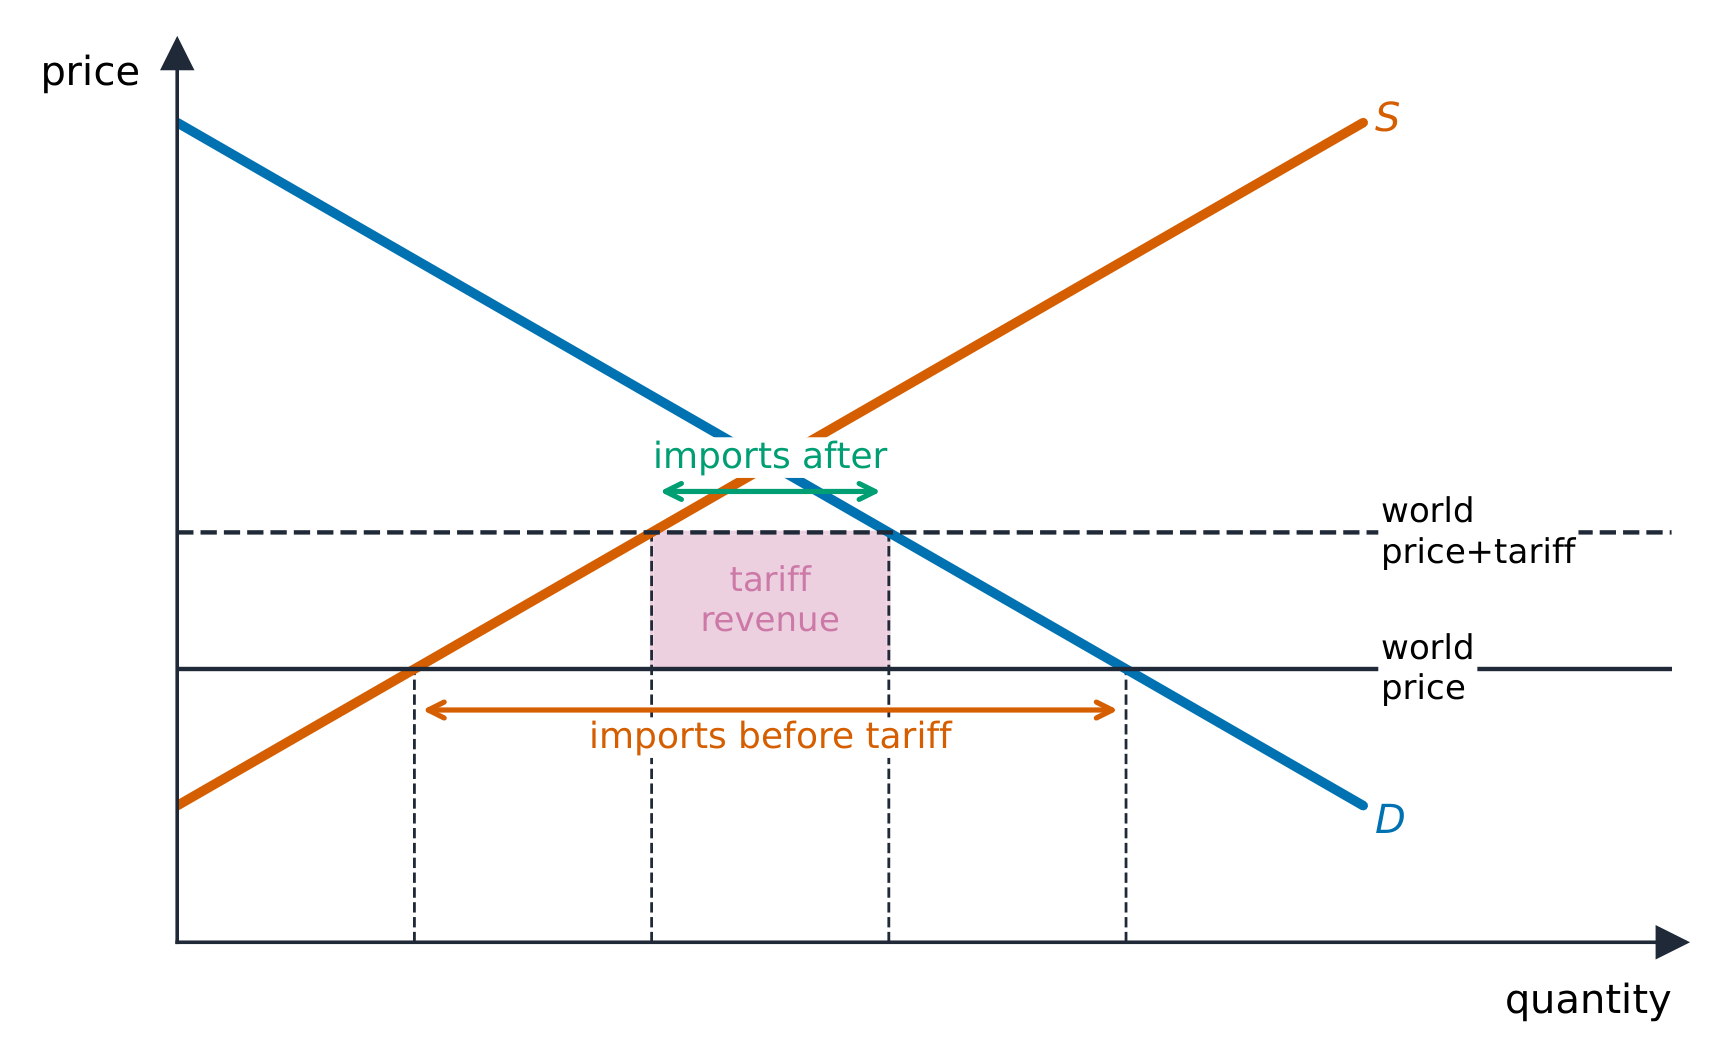
When a country opens to trade at a world price 世界价格:
A tariff raises domestic supply, cuts demand, and shrinks imports
If the world price is below the domestic price, the country imports 进口 – consumers gain more than producers lose, so total surplus rises.
If the world price is above the domestic price, the country exports 出口 – producers gain more than consumers lose.
A tariff 关税 (a tax on imports) or a quota 配额 (a limit on imports) raises the domestic price, helps domestic producers, hurts consumers more, and creates deadweight loss. Free trade maximizes total surplus, which is the core efficiency argument for it.
Separate a movement along a curve (own price) from a shift (a determinant); a single shift gives a definite result, a double shift leaves one variable indeterminate.
Compute elasticity $E_d=|\%\Delta Q \div \%\Delta P|$; elastic ($>1$) means a price cut raises total revenue, inelastic ($<1$) lowers it.
Read the sign of cross-price elasticity (substitutes $+$, complements $-$) and income elasticity (normal $+$, inferior $-$).
Shade consumer/producer surplus and the deadweight loss from a tax or price control; incidence falls on the more inelastic side.
A price ceiling below equilibrium causes a shortage; a price floor above causes a surplus.
3
Production, Cost, and the Perfect Competition Model
Enduring Understanding (PRD-1): Firms' production and cost constraints over different input and output levels shape optimal decisions in the short run and long run.
Learning Objective PRD-1.A:
a. Define (using graphs where appropriate) key terms and concepts relating to production and cost.
b. Explain (using graphs where appropriate) how production and cost are related in the short run and long run.
c. Calculate (using data from a graph or table as appropriate) the various measures of productivity and short-run and long-run costs.
PRD-1.A.1 The production function explains the relationship between inputs and outputs both in the short run and the long run.
PRD-1.A.2 Marginal product and average product change as input usage changes, and hence, total product changes.
PRD-1.A.3 Diminishing marginal returns occur as the firm employs more of one input, holding other inputs constant, to produce a product (output) in the short run.
עברית
הבנה מתמשכת (PRD-1): מגבלות ייצור ועלויות של חברות ברמות שונות של קלט ותפוקה מעצבות החלטות מיטביות בטווח הקצר ובטווח הארוך.
מטרת למידה PRD-1.A:
א. הגדר (בעזרת גרפים כשמתאים) מונחים ומفاهيم מרכזיים הקשורים לייצור ולעלויות.
ב. הסבר (בעזרת גרפים כשמתאים) כיצד ייצור ועלויות קשורים זה לזה בטווח הקצר ובטווח הארוך.
ג. חישוב (בעזרת נתונים מגרף או טבלה כשמתאים) של המדדים השונים לפרודוקטיביות ולעלויות בטווח הקצר ובטווח הארוך.
PRD-1.A.1 פונקציית הייצור מסבירה את הקשר בין קלטים לתפוקות גם בטווח הקצר וגם בטווח הארוך.
PRD-1.A.2 התמ
PRD-1.A.3 תשומות שוליות יורדות מתרחשות כאשר החברה משתמשת יותר באחד הגורמים, תוך שמירה על שאר הגורמים קבועים, כדי לייצר מוצר (תפוקה) בטווח הקצר.
Source: College Board AP Course and Exam Description · מקור: תיאור הקורס והמבחן של College Board AP
A steel plant: production functions and costs shape how firms supply goods
The production function 生产函数 links inputs to output. In the short run 短期 at least one input (usually capital) is fixed 固定; in the long run 长期 all inputs vary.
Total product 总产量 is the total output.
Marginal product 边际产量 (MP) is the extra output from one more unit of a variable input (usually labor): $MP=\dfrac{\Delta\ \text{output}}{\Delta\ \text{labor}}$.
Average product 平均产量 is output per worker.
As you add workers to fixed capital, MP eventually falls – the law of diminishing marginal returns 边际收益递减法则. This shape of MP is what drives the shape of the cost curves below.
The production function turns inputs — labour and capital like this robot — into output
law of diminishing marginal returns/lɔː ɒv dɪˈmɪnɪʃɪŋ ˈmɑːdʒɪnl rɪˈtɜːnz/
חוק התשואות השוליות הפוחתות
3.2
Short-Run Production Costs
Syllabus · סיילבוס
English
Enduring Understanding (PRD-1): Firms' production and cost constraints over different input and output levels shape optimal decisions in the short run and long run.
Learning Objective PRD-1.A:
a. Define (using graphs where appropriate) key terms and concepts relating to production and cost.
b. Explain (using graphs where appropriate) how production and cost are related in the short run and long run.
c. Calculate (using data from a graph or table as appropriate) the various measures of productivity and short-run and long-run costs.
PRD-1.A.4 Fixed costs and variable costs determine the total cost.
PRD-1.A.5 Marginal cost, average (fixed, variable, and total) cost, total cost, and total variable cost change as total output changes, but total fixed cost remains constant at all output levels, including zero output.
PRD-1.A.6 Production functions with diminishing marginal returns yield an upward-sloping marginal cost curve.
PRD-1.A.7 Specialization and the division of labor reduce marginal costs for firms.
PRD-1.A.8 Cost curves can shift in response to changes in input costs and productivity.
עברית
הבנה מתמשכת (PRD-1): מגבלות ייצור ועלויות של חברות ברמות שונות של קלט ותפוקה מעצבות החלטות מיטביות בטווח הקצר ובטווח הארוך.
מטרת למידה PRD-1.A:
א. הגדר (בעזרת גרפים כשמתאים) מונחים ומفاهيم מרכזיים הקשורים לייצור ולעלויות.
ב. הסבר (בעזרת גרפים כשמתאים) כיצד ייצור ועלויות קשורים זה לזה בטווח הקצר ובטווח הארוך.
ג. חישוב (בעזרת נתונים מגרף או טבלה כשמתאים) של המדדים השונים לפרודוקטיביות ולעלויות בטווח הקצר ובטווח הארוך.
PRD-1.A.4 עלויות קבועות ועלויות משתנות קובעות את העלות הכוללת.
PRD-1.A.5 העלות המג'ורלית, העלות הממוצעת (קבועה, משתנה וכוללת), העלות הכוללת ועלות משתנה כוללה משתנות כאשר תפוקה כוללת משתנה, אך העלות הקבועה הכוללת נשארת קבועה בכל רמות התפוקה, כולל תפוקה אפס.
PRD-1.A.6 פונקציות ייצור עם תשואה מג'ורלית יורדת מובילות לעקומת עלות מג'ורלית בעלת שיפוע חיובי.
PRD-1.A.7 התמחות וחלוקת העבודה מצמצמים עלויות שוליות עבור חברות.
PRD-1.A.8 עקומי עלויות יכולים להזיז כתוצאה משינויים בעלויות גורמי הייצור ובמוצריות.
Source: College Board AP Course and Exam Description · מקור: תיאור הקורס והמבחן של College Board AP
Short-run cost curves (MC, ATC, AVC)
Costs split into fixed and variable:
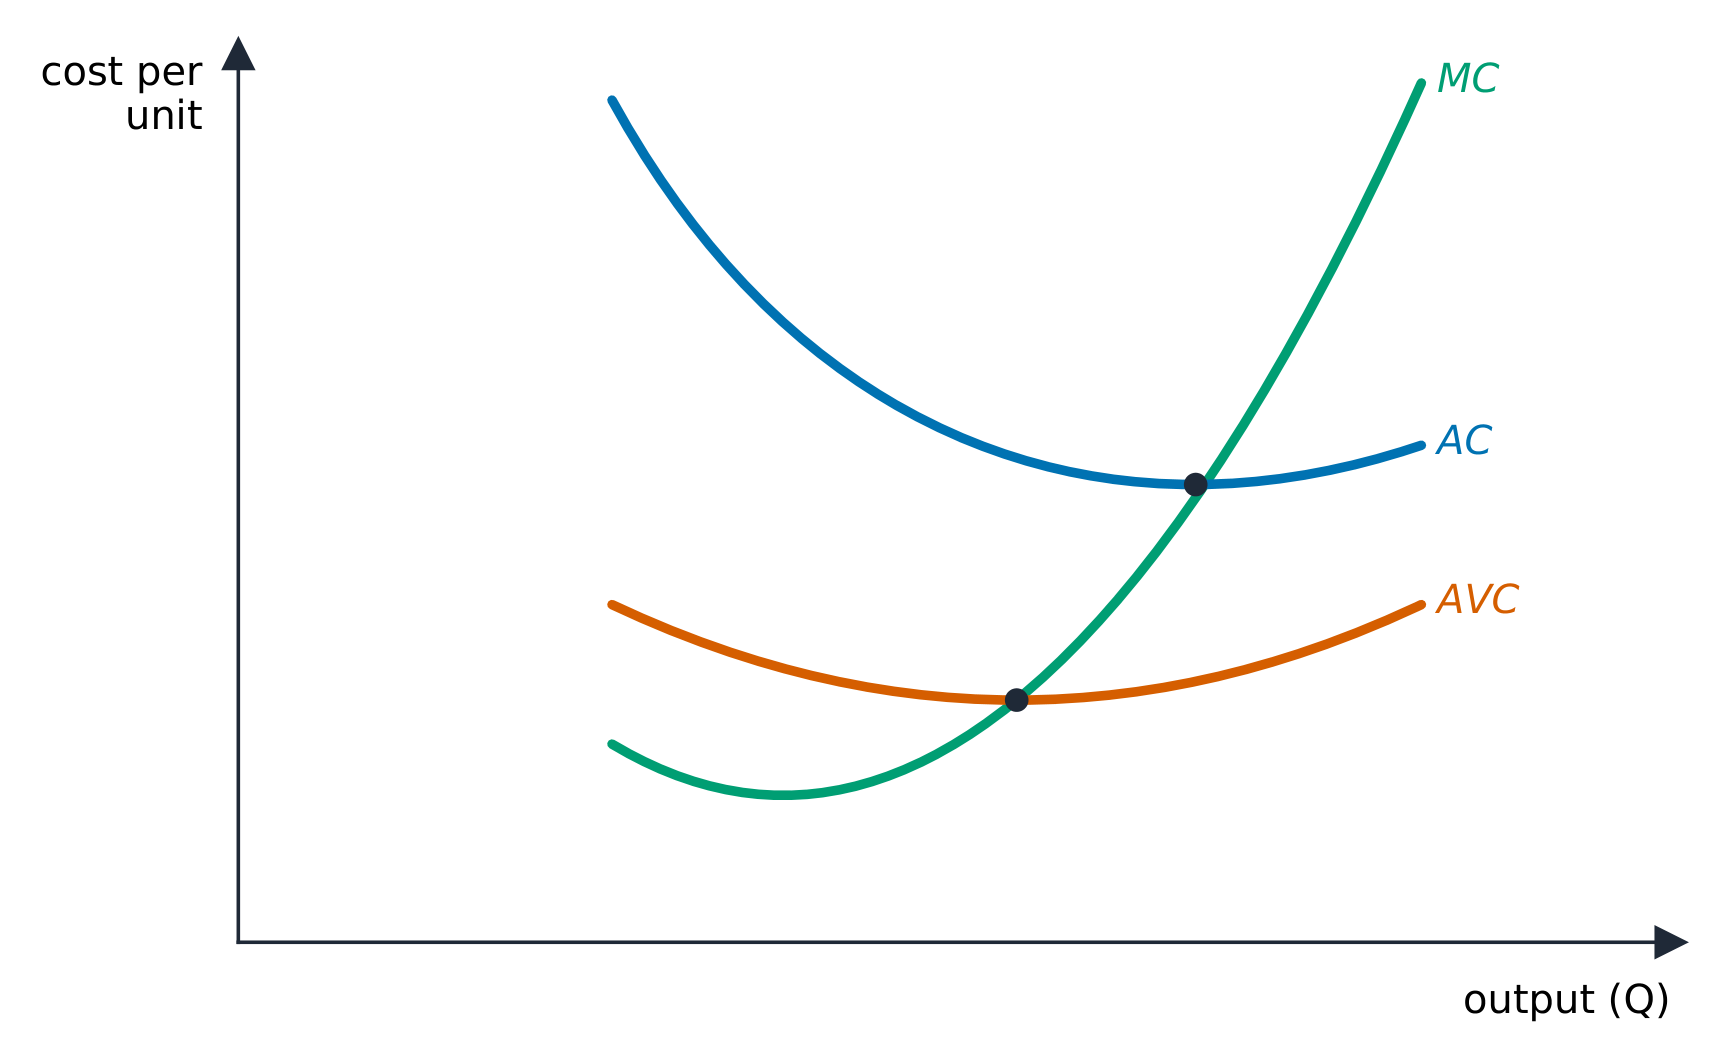
The short-run marginal, average, and average variable cost curves
Fixed cost 固定成本 (FC) does not change with output (rent on the factory).
Variable cost 可变成本 (VC) rises with output (materials, labor).
Total cost 总成本$TC=FC+VC$.
The per-unit costs matter most:
Average fixed cost$AFC=FC/Q$ falls continuously (spreading fixed cost).
Average variable cost$AVC=VC/Q$ and average total cost$ATC=TC/Q$ are U-shaped.
Marginal cost 边际成本$MC=\dfrac{\Delta TC}{\Delta Q}$ is the cost of one more unit.
Two key facts: MC is the mirror image of MP (when MP rises, MC falls, and vice versa), and MC cuts both AVC and ATC at their minimum points (when marginal is below average, the average falls; when above, it rises).
Worked example. A firm has fixed cost $FC=\$100$. At $Q=10$ its total cost is $\$300$, so variable cost is $\$200$: then $ATC=\tfrac{300}{10}=\$30$, $AVC=\tfrac{200}{10}=\$20$, and $AFC=\tfrac{100}{10}=\$10$ (note $AFC+AVC=ATC$). If raising output to $Q=11$ pushes total cost to $\$325$, the marginal cost of that $11$th unit is $\dfrac{\Delta TC}{\Delta Q}=\dfrac{325-300}{1}=\$25$.
Explore · חקור
Explore the U-shaped cost curves · חקרו את עקומות העלות בצורת U
As output rises, marginal cost eventually climbs (diminishing returns) and cuts through the U-shaped average cost at its minimum — the most efficient scale. · ככל שהתפוקה עולה, העלות השולית עולה לבסוף (בגלל תשואות יורדות) וחוצה את העלות הממוצעת בצורת ה-U בנקודה הנמוכה ביותר שלה — קנה מידה היעיל ביותר.
Enduring Understanding (PRD-1): Firms' production and cost constraints over different input and output levels shape optimal decisions in the short run and long run.
Learning Objective PRD-1.A:
a. Define (using graphs where appropriate) key terms and concepts relating to production and cost.
b. Explain (using graphs where appropriate) how production and cost are related in the short run and long run.
c. Calculate (using data from a graph or table as appropriate) the various measures of productivity and short-run and long-run costs.
PRD-1.A.9 In the long run, firms can adjust all their inputs, and as a result, all costs become variable.
PRD-1.A.10 The relationship between inputs and outputs in the long run is described by the scale of production—increasing, decreasing, or constant returns to scale.
PRD-1.A.11 The long-run average total cost is characterized by economies of scale, diseconomies of scale, or constant returns to scale (efficient scale).
PRD-1.A.12 The minimum efficient scale plays a role in determining the concentration of firms in a market and the market structure.
עברית
הבנה מתמשכת (PRD-1): מגבלות ייצור ועלויות של חברות ברמות שונות של קלט ותפוקה מעצבות החלטות מיטביות בטווח הקצר ובטווח הארוך.
מטרת למידה PRD-1.A:
א. הגדר (בעזרת גרפים כשמתאים) מונחים ומفاهيم מרכזיים הקשורים לייצור ולעלויות.
ב. הסבר (בעזרת גרפים כשמתאים) כיצד ייצור ועלויות קשורים זה לזה בטווח הקצר ובטווח הארוך.
ג. חישוב (בעזרת נתונים מגרף או טבלה כשמתאים) של המדדים השונים לפרודוקטיביות ולעלויות בטווח הקצר ובטווח הארוך.
PRD-1.A.9 בטווח הארוך, לחברות יש אפשרות לכוון את כל גורמי הייצור שלהן, ולכן כל העלויות הופכות למשתנות.
PRD-1.A.10 הקשר בין גורמי הייצור לתפוקה בטווח הארוך מתואר על ידי קנה מידת הייצור—תשואות גודל עולה, יורדת או קבועות.
PRD-1.A.11 הממוצע של כלל העלויות בטווח הארוך מאופיין בתשואות גודל (כלכלות גודל), אי-כלכלות גודל או תשואות גודל קבועות (קנה מידה יעיל).
PRD-1.A.12 קנה המידה היעיל המינימלי משחק תפקיד בקביעת ריכוז החברות בשוק ובמבנה השוק.
Source: College Board AP Course and Exam Description · מקור: תיאור הקורס והמבחן של College Board AP
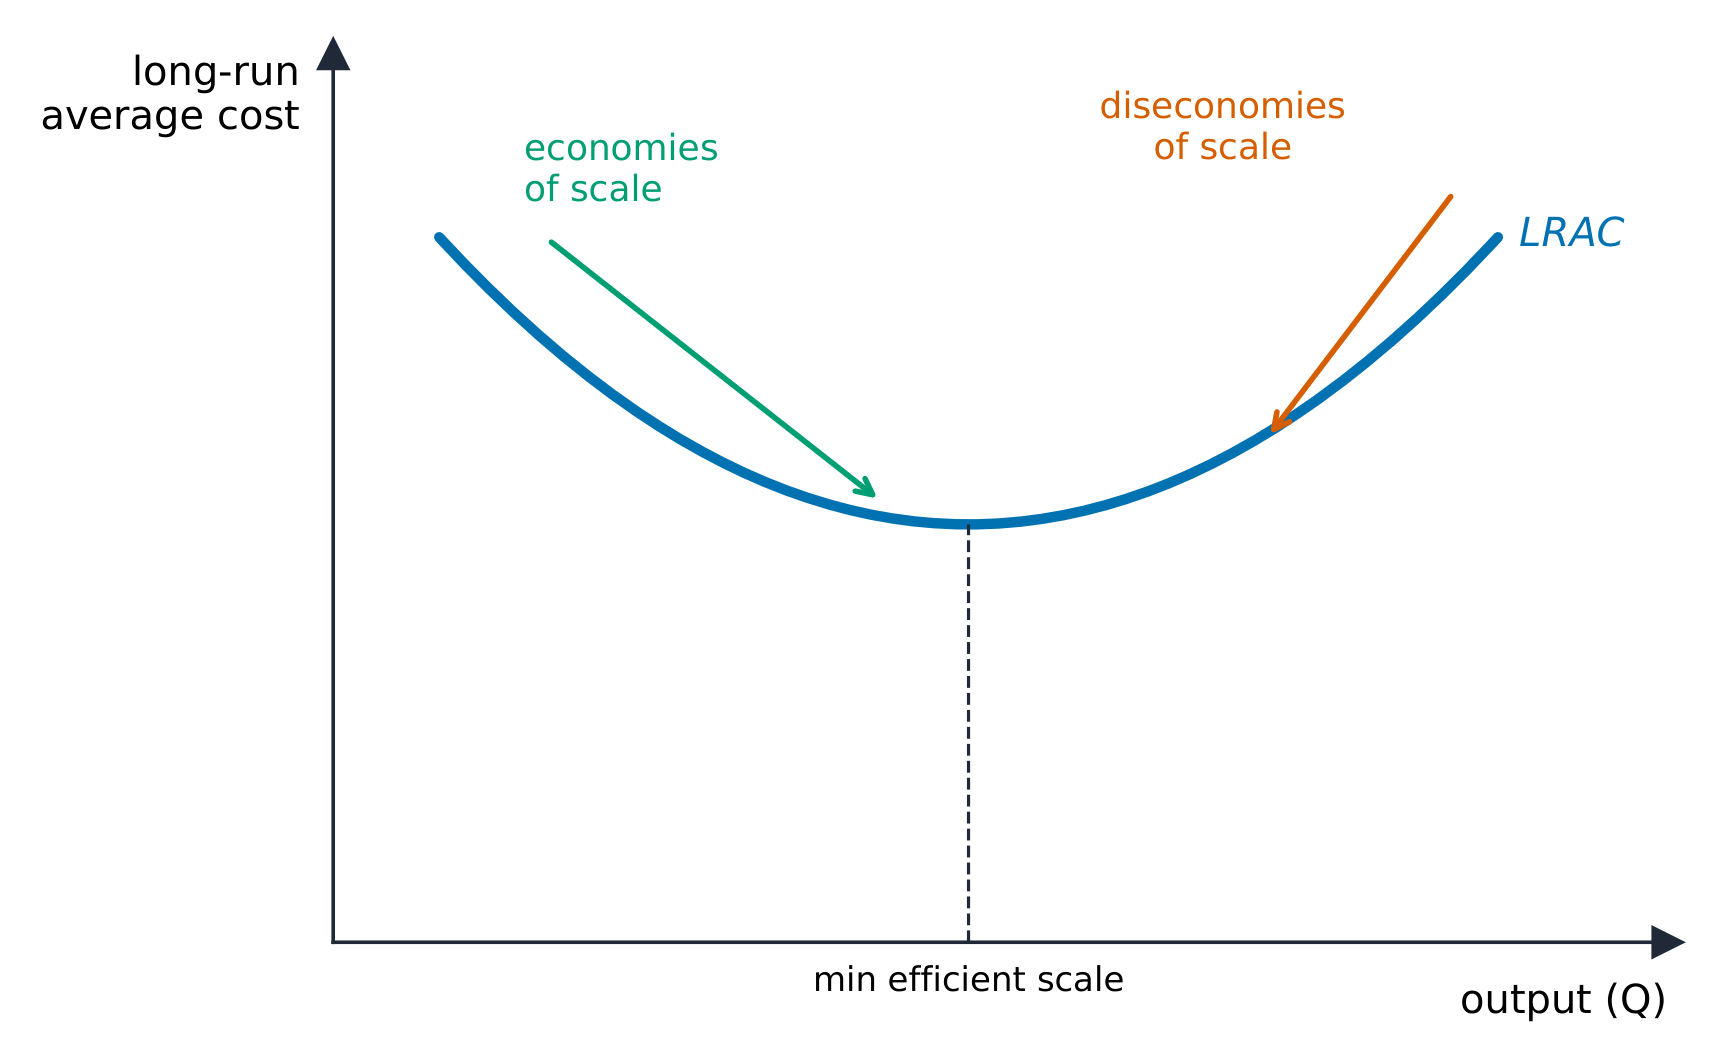
In the long run all inputs – including plant size – can change, so only the long-run average total cost (LRATC) curve matters. Its shape shows returns to scale:
Economies and diseconomies of scale on the long-run average cost curve
Economies of scale 规模经济: LRATC falls as output grows (bulk buying, specialization).
Constant returns to scale: LRATC flat.
Diseconomies of scale 规模不经济: LRATC rises (a firm too big to manage well).
Exam skill: know that "diminishing returns" is a short-run idea (one fixed input) while "economies of scale" is a long-run idea (all inputs vary) – examiners test the distinction.
Enduring Understanding (CBA-2): To determine the optimal level at which to pursue an activity whose total benefits exceed total cost, rational economic agents compare marginal benefits and marginal costs.
Learning Objective CBA-2.C:
a. Define the different types of profit.
b. Explain how firms respond to profit opportunities.
c. Calculate a firm's profit or loss.
CBA-2.C.1 Firms respond to economic profit (loss) rather than accounting profit.
CBA-2.C.2 Accounting profit fails to account for implicit costs (such as cost of financial capital, compensation for risk, or an entrepreneur's time), which, if fully compensated, result in normal profit.
עברית
הבנה קיימת (CBA-2): כדי לקבוע את הרמה האופטימלית להמשך בפעילות שבה התועלת הכוללת עולה על העלות הכוללת, סוכנים כלכליים רציונליים משווים תועלות שוליות ועלויות שוליות.
מטרת הלמידה CBA-2.C:
א. הגדר את הסוגים השונים של רווח.
ב. הסבר כיצד חברות מגיבות לפתיחות רווח.
ג. חשב את הרווח או ההפסד של חברה.
CBA-2.C.1 חברות מגיבות לרווח כלכלי (הפסד) ולא לרווח חשבונאי.
CBA-2.C.2 רווח חשבונאי אינו לוקח בחשבון עלויות סמוכות (כגון עלות הון פיננסי, פיצוי על סיכון או זמן של עסקן), אשר אם נפוצו במלואם, יובילו לרווח רגיל.
Source: College Board AP Course and Exam Description · מקור: תיאור הקורס והמבחן של College Board AP
Economists count all opportunity costs, including the owner's:
Explicit costs 显性成本 are out-of-pocket payments; implicit costs 隐性成本 are the opportunity costs of owner-supplied resources (forgone salary, forgone interest).
Because economic profit subtracts more, it is smaller. Zero economic profit (a normal profit 正常利润) still means the owner is earning exactly the opportunity cost of their resources – a perfectly acceptable outcome.
Worked example. A shopkeeper takes in $\$200{,}000$ of revenue and pays $\$120{,}000$ in explicit costs, so accounting profit is $\$80{,}000$. But she gave up a $\$70{,}000$ salary elsewhere and $\$5{,}000$ of interest on the savings she invested – $\$75{,}000$ of implicit costs. Her economic profit is $80{,}000-75{,}000=\$5{,}000$: still positive, so staying in business genuinely beats her next-best alternative.
Enduring Understanding (CBA-2): To determine the optimal level at which to pursue an activity whose total benefits exceed total cost, rational economic agents compare marginal benefits and marginal costs.
Learning Objective CBA-2.D:
a. Define (using graphs or data as appropriate) the profit-maximizing rule.
b. Explain (using a graph or data as appropriate) the profit-maximizing level of production.
CBA-2.D.1 Firms are assumed to produce output to maximize their profits by comparing marginal revenue and marginal cost.
עברית
הבנה קיימת (CBA-2): כדי לקבוע את הרמה האופטימלית להמשך בפעילות שבה התועלת הכוללת עולה על העלות הכוללת, סוכנים כלכליים רציונליים משווים תועלות שוליות ועלויות שוליות.
מטרת הלמידה CBA-2.D:
א. הגדר (באמצעות גרפים או נתונים בהתאמה) את הכלל למקסום רווח.
ב. הסבר (באמצעות גרף או נתונים בהתאמה) את רמת הייצור המקסימלית ברווח.
CBA-2.D.1 מניחים שחברות מייצרות תפוקה כדי למקסם את הרווחים שלהן על ידי השוואת הכנסה שולית לעלות שולית.
Source: College Board AP Course and Exam Description · מקור: תיאור הקורס והמבחן של College Board AP
Every firm, in every market structure, maximizes profit at the quantity where marginal revenue equals marginal cost:
$$MR=MC.$$
Produce each unit whose MR exceeds its MC; stop when they are equal. Producing less leaves profitable units unmade; producing more adds units that cost more than they earn.
3.6
Deciding to Produce, Enter, or Exit
Syllabus · סיילבוס
English
Enduring Understanding (PRD-2): Firms' short-run decisions to produce output, and long-run decisions to enter or exit a market, are based on profitability.
Learning Objective PRD-2.A: Explain (using graphs or data where appropriate) firms' short-run decisions to produce positive output levels, or long-run decisions to enter or exit a market in response to profit-making opportunities.
PRD-2.A.1 In the short run, firms decide to operate (i.e., produce positive output) or shut down (i.e., produce zero output) by comparing total revenue to total variable cost or price to average variable cost (AVC).
PRD-2.A.2 In the absence of barriers to entry or exit, in the long run (i.e., once factors that are fixed in the short run become variable), firms enter a market in which there are profit-making opportunities and exit a market when they anticipate economic losses.
עברית
הבנה מתמשכת (PRD-2): ההחלטות של חברות לטווח הקצר לייצור תוצרת, והחלטותיהן לטווח הארוך לגבי כניסה או יציאה משוק, מבוססות על רווחיות.
מטרת למידה PRD-2.A: הסבר (באמצעות גרפים או נתונים כאשר רלוונטי) על החלטות חברות לטווח הקצר לייצור רמות תוצרה חיוביות, או החלטותיהן לטווח הארוך לגבי כניסה או יציאה משוק כתגובה לאפשרויות רווח.
PRD-2.A.1 בטווח הקצר, חברות מחליטות לפעול (כלומר, לייצר תוצרה חיובית) או לסגור את פעילותן (כלומר, לייצר אפס תוצרה) על ידי השוואת הכנסה כוללת לעלות משתנה כוללת או מחיר לעלות משתנה ממוצעת (AVC).
PRD-2.A.2 בהיעדר מכשולי כניסה או יציאה, בטווח הארוך (כלומר, לאחר שגורמים שקבועים בטווח הקצר הפכו למשתנים), חברות נכנסות לשוק בו קיימות אפשרויות רווח ויוצאות משוק כשהן צופות הפסדים כלכליים.
Source: College Board AP Course and Exam Description · מקור: תיאור הקורס והמבחן של College Board AP
Even at $MR=MC$, a firm must check whether to operate:
Short run – the shutdown rule: keep producing only if price covers average variable cost ($P\geq AVC$). If $P, shut down and lose only fixed cost. So the firm's short-run supply curve is its MC curve above minimum AVC.
Profit check: compare $P$ to $ATC$ at the profit-maximizing quantity – $P>ATC$ means economic profit, $P means a loss, $P=ATC$ means break-even.
Long run – entry and exit: economic profits attract entry 进入; losses cause exit 退出. This continues until economic profit is zero.
Enduring Understanding (PRD-3): Even with a common goal of profit-maximization, market structure constrains and influences prices, output, and efficiency.
Learning Objective PRD-3.A:
a. Define (using graphs as appropriate) the characteristics of perfectly competitive markets and efficiency.
b. Explain (using graphs where appropriate) equilibrium and firm decision making in perfectly competitive markets and how prices in perfectly competitive markets lead to efficient outcomes.
c. Calculate (using data from a graph or table as appropriate) economic profit (loss) in perfectly competitive markets.
PRD-3.A.1 A perfectly competitive market is efficient. Firms in perfectly competitive markets face no barriers to entry and have no market power.
PRD-3.A.2 In perfectly competitive markets, prices communicate to consumers and producers the magnitude of others' marginal costs of production and marginal benefits of consumption and provide incentives to act on that information (i.e., price equals marginal cost in an efficient market).
PRD-3.A.3 In perfectly competitive markets, firms can sell all their outputs at a constant price determined by the market.
PRD-3.A.4 At a competitive market equilibrium, firms are price takers and select output to maximize profit by producing the level of output where the marginal cost equals marginal revenue (at the price).
PRD-3.A.5 At a competitive market equilibrium, the price of a product equals both the private marginal benefit received by the last unit consumed and the private marginal cost incurred to produce the last unit, thus achieving allocative efficiency.
PRD-3.A.6 In a short-run competitive equilibrium, price can either be above or below its long-run competitive level resulting in profits or losses, motivating entry or exit of firms and moving prices and quantities toward long-run equilibrium.
PRD-3.A.7 In a long-run perfectly competitive equilibrium, productive efficiency implies all operating firms produce at efficient scale, price equals marginal cost and minimum average total cost, and firms earn zero economic profit.
PRD-3.A.8 Firms may be in a constant cost, increasing cost, or decreasing cost industry. Long-run prices depend on the portion of the long-run cost curves on which firms operate.
PRD-3.A.9 A perfectly competitive market in long-run equilibrium is allocatively and productively efficient.
עברית
הבנה מתמשכת (PRD-3): גם כאשר יש מטרות משותפות למקסום הרווח, המבנה השוקי מגביל ומשפיע על מחירים, תוצרת ויעילות.
מטרת למידה PRD-3.A:
א. הגדרה (באמצעות גרפים כאשר רלוונטי) של מאפייני שווקי תחרות מושלמת ויעילות.
ב. הסבר (באמצעות גרפים כאשר רלוונטי) של איזון והחלטות חברות בשווקי תחרות מושלמת וכיצד מחירים בשווקים אלו מובילים לתוצאות יעילות.
ג. חישוב (באמצעות נתונים מגרף או טבלה כאשר רלוונטי) של רווח (הפסד) כלכלי בשווקי תחרות מושלמת.
PRD-3.A.1 שוק תחרות מושלמת הוא יעיל. חברות בשווקי תחרות מושלמת אינן נתונות למכשולי כניסה ואין להן כוח שוקי.
PRD-3.A.2 בשווקי תחרות מושלמת, מחירים מעבירים לצרכנים וליצרנים את היקף העלויות המצומצמות של הייצור והתועלות המצומצמות של הצריכה של אחרים, ומספקים זרימה לפעולה על בסיס מידע זה (כלומר, המחיר שווה לעלות המצומצמת בשוק יעיל).
PRD-3.A.3 בשווקי תחרות מושלמת, חברות יכולות למכור את כל התוצרת שלהן במחיר קבוע הנקבע על ידי השוק.
PRD-3.A.4 באיזון בשוק תחרותי, חברות הן מקבלות מחיר ובחרות בתוצרה למקסום הרווח על ידי ייצור ברמת תוצרה שבה העלות המצומצמת שווה להכנסה המצומצמת (במחיר).
PRD-3.A.5 באיזון בשוק תחרותי, מחיר המוצר שווה גם לתועלת המצומצמת הפרטית שהתקבלה מהיחידה האחרונה שנצרכה וגם לעלות המצומצמת הפרטית שהוקצה ליצור היחידה האחרונה, ולכן משיגים יעילות הקצאה.
PRD-3.A.6 באיזון תחרותי לטווח הקצר, המחיר עשוי להיות מעל או מתחת לרמת האיזון התחרותית לטווח הארוך, מה שמוביל לרווחים או להפסדים, ויוצר זרימה לכניסה או יציאת חברות ומזיז את המחירים והכמויות לעבר איזון לטווח הארוך.
PRD-3.A.7 באיזון תחרותי מושלם לטווח הארוך, יעילות ייצורית מציינת שכל החברות הפועלות מייצרות בקנה מידה יעיל, המחיר שווה לעלות המצומצמת ולעלות כוללת ממוצעת מינימלית, וחברות מרוויחות רווח כלכלי אפס.
PRD-3.A.8 חברות עשויות להיות בתעשייה בעלות עלות קבועה, עלות עולה או עלות יורדת. מחירים לטווח הארוך תלויים בחלק ממערכי העלות לטווח הארוך שעליהם חברות פועלות.
PRD-3.A.9 שוק תחרות מושלמת באיזון לטווח הארוך הוא יעיל בקנה מידת הקצה ויעיל בייצור.
Source: College Board AP Course and Exam Description · מקור: תיאור הקורס והמבחן של College Board AP
A perfectly competitive 完全竞争 market has many small firms, an identical (homogeneous) product, free entry and exit, and perfect information. Each firm is a price taker 价格接受者 – too small to affect the price – so it faces a horizontal demand curve at the market price, and price = marginal revenue = average revenue ($P=MR=AR$).
This is why economists prize perfect competition. In long-run equilibrium it is both allocatively efficient 配置效率 and productively efficient 生产效率. Allocative efficiency holds because the firm produces where $P = MC$: the price (society's marginal benefit from the last unit) equals its marginal cost, so exactly the right amount is made. Productive efficiency holds because free entry drives price down to the minimum of average total cost, so goods are made as cheaply as possible. The market price is itself a signal that communicates everyone's marginal costs and benefits.
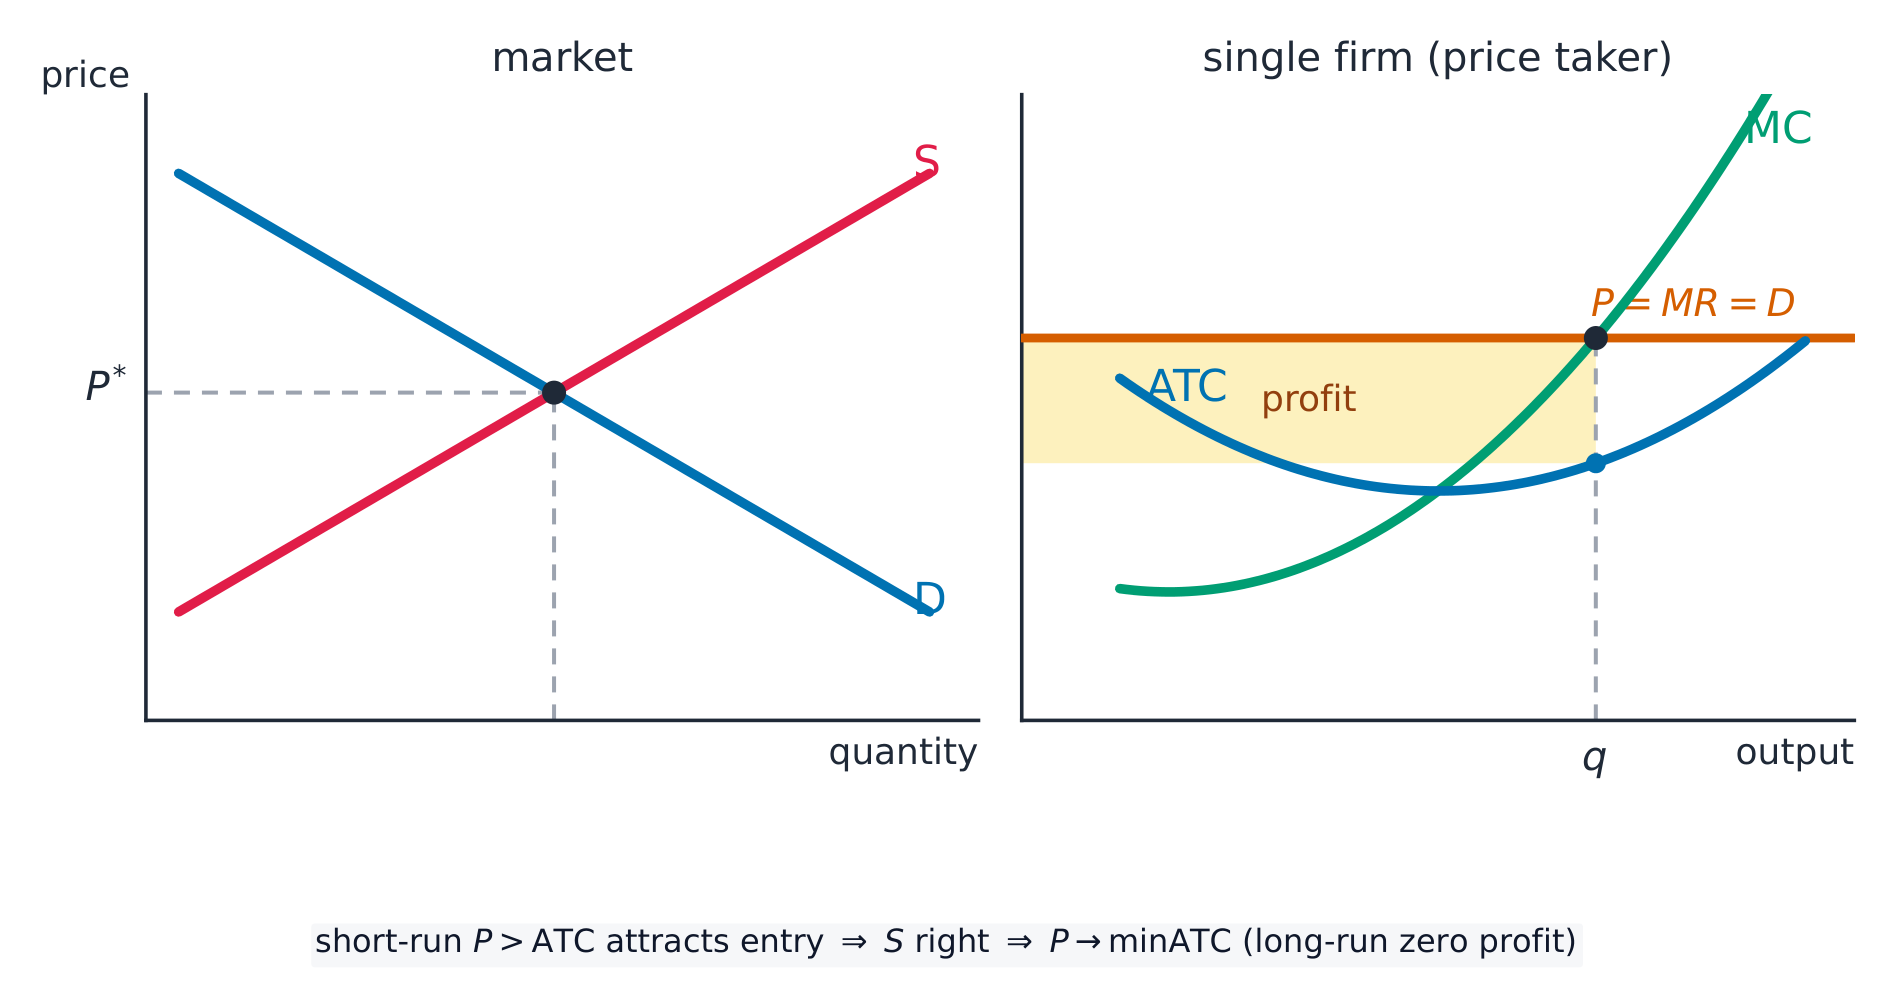
The market sets the price; the price-taking firm produces where MC = P, here with short-run profit
The side-by-side panel is the graph the exam wants: the market (left) fixes the price $P^{*}$; the firm (right) takes it as a horizontal line and produces where $MC=P$. When $P>ATC$ there is a short-run profit (the shaded box); that profit attracts entry, which shifts market supply right and pushes the price down.
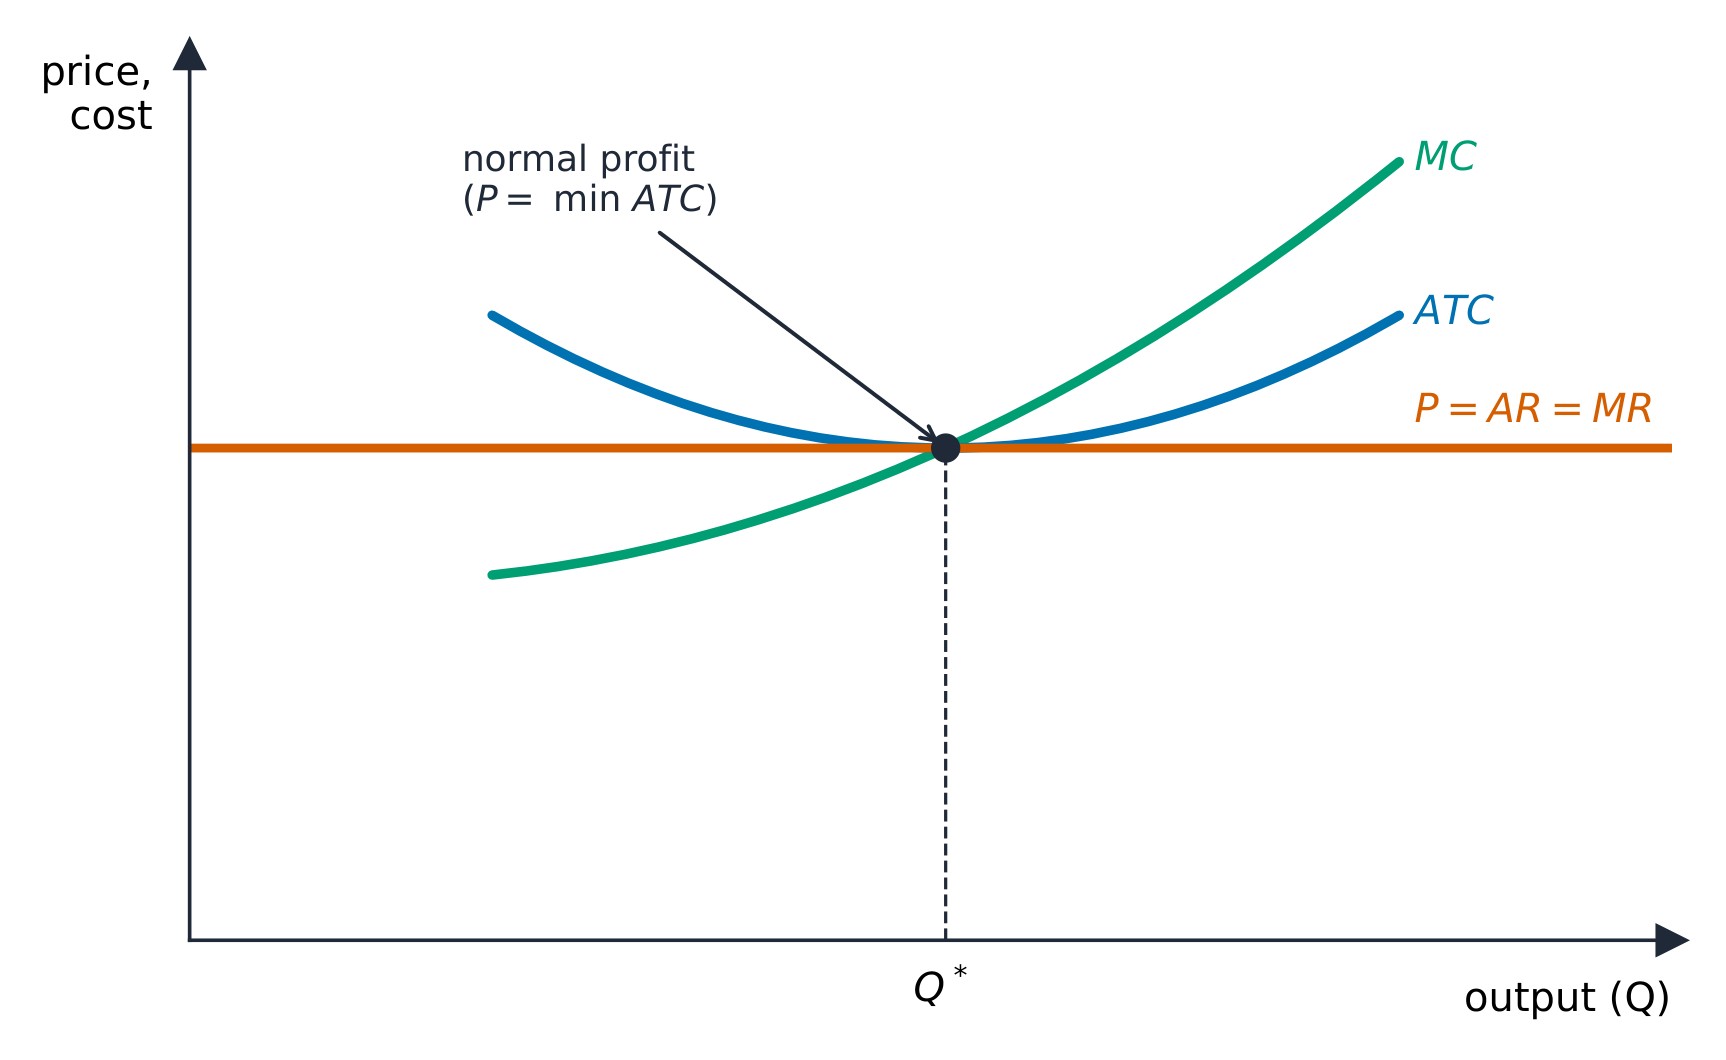
A perfectly competitive firm makes only normal profit in the long run
Short run: the firm can earn profit, break even, or take a loss, producing where $P=MC$.
Long run: entry and exit drive the firm to zero economic profit, producing where $P=MC=ATC$ at minimum ATC. This double efficiency – productive efficiency (lowest-cost output) and allocative efficiency ($P=MC$, so the last unit's value equals its cost) – is the benchmark against which every other market structure is judged.
Exam skill: be able to draw the side-by-side market and single-firm graphs, show a short-run profit or loss, then show how entry/exit restores long-run equilibrium at minimum ATC.
Explore · חקור
A price-taking firm in a competitive market · חברה המקבלת מחירים בשוק תחרותי
In perfect competition the market sets the price and each firm is a price-taker. It produces where price equals marginal cost, earning zero economic profit in the long run. · ב-תחרות מושלמת השוק קובע את המחיר וכל חברה היא מקבלת מחירים. החברה מייצרת שבו המחיר שווה לעלות השולית, ומרוויחה רווח כלכלי אפס בטווח הארוך.
Imperfect Competition and Market Power · תחרות אי-מושלמת וכוח שוק
Syllabus · סיילבוס
English
Enduring Understanding (PRD-3): Even with a common goal of profit-maximization, market structure constrains and influences prices, output, and efficiency.
Learning Objective PRD-3.B: a. Define (using graphs where appropriate) the characteristics of imperfectly competitive markets and inefficiency.
PRD-3.B.1 Imperfectly competitive markets include monopoly, oligopoly, and monopolistic competition in product markets and monopsony in factor markets.
PRD-3.B.2 In imperfectly competitive output markets and assuming all else is constant, a firm must lower price to sell additional units.
PRD-3.B.3 In imperfectly competitive markets, consumers and producers respond to prices that are above the marginal costs of production and/or marginal benefits of consumption (i.e., price is greater than marginal cost in an inefficient market).
PRD-3.B.4 Incentives to enter an industry may be mitigated by barriers to entry. Barriers to entry—such as high fixed/start-up costs, legal barriers to entry, and exclusive ownership of key resources—can sustain imperfectly competitive market structures.
עברית
הבנה מתמשכת (PRD-3): גם כאשר יש מטרות משותפות למקסום הרווח, המבנה השוקי מגביל ומשפיע על מחירים, תוצרת ויעילות.
מטרת למידה PRD-3.B: א. הגדר (באמצעות גרפים כאשר מתאים) את מאפייני שווקים בעלי תחרות לא מושלמת ואי-יעילות.
PRD-3.B.1 שווקים בעלי תחרות לא מושלמת כוללים מונופול, אוליגופולית ותחרות מונופוליסטית בשווקי מוצרים ומונופסון בשווקי גורמים.
PRD-3.B.2 בשווקי ביצועים בעלי תחרות לא מושלמת, בהנחה שכל שאר הדברים קבועים, על חברה להוריד מחיר כדי למכור יחידות נוספות.
PRD-3.B.3 בשווקים בעלי תחרות לא מושלמת, צרכנים ויצרנים מגיבים למחירים העומדים מעל עלויות השוליים של הייצור ו/או תועלת השוליים של הצריכה (כלומר, המחיר גדול מעלות השוליים בשוק לא יעיל).
PRD-3.B.4 האפשרות לכנס לתעשייה עשויה להיות מופחתת על ידי מחסומי כניסה. מחסומי כניסה—כגון עלויות קבועות/הקמה גבוהות, מחסומים משפטיים לכניסה וחזקה בלעדית במקורות מפתח—יכולים לשמור על מבני שוק בעלי תחרות לא מושלמת.
Source: College Board AP Course and Exam Description · מקור: תיאור הקורס והמבחן של College Board AP
English
Most real markets are imperfectly competitive 不完全竞争: firms have some market power 市场势力 – the ability to set price rather than take it. The source of that power is a downward-sloping demand curve facing the firm, which means that to sell one more unit the firm must lower the price on all units.
Because of this, marginal revenue is below price ($MR) for every firm with market power. On a straight-line demand curve the MR curve has the same intercept but twice the slope, lying below demand. This one fact – $MR – separates every imperfect market from perfect competition and explains why they produce less and charge more.
Worked example. A firm with market power faces demand $P=100-Q$. Selling $1$ unit gives $P=\$99$ and total revenue $\$99$; selling a $2$nd forces the price down to $\$98$ on both units, so revenue rises to $2\times98=\$196$. The marginal revenue of that $2$nd unit is $196-99=\$97$ – below its $\$98$ price. In general $MR=100-2Q$, falling twice as fast as demand.
עברית
קו הרכבה: כוח שוק וגודל חברה שונים בתחרות אי-מושלמת
רוב השוקים בפועל הם תחרותיים באופן אי-מושלם: לחברות יש מעט כוח שוק – היכולת לקבוע מחיר במקום לקבל אותו. המקור לכוח הזה הוא עקום ביקוש יורד המופנה אל החברה, מה שמעיד שכדי למכור יחידה נוספת החברה חייבת להוריד את המחיר על כל היחידות.
מבני שוק נעים מתחרות מושלמת ועד למונופול
בגלל זאת, ההכנסה המרז'ינלית נמוכה מהמחיר ($MR) לכל חברה עם כוח שוק. על עקום ביקוש ישר, לעקום MR אותה חיתוך אך שיפוע כפול, והוא שוכח מתחת לביקוש. עובדה אחת זו – $MR – מפרידה כל שוק אי-מושלם מתחרות מושלמת ומסבירה מדוע הן מייצרות פחות וגובות יותר.
דוגמה פותרת. לחברה עם כוח שוק יש ביקוש $P=100-Q$. מכירה של $1$ יחידה מביאה $P=\$99$ and total revenue $\$99$; מכירה של $2$nd מחייבת הורדת מחיר ל$\$98$ on both units, so revenue rises to $2\times98=\$196$. ההכנסה השולית של $2$nd היחידה הזו היא $196-99=\$97$ – below its $\$98$ מחיר. באופן כללי $MR=100-2Q$, צמודה פי שניים מהביקוש.
4.2
Monopoly · מונופול
Syllabus · סיילבוס
English
Enduring Understanding (PRD-3): Even with a common goal of profit-maximization, market structure constrains and influences prices, output, and efficiency.
Learning Objective PRD-3.B: b. Explain (using graphs where appropriate) equilibrium, firm decision making, consumer surplus, producer surplus, profit (loss), and deadweight loss in imperfectly competitive markets and why prices in imperfectly competitive markets cannot be relied on to coordinate the actions of all possible market participants and can lead to inefficient outputs. c. Calculate (using data from a graph or table as appropriate) areas of consumer surplus, producer surplus, profit (loss), and deadweight loss in imperfectly competitive markets.
PRD-3.B.5 A monopoly exists because of barriers to entry.
PRD-3.B.6 In a monopoly, equilibrium (profit-maximizing) quantity is determined by equating marginal revenue (MR) to marginal cost (MC). The price charged is greater than the marginal cost.
Equation:$MR = MC$
PRD-3.B.7 In a natural monopoly, long-run economies of scale for a single firm exist throughout the entire effective demand of its product.
עברית
הבנה מתמשכת (PRD-3): גם כאשר יש מטרות משותפות למקסום הרווח, המבנה השוקי מגביל ומשפיע על מחירים, תוצרת ויעילות.
מטרת למידה PRD-3.B: ב. הסבר (באמצעות גרפים כאשר מתאים) איזון, קבלת החלטות על ידי חברה, עודף צרכן, עודף יצרן, רווח (הפסד) ועודף הרווחה באובדן בשווקים בעלי תחרות לא מושלמת ולמה מחירים בשווקים אלו לא יכולים לספק סמך לקואורדינציה של פעולות כל המשתתפים האפשריים בשוק ולכן עלולים להוביל לביצועים לא יעילים. ג. חשב (באמצעות נתונים מגרף או טבלה כאשר מתאים) את שטחי עודף צרכן, עודף יצרן, רווח (הפסד) ועודף הרווחה באובדן בשווקים בעלי תחרות לא מושלמת.
PRD-3.B.5 מונופול קיים בשל מחסומי כניסה.
PRD-3.B.6 במונופול, כמות האיזון (המקסימלית ברווח) נקבעת על ידי השוויון בין הכנסה השולית (MR) לעלות השולית (MC). המחיר הנגבה הוא גדול מהעלות השולית.
משוואה:$MR = MC$
PRD-3.B.7 במונופול טבעי, קיימות כלכלות היקף לטווח ארוך לחברה אחת לאורך כלל דרישה יעילה של המוצר שלה.
Source: College Board AP Course and Exam Description · מקור: תיאור הקורס והמבחן של College Board AP
English
Monopoly: MR = MC pricing
A monopoly 垄断 is a single seller of a product with no close substitutes, protected by barriers to entry 进入壁垒 (economies of scale – a natural monopoly 自然垄断 – control of a key resource, patents, or government license).
The monopolist maximizes profit at $MR=MC$, then charges the highest price the demand curve allows at that quantity (read price up to the demand curve, not the MR curve).
Compared with perfect competition it produces less and charges more, earning long-run economic profit because entry is blocked.
This under-production creates deadweight loss 无谓损失 – the monopoly is allocatively inefficient because $P>MC$: the last unit is worth more than it costs, yet is not made.
Governments may respond with antitrust 反垄断 law, or regulate a natural monopoly's price toward $P=MC$ (socially optimal, but may cause a loss) or $P=ATC$ (fair-return, break-even).
Exam skill: the monopoly graph is a staple – show quantity at $MR=MC$, price up on the demand curve, and shade profit (between $P$ and $ATC$) and deadweight loss (the triangle to the competitive quantity).
עברית
מונופול: מחירי MR = MC
מונופול הוא מוכר יחיד של מוצר שאין לו תחליפים קרובים, מוגן על ידי מחסומי כניסה (תמורות סקאלה – מונופול טבעי – שליטה במקור עיקרי, פטנטים או רישיון ממשלתי).
מונופול מקסימיזציה רווח כאשר MC = MR ויכול להרוויח רווח מעל-רגיל
המונופוליסט מקסימיזציה רווח ב$MR=MC$, ואז מגדיר את המחיר הגבוה ביותר שהעקומה דורשת מאפשרת בכמות זו (קוראים מחיר כלפי מעלה לעקומת הביקוש, לא לעקומת ה-MR).
בהשוואה לתחרות מושלמת, המונופול מייצר פחות ומגדיר יותר, ומרוויח רווח כלכלי לטווח ארוך משום הכניסה חסומה.
הייצור הנמוך מדי יוצר אובדן שוקף – המונופול הוא לא יעיל באלוואציה משום $P>MC$: היחידה האחרונה שווה יותר מהעלות שלה, אך אינה מיוצרת.
הממשלות עשויות להגיב עם חוק אנטי-תחרותי, או לכוון את המחיר של מונופול טבעי לכיוון $P=MC$ (אופטימלי חברתי, אך עשוי לגרום להפסד) או $P=ATC$ (תשואה הוגנת, איזון).
מיומנות במבחן: הגרף של המונופול הוא בסיסי – הראש כמות ב$MR=MC$, מחיר למעלה על עקומת הביקוש, וסמן רווח (בין $P$ ל$ATC$) והפסד עיוור (המשולש לכמות התחרותית).
מפעל תשתיות גדול: מונופול וכוח שוק משמעו שחברה אחת יכולה לקבוע מחיר מעל העלות השולית
Explore · חקור
A monopoly's cost curves · עקומות העלות של מונופול
A monopoly is the sole seller, so it faces the whole downward demand curve and its marginal revenue lies below price. It produces where MR = MC — less output, higher price than competition. · מונופול הוא המוכר היחיד, ולכן הוא מתמודד עם כל עקום הביקוש היורד וההכנסה השולית שלו נמצאת מתחת למחיר. הוא מייצר שבו ההכנסה השולית שווה לעלות השולית (MR = MC) — פחות תפוקה, מחיר גבוה יותר מאשר בתחרות.
Enduring Understanding (PRD-3): Even with a common goal of profit-maximization, market structure constrains and influences prices, output, and efficiency.
Learning Objective PRD-3.B: b. Explain (using graphs where appropriate) equilibrium, firm decision making, consumer surplus, producer surplus, profit (loss), and deadweight loss in imperfectly competitive markets and why prices in imperfectly competitive markets cannot be relied on to coordinate the actions of all possible market participants and can lead to inefficient outputs. c. Calculate (using data from a graph or table as appropriate) areas of consumer surplus, producer surplus, profit (loss), and deadweight loss in imperfectly competitive markets.
PRD-3.B.8 A firm with market power can engage in price discrimination to increase its profits or capture additional consumer surplus under certain conditions.
PRD-3.B.9 With perfect price discrimination, a monopolist produces the quantity where price equals marginal cost (just as a competitive market would) but extracts all economic surplus associated with its product and eliminates all deadweight loss.
Equation:$P = MC$
עברית
הבנה מתמשכת (PRD-3): גם כאשר יש מטרות משותפות למקסום הרווח, המבנה השוקי מגביל ומשפיע על מחירים, תוצרת ויעילות.
מטרת למידה PRD-3.B: ב. הסבר (באמצעות גרפים כאשר מתאים) איזון, קבלת החלטות על ידי חברה, עודף צרכן, עודף יצרן, רווח (הפסד) ועודף הרווחה באובדן בשווקים בעלי תחרות לא מושלמת ולמה מחירים בשווקים אלו לא יכולים לספק סמך לקואורדינציה של פעולות כל המשתתפים האפשריים בשוק ולכן עלולים להוביל לביצועים לא יעילים. ג. חשב (באמצעות נתונים מגרף או טבלה כאשר מתאים) את שטחי עודף צרכן, עודף יצרן, רווח (הפסד) ועודף הרווחה באובדן בשווקים בעלי תחרות לא מושלמת.
PRD-3.B.8 חברה עם כוח שוק יכולה לבצע אבחנת מחירים כדי להגדיל את הרווחים שלה או לתפוס עודף צרכן נוסף בתנאים מסוימים.
PRD-3.B.9 באבחנת מחירים מושלמת, מונופוליסט מייצר את הכמות שבה המחיר שווה לעלות השולית (כמו בשוק תחרותי), אך פונה את כל עודף הכלכלי הקשור למוצר שלו ומבטל את כל עודף הרווחה באובדן.
משוואה:$P = MC$
Source: College Board AP Course and Exam Description · מקור: תיאור הקורס והמבחן של College Board AP
English
Price discrimination 价格歧视 is charging different buyers different prices for the same good. It requires market power, the ability to separate buyers by willingness to pay, and the ability to prevent resale.
Under perfect (first-degree) price discrimination, the firm charges each buyer their maximum price. The result: the firm produces the efficient quantity (where $P=MC$, no deadweight loss), but converts all consumer surplus into producer surplus (profit). Real examples – student discounts, airline fares, coupons – are partial versions.
עברית
אפיוס מחירים הוא גביית מחירים שונים ממרכשים שונים עבור אותו מוצר. הדבר דורש כוח שוק, יכולת להפרדה בין קונים לפי נכונותם לשלם, ויכולת למנוע מכירה חוזרת.
תחת אפיוס מחירים מושלם (דרגה ראשונה), החברה מגדירה לכל קונה את המחיר המקסימלי שלו. התוצאה: החברה מייצרת את הכמות יעילה (כאשר $P=MC$, אין אובדן שוקף), אך ממירה את כל עודף הצרכן לעודף המייצר (רווח). דוגמאות אמיתיות – הנחות לסטודנטים, מחירי טיסות, קופונים – הן גרסאות חלקיות.
Explore · חקור
Elasticity and price discrimination · אלסטיות ואפליית מחירים
Price discrimination charges each group a different price by their elasticity: inelastic buyers (who won't switch) pay more, elastic buyers pay less. Stretch the curve to see why. · אפליית מחירים גובה מחיר שונה לכל קבוצה בהתאם ל-אלסטיות שלה: קונים אלסטיים (שלא יעברו לקבוצה אחרת) משלמים יותר, וקונים אלסטיים משלמים פחות. מתיחו את העקום כדי לראות מדוע.
4.4
Monopolistic Competition · תחרות מונופוליסטית
Syllabus · סיילבוס
English
Enduring Understanding (PRD-3): Even with a common goal of profit-maximization, market structure constrains and influences prices, output, and efficiency.
Learning Objective PRD-3.B: b. Explain (using graphs where appropriate) equilibrium, firm decision making, consumer surplus, producer surplus, profit (loss), and deadweight loss in imperfectly competitive markets and why prices in imperfectly competitive markets cannot be relied on to coordinate the actions of all possible market participants and can lead to inefficient outputs. c. Calculate (using data from a graph or table as appropriate) areas of consumer surplus, producer surplus, profit (loss), and deadweight loss in imperfectly competitive markets.
PRD-3.B.10 In a market with monopolistic competition, firms producing differentiated products may earn positive, negative, or zero economic profit in the short run. Firms typically use advertising as a means of differentiating their product. Free entry and exit drive profits to zero in the long run. The output level, however, is smaller than the output level needed to minimize average total costs, creating excess capacity. The price is greater than marginal cost, creating allocative inefficiency.
עברית
הבנה מתמשכת (PRD-3): גם כאשר יש מטרות משותפות למקסום הרווח, המבנה השוקי מגביל ומשפיע על מחירים, תוצרת ויעילות.
מטרת למידה PRD-3.B: ב. הסבר (באמצעות גרפים כאשר מתאים) איזון, קבלת החלטות על ידי חברה, עודף צרכן, עודף יצרן, רווח (הפסד) ועודף הרווחה באובדן בשווקים בעלי תחרות לא מושלמת ולמה מחירים בשווקים אלו לא יכולים לספק סמך לקואורדינציה של פעולות כל המשתתפים האפשריים בשוק ולכן עלולים להוביל לביצועים לא יעילים. ג. חשב (באמצעות נתונים מגרף או טבלה כאשר מתאים) את שטחי עודף צרכן, עודף יצרן, רווח (הפסד) ועודף הרווחה באובדן בשווקים בעלי תחרות לא מושלמת.
PRD-3.B.10 בשוק עם תחרות מונופוליסטית, חברות המייצרות מוצרים מובדלים עשויות להרוויח רווח כלכלי חיובי, שלילי או אפס בטווח הקצר. חברות משתמשות בדרך כלל במדיה קמעונאיות ככלי להבדלת המוצר שלהן. כניסה ויציאה חופשיות מובילות לרווחים של אפס בטווח הארוך. רמת הביצועים, עם זאת, היא קטנה מרמת הביצועים הנדרשת כדי למינימיזם את העלויות הכוללות הממוצעות, מה שמייצר קיבולת עודפת. המחיר הוא גדול מהעלות השולית, מה שמייצר אי-יעילות הקצאה.
Source: College Board AP Course and Exam Description · מקור: תיאור הקורס והמבחן של College Board AP
English
Monopolistic competition 垄断竞争 has many firms selling differentiated 差异化 products with easy entry and exit (restaurants, salons, clothing brands). Product differentiation gives each firm a downward-sloping demand curve and thus some price-setting power.
Short run: like a monopoly – produce at $MR=MC$, and profit or loss is possible.
Long run: easy entry competes away profit, so each firm earns zero economic profit, producing where demand is tangent to ATC.
Because it still charges $P>MC$ and does not produce at minimum ATC, it has excess capacity 过剩产能 and is neither allocatively nor productively efficient. The trade-off society accepts is product variety and choice.
עברית
תחרות מונופוליסטית היא רבים של חברות המוכרות מוצרים מובדלים עם כניסה ויציאה קלה (מסעדות, סלונים, מותגים לבגדים). הבדלת מוצרים מעניקה לחברה כלשהי עקומת ביקוש יורדת ולכן כוח קביעת מחירים מסוים.
טווח קצר: כמו במונופול – מייצרים ב$MR=MC$, ויתכן רווח או הפסד.
טווח ארוך: כניסה קלה מתחרה על הרווחים, כך שכל חברה מרוויחה רווח כלכלי אפס, ומייצרת כאשר הביקוש הוא משיק ל-ATC.
משום שהיא עדיין מגדירה $P>MC$ ואינה מייצרת במינימום ATC, יש לה קיבוע יתר והיא neither allocatively nor productively efficient. ההתפשרות שמקבלת החברה היא מגוון מוצרים ובחירה.
4.5
Oligopoly and Game Theory · אוליגופוליה ותורת המשחקים
Syllabus · סיילבוס
English
Enduring Understanding (PRD-3): Even with a common goal of profit-maximization, market structure constrains and influences prices, output, and efficiency.
Learning Objective PRD-3.C: a. Define (using tables as appropriate) key terms, strategies, and concepts relating to oligopolies and simple games. b. Explain (using tables as appropriate) strategies and equilibria in simple games and the connections to theoretical behaviors in various oligopoly market and non-market settings. c. Calculate (using tables as appropriate) the incentive sufficient to alter a player's dominant strategy.
PRD-3.C.1 An oligopoly is an inefficient market structure with high barriers to entry, where there are few firms acting interdependently.
PRD-3.C.2 Firms in an oligopoly have an incentive to collude and form cartels.
PRD-3.C.3 A game is a situation in which a number of individuals take actions, and the payoff for each individual depends directly on both the individual's own choice and the choices of others.
PRD-3.C.4 A strategy is a complete plan of actions for playing a game; the normal form model of a game shows the payoffs that result from each collection of strategies (one for each player).
PRD-3.C.5 A player has a dominant strategy when the payoff to a particular action is always higher independent of the action taken by the other player.
PRD-3.C.6 A Nash equilibrium is a condition describing the set of actions in which no player can increase his or her payoff by unilaterally taking another action, given the other players' actions.
Exclusion statement: Dominant strategies and Nash equilibrium with more than two players or more than two actions per player, mixed-strategy equilibria, extensive form games, and normal form games with more than two players or more than two actions per player are beyond the scope of the course and the AP Exam.
PRD-3.C.7 Oligopolists have difficulty achieving the monopoly outcome for reasons similar to those that prevent players from achieving a cooperative outcome in the Prisoner's Dilemma; nevertheless, prices are generally higher and quantities lower with oligopoly (or duopoly) than with perfect competition.
עברית
הבנה מתמשכת (PRD-3): גם כאשר יש מטרות משותפות למקסום הרווח, המבנה השוקי מגביל ומשפיע על מחירים, תוצרת ויעילות.
מטרת למידה PRD-3.C: א. הגדר (באמצעות טבלאות כאשר מתאים) מונחים, אסטרטגיות ומושגים מרכזיים הקשורים לאוליגופוליות ומשחקים פשוטים. ב. הסבר (באמצעות טבלאות כאשר מתאים) אסטרטגיות ואיזונים במשחקים פשוטים והקשרים להתנהגויות תיאורטיות בשווקי אוליגופוליות ובסביבות לא-שווקיות שונות. ג. חשב (באמצעות טבלאות כאשר מתאים) את התמורה המספקת שישנה את האסטרטגיה הדומיננטית של שחקן.
PRD-3.C.1 אוליגופולית היא מבנה שוק לא יעיל עם מחסומי כניסה גבוהים, בו קיימות מספר מעט של חברות הפועלות באופן תלוי-הדדית.
PRD-3.C.2 לחברות באוליגופולית יש תמורה לפעול קולוזיון ולהקים קרטלים.
PRD-3.C.3 משחק הוא מצב שבו מספר אנשים נוהגים, והתמורה לכל אחד מהם תלויה ישירות גם בבחירה שלו וגם בבחירותיהם של אחרים.
PRD-3.C.4 אסטרטגיה היא תוכנית פעולה מלאה למשחק; דגם הצורה הנורמלית של משחק מציג את התוצאות הנובעות מכל קובץ אסטרטגיות (אחת לכל שחקן).
PRD-3.C.5 לשחקן ישנה אסטרטגיה דומיננטית כאשר התוצאה לפעולה מסוימת גבוהה תמיד, ללא תלות בפעולה שנבחרת על ידי השחקן האחר.
PRD-3.C.6 איזון נאש הוא מצב המתאר קובץ פעולות שבו אין לשחקן כלשהו אפשרות להגדיל את תוצאתו על ידי שינוי חד-צדדי של פעולתו, בהינתן הפעולות של שאר השחקנים.
הצהרת בידוד: אסטרטגיות דומיננטיות ואיזון נאש עם יותר משני שחקנים או יותר משתי פעולות לשחקן, איזונים באסטרטגיות מעורבות, משחקים בצורה הרחבה, ומשחקים בצורה נורמלית עם יותר משני שחקנים או יותר משתי פעולות לשחקן הם מחוץ לתחום הקורס ובחינת AP.
PRD-3.C.7 לאוליגופוליסטים יש קושי להגיע לתוצאה המונופולית ממסיבות הדומות למניעת השחקנים מלהגיע לתוצאה שיתופית במשבר האסיר; עם זאת, בממוצע המחירים גבוהים והכמות נמוכה יותר באוליגופוליה (או דואופוליה) מאשר בתחרות מושלמת.
Source: College Board AP Course and Exam Description · מקור: תיאור הקורס והמבחן של College Board AP
English
An oligopoly 寡头垄断 is a market with a few large, interdependent 相互依存 firms (cars, airlines, phones). Because each firm's best move depends on rivals' moves, we analyze them with game theory 博弈论.
A payoff matrix 收益矩阵 shows each firm's profit for every combination of choices.
A dominant strategy 优势策略 is a firm's best choice regardless of what the rival does.
A Nash equilibrium 纳什均衡 is an outcome where no firm can do better by unilaterally changing its choice.
The classic prisoners' dilemma 囚徒困境 shows why firms often fail to cooperate: both would gain by colluding 勾结 (acting like a monopoly), but each has an incentive to cheat, so they end up at the competitive-ish, lower-profit outcome. Collusion and cartels 卡特尔 are unstable for the same reason (and usually illegal).
Worked example. Two firms each choose a High or Low price. Profits (A, B): both High $\to(10,10)$; A Low, B High $\to(14,4)$; A High, B Low $\to(4,14)$; both Low $\to(6,6)$. For A: if B plays High, Low ($14$) beats High ($10$); if B plays Low, Low ($6$) beats High ($4$) – so Low is A's dominant strategy, and by symmetry B's too. The Nash equilibrium is both Low $(6,6)$, worse for both than the cooperative $(10,10)$ – the prisoners' dilemma in action.
Exam skill: be able to find each firm's dominant strategy and the Nash equilibrium from a 2×2 payoff matrix, and explain why the cooperative outcome is hard to sustain.
עברית
אוליגופול הוא שוק עם מספר מעט של חברות גדולות ותלויות זו בזו (רכבים, חברות תעופה, טלפונים). מכיוון שהתנועה הטובה ביותר של כל חברה תלויה בתנועות המתחרות, אנו מנתחים אותן באמצעות תיאוריית משחקים.
מטרית תשלום מציגת את הרווח של כל חברה עבור כל שילוב אפשרי של בחירות.
אסטרטגיה דומיננטית היא הבחירה הטובה ביותר של חברה בכל מקרה, ללא קשר לפעולת המתחרה.
איזון נאש הוא תוצאה שבה אף חברה אינה יכולה לשפר את מצבה על ידי שינוי חד-צדדי בבחירתה.
הדילמה של האסירים המודל הקלאסי מדגיש מדוע חברות לעיתים קרובות כושלות בשיתוף פעולה: שתי החברות היו נהנות יותר בשיתוף (פעולה כמו מונופול), אך לכל אחת מהן יש תמריץ להסתיר, ולכן הן מגיעות לתוצאה דמוי-תחרותית עם רווח נמוך יותר. שיתוף וקרTEL (קרטלים) הם לא יציבים מאותה סיבה (וגם בדרך כלל לא חוקיים).
דוגמה מפורטת. שתי חברות בוחרות מחיר גבוה או נמוך. הרווחים (A, B): שניהם גבוהים $\to(10,10)$; A נמוך, B גבוה $\to(14,4)$; A גבוה, B נמוך $\to(4,14)$; שניהם נמוכים $\to(6,6)$. עבור A: אם B מתממש בגבוה, נמוך ($14$) עדיף על גבוה ($10$); אם B מתממש בנמוך, נמוך ($6$) עדיף על גבוה ($4$) – לכן נמוך היא האסטרטגיה הדומיננטית של A, ובסימטריה גם של B. איזון נאש הוא שניהם נמוכים $(6,6)$, גרוע יותר לשתי החברות מאשר התוצאה השיתופית $(10,10)$ – הדילמה של האסירים בפועל.
דילמת האסירים: האסטרטגיה הדומיננטית של כל חברה היא נמוכה, מה שמוביל לאיזון נאש
מיומנות לבחינה: יכולת למצוא את האסטרטגיה הדומיננטית של כל חברה ואת איזון נאש ממטרית תשלום 2×2, ולהסביר מדוע קשה לשמר תוצאה שיתופית.
Enduring Understanding (PRD-4): Factor prices provide incentives and convey information to firms and factors of production.
Learning Objective PRD-4.A:
a. Define (using graphs where appropriate) key terms and concepts relating to factor markets.
b. Explain (using graphs where appropriate) the relationship between factors of production, firms, and factor prices.
c. Calculate (using data from a graph or table where appropriate) the marginal revenue product and marginal resource cost.
PRD-4.A.1 Factors of production (labor, capital, and land) respond to factor prices (wages, interest, and rent), and employers' (firms') decision to hire is based on the productivity of the factors, output price, and cost of the factor.
PRD-4.A.2 The quantity of labor demanded is negatively related to the wage rate, while the quantity of labor supplied is positively related to the wage rate in a given labor market, other things constant.
עברית
הבנה מתמשכת (PRD-4): מחירי גורמים מספקים חواف ומעבירים מידע לחברות ולגורמי ייצור.
מטרות הלמידה PRD-4.A:
א. הגדר (באמצעות גרפים כשמתאים) מונחים וקונספטים מרכזיים הקשורים לשוקי הגורמים.
ב. הסבר (באמצעות גרפים כשמתאים) את הקשר בין גורמי ייצור, חברות ומחירי גורמים.
ג. חשב (באמצעות נתונים מגרף או טבלה כשמתאים) את התמ
PRD-4.A.1 גורמי ייצור (עבודה, הון ואדמה) מגיבים למחירי גורמים (שכר, ריבית ושכירות), והחלטת בעלי עסקים (חברות) לגייס נובעת מתוך תפוקת הגורמים, מחיר התוצרת ועלות הגורם.
PRD-4.A.2 הכמות המבוקשת של עבודה נמצאת בקשר הפוך עם שיעור השכר, בעוד שהכמות המסופקת של עבודה נמצאת בקשר ישיר עם שיעור השכר בשוק עבודה נתון, כל שאר הדברים קבועים.
Source: College Board AP Course and Exam Description · מקור: תיאור הקורס והמבחן של College Board AP
A garment factory: factor markets determine wages for labour and other inputs
A factor market 要素市场 is where firms buy the factors of production – labor, land, capital. The roles reverse: firms demand and households supply. The most-tested factor is labor.
A competitive labour market sets the wage where labour demand meets labour supply
Factor demand is a derived demand 派生需求 – firms want labor not for itself but for the output (and revenue) it produces. So the demand for workers depends on the demand for the product they make.
Explore · חקור
A labour (factor) market · שוק עבודה (גורמי ייצור)
In a factor market firms demand labour and households supply it; the wage settles where demand meets supply. Shift either curve and watch the wage and employment move. · ב-שוק גורמי ייצור, חברות מבקשות עבודה והבתים מספקים אותה; השכר נקבע שבו הביקוש פוגש את ההיצע. הזיזו אחת מעקומות אלו ותצפו כיצד השכר והעסקה משתנים.
Enduring Understanding (PRD-4): Factor prices provide incentives and convey information to firms and factors of production.
Learning Objective PRD-4.B: Explain (using graphs where appropriate) firms' and factors' responses to changes in incentives and constraints.
PRD-4.B.1 Changes in the determinants of labor demand, such as the output price and the productivity of the worker, cause the labor demand curve to shift.
PRD-4.B.2 Changes in the determinants of labor supply (such as immigration, education, working conditions, age distribution, availability of alternative options, preferences for leisure, and cultural expectations) cause the labor supply curve to shift.
עברית
הבנה מתמשכת (PRD-4): מחירי גורמים מספקים חواف ומעבירים מידע לחברות ולגורמי ייצור.
מטרות הלמידה PRD-4.B: הסבר (באמצעות גרפים כשמתאים) את תגובות החברות וגורמי הייצור לשינויים בחواف ובמגבלות.
PRD-4.B.1 שינויים בקובעי הביקוש לעבודה, כמו מחיר התוצרת ותפוקת העובד, גורמים להזזה של עקומת הביקוש לעבודה.
PRD-4.B.2 שינויים בקובעים של ספק העבודה (כמו הגירה, חינוך, תנאי עבודה, פיזור גילאי, זמינות אפשרויות חלופיות, העדפות לנוחות וצפיות תרבותיות) גורמים להזזה של עקומת הספק העבודה.
Source: College Board AP Course and Exam Description · מקור: תיאור הקורס והמבחן של College Board AP
Labor demand shifts when:
the product price or product demand changes (more valuable output $\Rightarrow$ more labor demanded),
worker productivity changes (better training or capital),
the price of other inputs changes (a substitute input like machines, or a complement).
Labor supply shifts with the number of qualified workers, immigration, workers' preferences (wages needed to attract them), and the wages available in other jobs. The market wage is set where labor demand meets labor supply.
5.3
Profit-Maximizing Behavior in Perfectly Competitive Factor Markets
Syllabus · סיילבוס
English
Enduring Understanding (PRD-4): Factor prices provide incentives and convey information to firms and factors of production.
Learning Objective PRD-4.C:
a. Define (using graphs as appropriate) the characteristics of perfectly competitive factor markets.
b. Explain (using graphs where appropriate) the profit-maximizing behavior of firms buying labor (with other inputs fixed) in perfectly competitive markets.
c. Calculate (using data from a graph or table where appropriate) measures representing the profit-maximizing behavior of firms buying labor (with other inputs fixed) in perfectly competitive markets.
PRD-4.C.1 In a perfectly competitive labor market, the wage is set by the market and each firm hires the quantity of workers, where the marginal factor (resource) cost (wage) equals the marginal revenue product of labor. A typical firm may be a perfect competitor in the labor market even if it is an imperfect competitor in its output markets.
PRD-4.C.2 A typical firm hires labor in a perfectly competitive labor market as long as the marginal revenue product of labor is greater than the market wage.
PRD-4.C.3 To minimize costs or maximize profits, firms allocate inputs such that the last dollar spent on each input yields the same amount of marginal product.
עברית
הבנה מתמשכת (PRD-4): מחירי גורמים מספקים חواف ומעבירים מידע לחברות ולגורמי ייצור.
מטרות הלמידה PRD-4.C:
א. הגדר (באמצעות גרפים כשמתאים) את מאפיין שוקי הגורמים התחרותיים המושלמים.
ב. הסבר (בעזרת גרפים כשמתאים) את התנהגות המקסימום של רווחים של חברות הקונים עבודה (כשהיציבים האחרים קבועים) בשווקים תחרותיים מושלמים.
ג. חישוב (בעזרת נתונים מגרף או טבלה כשמתאים) מדדים המייצגים את התנהגות המקסימום של רווחים של חברות הקונים עבודה (כשהיציבים האחרים קבועים) בשווקים תחרותיים מושלמים.
PRD-4.C.1 בשוק עבודה תחרותי מושלם, השכר נקבע על ידי השוק וכל חברה מעסיקה כמות עובדים שבה העלות המרגלית של הגורם (המשאב) – השכר – שווה לתוצר ההכנסה המרגלי של העבודה. חברה אופיינית עשויה להיות מתחרה מושלמת בשוק העבודה גם אם היא מתחרה לא מושלמת בשווקי הפלט שלה.
PRD-4.C.2 חברה אופיינית מעסיקה עבודה בשוק עבודה תחרותי מושלם כל עוד תוצר ההכנסה המרגלי של העבודה גדול משכר השוק.
PRD-4.C.3 כדי למזער עלויות או למקסם רווחים, החברות מקדישות יציבים כך שהדולר האחרון הנוסף על כל יציב מניב אותה כמות של תוצר מרגלי.
Source: College Board AP Course and Exam Description · מקור: תיאור הקורס והמבחן של College Board AP
A firm decides how many workers to hire with the same marginal logic as everything else – compare the marginal benefit and marginal cost of one more worker.
The marginal benefit of a worker is the marginal revenue product 边际收益产品 (MRP): the extra revenue from one more worker, $MRP = MP \times$ product price (in a competitive product market, where $P=MR$). MRP falls as more workers are hired, because of diminishing marginal product.
The marginal cost of a worker is the wage (in a competitive labor market the firm is a wage taker, so marginal factor cost $=$ the wage).
Hiring rule: hire workers up to where $MRP = \text{wage}$ (more generally, $MRP = MFC$). The MRP curve is the firm's labor demand curve.
Worked example. A worker's marginal product is $8$ units and the firm sells each in a competitive market for $\$5$, so $MRP=8\times\$5=\$40$. If the wage is $\$30$, the firm hires this worker because $MRP>\text{wage}$. As more workers join, diminishing marginal product pulls MRP down; the firm keeps hiring until a worker whose $MP=6$ gives $MRP=6\times\$5=\$30$, exactly the wage – the profit-maximizing stopping point.
To choose the least-cost combination of two inputs, set the MP-per-dollar equal across inputs: $\dfrac{MP_L}{P_L}=\dfrac{MP_K}{P_K}$ – the same equal-bang-per-buck rule as consumer choice.
Exam skill: compute MRP from a table (marginal product $\times$ price) and find how many workers to hire at a given wage – a common free-response task.
A car assembly line: firms hire labour until the marginal revenue product equals the wage
Enduring Understanding (PRD-4): Factor prices provide incentives and convey information to firms and factors of production.
Learning Objective PRD-4.D:
a. Define (using graphs as appropriate) the characteristics of monopsonistic markets.
b. Explain (using graphs where appropriate) the profit-maximizing behavior of firms buying labor (with other inputs fixed) in monopsonistic markets.
c. Calculate (using data from a graph or table where appropriate) measures representing the profit-maximizing behavior of firms buying labor (with other inputs fixed) in monopsonistic markets.
PRD-4.D.1 In a monopsonistic labor market, a typical firm hires additional labor as long as the marginal revenue product is greater than the marginal factor (resource) cost (the wage of a new unit of labor plus the wage increase given to all existing labor).
PRD-4.D.2 When a typical firm hires additional workers in a monopsonistic labor market, the marginal factor (resource) cost is greater than the supply price of labor.
עברית
הבנה מתמשכת (PRD-4): מחירי גורמים מספקים חواف ומעבירים מידע לחברות ולגורמי ייצור.
מטרות לימוד PRD-4.D:
א. הגדר (בעזרת גרפים כשמתאים) את מאפייני שווקים מונופסוניים.
ב. הסבר (בעזרת גרפים כשמתאים) את התנהגות המקסימום של רווחים של חברות הקונים עבודה (כשהיציבים האחרים קבועים) בשווקים מונופסוניים.
ג. חישוב (בעזרת נתונים מגרף או טבלה כשמתאים) מדדים המייצגים את התנהגות המקסימום של רווחים של חברות הקונים עבודה (כשהיציבים האחרים קבועים) בשווקים מונופסוניים.
PRD-4.D.1 בשוק עבודה מונופסוני, חברה אופיינית מעסיקה עבודה נוספת כל עוד תוצר ההכנסה המרגלי גדול מהעלות המרגלית של הגורם (המשאב) – שכר היחידה החדשה של עבודה פלוש העליית השכר המוענקת לכל העובדים הקיימים.
PRD-4.D.2 כאשר חברה אופיינית מעסיקה עובדים נוספים בשוק עבודה מונופסוני, העלות המרגלית של הגורם (המשאב) גדולה ממחיר ההיצע של עבודה.
Source: College Board AP Course and Exam Description · מקור: תיאור הקורס והמבחן של College Board AP
A monopsony 买方垄断 is a market with a single buyer of a factor – for example, the only large employer in a town.
Because it is the whole market, the monopsonist faces an upward-sloping labor supply curve: to hire more workers it must raise the wage for everyone.
So the marginal factor cost 边际要素成本 (MFC) is above the wage (like $MR for a monopoly, in reverse), and the MFC curve lies above the supply curve.
The monopsonist hires where $MRP = MFC$, then pays the lower wage the supply curve allows at that quantity.
Result: compared with a competitive labor market, a monopsony hires fewer workers at a lower wage – the mirror image of monopoly.
A monopsony hires where MFC = MRP and pays a lower wage than a competitive market
Exam skill: draw the monopsony graph (supply, MFC above it, MRP as demand), mark quantity at $MRP=MFC$ and the wage down on the supply curve, and contrast it with the competitive wage and quantity.
Socially Efficient and Inefficient Market Outcomes · תוצאות שוק יעילות חברתית ואי-יעילות
Syllabus · סיילבוס
English
Enduring Understanding (POL-2): Perfectly competitive markets allocate resources efficiently, but imperfect competition often results in market inefficiencies.
Learning Objective POL-2.A:
a. Define social efficiency.
b. Explain (using graphs where appropriate) why resource allocation in perfectly competitive markets is socially efficient.
POL-2.A.1 The optimal quantity of a good occurs where the marginal benefit of consuming the last unit equals the marginal cost of producing that last unit, thus maximizing total economic surplus.
POL-2.A.2 The market equilibrium quantity is equal to the socially optimal quantity only when all social benefits and costs are internalized by individuals in the market. Total economic surplus is maximized at that quantity. [See also PRD-3 and POL-3.]
Learning Objective POL-2.B: Explain (using graphs where appropriate) how private incentives can lead to actions by rational agents that are socially undesirable (inefficient) market outcomes.
POL-2.B.1 Rational agents can pursue private actions to exploit or exercise market characteristics known as market power.
POL-2.B.2 Rational agents make optimal decisions by equating private marginal benefits and private marginal costs that can result in market inefficiencies.
POL-2.B.3 Policymakers use cost-benefit analysis to evaluate different actions to reduce or eliminate market inefficiencies.
POL-2.B.4 Market inefficiencies can be eliminated by designing policies that equate marginal social benefit with marginal social cost.
Learning Objective POL-2.C:
a. Explain equilibrium allocations in imperfect markets relative to efficient allocations (using graphs where appropriate) and why these markets are inefficient.
b. Calculate (using graphs where appropriate) the deadweight loss resulting from the production of a non-efficient quantity.
POL-2.C.1 Equilibrium allocations can deviate from efficient allocations due to situations such as monopoly; oligopoly; monopolistic competition; negative and positive externalities in production or consumption; asymmetric information; and insufficient production of public goods.
POL-2.C.2 Producing any non-efficient quantity results in deadweight loss.
עברית
הבנה מתמשכת (POL-2): שווקים תחרותיים מושלמים מקצים משאבים ביעילות, אך תחרות לא מושלמת מובילה לעיתים ליעילות שוק נמוכה.
מטרות למידה POL-2.A:
א. הגדר יעילות חברתית.
ב. הסבר (בעזרת גרפים כשמתאים) מדוע הקצאת משאבים בשווקים תחרותיים מושלמת היא יעילה בחברתית.
POL-2.A.1 הכמות האידיאלית של מוצר מתקבלת כאשר התועלת המרגלית מצריכת היחידה האחרונה שווה לעלות המרגלית לייצור היחידה האחרונה, ובכך מקסימה את הסכום הכלכלי הכולל.
POL-2.A.2 כמות איזון השוק שווה לכמות האופטימלית החברתית רק כאשר כל התועלות והעלויות החברתיות פנימיים על ידי פרטים בשוק. הסכום הכלכלי הכולל מקסימה בכמות זו. [ראה גם PRD-3 ו-POL-3.]
מטרת לימוד POL-2.B: הסבר (בעזרת גרפים כשמתאים) כיצד תמרוצים פרטיים יכולים להוביל לפעולות של סוכנים רציונליים שמובילות לתוצאות שוק לא רצויות (לא יעילות) בחברתית.
POL-2.B.1 סוכנים רציונליים יכולים לבצע פעולות פרטיות כדי לנצל או להפעיל מאפייני שוק הנקראים כוח שוק.
POL-2.B.2 סוכנים רציונליים קובעים החלטות מיטביות על ידי השוואת התועלת המרז'ינלית הפרטית לעלות המרז'ינלית הפרטית, מה שיכול להוביל לחוסר יעילות בשוק.
POL-2.B.3 קובעי מדיניות משתמשים בניתוח עלות-תועלת כדי להעריך פעולות שונות למטרת הפחתה או ביטול חוסרי יעילות בשוק.
POL-2.B.4 חוסרי יעילות בשוק יכולים להיות מבטלים על ידי עיצוב מדיניות המשווה בין התועלת המרז'ינלית החברתית לעלות המרז'ינלית החברתית.
מטרות למידה POL-2.C:
א. הסבר את הקצאות האיזון בשווקים לא מושלמים בהשוואה לקצאות יעילות (בשימוש בגרפים כאשר מתאים) ולמה שווקים אלו אינם יעילים.
ב. חשב (בשימוש בגרפים כאשר מתאים) את ההפסד הנשאר כתוצאה מייצור כמות שאינה יעילה.
POL-2.C.1 הקצאות איזון יכולות לסט מקצאות יעילות בשל מצבים כמו מונופול; אוליגופול; תחרות מונופוליסטית; חיצוניות שלילית וחיובית בייצור או בצריכה; מידע אסימטרי; וייצור בלתי מספק של טובות ציבור.
POL-2.C.2 ייצור כל כמות שאינה יעילה גורם להפסד נשאר.
Source: College Board AP Course and Exam Description · מקור: תיאור הקורס והמבחן של College Board AP
English
A market outcome is socially efficient 社会有效率 when it maximizes total surplus – when the marginal social benefit equals the marginal social cost of the last unit. Perfect competition reaches this on its own. But sometimes markets fail to, producing too much or too little. This is market failure 市场失灵, and it is the main economic justification for government action.
עברית
תוצאת שוק היא יעילה חברתית כאשר היא מקסימה את הסופרפוס הכולל - כאשר התועלת החברתית השולית שווה לעלות החברתית השולית של היחידה האחרונה. תחרות מושלמת מגיעה לכך באופן טבעי. אך לעיתים השוק נכשל בכך, ומייצר יתר או חסר. זוהי כשל שוק, והיא ההצדקה הכלכלית המרכזית לפעולת הממשלה.
יעילות ייצורית היא העלות הנמוכה ביותר; יעילות הקצעה היא ייצור של מה שאנשים רוצים
6.2
Externalities · חיצוניות
Syllabus · סיילבוס
English
Enduring Understanding (POL-3): Private incentives can fail to account for all socially relevant considerations.
Learning Objective POL-3.A:
a. Define externalities.
b. Explain (using graphs where appropriate) how in the presence of externalities, private markets do not take into consideration social costs or social benefits.
POL-3.A.1 The socially optimal quantity of a good occurs where the marginal social benefit of consuming the last unit equals the marginal social cost of producing that last unit, thus maximizing total economic surplus.
POL-3.A.2 Externalities are either positive or negative and arise from lack of well-defined property rights and/or high transaction costs.
POL-3.A.3 In the presence of externalities, rational agents respond to private costs and benefits and not to external costs and benefits.
POL-3.A.4 Rational agents have the incentive to free ride when a good is non-excludable.
Learning Objective POL-3.B: Explain (using graphs where appropriate) how public policies address positive or negative externalities.
POL-3.B.1 Policies that address positive or negative externalities include taxes/subsidies, environmental regulation, public provision, the assignment of property rights, and the reassignment of property rights through private transactions.
עברית
הבנה מתמשכת (POL-3): זמנים פרטיים עשויים להכשל בחישוב כל הconsiderations הרלוונטיות חברתית.
מטרת למידה POL-3.A:
א. הגדר חיצוניות.
ב. הסבר (בשימוש בגרפים כאשר מתאים) כיצד בנוכחות חיצוניות, שווקים פרטיים אינם לוקחים בחשבון עלויות או תועלות חברתיות.
POL-3.A.1 הכמות החברתית האופטימלית של טובה מתקבלת כאשר התועלת המרז'ינלית הצרכנית של היחידה האחרונה שווה לעלות המרז'ינלית הייצורית של אותה יחידה אחרונה, ובכך ממקסמת את הסדר הכלכלי הכולל.
POL-3.A.2 חיצוניות הן חיוביות או שליליות ומופיעות בשל חוסר בזכויות רכוש מוגדרות היטב ו/או עלויות עסקה גבוהות.
POL-3.A.4 לסוכנים רציונליים יש הזדמנות להרוכב על הגבהים כאשר הטובה היא לא ניתנת לשלילה.
מטרות למידה POL-3.B: הסבר (בשימוש בגרפים כאשר מתאים) כיצד מדיניות ציבורית פותרת חיצוניות חיוביות או שליליות.
POL-3.B.1 מדיניות העוסקת בחיצוניות חיוביות או שליליות כוללת מסים/סובסידיות, רגולציה סביבתית, אספקה ציבורית, attribution של זכויות רכוש, ו-reassignment של זכויות רכוש דרך עסקאות פרטיות.
Source: College Board AP Course and Exam Description · מקור: תיאור הקורס והמבחן של College Board AP
English
Negative externalities
An externality 外部性 is a cost or benefit that falls on a third party not involved in the transaction – so the private decision-makers ignore it.
A negative externality 负外部性 (pollution) means marginal social cost > marginal private cost. The market over-produces; the deadweight loss is a triangle. Fixes: a Pigovian tax 庇古税 or regulation to make producers "internalize" the cost (shifting private cost up to social cost).
A positive externality 正外部性 (vaccination, education) means marginal social benefit > marginal private benefit. The market under-produces. Fixes: a subsidy to consumers or producers.
Coase theorem 科斯定理: if property rights are clear and bargaining is costless, private parties can solve an externality themselves – but that is rare with many people involved.
Worked example. A factory's private marginal cost of a chemical is $\$8$ per unit, but each unit also dumps $\$3$ of pollution on neighbors, so the marginal social cost is $\$11$. Ignoring the $\$3$, the market over-produces. A Pigovian tax of exactly $\$3$ per unit raises the firm's private cost to $\$11$ – now equal to the social cost – so the firm cuts output to the efficient quantity and the externality is "internalized."
Exam skill: identify whether an externality is positive or negative, show on a graph that private and social curves diverge, mark the deadweight loss, and name the correcting tax or subsidy.
עברית
סיגריות: חיצוניות אומרת ששוק פרטי עשוי שלא להגיע לתוצאות יעילות חברתיתחיצוניות שלילית
חיצוניות היא עלות או תועלת המוטלת על צד שלישי שאינו מעורב בטרנזקציה – ולכן קובעי החלטות פרטיים מתעלמים ממנה.
חיצוניות שלילית: השוק מייצר יתר, מה שגורם לאובדן רווחה
חיצוניות שלילית (זיהום) פירושה עלות חברתית שולית > עלות פרטית שולית. השוק מייצר יתר; אובדן המשקל המתוך הוא משולש. פתרונות: מס פיגוביאני או רגולציה כדי להפוך את היצרנים ל"פנימיים" בעלות זו (הזזת העלות הפרטית כלפי מעלה לעומת העלות החברתית).
חיצוניות חיובית (חיסונים, חינוך) פירושה תועלת חברתית שולית > תועלת פרטית שולית. השוק מייצר חסר. פתרונות: סובסידיה לצרכנים או ליצרנים.
משפט קוז: אם זכויות הבעייה ברורות ומשא-ומתן אינו עולה דבר, צדדים פרטיים יכולים לפתור חיצוניות עצמם – אך זה נדיר כאשר מעורבים הרבה אנשים.
עומס הוא חיצוניות שלילית: כל נוהג מטיל עלות על כל נוהג אחר שאין עליה מחיר
דוגמה מפורטת. העלות הפרטית השולית של מפעל עבור חומר כימי היא $\$8$ per unit, but each unit also dumps $\$3$ של זיהום לשכנים, ולכן העלות החברתית השולית היא $\$11$. Ignoring the $\$3$, והשוק מייצר יתר. מס פיגוביאני בגובה מדויק של $\$3$ per unit raises the firm's private cost to $\$11$** – כעת שווה לעלות החברתית – כך שהחברה מקצרת את ההיצע לכמות היעילה והחיצוניות "מפנימה".
מיומנות לבחנה: זיהוי האם חיצוניות היא חיובית או שלילית, הצגה בגרף שמראה שהכ curves הפרטי והחברתי נפרדים, סימון אובדן המשקל המתוך וNaming המס או הסובסידיה המ纠正.
זיהום תעשייתי: חיצוניות שלילית שבה העלות החברתית עולה על העלות הפרטית
Explore · חקור
A market with an externality · שוק עם חיצוניות
An externality makes private cost differ from social cost, so the free-market quantity is inefficient. See the deadweight loss and how a tax or subsidy corrects it. · חיצוניות גורמת לעלות הפרטית להשתנות מהעלות החברתית, ולכן הכמות בשוק החופשי היא לא יעילה. ראו את ההפסד הקיים (deadweight loss) וכיצד מס או סובסידיה מתקנים אותו.
Public and Private Goods · סחורות ציבוריות ופרטיות
Syllabus · סיילבוס
English
Enduring Understanding (POL-3): Private incentives can fail to account for all socially relevant considerations.
Learning Objective POL-3.C:
a. Define whether goods are rival and/or excludable.
b. Explain how the nature of rival and/or excludable goods influences the behavior of individuals and groups.
POL-3.C.1 Private goods are rival and excludable, and public goods are non-rival and non-excludable.
POL-3.C.2 Due to the free rider problem, private individuals usually lack the incentive to produce public goods, leaving government as the only producer.
POL-3.C.3 Governments sometimes choose to produce private goods, such as educational services, and to allow free access to them.
POL-3.C.4 Some natural resources are, by their nature, non-excludable and rival and therefore open access. Private individuals inefficiently overconsume such resources.
עברית
הבנה מתמשכת (POL-3): זמנים פרטיים עשויים להכשל בחישוב כל הconsiderations הרלוונטיות חברתית.
מטרות הלמידה POL-3.C:
א. הגדר האם טובות הן rival ו/או excludable.
ב. הסבר כיצד האופי של סחורות תחרותיות ו/או נשללות משפיע על התנהגותם של פרטים וקבוצות.
POL-3.C.1 סחורות פרטיות הן תחרותיות ונשללות, וסחורות ציבוריות אינן תחרותיות ואינן נשללות.
POL-3.C.2 בשל בעיית רוכב החינם, לפרטים בדרך כלל אין זרימה להפקת סחורות ציבוריות, מה שהותיר את הממשלה כמפיק היחיד.
POL-3.C.3 ממשלות לעיתים בוחרות להפיק סחורות פרטיות, כגון שירותי חינוך, ולאפשר גישה חופשית אליהן.
POL-3.C.4 חלק מהמשאבים הטבעיים הם, באופייהם, לא נשללים ותחרותיים ולכן פתוחים לגישה. פרטים צורכים יתרונה לא יעיל במשאבים אלו.
Source: College Board AP Course and Exam Description · מקור: תיאור הקורס והמבחן של College Board AP
English
Goods differ along two traits: rivalry 竞争性 (does one person's use reduce another's?) and excludability 排他性 (can non-payers be kept out?).
A private good 私人物品 is rival and excludable (a sandwich) – markets handle these well.
A public good 公共物品 is non-rival and non-excludable (national defense, a lighthouse). Because non-payers cannot be excluded, people free-ride 搭便车 – enjoy it without paying – so markets under-provide it, and government usually supplies it.
Common resources 公共资源 are rival but non-excludable (ocean fish); over-use ruins them – the tragedy of the commons 公地悲剧.
עברית
סחורות נבדלות בשני מאפיינים: ריבות (האם שימוש של אדם אחד מפחית את השימוש של אחר?) וניתנות לחסימה (האם ניתן למנוע מי שלא שילם?).
סחורות מסווגות לפי האם הן ריבות וניתנות לחסימה
סחורה פרטית היא ריבות וניתנת לחסימה (סנדविץ') – השוק טיפל בהם היטב.
סחורה ציבורית היא בלתי-ריבותית ובלתי-ניתנת לחסימה (הגנה לאומית, מגדלור). מכיוון שאי אפשר לחסום מי שלא שילם, אנשים מנצלים – נהנים מבלי לשלם – ולכן השוק מספק חסר אותו, והממשלה בדרך כלל מספקת אותו.
משאבי קהילה הם ריבות אך בלתי-ניתנים לחסימה (דגי ים); שימוש מופרז הורס אותם – הטרגדיה של המשאבים הקהילתיים.
6.4
The Effects of Government Intervention in Different Market Structures · השפעות התערבות הממשלה במבני שוק שונים
Syllabus · סיילבוס
English
Enduring Understanding (POL-4): In imperfect markets, well-designed government policy can reduce waste.
Learning Objective POL-4.A:
a. Define government policy interventions in imperfect markets.
b. Explain (using graphs where appropriate) how government policies can alter market outcomes in perfectly and imperfectly competitive markets.
c. Calculate (using data from a graph or table as appropriate) changes in market outcomes resulting from government policies in perfectly competitive and imperfectly competitive markets.
POL-4.A.1 Per-unit taxes and subsidies affect the total price consumers pay, net price firms receive, equilibrium quantity, consumer and producer surpluses, deadweight loss, and government revenue or cost. The impact of change depends on the price elasticity of demand and supply.
POL-4.A.2 Lump-sum taxes and lump-sum subsidies do not change either marginal cost or marginal benefit; only fixed costs will be affected.
POL-4.A.3 Binding price ceilings and floors affect prices and quantities differently depending on the market structures (perfect competition, monopoly, monopolistic competition, and monopsony) and the price elasticities of supply and demand.
POL-4.A.4 Government intervention in imperfect markets can increase efficiency if the policy correctly addresses the incentives that led to the market failure.
POL-4.A.5 Government can use price regulation to address inefficiency due to monopoly.
POL-4.A.6 A natural monopoly will require a lump-sum subsidy to produce at the allocatively efficient quantity.
POL-4.A.7 Governments use antitrust policy in an attempt to make markets more competitive.
Exclusion statement: A graph of inefficiency and policy due to collusion is beyond the scope of the course and the AP Exam.
עברית
הבנה מתמשכת (POL-4): בשווקים שאינם מושלמים, מדיניות ממשלתית מעוצבת היטב יכולה לצמצם בזבוז.
מטרת למידה POL-4.A:
א. הגדר התערבויות מדיניות ממשלתית בשווקים שאינם מושלמים.
ב. הסבר (בשימוש בגרפים כאשר יש מקום) כיצד מדיניות ממשלתית יכולה לשנות תוצאות שוק בשווקים בתחרות מושלמת ובשווקים בתחרות אי-מושלמת.
ג. חישוב (בשימוש בנתונים מגרף או טבלה כפי שיש מקום) שינויים בתוצאות שוק הנובעים ממדיניות ממשלתית בשווקים בתחרות מושלמת ובשווקים בתחרות אי-מושלמת.
POL-4.A.1 מסים לפי יחידה וסבסודים לפי יחידה משפיעים על המחיר הכולל שגולשים משלמים, המחיר הנקי שמפעלים מקבלים, הכמות בשיווי המשקל, העודף הצרכני ועודף המייצר, ההפסד המוחלט והכנסות או עלויות הממשלה. ההשפעה של השינוי תלושה באלסטיות המחיר של הביקוש וההיצע.
POL-4.A.2 מסים וסבסודים דומים אינם משנים את העלות המרוצה או התועלת המרוצה; רק העלויות הקבועות יושפעו.
POL-4.A.3 מחסומי מחיר ומחציות מחיר קבועים משפיעים על מחירים וכמויות בצורה שונה בהתאם למבני השוק (תחרות מושלמת, מונופול, תחרות מונופוליסטית ומונופסוני) ולאלסטיות המחיר של ההיצע והביקוש.
POL-4.A.4 התערבות ממשלתית בשווקים שאינם מושלמים יכולה להגדיל את היעילות אם המדינית מטפלת נכון בתמורות שהובילו לכישלון השוק.
POL-4.A.5 הממשלה יכולה להשתמש בוויסות מחירים כדי להתמודד עם אי-יעילות הנגרמת ממונופול.
POL-4.A.6 מונופול טבעי יהיה זקוק לסבסוד דומה כדי לייצר בכמות יעילה לקצה.
POL-4.A.7 ממשלות משתמשות במדיניות אנטי-תחרותית בניסיון להפוך את השווקים לתחרותיים יותר.
הצהרת פסילה: גרף של אי-יעילות ומדיניות עקב קונספירציה הוא מחוץ להיקף הקורס ובחינת AP.
Source: College Board AP Course and Exam Description · מקור: תיאור הקורס והמבחן של College Board AP
English
Government tools change outcomes differently by structure:
Regulating a monopoly's price toward $P=MC$ can increase efficiency (unlike a price control in a competitive market, which creates shortage/surplus).
Antitrust laws 反垄断法 break up or block anti-competitive mergers and collusion.
Taxes and subsidies shift output toward the socially efficient quantity when externalities are present.
The key insight: the same policy can help or hurt efficiency depending on whether the market was already efficient (competitive) or already failing (monopoly, externality).
Per-unit vs lump-sum. A per-unit tax 从量税 adds to marginal cost, so it shifts supply up, raises price, cuts quantity, and creates deadweight loss. A lump-sum tax 定额税 (a fixed charge like a licence fee) does not change marginal cost or marginal benefit, so in the short run the profit-maximising price and quantity are unchanged – only the firm's profit falls; in the long run it changes entry and exit. For a natural monopoly, regulating price down to $P=MC$ (allocatively efficient) forces a loss, so a lump-sum subsidy 定额补贴 is needed to keep it producing that efficient quantity.
עברית
כלי הממשלה משנים תוצאות בצורה שונה לפי המבנה:
ויסות מחיר של מונופול כ toward $P=MC$ יכול להגדיל יעילות (בניגוד לקביעת מחיר בשוק תחרותי, שיוצר מחסור/עודף).
חוקי אנטי-מונופול מפרקים או חוסמים מיזוגים אנטי-תחרותיים וקולוזיה.
מסים וסובסידיות משנים את הייצור לכיוון הכמות החברתית יעילה כאשר קיימים חיצוניות.
המסקנה המרכזית: אותה מדיניות עשויה לסייע או לפגוע ביעילות תלוי אם השוק היה כבר יעיל (תחרותי) או כשלני (מונופול, חיצוניות).
מס ליחידה לעומת מס פלאט.מס ליחידה מוסיף לעלות השולית, ולכן הוא מזיז את העיקום כלפי מעלה, מעלה את המחיר, מקטין את הכמות וגורם לאובדן יעילות. מס פלאט (עמלה קבועה כמו תעודת רישוי) אינו משנה עלות שולית או תועלת שולית, ולכן בקצר טווח המחיר והכמות המקסימיזציה של רווח נשארים בלתי משונים – רק הרווח של החברה יורד; בטווח הארוך הוא משנה כניסה ויציאה. עבור מונופול טבעי, ויסות מחיר ל$P=MC$ (יעילות הקצאה) מחייב הפסד, ולכן נדרשת סובסידיית פלאט כדי לשמור על הייצור בכמות היעילה זו.
6.5
Inequality · אי-שוויון
Syllabus · סיילבוס
English
Enduring Understanding (POL-5): Market outcomes can result in income inequality.
Learning Objective POL-5.A: Define measures of economic inequality in income and wealth.
POL-5.A.1 Income levels and poverty rates vary greatly both across and within groups (e.g., age, gender, race) and countries.
POL-5.A.2 The Lorenz curve and Gini coefficient are used to represent the degree of inequality in distributions and to compare distributions across different countries, policies, or time periods.
Exclusion statement: Drawing the Lorenz curve and calculating Gini coefficients are beyond the scope of the course and the AP Exam.
Learning Objective POL-5.B: Explain sources of income and wealth inequality.
POL-5.B.1 Each factor of production receives the value of its marginal product, which can contribute to income inequality.
POL-5.B.2 Sources of income and wealth inequality include differences in tax structures (progressive and regressive tax structures), human capital, social capital, inheritance, effects of discrimination, access to financial markets, mobility, and bargaining power within economic and social units (firms, labor unions, and families).
עברית
הבנה מתמשכת (POL-5): תוצאות שוק עשויות לייצר אי-שוויון in income.
מטרות למידה POL-5.A: הגדרת מדדי אי-שוויון כלכלי בהכנסה ובנכסים.
POL-5.A.1 רמות ההכנסה ושיעורי העוני משתנים מאוד גם בין קבוצות שונות וגם בתוך קבוצות (למשל: גיל, מגדר, גזע) וגם בין מדינות שונות.
POL-5.A.2 עקומת לורנץ וקואפיקיינט גיני משמשים להצגת מידת האי-שוויון בחלוקות ולביצוע השוואות בין חלוקות במדינות, מדיניותים או תקופות זמן שונות.
הצהרת בלילה: ציור עקומת לורנץ וחישוב קואפיקיינט גיני אינם נמצאים בתחום הלימודים ובמסגרת המבחן האקדמי.
מטרות למידה POL-5.B: הסבר על מקורות של אי-שוויון בהכנסה ובנכסים.
POL-5.B.1 לכל גורם ייצור מיוחסת ערכו של המוצר המרגינלי שלו, מה שיכול לתרום לאי-שוויון בהכנסה.
POL-5.B.2 מקורות לאי-שוויון בהכנסה ובנכסים כוללים הבדלים במבני המיסוי (מבני מיסוי הולכים ועולים ומבני מיסוי הולכים וירודים), הון אנושי, הון חברתי, ירושה, השפעות של אפליה, גישה לשווקים פיננסיים, תנועתיות וכוח מفاوضה בתוך יחידות כלכליות וחברתיות (חברות, איגודי עובדים ומשפחות).
Source: College Board AP Course and Exam Description · מקור: תיאור הקורס והמבחן של College Board AP
English
Markets reward productivity, but the resulting income distribution 收入分配 can be very unequal. Economists measure it with the Lorenz curve 洛伦兹曲线 (share of income against share of population; the further it bows from the 45° line, the more unequal) and the Gini coefficient 基尼系数 (0 = perfect equality, 1 = perfect inequality).
Worked example. Suppose the poorest $20\%$ of households earn just $5\%$ of income, while the richest $20\%$ earn $50\%$. Under perfect equality each $20\%$ would earn exactly $20\%$, so the Lorenz curve would be the $45°$ line. Because the bottom fifth is well below $20\%$ and the top fifth well above, the curve bows far beneath the diagonal – a large gap that means a high Gini coefficient and substantial inequality.
Sources of inequality include differences in human capital 人力资本 (skills, education), inheritance, and discrimination. Governments redistribute through progressive taxes 累进税 (higher rates on higher incomes) and transfer payments 转移支付 (welfare, subsidies). There is a debated efficiency–equity trade-off 效率与公平权衡: redistribution can reduce work incentives, so societies balance fairness against the size of the total pie.
עברית
שוקים מעניקים פריון לפרודוקטיביות, אך ההתפלגות התוצאה resulting התפלגות הכנסות עשויה להיות מאוד לא שוויונית. כלכלנים מדדים אותה באמצעות עקומת לורנץ (נתחום הכנסה מול נתחום האוכלוסייה; ככל שהיא מתכופפת יותר מקו ה-45°, כך האי-שוויון גדול יותר) ובאמצעות מדד גיני (0 = שוויון מושלם, 1 = אי-שוויון מושלם).
עקומת לורנץ ומדד גיני מדדים אי-שוויון הכנסות
דוגמה מפורטת. נניח שהעשירים ביותר $20\%$ מבתי המשפחה מרוויחים רק $5\%$ מההכנסה, בעוד שהעשירים ביותר $20\%$ מרוויחים $50\%$. תחת שוויון מושלם כל ⟨$20\%$⟩ would earn exactly $20\%$, so the Lorenz curve would be the $45°$ line. Because the bottom fifth is well below $20\%$ and the top fifth well above, the curve bows far beneath the diagonal – a large gap that means a high Gini coefficient and substantial inequality.
מקורות לא-שוויון כוללים הבדלים בהון אנושי (מיומנויות, חינוך), ירישה ואפליה. ממשלות מעבירות חלוקה מחדש דרך מסים הולכים ועולים (שיעורים גבוהים יותר להכנסות גבוהות) ותשלומי העברה (רווחה, סובסידיות). קיים דיון על החלפת יעילות–שוויון: חלוקה מחדש עשויה להפחית את ההערכות העבודה, ולכן חברות מאזנות בין צדק לבין גודל העוגה הכוללת.
עושר ועוני לצד זה: שוק לבדו עשיר להשאיר אי-שוויון הכנסה גדול ללא מענה
Explore · חקור
Measure inequality with a Lorenz curve · מדדו אי-שוויון באמצעות עקום לורנץ
A Lorenz curve plots cumulative income against cumulative population; the further it bows from the diagonal, the more unequal — summarised by the Gini coefficient. · עקום לורנץ מציג הכנסה מצטברת כנגד אוכלוסייה מצטברת; ככל שהעקום מתרחק מהדיאגונל, כך האי-שוויון גדול יותר — דבר שמסוכך על ידי מקדם ג'יני.
A negative externality makes the market over-produce; correct with a Pigovian tax equal to the external cost. A positive externality under-produces; correct with a subsidy.
A public good is non-rival and non-excludable, so free-riding leads markets to under-provide it.
Classify goods by rivalry and excludability; common resources (rival, non-excludable) suffer the tragedy of the commons.
The same policy can help or hurt efficiency depending on whether the market was already efficient or failing.
Measure inequality with the Lorenz curve and Gini coefficient (0 = equality, 1 = inequality).
עברית
חיצוניות שלילית גורמת לשוק לייצר יותר מדי; מתקנים זאת עם מס פיגוב השווה לעלות החיצונית. חיצוניות חיובית גורמת לייצור מועט מדי; מתקנים זאת עם סובסידיה.
טוב ציבורי הוא לא-רival ולא-excludable, ולכן free-riding גורם לשוק לספק אותו בפחות מכמות הנדרשת.
למיין טובים לפי rivalry ו-excludability; משאבים משותפים (rival, non-excludable) סובלים מאסון המשאבים המשותפים.
אותה מדינית יכולה לסייע או לפגוע ביעילות תלוי אם השוק היה כבר יעיל או כשלני.
Pick one and the site follows you — notes, papers, videos and practice all open on it. · בחרו נושא אחד והאתר יעקוב אחריו — הערות, מסמכים, וידאו ותרגולים פתוחים בו.
Type to search notes, lessons, code, vocabulary and past-paper questions across every subject. · הקלד כדי לחפש הערות, שיעורים, קוד, אוצר מילים ושאלות מבחנים בכל הנושאים.