In this experiment, you will investigate the cooling of hot water in a beaker. Refer to Fig. 2.1.
(a)
Use the thermometer to measure the temperature $\theta_R$ of the water in the container labelled ‘cold water’.
$\theta_R$ = [1]
(b)
(i)
$V$ is the total volume of water in beaker A.
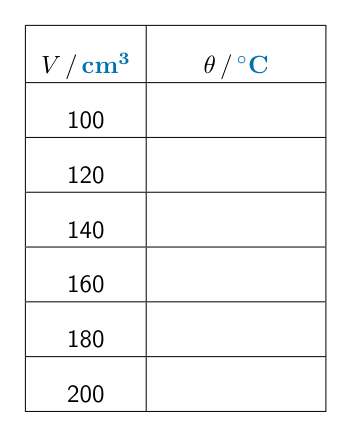
Complete the column headings in Table 2.1.
Table 2.1
V/
$\theta$/
100
120
140
160
180
200
[1]
(ii)
• Pour 100 cm$^3$ of hot water into beaker A.
Place the thermometer in the hot water in beaker A.
Record in Table 2.1 the temperature $\theta$ of the hot water.
Without delay, use the measuring cylinder to add 20 cm$^3$ of the cold water to the water in beaker A.
Stir the water in beaker A.
Record in Table 2.1 the temperature of the mixture of hot and cold water.
Repeat the procedure, adding 20 cm$^3$ of cold water each time, until you have a total of 200 cm$^3$ of water in beaker A.
[3]
(c)
Plot a graph of temperature $\theta$ (y-axis) against total volume of water $V$ (x-axis).
You do not need to start the axes at the origin (0,0).
Draw the best-fit curve.
[4]
(d)
Suggest two ways to minimise the loss of thermal energy from the beaker during the experiment.
1
2
[2]
[Total: 11]
Show the mark scheme
These are the official mark-scheme rows. Each point that matches your answer earns a mark.
Tap the mark scheme to open it full size.
Show a worked answer
How to reach each mark, step by step. Try the question yourself first.
2(a)
Read the thermometer in the cold water and include the unit. For example, $\theta_R = \mathbf{20}\,^{\circ}\mathrm{C}$; use your own reading.
2(b)(i)
Label the volume column $V/\mathrm{cm^3}$ and the temperature column $\theta/{}^\circ\mathrm{C}$.
2(b)(ii)
Record the initial hot-water temperature and then the temperature after each addition. For example, readings could be $\mathbf{70}$, $\mathbf{62}$, $\mathbf{56}$, $\mathbf{52}$, $\mathbf{48}$ and $\mathbf{45}\,^{\circ}\mathrm{C}$.
Use your own readings, recorded to at least the nearest $1\,^{\circ}\mathrm{C}$. The temperature should decrease as cold water is added.
2(c)
Label the horizontal axis $V/\mathrm{cm^3}$ and the vertical axis $\theta/^{\circ}\mathrm{C}$. Choose scales that use at least half the grid.
Plot each of your six readings accurately, within half a small square, and draw a thin, continuous best-fit curve.
2(d)
Wrap insulation around the beaker to reduce energy transfer to the surroundings.
Put a lid on the beaker to reduce energy transfer from the water surface.