Scatter diagrams and correlation
Введено| English | Значение |
|---|---|
| scatter diagram/ˈskætə ˈdaɪəɡræm/ | диаграмма рассеяния |
| correlation/ˌkɒrɪˈleɪʃn/ | корреляция |
| positive correlation/ˈpɒzɪtɪv ˌkɒrɪˈleɪʃn/ | положительная корреляция |
| negative correlation/ˈneɡətɪv ˌkɒrɪˈleɪʃn/ | отрицательная корреляция |
| line of best fit/laɪn ɒv best fɪt/ | линия наилучшего приближения |
| extrapolation/ekˈstræpəleɪʃn/ | экстраполяция |
| outlier/ˈaʊtlaɪə/ | выброс |
Do tall people have bigger feet?
- Plot height against shoe size for 30 people and you'll see a pattern: taller people tend to have larger feet.
- A scatter diagram 散点图 reveals whether two variables are linked — and how strongly.
Correlation 相关性
- Positive correlation 正相关: as one goes up, the other goes up (points slope upward).
- Negative correlation 负相关: as one goes up, the other goes down (points slope downward).
- Zero correlation: no clear pattern (points scattered randomly).
Correlation $\neq$ causation. Ice cream sales and drowning deaths both rise in summer — but ice cream doesn't cause drowning. Both are caused by a third factor: hot weather.
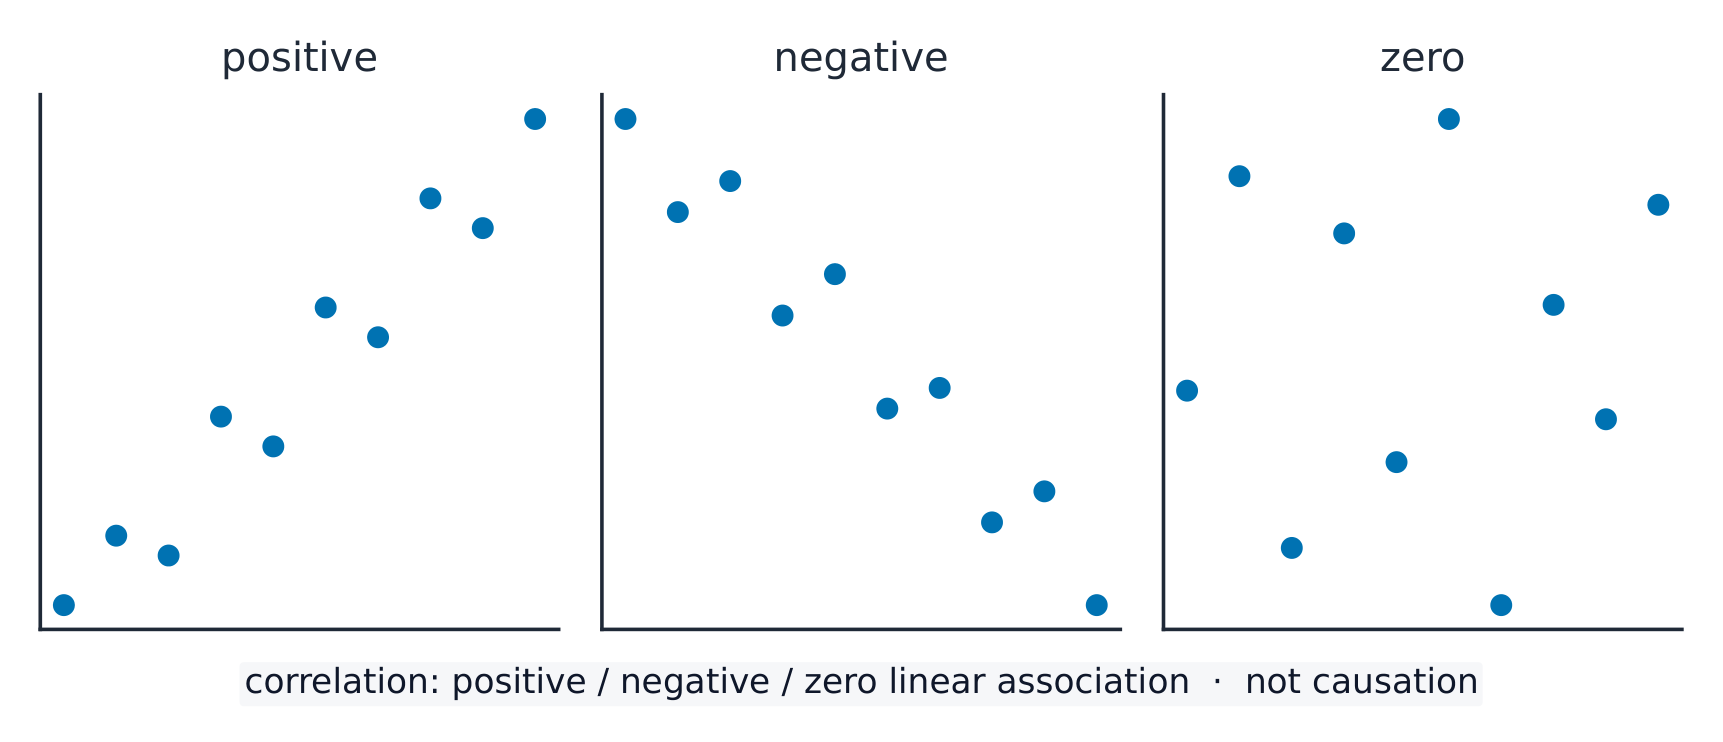
Positive correlation: both rise together. Negative: one rises as the other falls. Zero: no clear link
Scatter & correlation
r близко к ±1 = сильная
Tighten the points to see сильный correlation; scatter them for слабый — read r and the line.
As one quantity increases, the other also increases. This is:
Сложность 1/5 · 100 монет + небольшой бонус за первое завершение сегодня
Both rising together is positive correlation.
Negative correlation means as one quantity goes up, the other goes down.
Сложность 1/5 · 100 монет + небольшой бонус за первое завершение сегодня
A downward trend on the scatter diagram is negative correlation.
If two variables are correlated, one must cause the other.
Сложность 1/5 · 100 монет + небольшой бонус за первое завершение сегодня
Correlation does not prove causation — both could be caused by a third factor.
Line of best fit
- If there is correlation, draw one straight line through the middle of the points, with roughly equal numbers on each side.
- Use it to predict values.
A line of best fit through height-shoe size data: height $170$ cm → predicted shoe size $9$. But don't trust predictions far outside the data range (extrapolation 外推 is risky).
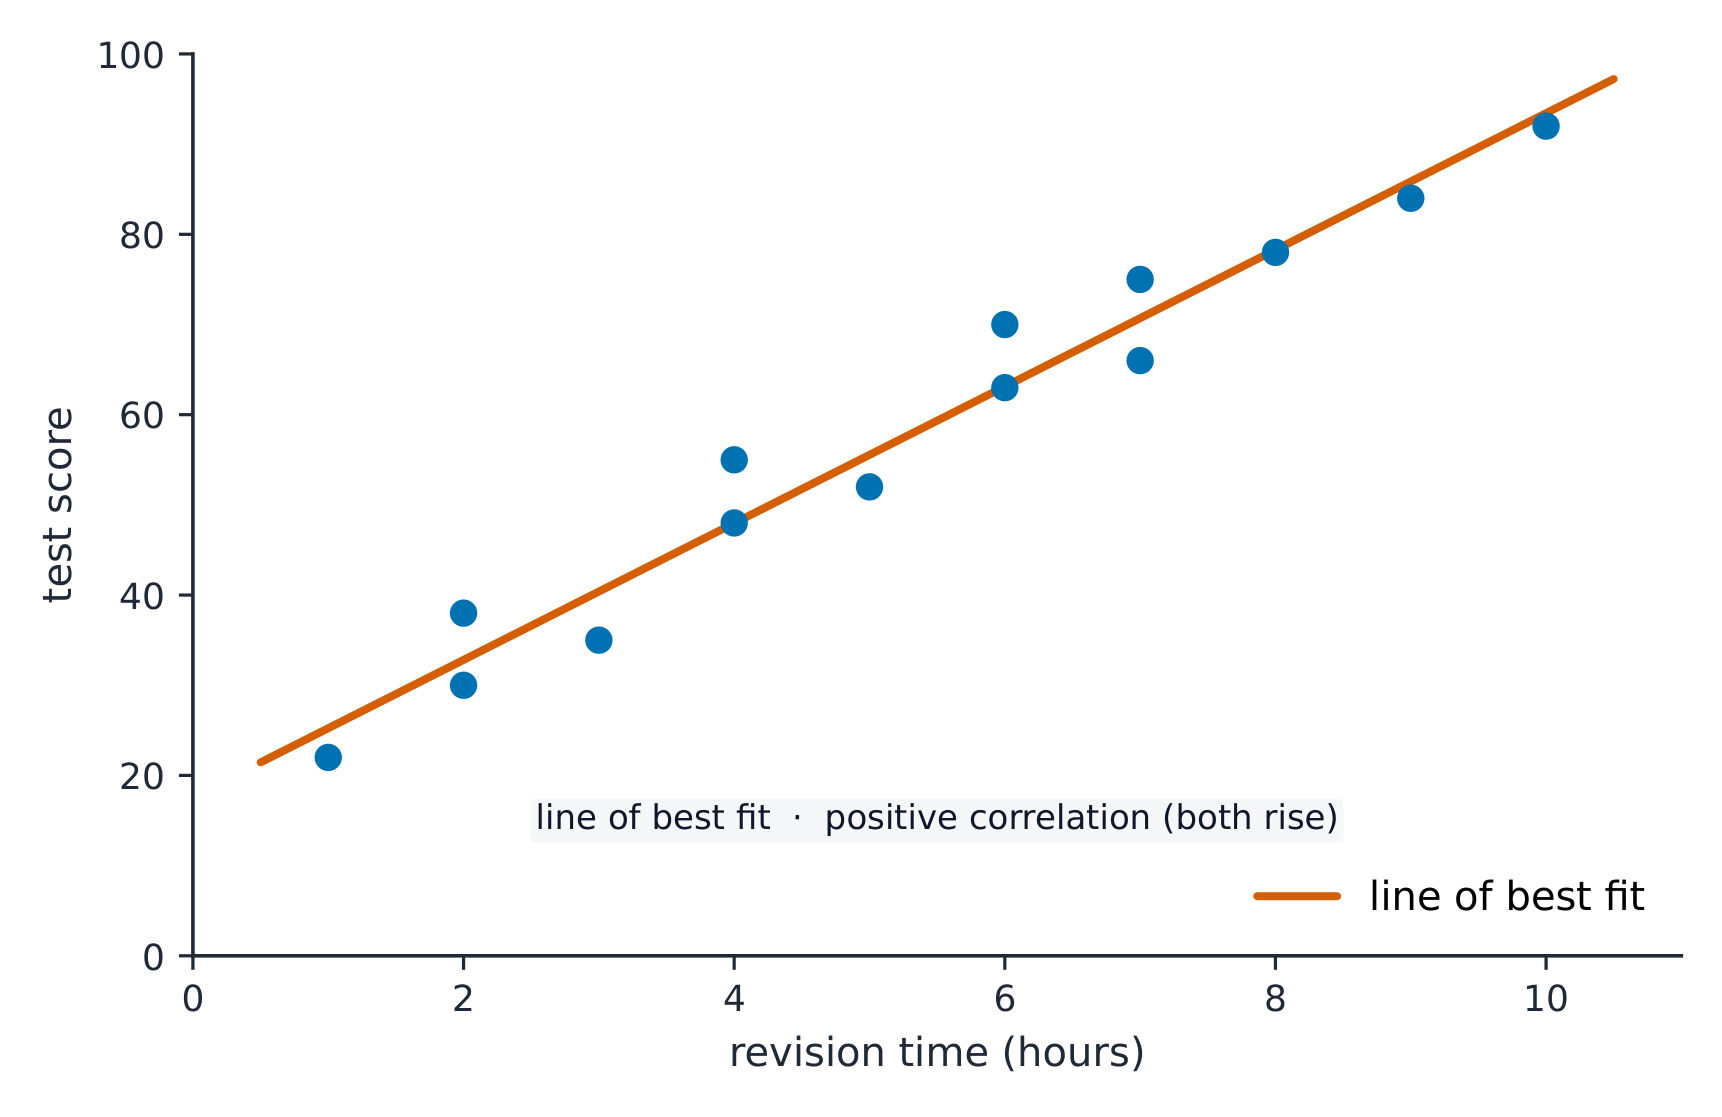
A line of best fit 最佳拟合线 is one straight line through the middle of the points, with about as many on each side; use it to predict
A line of best fit is mainly used to:
Сложность 1/5 · 100 монет + небольшой бонус за первое завершение сегодня
It models the trend so you can predict one value from the other.
Using the line of best fit to predict values far outside the data range is called ______.
Сложность 1/5 · 100 монет + небольшой бонус за первое завершение сегодня
Extrapolation is unreliable because the trend may not continue beyond the observed data.
Outliers 异常值 on scatter diagrams
- A point far from the general pattern is an outlier.
- Investigate before removing it — it might be a genuine unusual case, or a recording error.
On a scatter diagram, most points follow a line, but one point is far away. This point is called an ______.
Сложность 1/5 · 100 монет + небольшой бонус за первое завершение сегодня
An outlier is a data point that does not fit the general pattern.
Plot pairs and read an estimate
- Mark each pair with a small cross, not joined points. For $(1,12),(2,15),(3,19),(4,20),(5,24)$, a sensible by-eye line is close to $y=3x+9$; it spans all the data and roughly balances the points above and below.
- At $x=3.5$, this line estimates $y=19.5$. A nearby balanced line may give a slightly different answer. Predicting at $x=20$ is extrapolation and much less secure; correlation alone does not prove cause.
Use the line y = 3x + 9 to estimate y at x = 3.5.
Сложность 2/5 · 140 монет + небольшой бонус за первое завершение сегодня
y = 3(3.5) + 9 = 19.5.
Model answers: describe and interpret
A scatter diagram shows hours of revision against test mark for 15 students.
| The question asks | Weak answer | Full-mark answer |
|---|---|---|
| Type of correlation | "It goes up." | Positive correlation. |
| What it means | "They are linked." | Students who revised for longer tended to get higher marks. |
| Can we predict for 30 hours? | "Yes, use the line." | No: 30 hours is outside the data (all values were under 12 hours), so the line may not hold. |
- Name the correlation, then explain it in the context of the two variables.
- Correlation does not prove that one thing causes the other.
A scatter diagram of car age against value shows negative correlation. Which is the best interpretation?
Сложность 1/5 · 100 монет + небольшой бонус за первое завершение сегодня
Negative correlation: as age increases, value tends to decrease. "Tend to" matters: not every car follows the pattern.
If the data runs from x = 2 to x = 10, the line of best fit gives a reliable estimate at x = 25.
Сложность 1/5 · 100 монет + небольшой бонус за первое завершение сегодня
x = 25 is far outside the data. Predicting there is extrapolation, and the pattern may not continue.
You've got it
- positive correlation rises together; negative falls as the other rises; zero $=$ no link
- a line of best fit is one straight line through the middle of the points
- use the line to predict — but don't trust it far outside the data
Write from the data: find the estimate
- Use the line y equals 2x plus 5.
- Estimate y at x equals 4.
Use the line y equals 2x plus 5 to estimate y at x equals 4.
8 plus 5 is 13.
What is the estimate?
Сложность 1/5 · 100 монет + небольшой бонус за первое завершение сегодня
2 times 4 plus 5 is 13. Other options — 19.5 (the lesson estimate); 4 (the input).