Cumulative frequency diagrams
Введено| English | Значение |
|---|---|
| cumulative frequency/ˈkjuːmjʊlətɪv ˈfriːkwənsi/ | накопленная частота |
| median/ˈmiːdiːən/ | медиана |
| quartile/ˈkwɔːtaɪl/ | квартиль |
The running total
- In a marathon, you don't just count runners per age group — you want to know "how many runners have finished by time $t$?"
- That's a cumulative frequency 累积频数: a running total that builds up from the lowest class to the highest.
Cumulative frequency route
Follow raw data into a cumulative frequency curve and percentile reading.
Drawing the curve
- Plot cumulative frequency against the upper end of each class.
- Join the points with a smooth curve (or straight lines).
- The curve always goes up (or stays flat) — it never goes down, because you're adding.
Classes $0$–$10$ (freq $5$), $10$–$20$ (freq $8$), $20$–$30$ (freq $12$): cumulative frequencies are $5, 13, 25$. Plot at $10, 20, 30$.
Cumulative frequency is:
Сложность 1/5 · 100 монет + небольшой бонус за первое завершение сегодня
Each point adds the next class frequency to the total so far.
Cumulative frequency is plotted against the upper end of each class.
Сложность 1/5 · 100 монет + небольшой бонус за первое завершение сегодня
Always plot the running total at the top boundary of the class.
A cumulative frequency curve can go down.
Сложность 1/5 · 100 монет + небольшой бонус за первое завершение сегодня
Cumulative frequency is a running total — it always increases or stays flat, never decreases.
Reading the curve
- Median 中位数: go across at half the total cumulative frequency, then down to the $x$-axis.
- Lower quartile 四分位数 (LQ): at $\dfrac{1}{4}$ of the total.
- Upper quartile (UQ): at $\dfrac{3}{4}$ of the total.
- IQR $=$ UQ $-$ LQ.
Across then down. To read a value from a cumulative frequency curve: go across from the $y$-axis to the curve, then down to the $x$-axis. Going the wrong way gives the wrong answer.
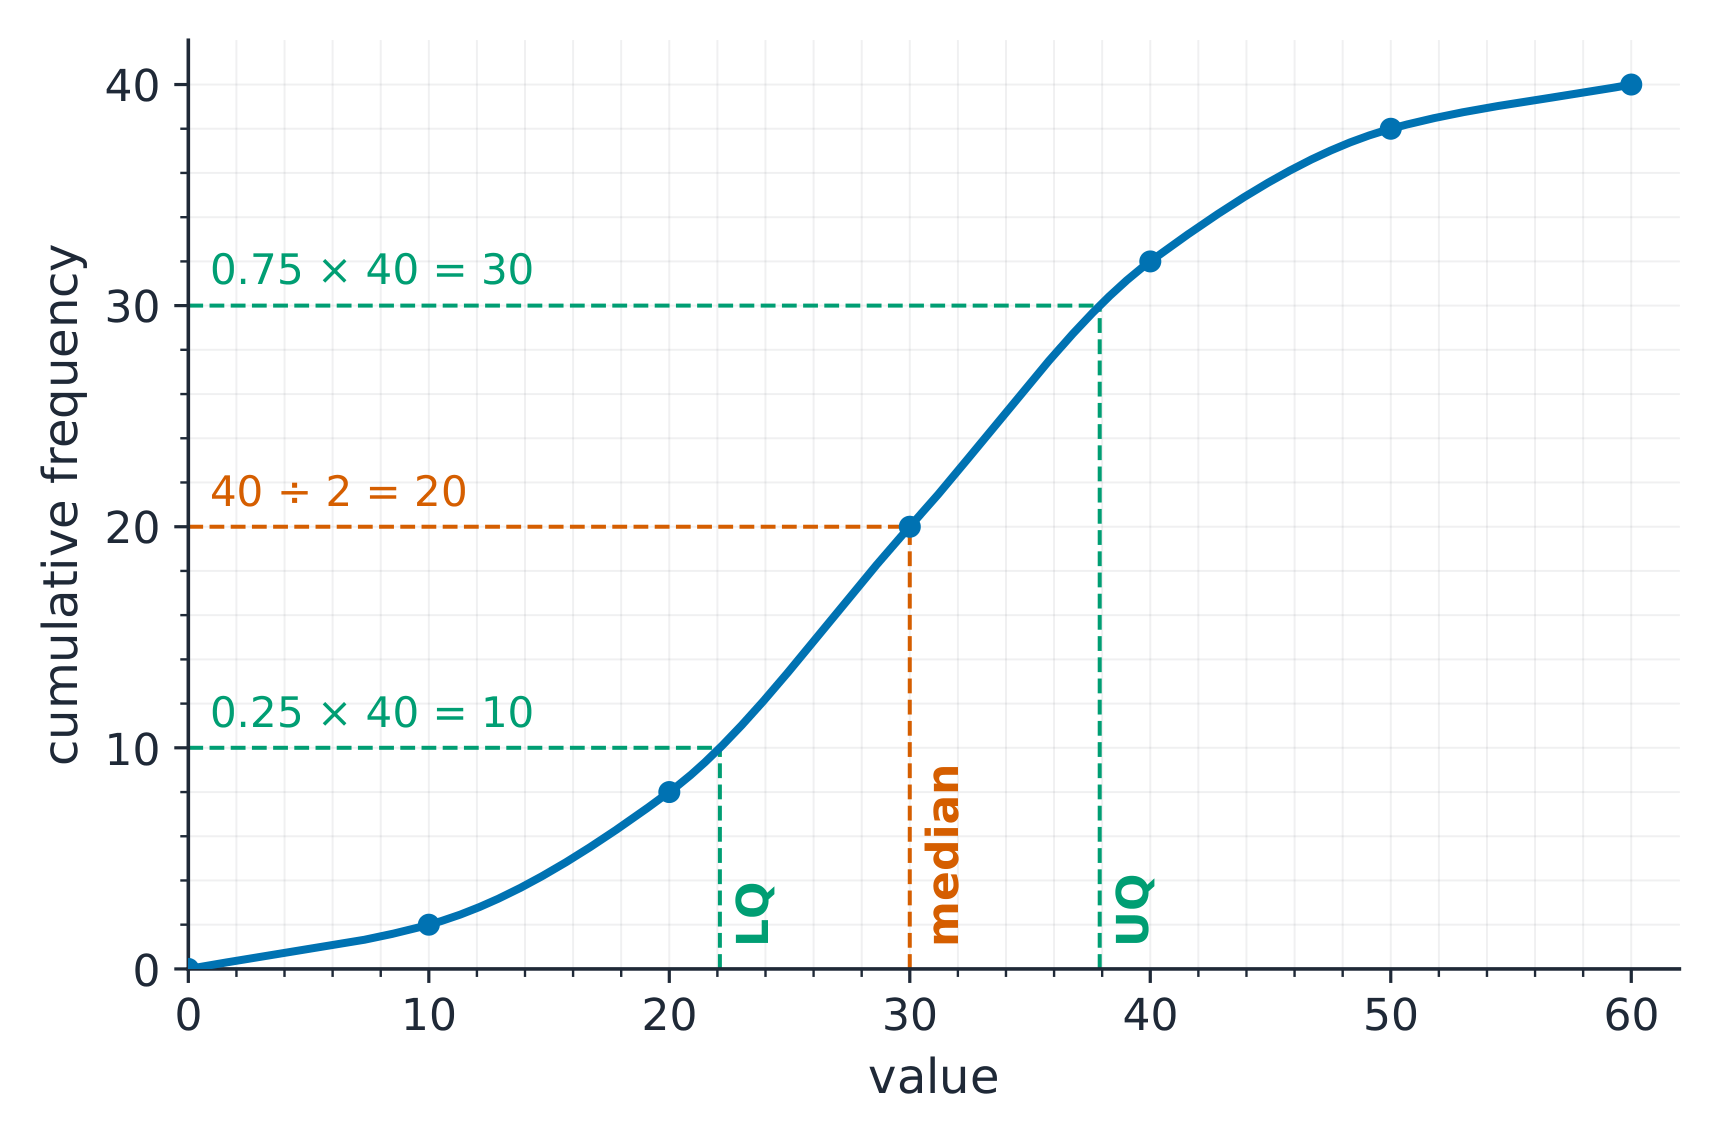
Read the median at half the total and the quartiles at one quarter and three quarters: go across to the curve, then down
A cumulative frequency curve has total 80. At what cumulative frequency do you read the median?
Сложность 2/5 · 140 монет + небольшой бонус за первое завершение сегодня
The median is at half the total: 80 ÷ 2 = 40.
Total cumulative frequency is 120. At what cumulative frequency do you read the upper quartile?
Сложность 2/5 · 140 монет + небольшой бонус за первое завершение сегодня
UQ is at 3/4 of the total: (3/4) × 120 = 90.
To read the median from a cumulative frequency curve, go ______ from the y-axis to the curve, then down to the x-axis.
Сложность 1/5 · 100 монет + небольшой бонус за первое завершение сегодня
Go across (horizontally) from the y-value to the curve, then down to read the x-value.
Worked example: 80 runners
| Time $t$ (min) | Frequency | Cumulative frequency |
|---|---|---|
| $20 < t \le 30$ | 8 | 8 |
| $30 < t \le 40$ | 22 | 30 |
| $40 < t \le 50$ | 30 | 60 |
| $50 < t \le 60$ | 14 | 74 |
| $60 < t \le 70$ | 6 | 80 |
- Plot $(20, 0), (30, 8), (40, 30), (50, 60), (60, 74), (70, 80)$ and join them with a smooth curve.
- Median: across at $80 \div 2 = 40$, then down: about $43$ min.
- Quartiles: LQ across at $20$ → about $35$ min; UQ across at $60$ → $50$ min. IQR $\approx 50 - 35 = 15$ min.
- "How many took more than 55 min?" Up from $55$ to the curve, across: about $67$. So $80 - 67 = 13$ runners.
- Answers read from a curve are estimates: a reading within a small tolerance gets the marks.
A cumulative frequency curve for 120 students shows a cumulative frequency of 90 at a mark of 60. How many students scored more than 60?
Сложность 2/5 · 140 монет + небольшой бонус за первое завершение сегодня
90 students scored 60 or less, so 120 − 90 = 30 scored more.
The total frequency is 200. At what cumulative frequency do you read across to find the upper quartile?
Сложность 2/5 · 140 монет + небольшой бонус за первое завершение сегодня
The upper quartile is at three quarters of the total: 3 × 200 ÷ 4 = 150.
There are 25 observations and cumulative frequency 13 at 20. How many are at least 20?
Сложность 2/5 · 140 монет + небольшой бонус за первое завершение сегодня
Subtract the count below 20: 25 − 13 = 12.
Include the start and read a count
- For classes $0\le t<10,10\le t<20,20\le t<30$ with frequencies 5,8,12, plot $(0,0),(10,5),(20,13),(30,25)$. The first point states that none are below the lower starting boundary.
- At 20, cumulative frequency is 13, so $25-13=12$ observations are at least 20. Quartile positions are $25/4=6.25$ and $3(25)/4=18.75$ on the cumulative axis; read values from the drawn curve.
You've got it
- cumulative frequency $=$ running total, plotted at each class's upper end
- read the median at half the total; quartiles at $\dfrac{1}{4}$ and $\dfrac{3}{4}$
- across to the curve, then straight down to the value
Write from the data: find the median position
- A cumulative frequency curve has total 60.
- The median is at half the total.
A cumulative frequency curve has total 60. At what cumulative frequency do you read the median?
Half of 60 is 30.
At what cumulative frequency is the median?
Сложность 1/5 · 100 монет + небольшой бонус за первое завершение сегодня
The median sits halfway up the curve. Other options — 40 (the lesson median position); 60 (the total).