Addressing income and wealth inequality
Introduit| English | Sens |
|---|---|
| Lorenz curve/ˈlɒrənts kɜːv/ | courbe de Lorenz |
| Gini coefficient/ˈdʒiːni ˌkəʊɪˈfɪʃənt/ | coefficient de Gini |
| inheritance/ɪnˈherɪtəns/ | héritage |
| progressive taxes/prəˈɡresɪv ˈtæksɪz/ | impôts progressifs |
| transfers/ˈtrænsfɜːz/ | transferts |
| redistribution/ˌriːˌdɪstrɪˈbjuːʃn/ | redistribution |
Same average, different lives
- South Africa's Gini coefficient for income is about 0.63, among the highest in the world; Norway's is about 0.27. In Norway most families live fairly close to the average income; in South Africa a small group is very rich while many households are poor. Even two countries with the same average income can feel very different.
- Economists measure how income is shared with the Lorenz curve 洛伦兹曲线 and the Gini coefficient 基尼系数, and governments use taxes, benefits and spending to change it.
Income and wealth
- Income is a flow of money over a period: wages, rent, interest, profit and benefits. Wealth is a stock of assets at a point in time: houses, land, shares, savings.
- Wealth is usually much more unequal than income, because assets are passed on through inheritance 继承 and earn further income (rent, interest, dividends).
Match each item to income or wealth.
Difficulté 2/5 · 140 pièces + un petit bonus lors de la première réussite aujourd'hui
Income is a flow; wealth is a stock.
The Lorenz curve and Gini coefficient
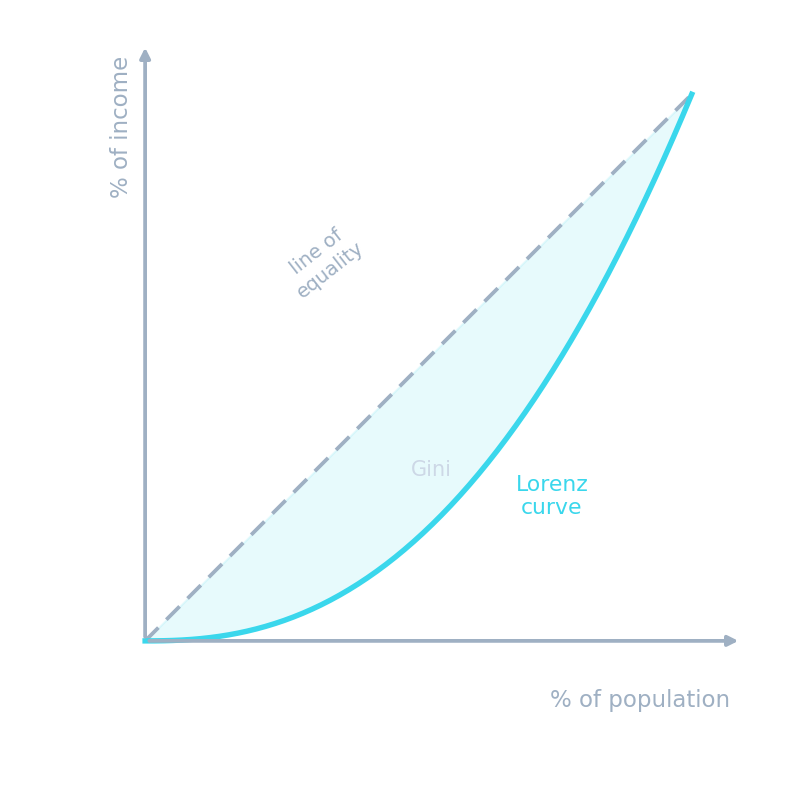
- The Lorenz curve plots the cumulative share of income against the cumulative share of households, from poorest to richest. The 45° line shows perfect equality; the further the curve sags below it, the more unequal the distribution.
- Gini coefficient = area between the line of equality and the Lorenz curve ÷ the whole area under the line of equality. It runs from 0 (perfect equality) to 1 (one household has everything).
Inequality policy route
Follow how policy can change disposable income and opportunity.
Which Gini coefficient shows the most unequal distribution?
Difficulté 1/5 · 100 pièces + un petit bonus lors de la première réussite aujourd'hui
Higher values mean more inequality.
Two households earn 20 and 80, so total income is 100. What percentage of income does the poorer household receive?
Difficulté 2/5 · 140 pièces + un petit bonus lors de la première réussite aujourd'hui
20 ÷ 100 × 100 = 20%, though it is half the households.
Causes of inequality
- Differences in skills and education (and so wages), unemployment, unequal ownership and inheritance of wealth, discrimination, and differences between regions.
- Some global changes also widen gaps: new technology raises the pay of highly skilled workers more than others.
Which can cause income inequality?
Difficulté 2/5 · 140 pièces + un petit bonus lors de la première réussite aujourd'hui
A progressive tax reduces inequality.
Policies to reduce inequality
| Policy | How it works | Possible drawback |
|---|---|---|
| Progressive taxes 累进税 | higher earners pay a larger share of their income | may reduce incentives to work or invest; tax avoidance |
| Benefits and transfers 转移支付 | cash to low-income, unemployed or older people | cost; can create a poverty trap if benefits stop sharply as earnings rise |
| Minimum wage | raises the pay of the lowest-paid workers | may cut jobs if set too high |
| Free or subsidised education and health | raises the future earning power of the poor | slow to work; costly |
| Wealth and inheritance taxes | reduce the build-up of wealth across generations | hard to value assets; the rich may move assets abroad |
- Redistribution 再分配 involves a trade-off between equity and efficiency: heavy taxes and benefits can reduce incentives, so the design and size of the policy matter.
If benefits are withdrawn sharply as earnings rise, low-paid workers may gain little from working more.
Difficulté 1/5 · 100 pièces + un petit bonus lors de la première réussite aujourd'hui
This is the poverty trap.
Worked exam answer
Country A has a Gini coefficient of 0.25 and Country B has 0.55. In A, the poorest 20% receive 9% of income; in B, 3%. Assess whether B should raise income tax on high earners to reduce inequality. [12]
For: a more progressive tax takes more from high incomes; if the revenue funds benefits or education for the poorest, the Lorenz curve moves towards the line of equality and the Gini falls. B's poorest fifth receive only a third of the share in A, so the need is large.
Against: higher top rates may reduce work, investment and enterprise, and encourage avoidance or emigration of skilled workers, so revenue may rise less than expected. Taxes alone do not raise the earning power of the poor.
Judgement: a moderate rise is likely to help if the revenue is spent on education, health and targeted benefits; very high rates could reduce growth, so combining tax with policies that raise skills is more effective.
- Why it scores: uses the data, explains the mechanism to the Gini, evaluates incentives and revenue (AO3), and makes a conditional judgement.
A higher Gini means more inequality, not less. 0 is perfect equality; 1 is complete inequality.
Income is a flow; wealth is a stock and is usually more unequal. The Lorenz curve shows income shares; the Gini coefficient runs from 0 (equal) to 1 (unequal). Causes include skills, unemployment, inheritance and discrimination. Policies include progressive taxes, transfers, minimum wages, education and wealth taxes, with an equity-efficiency trade-off.
Essay practice. Assess whether free university education is the best way to reduce income inequality in the long run. [12]
Long-run vs short-run policies.