Collecting and showing data · Recopilar y mostrar datos
| English | Español |
|---|---|
| tally table/ˈtælɪ ˈteɪbl/ | tabla de conteo |
| two-way table/tuː weɪ ˈteɪbl/ | tabla de contingencia |
| correlation/ˌkɒrɪˈleɪʃn/ | correlación |
| causation/kɔːˈseɪʃn/ | causalidad |
| qualitative/ˈkwɒlɪteɪtɪv/ | cualitativa |
| quantitative/ˈkwɒntɪteɪtɪv/ | cuantitativos |
| discrete/dɪˈskriːt/ | discreta |
| continuous/kənˈtɪnjuːəs/ | continuos |
"Statistics" — the word that means both data and lies
- "There are three kinds of lies: lies, damned lies, and statistics." — often attributed to Mark Twain.
- Good statistics tells the truth about data. Bad statistics misleads. The skill is telling them apart.
Data handling cycle · Ciclo de gestión de datos
Follow a statistical question from collection to display. · Seguir una pregunta estadística desde la recopilación hasta la presentación.
Tally tables 计数表 and two-way tables 双向表
- A tally table records each value with a mark ($\mid$), grouping them in fives for easy counting.
- A two-way table sorts data by two features at once (e.g. boys/girls against walk/bus/car).
A two-way table of 60 students by gender and transport might show: 15 boys walk, 10 boys take the bus; 12 girls walk, 23 girls take the bus. Each cell is a count.

Data is collected from people, a sample drawn from a population
A two-way table sorts data by how many features at once? · Una tabla de doble entrada clasifica los datos según cuántas características a la vez?
A two-way table cross-tabulates two features (e.g. gender vs transport). · Una tabla de doble entrada cruzada dos características (ej. género vs. transporte).
A table where you make a mark for each value, then count, is a ______ table. · Una tabla donde haces una marca por cada valor, luego cuentas, es una tabla de ______.
A tally table records each value with a mark before counting. · Una tabla tally registra cada valor con una marca antes de contar.
Reading data honestly
- Only draw conclusions the data actually supports.
- Don't assume a trend that isn't shown, or causes that aren't proven.
- Correlation · Correlación 相关性 is not causation 因果: two things can rise together without one causing the other.
Check the axes. A graph with a truncated $y$-axis can make small differences look huge. Always check the scale before drawing conclusions.

A Galton board shows how data piles up into a distribution
You should only draw conclusions that the data really supports. · Solo debes sacar conclusiones que los datos realmente respalden.
Over-claiming beyond the data is a common exam error to avoid. · Exagerar más allá de lo que muestran los datos es un error común en exámenes que se debe evitar.
If two quantities both increase together, one must cause the other. · Si dos cantidades aumentan juntas, una debe causar la otra.
Correlation does not prove causation. Both could be influenced by a third factor. · La correlación no prueba causalidad. Ambas podrían estar influenciadas por un tercer factor.
Types of data
- Qualitative 定性 (categorical): colours, opinions, brands.
- Quantitative 定量 (numerical): height, age, score.
- Quantitative data is discrete · discreta 离散的 (counted: number of siblings) or continuous 连续的 (measured: height, time).
The number of siblings a student has is what type of data? · El número de hermanos que tiene un estudiante es qué tipo de dato?
Number of siblings is counted (not measured), so it is discrete quantitative. · El número de hermanos se cuenta (no se mide), por lo tanto es cuantitativo discreto.
Height is an example of ______ quantitative data. · La estatura es un ejemplo de datos cuantitativos ______.
Height is measured (not counted), so it is continuous. · La estatura se mide (no se cuenta), por lo tanto es continua.
Why data matters
- Governments use census data to plan schools and hospitals. Companies use sales data to decide what to stock. Medical researchers use trial data to approve new drugs.
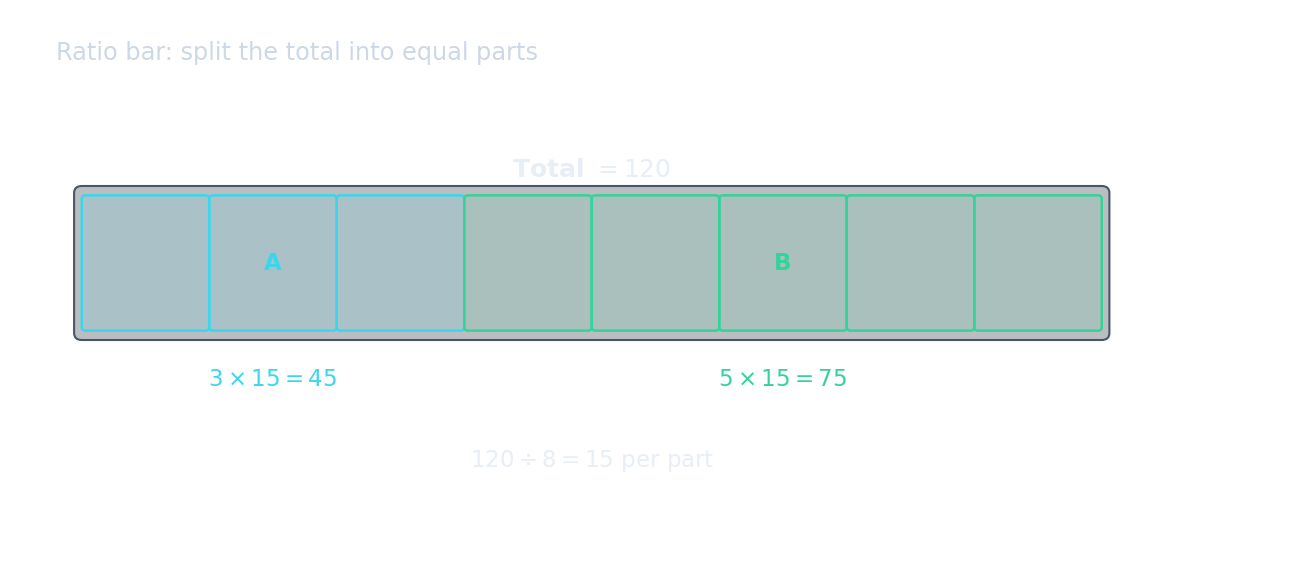
Two-way tables split data into parts, just like a bar model splits a total into proportional sections.
Complete and interpret a two-way table
- In a survey, junior bus 6, junior walk 4, senior bus 3 and senior walk 7 give row totals 10,10; column totals 9,11; grand total 20. Check totals in both directions.
- To compare two samples, use both an average and a spread. Scores A: $4,6,8$ and B: $5,6,7$ have equal means 6 but ranges 4 and 2. B is more consistent in this sample; three scores per group cannot establish a general population claim.
A survey has junior bus 6, junior walk 4, senior bus 3, senior walk 7. Find the total who walk. · Una encuesta tiene autobús junior 6, caminata junior 4, autobús senior 3, caminata senior 7. Encuentra el total que camina.
Add the walk column: 4 + 7 = 11. · Suma la columna de caminata: 4 + 7 = 11.
You've got it
- a tally table counts values with marks; a two-way table sorts by two features at once
- only conclude what the data actually shows — correlation $\neq$ causation
- data types: qualitative (categories) or quantitative (numbers: discrete or continuous)