A student determines the resistance of a resistor.
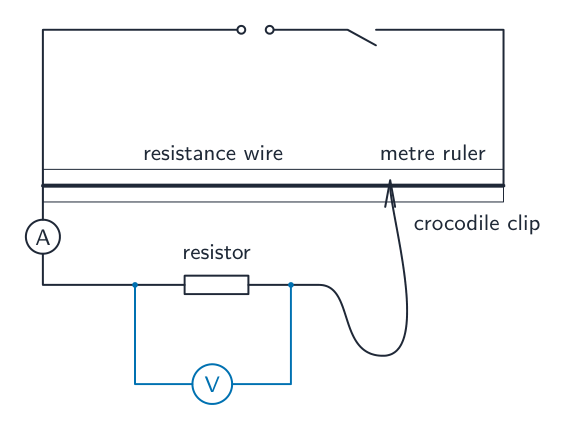
She uses the apparatus shown in Fig. 2.1.

On Fig. 2.1, draw a voltmeter connected to measure the potential difference (p.d.) across the resistor.[1]
The student connects the crocodile clip to the resistance wire at the $100.0\text{ cm}$ mark on the metre ruler and measures the potential difference $V_0$ across the resistor.
The voltmeter is shown in Fig. 2.2.

Read and record the value of $V_0$ shown on the voltmeter in Fig. 2.2.
$V_0 =$ V[1]
The student moves the crocodile clip to a length of resistance wire $l = 20.0\text{ cm}$.
Read and record in Table 2.1, the current for $l = 20.0\text{ cm}$, shown on the ammeter in Fig. 2.3.[1]

The student measures the current $I$ for lengths of resistance wire $l = 30.0\text{ cm}$, $l = 40.0\text{ cm}$, $l = 50.0\text{ cm}$ and $l = 60.0\text{ cm}$.
Her readings are shown in Table 2.1.
Table 2.1
| $l/\text{ cm}$ | $I/\text{ A}$ |
| 20.0 | |
| 30.0 | 0.22 |
| 40.0 | 0.30 |
| 50.0 | 0.39 |
| 60.0 | 0.42 |
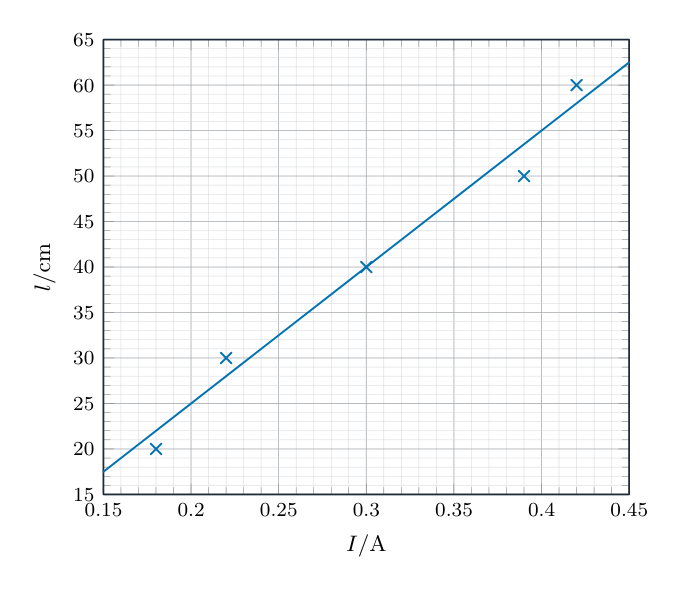
Plot a graph of $l/\text{cm}$ ($y$-axis) against $I/\text{A}$ ($x$-axis).
Draw a best-fit straight line. You do not need to start the axes at the origin (0,0).

[4]
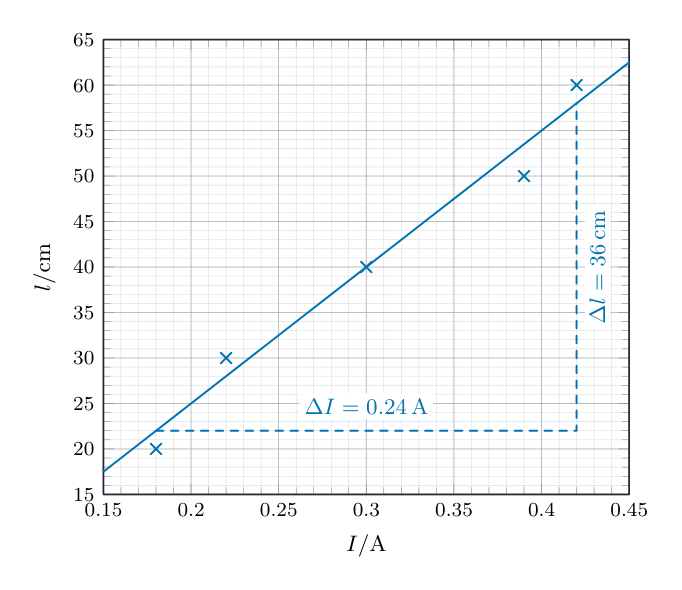
Determine the gradient $G$ of the graph. Show clearly on the graph how you obtained the necessary information.
$G =$ [1]
Calculate the resistance $R$ of the resistor.
Use your value of $V_0$ from (b) and the equation:
$R =$ $\Omega$[1]
Suggest one practical reason why other students might not obtain the same result as this student, even if they do the experiment carefully.
[1]
The resistance wire can become very hot during this type of experiment.
Suggest one change to the apparatus that prevents this.
[1]
[Total: 11]