A student investigates the cooling of water in a metal container.
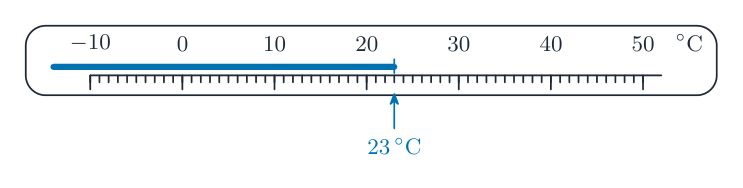
The student uses a thermometer to measure room temperature $\theta_\text{R}$. Room temperature is $23\,{}^\circ\text{C}$. Show clearly, on Fig. 2.1, the reading $\theta_\text{R}$.

[1]
Fig. 2.2 shows the apparatus set up for the investigation.

The student pours $200\text{ cm}^3$ of hot water into the metal container. She places the thermometer in the hot water in the container. She records the temperature at time $t = 0$. She immediately starts a stop-watch.
She records the temperature in Table 2.1 at $30\text{ s}$ intervals until she has seven sets of readings.
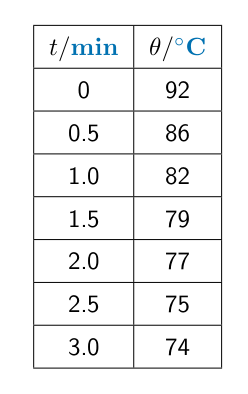
Complete the column headings in Table 2.1.[1]
Table 2.1
| $t /$ | $\theta /$ |
| 0 | 92 |
| 0.5 | 86 |
| 1.0 | 82 |
| 1.5 | 79 |
| 2.0 | 77 |
| 2.5 | 75 |
| 3.0 | 74 |
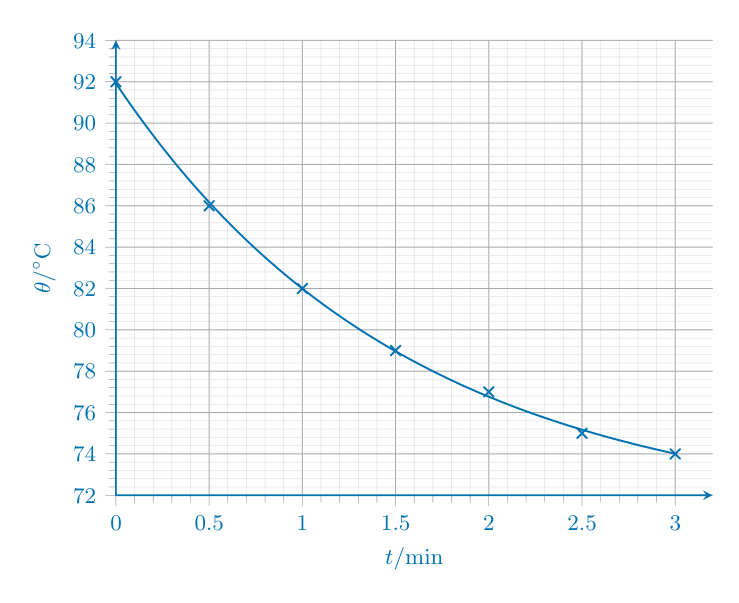
Plot a graph of temperature $\theta$ ($y$-axis) against time $t$ ($x$-axis). Label your axes appropriately.
You do not need to start the $y$-axis at 0. Draw the best-fit curve.

[4]
A student states that the average rate of cooling of the water decreases as the temperature of the water approaches room temperature.
State whether your graph line supports this suggestion. Explain your answer by reference to the shape of the graph line.
statement
explanation [2]
Explain why it is good practice to read the thermometer scale at right angles to the reading.[1]
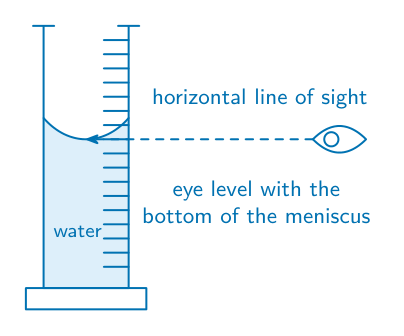
Draw a measuring cylinder containing water. On your diagram show the line of sight you use to obtain an accurate reading of the volume of water.[2]
[Total: 11]