Skip to content

IGCSE Physics · November 2024 · Paper 51 · Difficulty 3 · Standard

Question 2

2

In this experiment, you will investigate the cooling of water in a metal can.

Refer to Fig. 2.1.

(a)

Use the thermometer to measure room temperature $\theta_R$.

$\theta_R$ = [1]

(b)
(i)

Pour 200 cm$^3$ of hot water into the metal can. Place the thermometer in the hot water in the can.

Record in Table 2.1 the temperature $\theta$ of the hot water at time $t = 0$. Immediately start the stop-watch.

Continue recording the temperature in Table 2.1 at 30 s intervals until you have seven sets of readings.[2]

(ii)

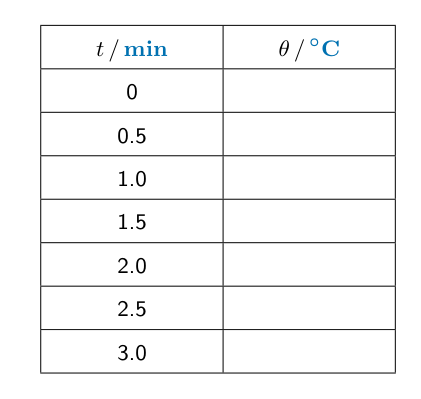
Complete the column headings in Table 2.1.

$t$/$\theta$/
0
0.5
1.0
1.5
2.0
2.5
3.0

[1]

(c)

Plot a graph of temperature $\theta$ (y-axis) against time $t$ (x-axis). Label your axes appropriately.

You do not need to start the y-axis at 0. Draw the best-fit curve.

[4]

(d)

A student states that the average rate of cooling of the water decreases as the temperature of the water approaches room temperature.

State whether your graph line supports this suggestion. Explain your answer by reference to the shape of the graph line.

statement

explanation

[2]

(e)

Explain why it is good practice to read the thermometer scale at right angles to the reading.

[1]

[Total: 11]
Show the mark scheme

These are the official mark-scheme rows. Each point that matches your answer earns a mark.

Tap the mark scheme to open it full size.

Show a worked answer

How to reach each mark, step by step. Try the question yourself first.

2(a)

  • Read the thermometer in the room and include the unit. For example, a room temperature could be $\theta_R = \mathbf{22}\,^\circ\mathrm{C}$; use your own reading.

2(b)(i)

  • Record your measured temperatures at $0$, $0.5$, $1.0$, $1.5$, $2.0$, $2.5$ and $3.0\,\mathrm{min}$. The temperatures should decrease as the water cools.
  • Record every temperature to at least the nearest $1\,^\circ\mathrm{C}$, using the same precision for each reading.

2(b)(ii)

  • The headings are $t/\mathrm{min}$ and $\theta/\mathrm{{}^{\circ}C}$: time in minutes, temperature in degrees Celsius.
Worked answer drawing

2(c)

  • Label the horizontal axis $t/\mathrm{min}$ and the vertical axis $\theta/{}^\circ\mathrm{C}$. Choose scales that use much of the grid.
  • Plot each of your seven readings within half a small square. Draw a thin, continuous best-fit curve through the trend of the points.

2(d)

  • If your curve gets less steep as the water cools, answer yes: the smaller gradient shows that the cooling rate decreases.
  • If your curve does not get less steep, answer no and describe the shape you actually obtained.

2(e)

  • Reading at right angles avoids parallax error.
Original question

Log in or create account

IGCSE, A-Level & AP